
Abstract
This study investigates the demographic, clinical characteristics, virological profiles, and immunological responses of patients with viral encephalitis (VE) compared with a control group. The VE group displayed a wide range of neurological symptoms. Virological analysis revealed the predominance of Herpesviridae family viruses. Immune responses in cerebrospinal fluid (CSF) from patients with VE were examined, highlighting an immunological shift toward T helper 1 (Th1) cells dominance, altered T helper 17 cells/regulatory T cells (Th17/Tregs) balance, and high interleukin-6 expression. These findings provide insights into the complex immunological landscape of VE, highlighting the role of specific cytokines and T cell subsets in its pathogenesis and potentially guiding targeted therapeutic strategies.
Introduction
Encephalitis, which is the inflammation of the brain parenchyma leading to neurological alterations, is a common and serious disease (Venkatesan, 2015). Clinical manifestations vary depending on the cause of infections; mild clinical symptoms, such as fever, headache, nausea, vomiting, confusion, and altered mental status or more severe symptoms, seizures, weakness, hallucinations, and coma (Bohmwald et al., 2021a). Moreover, viral encephalitis (VE) is categorized into two types: primary and secondary. Primary encephalitis involves the direct invasion of the brain by the virus, which can affect various regions of the brain tissue. In contrast, secondary encephalitis is the result of the virus spreading from its initial infection site, such as the lungs or kidneys, to the central nervous system (CNS) (Jayaraman et al., 2018). The identification of primary VE typically involves analyzing cerebrospinal fluid (CSF), where findings may include lymphocytic pleocytosis, normal glucose levels, and elevated protein levels (Ekmekci et al., 2013; Rozenberg, 2013). Currently, diagnosing encephalitis employs multiple techniques, including electroencephalography, brain magnetic resonance imaging, and the observation of various symptoms such as hemiparesis, pyramidal signs, and seizures (Ellul and Solomon, 2018; Jayaraman et al., 2018; Rozenberg, 2013). Nevertheless, identifying the specific pathogens responsible for the disease requires further tests such as polymerase chain reaction (PCR) assays and reverse transcription PCR (RT-PCR) assays, among others (Ekmekci et al., 2013), to facilitate timely and effective antiviral treatment. An accurate and swift diagnosis of encephalitis significantly improves the outlook and management of the complications caused by this neurological condition.
Several viral agents have been described to induce encephalitis, such as arboviruses, rhabdoviruses, enteroviruses, herpesviruses (HHVs), morbilliviruses, retroviruses, orthomyxoviruses, orthopneumovirus, and coronaviruses (Bohmwald et al., 2018; Chen et al., 2020; Rozenberg, 2013; Salimi et al., 2016; Stahl and Mailles, 2019). Neurotropic viruses can reach the brain and promote a local infection in this tissue. However, most of these viruses have a primary infection site outside the CNS, where the systemic immune response is elicited (Bohmwald et al., 2021a). These viruses can reach the CNS through different pathways, such as the infection of peripheral nerves or its dissemination through the bloodstream (viremia). Once in the brain parenchyma, resident cells, such as neurons, astrocytes, and microglia, can be infected, promoting the secretion of pro-inflammatory molecules and the subsequent immune cell infiltration leading to brain damage; one of the most common ways for viruses to reach the brain is by disrupting the blood–brain barrier (BBB) (Bohmwald et al., 2021b; Hou et al., 2016; Spindler and Hsu, 2012; Thomsen et al., 2021).
Patients with VE exhibit specific characteristics, such as abnormal concentrations of lymphocytes in the CSF (Bohmwald et al., 2021a). Most data related to VE suggest a general peripheral T cell infiltration from the peripheral blood into the CNS, mediated by cytokines and chemokines secreted by activated astrocytes, neurons, and microglial cells (Bohmwald et al., 2021b). When activated, CD4 T cells will differentiate into T helper 1 (Th1), T helper 2 (Th2), T helper 17 cells (Th17), follicular T helper (Tfh), or regulatory T cell (Treg) subsets depending on the cytokine milieu. These polarizations are essential for orchestrating a wide range of adaptive immune responses (Spinner and Lazarevic, 2021). Each differentiated subset is distinguished by a particular transcription factor and specific cytokines profile: Th1 cells, expresses T-box expressed in T cells (T-bet) and secretes, tumor necrosis factor alpha (TNF-α), interferon gamma (IFN-γ), and interleukin (IL)-2; Th2 cells express GATA binding protein 3 (GATA-3) and produce IL-4, IL-5, and IL-13; Th17 cells, under the control of Th17-inducing orphan nuclear receptor ROR gamma t (RoR-ɤt), are characterized by the IL-17 production and Treg cells, which are characterized by IL-10 production, are often referred to Forkhead Box Protein 3 (FOXP3)+ cells (Spinner and Lazarevic, 2021). Th1 cells are essential for the host’s defense toward intracellular pathogens, mainly viruses, whereas Th2 cells are considered critical for the helminthic parasites’ elimination (Aleebrahim-Dehkordi et al., 2022); Th17 cells are essential in mediating inflammation in autoimmune disorders and Treg cells are considered effective cells in the immune system that play an important role in infectious diseases, by leading an immune regulation and suppression to maintain immune homeostasis and prevent inappropriate immune responses (Dong, 2021; Lanteri et al., 2009).
To date, the data regarding changes in the expanded immune profile of Th1, Th2, Th17, and Treg cells in VE are limited, with most available studies focusing only on the plasma levels of the corresponding cytokines (Soltani Khaboushan et al., 2022). Moreover, most studies reporting cytokine levels of CSFs used commercial magnetic bead-based or ELISA assays (Takano et al., 2019; Xu et al., 2022). Hence, in the present study, we aimed to evaluate by quantitative RT-PCR (qRT-PCR) pro- and anti-inflammatory cytokine profiles associated with T cell subsets in the CSF of patients with VE. To reach this aim, all patients’ CSFs were screened for SARS-CoV2, enteroviruses, HHVs, measles, West Nile virus (WNV), and Toscana virus (ToSV) by specific and appropriate molecular techniques. This VE group was compared with a control group looking for associations between viral etiology and cytokine profile.
Patients and Methods
Clinical samples and study subjects
Fifteen patients were enrolled at the National Institute of Neurology Mongi Ben Hamida (Tunis, Tunisia) between 2021 and 2022. These patients with febrile seizures and encephalitis were diagnosed based on the clinical course and clinical-radiological findings. At the time of the lumbar puncture (LP), no patient was under treatment, and no immune deficiency was reported. The control group consisted of 22 subjects with a persistent headache that required an LP excluding any inflammatory or infectious etiology.
The CSF from each patient was collected within 48 h of hospitalization, then centrifuged at 1,400 rpm/min for 10 min; supernatants were stored at −80°C and cell pellets were preserved in 350 µL of reagent lysis tissue mixed with 1% mercaptoethanol for subsequent extraction. The study was approved by the ethics committee of the Pasteur Institute of Tunis. All included patients underwent LP with signed informed consent.
Nucleic acid extraction
Simultaneous extraction of DNA and RNA from 200 µL of CSF was performed using the QIAamp DSP Virus Spin Kit (QIAGEN) following the manufacturer’s instructions. The extracted nucleic acid was used as a template for different PCR amplifications.
Virological investigation
Detection of HHVs by multiplex PCR
The multiplex PCR protocol inspired from the original one (Tanaka et al., 2009) was designed to identify the genomic DNA of five HHVs in a single tube: herpes simplex virus type 1 (HSV-1), herpes simplex virus type 2 (HSV-2), varicella zoster virus (VZV), Epstein-Barr virus (EBV) and cytomegalovirus (CMV). The sequences of the primer sets used in the multiplex PCR assay are listed in Table 1.
Primers Used for the Multiplex Polymerase Chain Reaction Assay Detecting Herpesviruses
Tanaka et al. (2009).
Sequences and positions of the primers were accessible to GenBank accession numbers. The product sizes were predicted from the positions that should be amplified.
CMV, cytomegalovirus; EBV, Epstein-Barr virus; HSV-1, herpes simplex virus type 1; HSV-2, herpes simplex virus type 2; VZV, varicella zoster virus.
The PCR was performed with 5 μL of DNA and 45 μL of the PCR mixture containing 29.5 μL of sterile distilled water, 3 μL of the 10× buffer, 2 μL of deoxynucleotide triphosphates (dNTPs10 mM), 3 μL of MgCl2 (25 mM), 10 pmol of each primer (HSV1-2/EBV/VZV/CMV), and 0.5 μL of recombinant Taq polymerase enzyme at 5 U (MP BiomedicalsTM Taq CORE Kit 25). The assay was carried out using the GenAmp PCR system 9700 (Applied Biosystems). After an initial denaturation and polymerase activation step at 95°C for 10 min, the reactions were prolonged, according to a touchdown protocol comprising 10 cycles of denaturation at 95°C for 30 s, annealing at 70–61°C for 30 s with 1°C decrease in temperature per cycle, and extension at 72°C for 1 min. Subsequently, the reaction mixture was subjected to 35 cycles of 95°C for 30 s, 60°C for 30 s, and 72°C for 30 s. After the last cycle, an additional extension step was performed at 72°C for 5 min. The amplified products were electrophoresed in 3% agarose gel, stained with the RedGel, and photographed under ultraviolet light. For an easy identification of viruses, different amplifier product sizes were obtained: 292 bp for HSV-1/2, 161 pb for VZV, 229 bp for EBV, and 131 bp for CMV.
Detection of SARS-CoV2
The Laboratory of Clinical Virology of the Pasteur Institute of Tunis is one of the National Reference laboratories for the molecular and serological diagnosis of SARS-CoV2 since March 2020 and one of the National Reference laboratories for the SARS-CoV2 variant emerging surveillance in Tunisia. All CSF samples were investigated for SARS-CoV2. Detection of infection was performed in the context of COVID-19 diagnostic efforts, by specific real-time RT-PCR according to the World Health Organization (WHO)-approved protocol published by Corman et al. and detecting specific sequences in the envelope (E), nucleocapsid protein (N), and RNA-dependent RNA polymerase (RdRp) genes (Corman et al., 2020).
Detection of enteroviruses
All samples were screened by RT-PCR in the 5′-non-coding genome region. The enterovirus RT-PCR used three enterovirus-specific primers—EV-RT (nt 771–760, 5′-CACTCGGATGGCC-3′); EV-NC2 (nt 724–707, 5′-ATTGTCACCATAAGCAGCCA-3′); and EV-NC1 (nt 572–590, 5′-CTCCGGCCCCTGAATGCG-3′)—and an in-house protocol as previously described (Rezig et al., 2004). A specific 156 bp amplification product was visualized by agarose gel electrophoresis and RedGel staining.
Detection of measles
Designed as a WHO Reference Laboratory for measles and part of Global Measles and Rubella Laboratory Network (GMRLN), our laboratory of Clinical Virology at Pasteur Institute of Tunis detects measles by a real-time RT-PCR method utilized at the CDC (Atlanta, GA, USA) that amplifies a 75-nucleotide region of the measles nucleocapsid N gene. Kits containing primers, probes, and positive control RNA were provided by CDC to GMRLN laboratories. The kits include two positive controls consisting of synthetic measles RNA of known copy number. The acceptable range of CT values for both controls is provided in the kit instructions. The protocol for the CDC measles real-time RT-PCR is available in the Manual for the Laboratory-based Surveillance of measles, rubella, and congenital rubella syndrome (Hummel et al., 2006).
Detection of arboviruses (WNV and ToSV)
CSF samples were tested for the presence of both WNV and ToSV RNA by RT-PCR. The extracted RNA was used in an RT-PCR test targeting the highly conserved 3′-non-coding region of the WNV genome, and a fragment of the nucleocapsid N gene of ToSV, as previously described (Gdoura et al., 2022; Pérez-Ruiz et al., 2007).
Immunological investigation
cDNA synthesis
After extraction from CSF, RNA purity and concentration were determined using the NanoDrop Spectrophotometer (Thermo Fisher). The first-strand cDNA was synthesized for each RNA sample using a High-Capacity cDNA Reverse Transcription Kit (Applied Biosystems by Thermo Fisher) following the manufacturer’s instructions. This reaction was performed with the following parameters: 1 µg RNA for 25°C for 10 min, 37°C for 2 h, and 85°C for 5 min.
Quantitative real-time PCR
Quantitative real-time PCR was carried out on the Applied Biosystems ABI PRISM 7500 Real-Time PCR System using the SYBR Green qPCR Kit (Applied Biosystems) and continuous fluorescence monitoring. All samples were analyzed in duplicate, and mRNA levels were quantitatively assessed relative to the endogenous reference, glyceraldehyde-3-phosphate dehydrogenase (GAPDH). The expressions of cytokines (IFN-γ, IL-1β, TNF-α, IL-17, IL-6, IL-4, and IL-10) and transcription factors (T-bet, GATA-3, RoR-ɤt, and FOXP3) in the CSF were evaluated, as previously described (Belghith et al., 2022).
Statistical analysis
Quantitative data were expressed as the mean ± standard deviation. Statistical significance was determined by GraphPad Prism version 8 (GraphPad), using a non-parametric Mann–Whitney test to compare between groups. Spearman’s rank correlation analysis was used to assess correlation. All p-values <0.05 were considered statistically significant.
Results
The demographic and clinical characteristics of the subjects included in the study are summarized in Table 2 and have been analyzed according to their clinical symptoms. Fifteen patients with VE etiology and 22 controls were included in this study.
Demographic and Clinical Characteristics of Subjects Included in the Study
CRP, C-reactive protein; CSF, cerebrospinal fluid.
The group of VE cases included 4 male and 11 female adult patients. The average age is 43.57 years, ranging from a minimum of 21 to a maximum of 71. Six of the patients showed behavioral changes and one showed decreased levels of consciousness. Six patients developed de novo epilepsy. Eight patients suffered from headaches, three from photophobia. Seven patients had temporal and spatial disorientation, four presented memory disorders, two patients showed ataxia. These signs of neurological dysfunction presented acutely (24–72 h) along with systemic manifestations such as inflammatory syndrome biological with an average C-reactive protein equal to 27.89. All patients recover without sequelae. The control group included 4 males and 18 females.
Virological investigation
Among the 15 patients with encephalitis, 1 (6.67%, 1/15) was infected with measles, 4 (26.67%, 4/15) with VZV, 8 (53.33%, 8/15) with CMV, 1 (6.67%, 1/15) with enterovirus, and 1 had co-infections with HHVs EBV/VZV. Neither WNV nor ToSV was detected in this group.
Immunological investigation
We analyzed the mRNA transcripts of a set of cytokines and their associated transcription factors that define the primary T helper and T regulatory responses in CSF samples collected from individuals with encephalitis and controls. We first compared the expression of four cytokines (IFN-γ, IL-4, IL-17, and IL-10) and transcription factors related to Th1, Th2, Th17, and Treg in CSF of patients with VE, and a group of controls (Fig. 1). We found no significant difference in the mean of the studied transcription factors (T-bet, GATA-3, RoR-ɤt, and FOXP3) and T cell subsets of cytokines (IFN-γ, IL-4, and IL-10) between the two groups. Interestingly, we noticed a significantly decreased level of IL-17 mRNA in CSF of patients with VE, as compared with the controls (p < 0.0009) (Fig. 1).
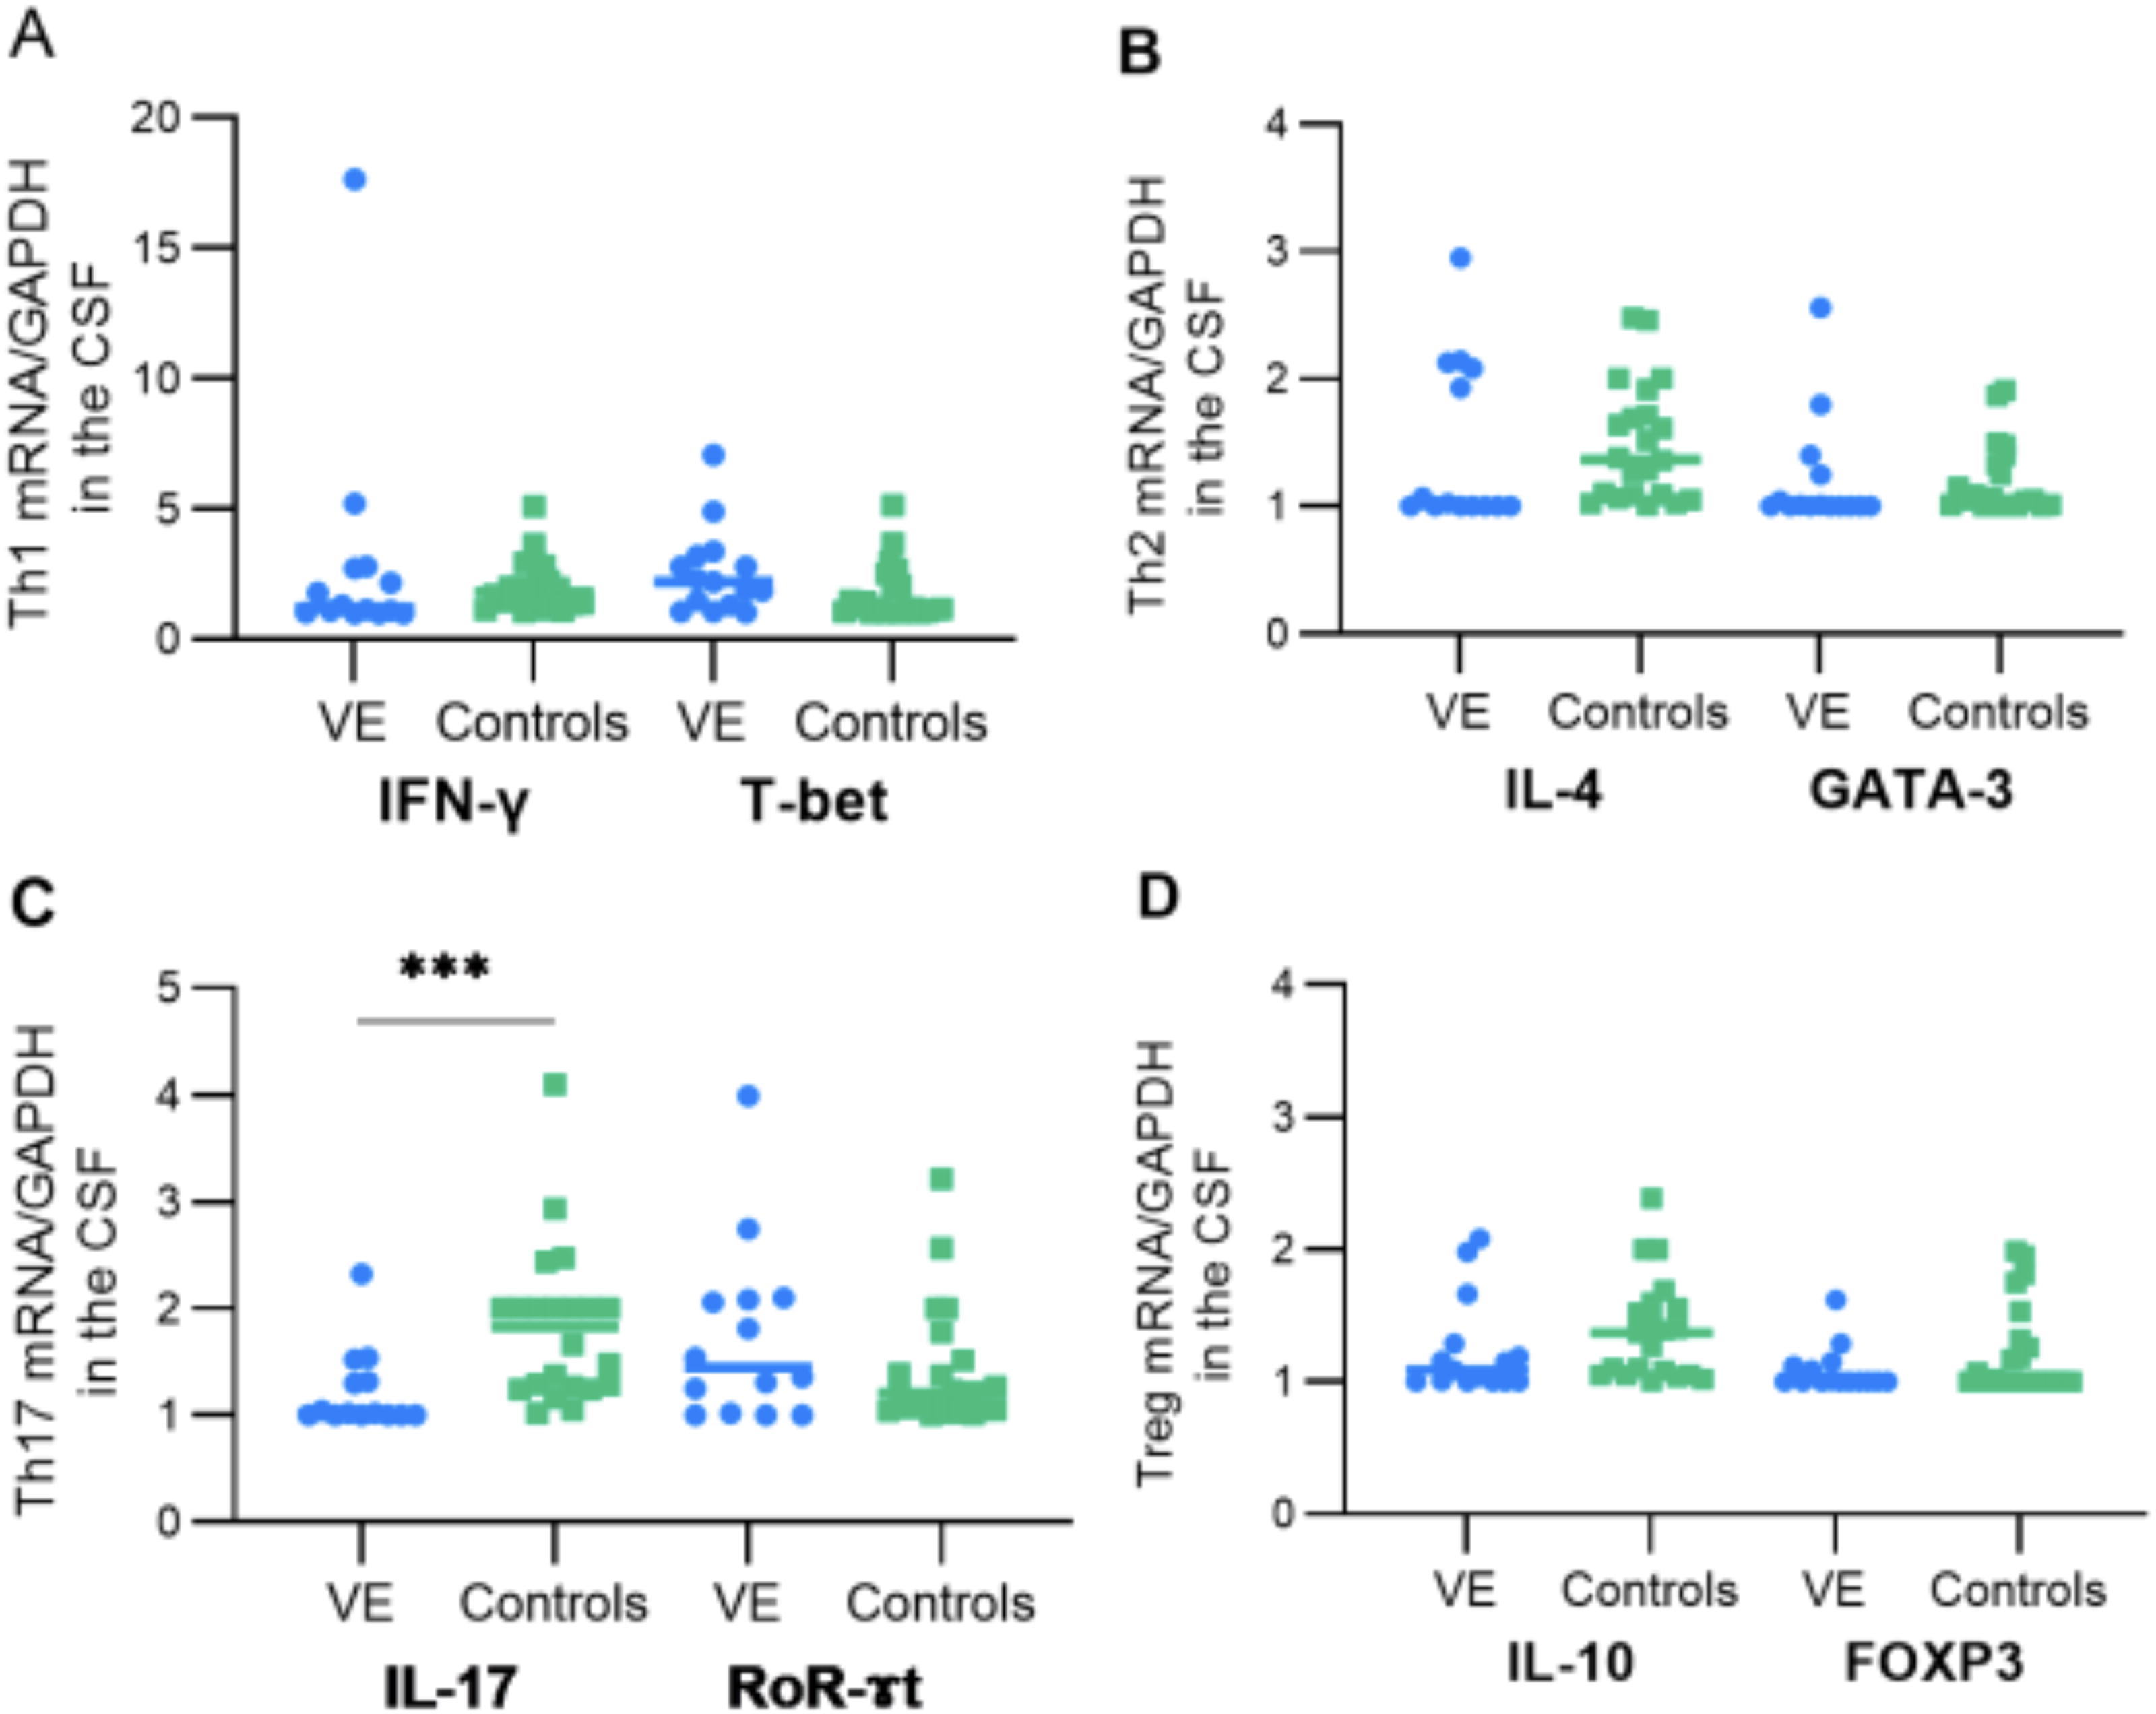
Comparative analysis of T helper 1 (Th1), T helper 2 (Th2), Th17, and T regulatory (Treg) cells. There were no significant differences in Th1, Th2, and Treg cells and their transcription factor expression levels observed between the two studied groups. However, a significant difference was observed in the expression of interleukin-17 (IL-17), with a considerable decrease seen in viral encephalitis (VE) patients compared with the control group. The statistical significance of this difference is indicated by the p-value provided. The asterisk symbol (***) denotes a statistical significance level of p ≤ 0.001.
In order to investigate the balance between effector and regulatory T cells in the CSF compartment, we suggested studying the ratio of transcription factors of Th1/Th2 cells and regulatory T cells in the CSF. We, therefore, proposed to study the ratio of cytokines and transcription factors of Th1/Th2 and Th17/Treg cells.
Th1/Th2 balance
We first evaluated the Th1/Th2 balance by investigating IFN-γ and IL-4 and their respective transcription factors T-bet and GATA-3, by qRT-PCR. IFN-γ/IL-4 and T-bet/GATA-3 ratios were calculated.
Based on the calculation of T-bet/GATA-3 ratio, our results showed that relative to GATA-3 mRNA expression, T-bet mRNA expression levels were significantly higher in CSF samples of patients with VE compared with the control group (p = 0.0112) (Fig. 2). Furthermore, IFN-γ expression revealed a tendency toward higher expression in CSF samples from patients with VE in comparison to controls. However, these findings did not reach statistical significance (p = 0.9453) (Fig. 2). Our results indicate a tendency to elevated IFN-γ/IL-4 ratio (p = 0.9453) in the group of patients with VE as compared with the control group. Also, a significantly elevated T-bet/GATA-3 (p = 0.0112) ratio was noted among patients with VE comparing with controls, which indicates the promotion of Th1 cell differentiation in VE cases.
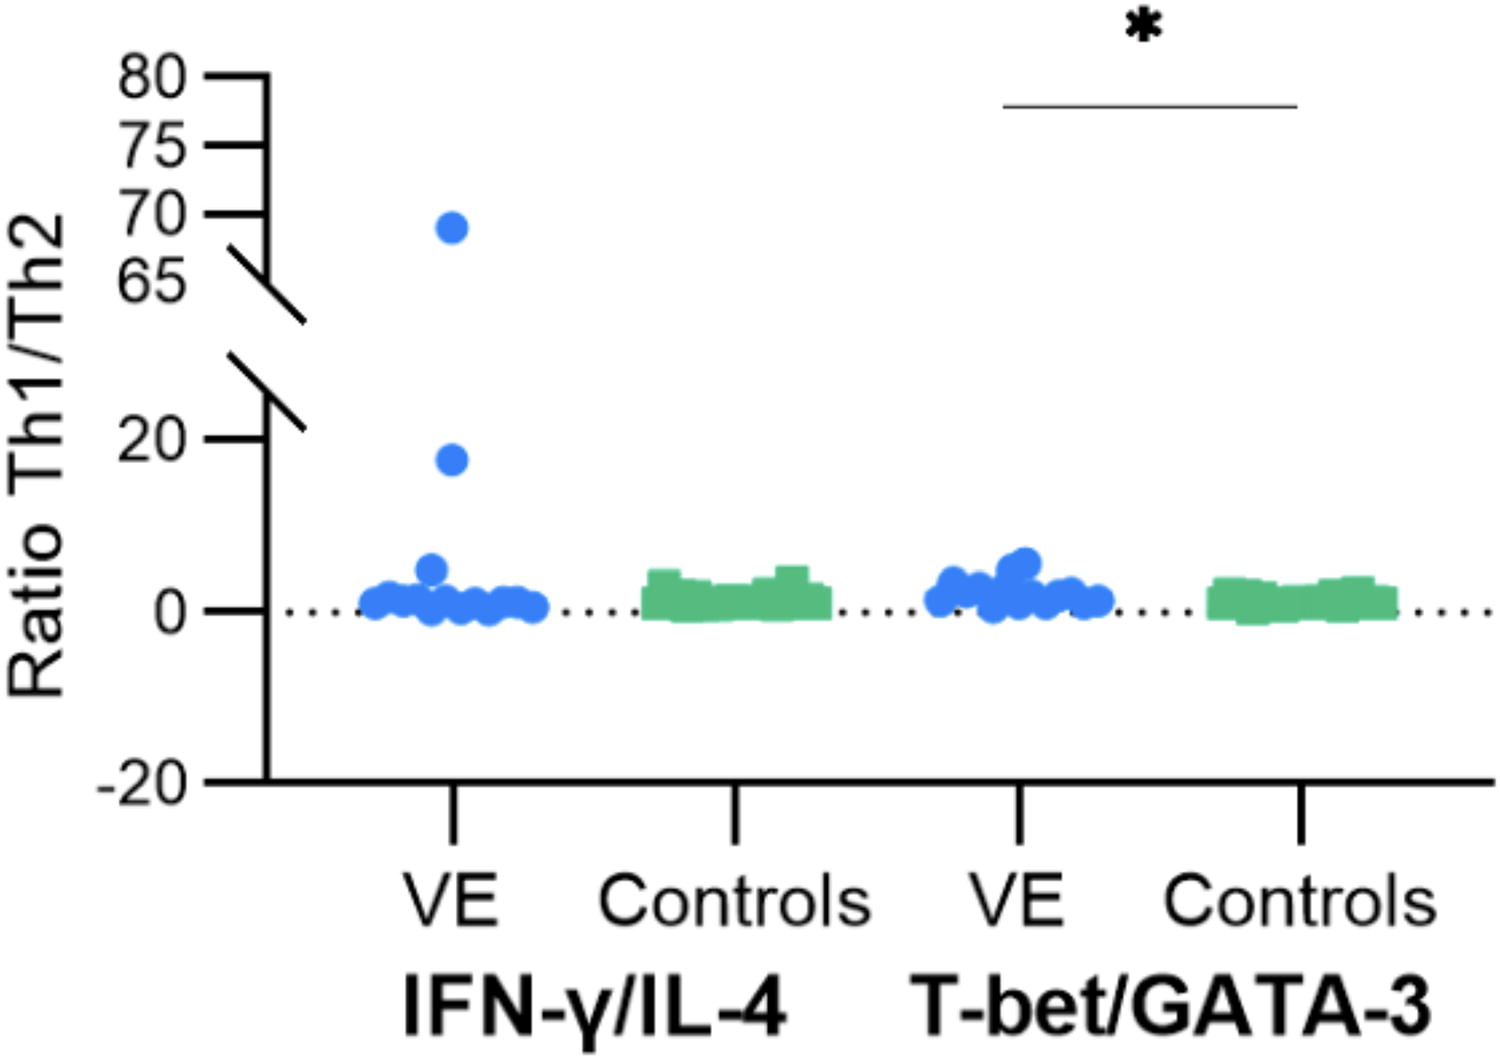
Boxplots representation of cerebrospinal fluid (CSF) Th1/Th2 ratios. Representative boxplots of interferon gamma/interleukin-4 (INF-γ/IL-4) and T-box expressed in T cells/GATA binding protein 3 (T-bet/GATA-3) ratios in the CSF of patients with VE and controls. A non-significant increase of INF-γ/IL-4 ratio in patients with VE compared with the control group was noted; in contrast, when examining T-bet/GATA 3 ratio, a substantial increase was detected in all patients with VE when compared with the controls (p = 0.0102). Statistical significance between the two groups was assessed using the Wilcoxon–Mann–Whitney test. The asterisk symbol (*) denotes a statistical significance level of p < 0.05.
Th17/Treg balance
We therefore investigated the immunosuppressive response in patient’s CSF, by assessing the presence of regulatory T cells through the expression of FOXP3 transcription factor and IL-10 cytokine. We also examined the mRNA expression of Th17 including RoR-ɤt and IL-17 using qRT-PCR. Subsequently, we calculated ROR-ɤt/FOXP3 and IL-17/IL-10 ratios. Our findings revealed an imbalance in the ratio of Th17 to Treg cells, characterized by reduced levels of Treg cells in patients with VE. These results were associated with a non-significantly elevated level of IL-10, when compared with controls (Fig. 3).

Boxplots representation of CSF Th17/Treg ratios. Representative boxplots of ROR gamma t/Forkhead Box Protein 3 (RoR-ɤt/FOXP3) and IL-17/interleukin-10 (IL-10) ratios in the CSF of patients with VE and controls. A significant increase of RoR-ɤt/FOXP3 and IL-17/IL-10 ratios in patients with VE compared with the control group was noted (p = 0.0409 for RoR-ɤt/FOXP3 ratio). Statistical significance between the two groups was assessed using the Wilcoxon–Mann–Whitney test. The asterisk symbol (*) denotes a statistical significance level of p < 0.05.
Pro-inflammatory response
To better determine the pro-inflammatory response in the CSFs of the patients, we evaluated the mRNA expression of IL-6, IL-1β, and TNF-α. Interestingly, concerning IL-6 expression, we found a significant increase in all studied patients with VE compared with the control group (p = 0.0011) (Fig. 4A). We also noticed a statistically no significant decrease of the TNF-α and IL-1β expression in patients with VE as compared with controls (Fig. 4B and C).
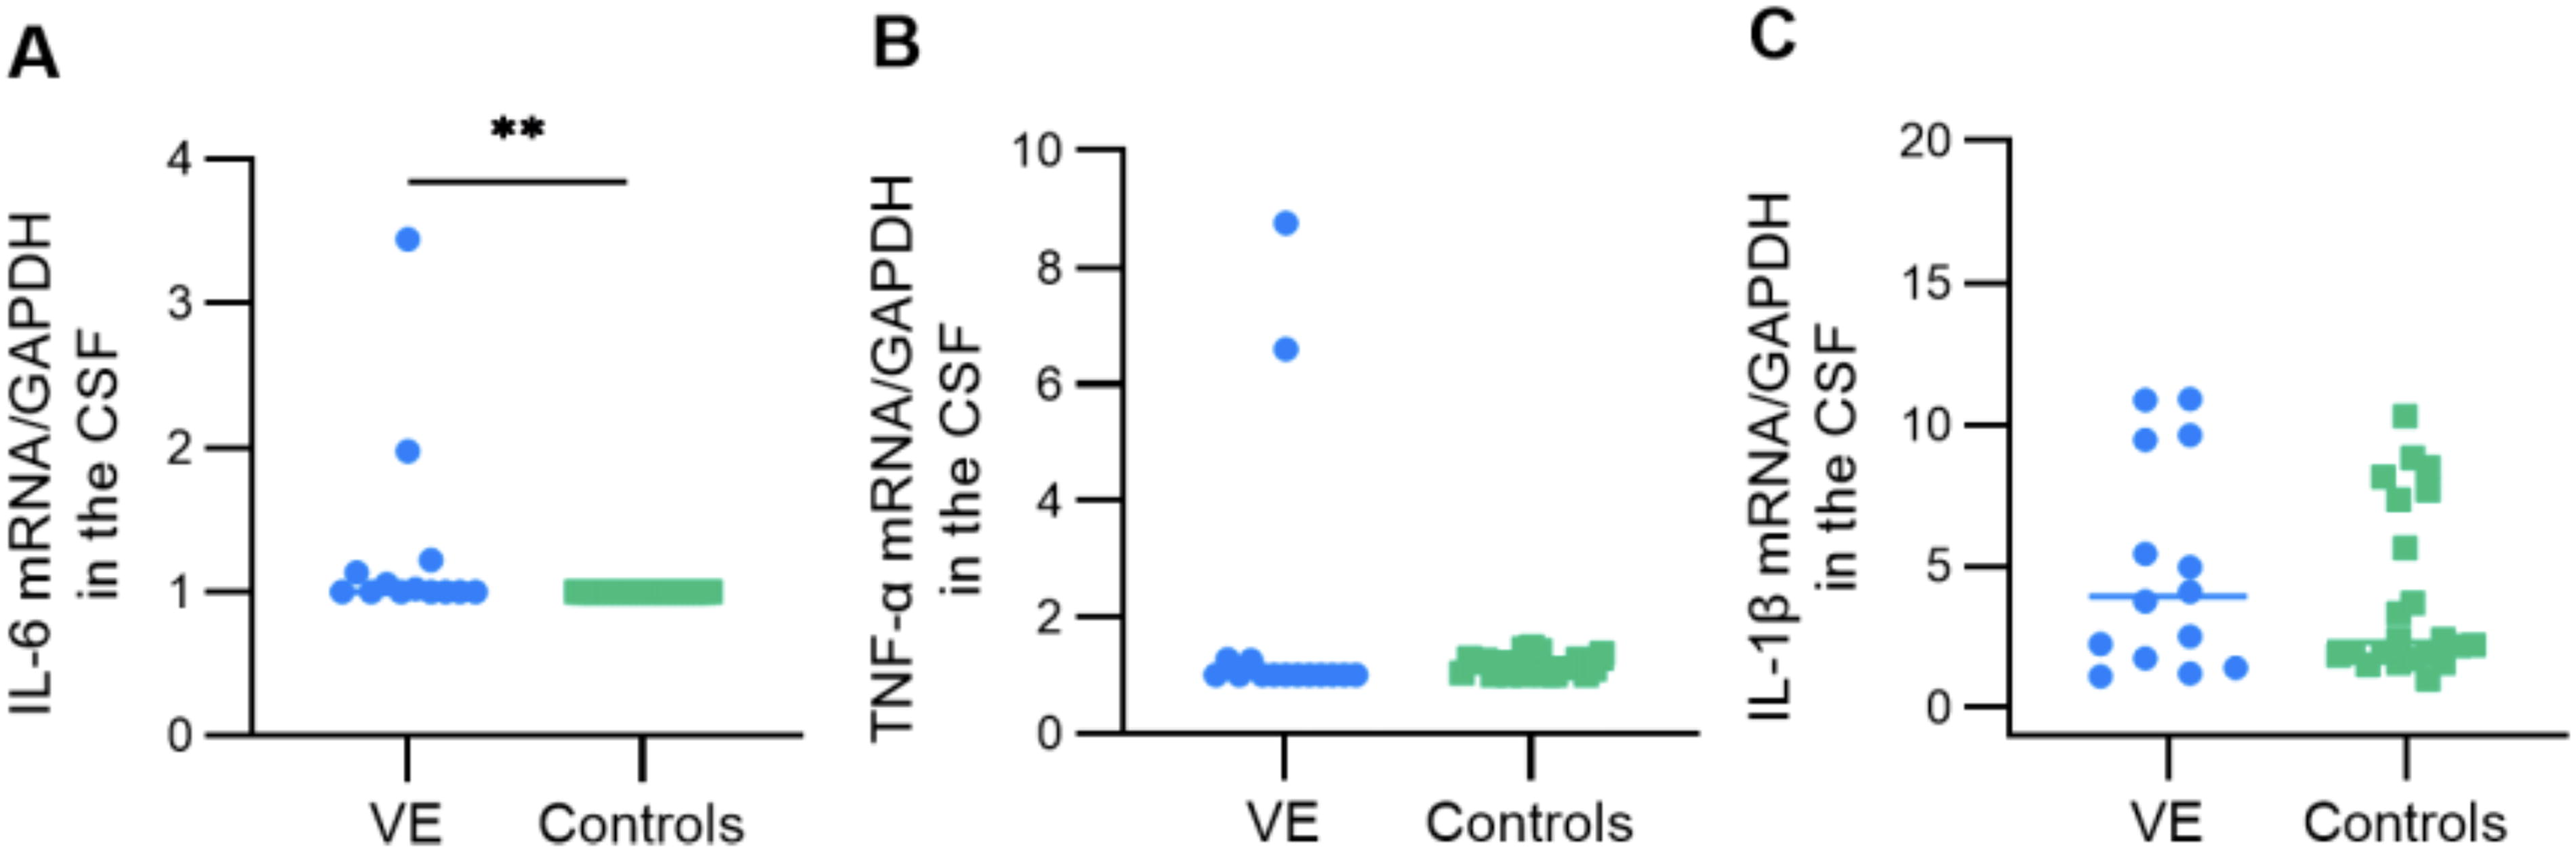
Comparative analysis of pro-inflammatory cytokines interleukin-1 beta (IL-1β), interleukin-6 (IL-6), and tumor necrosis factor alpha (TNF-α). There were no significant differences in the IL-1β expression levels observed between the two studied groups. In contrast, when examining the expression of IL-6, a substantial increase was detected in all patients with VE when compared with the controls group (p = 0.0011). Moreover, for TNF-α expression, a statistically not significant reduction was observed in patients with VE (p = 0.0667). Statistical significance between the two groups was assessed using the Wilcoxon–Mann–Whitney test. The asterisk symbol (**) denotes a statistical significance level of p < 0.01.
Discussion
VE often leads to hospitalizations due to a combination of direct viral damage and the resulting inflammatory response (Bohmwald et al., 2021a). Clinical manifestations including fever, altered consciousness, seizures, and focal neurological deficits are influenced by the intensity and location of the ongoing inflammation (Bohmwald et al., 2021b). Diagnosis is generally based on the examination of CSF obtained through LP (Ellul and Solomon, 2018), but the etiology remains unclear in more than 50% of cases despite extensive testing for infectious pathogens in CSF (Bloch et al., 2023).
In this study, the exploration of the Herpesviridae family revealed that it was the main cause of VE. Indeed, at least one member of the Herpesviridae family was detected in 13 out of 15 patients. In most reports, these viruses are frequently associated with VE in adults (Bloch et al., 2023). We also found one enterovirus case and one measles case. In the literature, these viruses are relevant etiologies described as responsible for encephalitis cases (Al-Qayoudhi et al., 2016; Kumar et al., 2012).
To date, data regarding changes in the expanded immune profile of Th1, Th2, Th17, and Treg cells in encephalitis are limited, with most available studies focusing on the plasma levels of the corresponding cytokines associated to these T cell subsets (Butcher and Zhu, 2021). In this current study, our objective was to assess the expression patterns of both pro-and anti-inflammatory cytokines, as well as the transcription factors related to T cell subsets, specifically in the CSF of patients diagnosed with VE. We then compared these profiles with those of control subjects.
The expression of four cytokines (IFN-γ, IL-4, IL-17, and IL-10) and transcription factors related to Th1, Th2, Th17, and Treg in CSF of patients with VE, and a group of controls showed no significant difference in the mean of the studied transcription factors (T-bet, GATA-3, RoR-ɤt, and FOXP3) and cytokines between the two groups. However, we noticed a significantly decreased level of IL-17 mRNA, in the CSF of patients with VE, as compared with the controls. In a previous study, levels of several cytokines associated with innate and early pro-inflammatory immune responses, in the CSF of WNV-infected persons were measured and IL-17 was not detected (Zidovec-Lepej et al., 2021). Currently, it is known that the transcription of genes encoding IL-17 and the related cytokine, IL-17F, in naïve CD4+ T cells has been shown to be initiated by RoR-ɤt factor (Ivanov et al., 2006); thus, the concentration of IL-17 increases together with RoR-ɤt. Notably, our results showed a not-significantly elevated concentration of RoR-ɤt, associated with decreased level of IL-17 mRNA, in the CSF of patients with VE. This profile of expression RoR-ɤt–IL-17 could be a typical consequence in VE.
In order to provide insights into the balance and interactions between different immune T cell subsets, we have opted to study the Th1/Th2 and Th17/Treg ratios giving a more comprehensive picture of the regulating immune responses associated with encephalitis.
For the Th1/Th2 ratio, we analyzed T-bet/GATA-3, as T-bet and GATA-3 were identified as master regulators for the differentiation of Th1 and Th2 cells, respectively. Our results showed that the ratio T-bet/GATA-3 was higher for patients with VE suggesting a higher expression of T-bet mRNA in CSF samples of patients with VE compared with controls. The transcription factor T-bet was initially identified as a lineage marker for Th1 cells due to its ability to drive Th1 differentiation and suppress the polarization of other CD4+ T cell subsets, such as Th2 or Th17 cells (Hwang et al., 2005; Oestreich and Weinmann, 2012; Szabo et al., 2000). This polarization of T cells was described in inflammatory diseases with a viral etiology other than encephalitis such as acute lung injury infection due to SARS-CoV2 (Aleebrahim-Dehkordi et al., 2022). In patients with severe Japanese encephalitis, there is a predominance of the Th1 immune response, as indicated by an IFN-γ/IL-4 ratio reaching up to 1 in the cerebrospinal fluid (CSF) (Pujhari et al., 2013). While most research has concentrated on the role of T-bet in Th1 differentiation, generally characterizing T-bet as a suppressor of Tfh differentiation (Lazarevic et al., 2013; Nakayamada et al., 2011; Oestreich et al., 2011), the precise contribution of T-bet to the Tfh cell response during acute viral infection remains unclear.
Studies on the Th2 (IL-4, IL-5) response in the CSF of patients with VE are scarce. It is admitted that, within the CNS, IL-4 exhibits neuro-protective effects by inhibiting microglial production of superoxide, TNF-α expression, and astrocyte proliferation (Lanciotti et al., 1999). IL-4 is also able to induce the expression of neuronal growth factor in astrocytes (Koeberle et al., 2004). However, a study on IL-4 levels in the serum in a cohort of healthy adults with a history of asymptomatic or severe WNV infection showed significantly decreased concentrations of serum IL-4 as well as altered gene expression patterns (Qian et al., 2014). The results of this study suggest a possible contribution of IL-4, in natural resistance to WNV infection (Zidovec-Lepej et al., 2021).
For Th17/Treg ratio, we analyzed FOXP3/RoR-ɤt, as FOXP3 acts as a transcription factor, which controls the Treg cell development and function (Delacher et al., 2014) and as the master Th17 lineage transcription factor is RoR-ɤt (Ivanov et al., 2006). Our results showed an unbalanced ratio between Th17 and Treg cells, with a deviation to lower levels of Treg cells in patients with VE. Tregs are known to maintain host immune homeostasis by actively suppressing pathological and physiological immune responses after homing to inflamed tissues in response to the presence of foreign antigens (Lanteri et al., 2009). The behavior of natural Tregs in humans has been described primarily for tuberculosis and chronic viral infections (Grant et al., 2023). People chronically infected with hepatitis C virus (HCV) have more circulating Tregs in peripheral blood than uninfected people or those who resolve HCV infection (Sugimoto et al., 2003). Interestingly, a decrease in Treg number or function was found in the peripheral blood of symptomatic patients infected with human immunodeficiency virus (Kinter et al., 2004) or HCV (Boyer et al., 2004). Tregs have also been studied in non-persistent viral infections: in dengue virus (DENV) infection, Treg expansion was lower in children with severe dengue disease (Fares-Gusmao et al., 2019). Also, a putative correlation between Treg levels and the outcome of infectious disease has been reported in WNV encephalitis because patients with symptomatic infection have lower Treg frequencies throughout the infection compared with asymptomatic patients (Lanteri et al., 2009). Thus, the downregulation of an effective response by Tregs may be critical to reduce injury and disease pathology in the CNS.
CD4+ T cells support host defense against many viral pathogens; these cells play a central role in orchestrating and regulating the immune response against viral infections, by producing a variety of cytokines that modulate the immune response. IL-10 plays a pivotal role in modulating and inhibiting the production of pro-inflammatory cytokines as part of this cytokine network, thereby mitigating the harm inflicted by inflammatory cytokines during the recovery stages of infections (Ouyang et al., 2011; Rojas et al., 2017). Our analysis showed an increase of IL-10 mRNA expression in CSF samples of the VE group compared with controls. In symptomatic WNV-infected patients, the analysis showed that IL-10 responses represent an important part of early immune response to WNV in viremic pre-symptomatic/asymptomatic patients (Zidovec-Lepej et al., 2021). In addition, Fares-Gusmao et al. identified a common immune signature for asymptomatic infections with DENV, WNV, and Zikavirus that included increased levels of IL-10 (Fares-Gusmao et al., 2019). High IL-10 levels act as a regulatory trigger that initiates the resolution of the acute phase of infection in which antiviral T cell populations contract (Puntambekar et al., 2011). In fact, to eliminate viruses, the immune system typically uses cytotoxic CD8+ T lymphocytes (CTL), whose functions are armed by Th1 cells. CD8+ T cells are critical in antiviral immunity since they can kill infected cells through the recognition of viral peptides presented on major histocompatibility complex (MHC) I molecules. Th1 cells also recognize viral peptides presented by antigen-presenting cells (APC) on MHC-II molecules. Th1 cells provide the “license to kill” to the virus-specific CD8+ T cells to differentiate into effector CTLs using professional APC as intermediates (Ma and Clark, 2009; Van Gool et al., 2009). This central mechanism of antiviral immunity can be modulated by IL-10 at different levels. Th1 cells can produce IL-10 in response to lymphocytic choriomeningitis virus (Richter, 2013), or influenza (Hufford et al., 2015) infections among others. IL-10 production in Th1 cells is driven by TCR engagement but is not directly regulated by T-bet (Enquist, 2023; Kubo and Motomura, 2012). IL-27 (a pro-inflammatory cytokine belonging to the IL-12 family) is a potent inducer of IL-10 in Th cells (Awasthi et al., 2007; Batten et al., 2008; Fitzgerald, 2007). Type I IFN can also induce IL-10 expression in CD4+ T cells (Levings et al., 2001; Zhang et al., 2011). Effector CD8+ T cells are also able to produce IL-10 during the acute phase of influenza virus (Jiang et al., 2016; Sun et al., 2009), respiratory syncytial virus (Loebbermann et al. 2012), coronavirus infection (Trandem et al., 2011), paramyxovirus simian virus 5 (Palmer et al., 2010), or vaccinia (Cush et al., 2016) infections.
In our study, we also tried to explore the connection between the pathomechanism of the CNS injury in the course of VE and pro-inflammatory cytokines such as IL-6, IL-1β, and TNF-α, which also play a crucial role in the development of a defense mechanism against viral infection (Noack and Kolopp-Sarda, 2018). Current investigations indicate that, in the CNS, IL-6 can contribute to an increase in the permeability of the BBB and stimulate the proliferation of glial cells. Although high concentrations of IL-6 can have a neurotoxic impact, there are also data that suggest this cytokine may have a neuroprotective role (Noack and Kolopp-Sarda, 2018). Our results showed a significantly high IL-6 mRNA expression in CSF samples of the VE group compared with controls. Several other studies have shown higher levels of IL-6 in patients with VE compared with controls and associated with disease activity (Aurelius et al., 1994; Bociąga-Jasik et al., 2011; Noack and Kolopp-Sarda, 2018). In most neuroinvasive arboviral infections such as tick-borne encephalitis (TBE), ToSV, and WNV neuroinvasive diseases, an exceptionally high synthesis of IL-6 was observed (Vilibic-cavlek et al., 2020; Zidovec-Lepej et al., 2021). Also, the enterovirus type 71 brain stem encephalitis significantly increased the release of IL-6 from dendritic cells (Wang et al., 2012). Patients with COVID-19 with neurological manifestations have shown contradictory results, although most studies reported increased levels of IL-6 in serum and CSF (Coomes and Haghbayan, 2020).
Concerning TNF-α, our results showed a significant decrease in TNF-α mRNA expression in CSF samples of patients with VE. TNF-α is known to play a key role in promoting inflammation. In the case of VE, a decrease in TNF-α expression may indicate that the body is trying to limit excessive inflammation to prevent damage to the brain and other complications. In a previous study, on patients with TBE, cytokine expression patterns in the CSF and serum showed decreased/undetectable concentrations of TNF-α in the CSF (Günther et al., 2011). Also, the absence of TNF-α in the CSF of WNV-infected persons was reported (Zidovec-Lepej et al., 2021). High levels of TNF were generally associated with complicated and fatal encephalitis (Wang et al., 2012). Regarding IL-1β, we observed comparable levels of mRNA expression in studied patients with VE and controls. The IL-1β activates microglia and vascular endothelial cells to recruit peripheral leukocytes and produce neuroinflammation. Like TNF-α, high levels of IL-1β were found only in CSF of patients with complicated and fatal encephalitis. Hosoi et al. found in rats, increased levels of IL-1β mRNA in the brain in the absence of an increase in circulating IL-1β (Hosoi et al., 2000). These findings support the notion that IL-1β is probably synthesized in the CNS in response to severe encephalitis (Wang et al., 2012). Previous studies showed that IL-10 inhibits production of several pro-inflammatory mediators, including IL-1β and TNF-α (Moore et al., 2001). This may provide an explanation of decreased TNF-α level and underexpression of IL-1β, in CSF of patients with VE.
Conclusion
In conclusion, our study investigated the clinical and immunological aspects of patients with VE and compared them with a control group. Our virological analysis revealed that several viral agents were responsible for encephalitis cases, with measles, VZV, EBV, CMV, and enterovirus being the most prominent. Some cases also exhibited co-infections with HHVs. Notably, WNV and ToSV were not detected in our patient group. We performed an extensive examination of immune responses within CSF samples obtained from both VE and controls. Our results indicate that the immune response in patients with VE is marked by a shift toward Th1 predominance and a change in the equilibrium between regulatory and pro-inflammatory components. This intricate interplay among these factors is likely to play a role in the development of VE. Further investigation is warranted to uncover the exact mechanisms responsible for these immunological shifts and their potential clinical implications for individuals with VE.
Footnotes
Authors’ Contributions
Conceptualization: D.R. and M.B. Methodology: K.T., R.B.L., H.T., and Z.M. Software: K.T. and R.B.L. Validation: Z.S., S.B.S., M.B., H.T., and D.R. Formal analysis: K.T., R.B.L., O.M., and Z.S. Resources: H.T. Data curation: K.T., Z.S., R.B.L., M.B., and D.R. Writing—original draft preparation: K.T., D.R., and M.B. Writing—review and editing: O.M., Z.S., S.B.S., and H.T. Supervision: H.T. Project administration: D.R. Funding acquisition: H.T. All authors have read and agreed to the published version of the article.
Data Availability
The data presented in this study are available on request from the corresponding author. The data are not publicly available due to ethical, legal, and privacy issues.
Ethics Approval
The study was conducted in accordance with the Declaration of Helsinki and received approval from the Biomedical Ethics Committee (CIBM) of the Institute Pasteur of Tunis (IPT/PCI-LR11IPT02/22/2013).
Author Disclosure Statement
The authors declare no competing interests.
Funding Information
This work was supported by the