
Abstract
The aim of this study was to compare immune response against SARS-CoV-2 in Balb/C mice when self-amplifying RNA lipid nanoparticles (saRNA LNPs) combined with TLR4 Agonist (monophosphoryl lipid A) as the adjuvant 1 and TLR9 Agonist (CpG) as the adjuvant 2. Here, we found that the size distribution of saRNA LNPs was 88–165 nm with a mean size of 126 nm. Although TLR4 Agonist (adjuvant 1) and TLR9 Agonist (adjuvant 2) could increase the expression of S-protein in HEK293T/17 cells compared with saRNA LNPs alone, the combination of both adjuvants had a significant effect on the expression of the S-protein. Moreover, combining TLR4 Agonist (adjuvant 1) and TLR9 Agonist (adjuvant 2) increased the antibody (IgG and IgA) titer. Here, the ratio of IgG2a/IgG1 showed a T helper type 1-biased response. ELISpot test showed the mice vaccinated with saRNA LNPs+ TLR4 Agonist and TLR9 Agonist had significantly more secreting cells compared with other vaccinated mice (p < 0.05). The secretion of interleukin (IL)-4 and interferons (IFN)-γ by re-stimulated splenocytes confirmed these data. Significant differences in concentration of IL-4 and IFN-γ produced by activated splenocytes were also seen in the mice vaccinated with saRNA LNPs+ TLR4 Agonist and microparticles compared with other groups (p < 0.05). The highest quantity of S-protein was detected in the blood, followed by the small intestine and spleen. The interesting thing was that no significant difference was seen between the amount of S-protein induced by different formulations and the type of adjuvant did not affect the biodistribution.
Introduction
SARS-CoV-2 is a single-stranded RNA virus with a circular shape (Fung and Liu, 2019; Stadler et al., 2003). This virus infects the human respiratory system by binding to a surface receptor called angiotensin-converting enzyme through the viral spike protein (S-protein) (Ashraf et al., 2021; Ingraham et al., 2020). Since S-protein is an important antigen, researchers have developed several candidate vaccines against SARS-CoV-2 (Bojkova et al., 2020; Wang et al., 2020). Despite the success of early candidate vaccines, some of them have low immunogenicity and require assistance to accelerate the vaccine application process, increasing efficacy and reducing antigen dose. Adjuvants reduce the dose of virus antigen and increase vaccine efficacy by accelerating, extending, amplifying, and delaying the immune response (Pashine et al., 2005). Adjuvants can activate the innate immune system and allow the innate immune system to respond more quickly, by stabilizing antigen-presenting cells (APCs), stimulating and activation of T helper type 1 (Th1) or T helper type 2 (Th2) (Exley et al., 2010; Mastelic et al., 2010). TLR4 is found on the surface of immune cells such as dendritic cells (DCs) and macrophages, as well as non-immune cells such as fibroblasts and epithelial cells. Activation of TLR4 triggers both MyD88- and TRIF-dependent pathways, ultimately leading to the activation of NF-kB and IRF3/7. This activation strongly enhances the Th1 immune response by inducing interleukin (IL)-12p70 (Netea et al., 2005). Monophosphoryl lipid A (MPLA) has been extensively studied in multiple clinical trials (Steinhagen et al., 2011). In combination with other adjuvants, MPLA shifts the typical Th2-biased response (Garçon et al., 2007). TLR9 is expressed in human B cells and plasmacytoid DCs, residing in the endo-lysosomal compartment (Blasius and Beutler, 2010). Its primary function is to recognize unmethylated CpG motifs. Upon activation, TLR9 stimulates APCs to produce pro-inflammatory and Th1 cytokines, such as IL-12 (Ballas et al., 1996). In preclinical and clinical research, three types of synthetic CpG oligonucleotides have been developed, including CpG A, CpG B, and CpG C. Clinical trials have incorporated CpG as an adjuvant in therapeutic vaccines. These vaccines have shown the ability to induce both humoral and cellular immune responses (Haining et al., 2008; Karbach et al., 2010; Valmori et al., 2007).
The aim of this study was to compare the immune response against SARS-CoV-2 in Balb/C mice when self-amplifying RNA lipid nanoparticles (saRNA LNPs) combined with TLR4 and/or TLR9 Agonist.
Materials and Methods
The synthesis of linear saRNA
This construct was synthesized, subcloned in pHT01, and confirmed by Biomatik, Canada. Based on our previous study (Keikha et al., 2021), this construct was synthesized, subcloned in pHT01, and confirmed by Biomatik, Canada. The full-length sequence of saRNA construct and its schematic, which is used in this study, is found in Supplementary Data S1. Here, we incorporated the Norovirus GI sequence in the mRNA design, because this virus can induce both humoral and mucosal immunity (Costantini et al., 2020). The nature of the saRNA, which was used in this study, was RNA. Here, the saRNA construct had six parts, including: (1) 5′ UTR (GenBank accession number: NC_001959.2), (2) Norovirus GI (GenBank accession number: NC_001959.2), (3) noncoding segment (GenBank accession number: NC_001959.2), (4) Spike protein of SARS-COV-2 (GenBank accession number: MZ571142.1), (5) 3′ UTR (GenBank accession number: NC_001959.2), and (6) polyA tail.
In the next step, the saRNA construct was cloned by a common PCR with 1 ng of synthesized plasmid, 1 pM primers (forward: 5′-GTGAATGATGATGGCGTC-3′ and reverse: 5′-TTTTTAACATCAAATTAA-3′), and 2 U of Mastermix PFU DNA Polymerase (Thermo Fisher Scientific) under the following conditions: 35 cycles of 95°C for 30 s, 55°C for 30 s, and 72°C for 30 s. Next, 10 ng purified DNA was first reacted with MEGAScript™ (Ambion, UK) for 1 h at 37°C, and then it was reacted with ScriptCap™ (CellScript, WI, USA) for 1 h at 37°C. Then, the synthesized linear saRNA was purified by LiCl precipitation, re-suspended in DEPC water, and stored at −80°C.
Encapsulation of linear saRNA
To encapsulate saRNA, 1 µg of purified saRNA and 1 mL of ethanolic lipid mixture of DOSPA and DOPE (Merck, Germany) at a ratio of 3:1 was added and mixed for 5 min at room temperature. The mixture was purified by centrifugation at 1000 g for 10 min and characterized by dynamic light scattering (DLS) (Malvern Instruments Ltd, Malvern, UK) and transmission electron microscopy (TEM) (Zeiss). To determine the percentage of encapsulation of saRNA in nanoliposomes (encapsulation efficiency), a nanodrop was used and the concentration of saRNA was evaluated at a wavelength of 260 nm. We performed replicates of formulations (at least n = 3) to report full characterization (Keikha et al., 2021).
The expression of S-protein in HEK293T/17 cells
HEK293T/17 cells were cultured in complete Dulbecco’s modified Eagle’s medium (Gibco) containing 10% fetal bovine serum (FBS) (Gibco), 1% l-glutamine (Thermo Fisher Scientific), and 1% penicillin-streptomycin (Thermo Fisher Scientific) at 37°C and 5% CO2. Then, cultured cells (104 per well) were separately treated with (1) 10 µg saRNA LNPs, (2) 10 µg saRNA LNPs+1 µg TLR4 Agonist, (3) 10 µg saRNA LNPs+1 µg TLR9 Agonist, and (4) 10 µg saRNA LNPs + 1 µg TLR4 Agonist + 1 µg TLR9 Agonist for 1 day at 37°C and 5% CO2. After incubation, the expression of S-protein was confirmed by real-time PCR, ELISA, and western blotting (Keikha et al., 2021).
For real-time PCR, RiboEx total RNA extraction buffer (GeneAll, South Korea) was used to extract total RNA. Then, 1 ng of total RNA was mixed with 5 µL of Mastermix First-Strand Synthesis kit (Takara Bio Inc, USA) and incubated for 30 min at 50°C and then for 30 min at 95°C to inactivate the RT enzyme. Then, 5 µL of cDNA, 5 µL of primers (forward: 5′- CTATCAGGCCGGTAGCACAC−3′ and reverse: 5′- ACACCTGTGCCTGTTAAACCA−3′) and 10 µL of Mastermix qPCR SYBER (Invitrogen, UK) were mixed and amplified under the following conditions: 95°C for 1 min; 40 cycles of 95°C for 10 s, 55°C for 30 s, and 72°C for 10 s; 72°C for 5 min by an ABI real-time PCR system (Applied Biosystem, StepOne plus). The GAPDH gene was used as an internal control and the delta-delta CT formula was used to evaluate the relative gene expression.
For ELISA, ELISA plates (Biomat, Italy) were coated with anti-S-protein SARS-CoV-2 IgG (Sigma-Aldrich) at 1 mg/mL overnight at 4°C. After washing, wells were blocked with 2% BSA (Sigma-Aldrich) and 3% sucrose (Sigma-Aldrich) at 4°C overnight. Then, treated HEK293T/17 cells were lyzed by lysing buffer (Thermo Fisher Scientific) and centrifuged at 5,000 RPM for 5 min. Then, 100 µL of supernatant was added to the ELISA plate and incubated for 1 h at 37°C. After incubation and washing, HRP-conjugated antibodies (anti-S-protein SARS-CoV-2-HRP IgG (Sigma-Aldrich) with 1:5,000 were added and incubated for 1 h at 37°C. After washing, 100 µL tetramethylbenzidine (TMB) substrate (Sigma-Aldrich) was added and incubated at 37°C for 15 min. Then, 100 µL of sulfuric acid (Sigma) was added, and the optical density (OD) of each well was measured at 450 nm by a spectrophotometer (BioTek Industries). The standard curve was used to quantify the level of S-protein. Also, we quantified the level of S-protein in the cell medium after transfection with the same protocol.
For western blotting, treated cells were lyzed by lysis buffer (20 mM Tris, 5 mM MgCl2, 1 mM PMSF, 20 mg/mL aproptonin, 10 mg/mL leupeptin, 1 mM Na3VO3, and 20 mM β-glycerophosphate). The lysates were centrifuged at 11,000 g for 15 min, and the protein concentrations were analyzed by the Bradford method. Then, all samples were denatured by 0.2% bromophenol blue, 4% sodium dodecyl sulfate (SDS), 100 mM Tris[pH 6.8], and 20% glycerol) plus β-mercaptoethanol and analyzed by SDS-polyacrylamide gel electrophoresis. Thereafter, the proteins were transferred onto a nitrocellulose membrane. S-protein and beta-actin proteins were detected with corresponding primary monoclonal antibodies (1:1,000 diluted in blocking buffer) followed by HRP-conjugated secondary antibodies. The labeled proteins were visualized using DAB substrates.
Vaccination
BALB/c mice were vaccinated with: 10 µg saRNA LNPs at weeks 1 and 3. 10 µg saRNA LNPs mixed with 1 µg TLR4 Agonist (MPLA) (adjuvant 1) at weeks 1 and 3. 10 µg saRNA LNPs mixed with 1 µg TLR9 Agonist (CpG) (Adjuvant 2) at weeks 1 and 3. 10 µg saRNA LNPs mixed with 1 µg TLR4 Agonist (adjuvant 1) and 1 µg TLR9 Agonist (adjuvant 2) at weeks 1 and 3. No thing as negative control.
The sequence of CpG was GGTGCATCGATGCAGGGGGG (Catalog number 25462) and provided from Sinazyst, Iran. It has mixed phosphodiester/phosphorothioate backbone with flanking region and forms a palindrome Poly G tail at 3′ end. MPLA (CAS No.: 1246298-63-4) was purchased from Sigma-Aldrich.
Details of vaccination were as follows:
Injection route: subcutaneous, injection volume: 100 µL, injection instrument: insulin syringe, mice age: 6–8 weeks, sex: male, mice weight: 10–15 g.
The serum samples were collected at weeks 0, 1, 2, and 3. Finally, blood, small intestine, spleen, and liver of immunized mice were removed at week 4. All experiments were under the approval of the ethical committee of Zahedan University of Medical Sciences, Zahedan, Iran (IR.ZAUMS.REC.1400.071) and by ARRIVE guidelines (https://arriveguidelines.org) for the reporting of animal experiments.
Also, inflammation, toxicity, or adverse immune response was evaluated in the animals after the immunization. Moreover, all animals were weighed daily after the immunization.
Antibody titration
A 96-well ELISA plate (Biomat, Italy) was coated with SARS-CoV-2 Spike Protein Recombinant Antigen (Sigma-Aldrich) at 1 mg/mL for 24 h at 4°C. Then, the plate was washed three times with PBS and blocked with 10% BSA (Sigma-Aldrich) and 3% sucrose (Sigma-Aldrich) for 24 h at 4°C. Then, the serial dilutions (1:1,000, 1:500, 1:250, 1:125, 1:62.5, 1:31.2, 1:15.6) of serum samples were separately added to the ELISA plate and incubated at 37°C for 1 h. After incubation and washing with PBS, wells were separately incubated with secondary antibodies, including (1) anti-mouse IgG-HRP (Southern Biotech), (2) anti-mouse IgG1-HRP (Southern Biotech), (3) anti-mouse IgG2a-HRP (Southern Biotech), and (4) anti-mouse IgA-HRP (Southern Biotech), with 1:5,000 at 37°C for 1 h. After washing with PBS, 100 µL 3,3′,5,5′-TMB substrate (Sigma-Aldrich) was added and incubated at 37°C for 15 min. Then, 100 µL of sulfuric acid 1% (Sigma) was added, and the OD of each well was measured at 450 nm by a spectrophotometer (BioTek Industries). To set up ELISA cutoff values, five healthy mice without any vaccination were considered as negative control [18]. To obtain the antibody titer, the OD of each well was compared with the OD of the negative control. It is earned by comparison of test-OD to cutoff of whines sample in each dilution.
ELISpots
An anti-interferons (IFN)-γ precoated plate (Mabtech) was blocked by complete medium, RPMI-1640 + 10% FBS 10% (Sigma-Aldrich). Then, 2.5 × 10⁴ mouse splenocytes and 1 µg/mL SARS-CoV-2 peptide were added and incubated overnight for 24 h at 37°C and 5% CO2. After incubation, biotinylated cytokine-specific detection antibodies (Mabtech), streptavidin-enzyme conjugate, and substrate (Mabtech) were added. After adding blocking reagent, each well was observed under an optical microscope (Zeiss, Germany) and the number of secreting cells was calculated (Keikha et al., 2021). Note, the plates were washed with PBS to remove stabilizing agents.
The secretion of IL-4 and IFN-γ
To detect the level of IL-4 and IFN-γ, we used an ELISA kit. First, 100 μL of supernatant of activated mouse splenocytes were separately added to anti-mouse IL-4 (Southern Biotech) and IFN-γ (Southern Biotech) ELISA wells (Biomat, Italy). After 1 h incubation at 37°C, plates were washed with PBS and then 100 μL of secondary antibody, including anti-mouse IL-4-HRP (Southern Biotech) and anti-mouse IFN-γ -HRP (Southern Biotech), was added. Then, 50 μL of TMB (Sigma-Aldrich) was added. After 15 min, 100 μL sulfuric acid (Sigma) was added and the OD of each well was read by a spectrophotometer at 450 nm (BioTek Industries), and then the serum level of IL-4 and IFN-γ was quantified by standard curve [18].
Biodistribution assay
After vaccination, blood, small intestine, spleen, and liver of immunized mice were removed at week 4. Then, the concentration of S-protein was quantified by ELISA and real-time PCR, as previously described (Keikha et al., 2021). The S-protein produced locally by the replication of the saRNA.
Statistical analysis
All graphs and data are shown as mean ± standard deviation. GraphPad Prism (version 8.4) was used to prepare graphs and statistics. Here, one-way ANOVA was used to indicate significance at p < 0.05 after post hoc analyses, such as Tukey and Dunnett.
Results
The characterization of encapsulated saRNA
TEM image (Fig. 1a–d) of all LNPs shows the spherical shape of encapsulated saRNA. Based on DLS data (Fig. 1e–h and Table 1), the size distribution, mean size, PDI, and zeta potential of all LNPs were approximately similar. The encapsulation efficiency of saRNA was 52% in all formulations.

The TEM image of saRNA LNPs
The Dynamic Light Scattering Data of All Self-Amplifying RNA Lipid Nanoparticles Used in This Study
MPLA, monophosphoryl lipid A; ND, not applicable; saRNA LNPs, self-amplifying RNA lipid nanoparticles.
The in vitro expression of S-protein
Before immunization of mice, HEK293T/17 cells were treated with (1) saRNA LNPs, (2) saRNA LNPs+ TLR4 Agonist, (3) saRNA LNPs+ TLR9 Agonist, (4) saRNA LNPs+ TLR4 Agonist +TLR9 Agonist, and the expression of S-protein was evaluated by real-time PCR (Fig. 2a), ELISA (Fig. 2b), and western blotting (Fig. 2c). These tests showed that all the used formulations caused significant expression of S-protein in HEK cells compared with control (p < 0.05). The comparison between the formulations showed that TLR4 Agonist and TLR9 Agonist could increase the expression of S-protein compared with saRNA LNPs or any adjuvant alone. Interestingly, the combination of both adjuvants had a significant effect on the expression of the S-protein in HEK cells compared with other formulations (p < 0.05). Supplementary Data S2 shows the quantification of S-protein level in the cell medium after transfection. All the used formulations caused significant expression of S-protein in HEK cells compared with the control (p < 0.05).
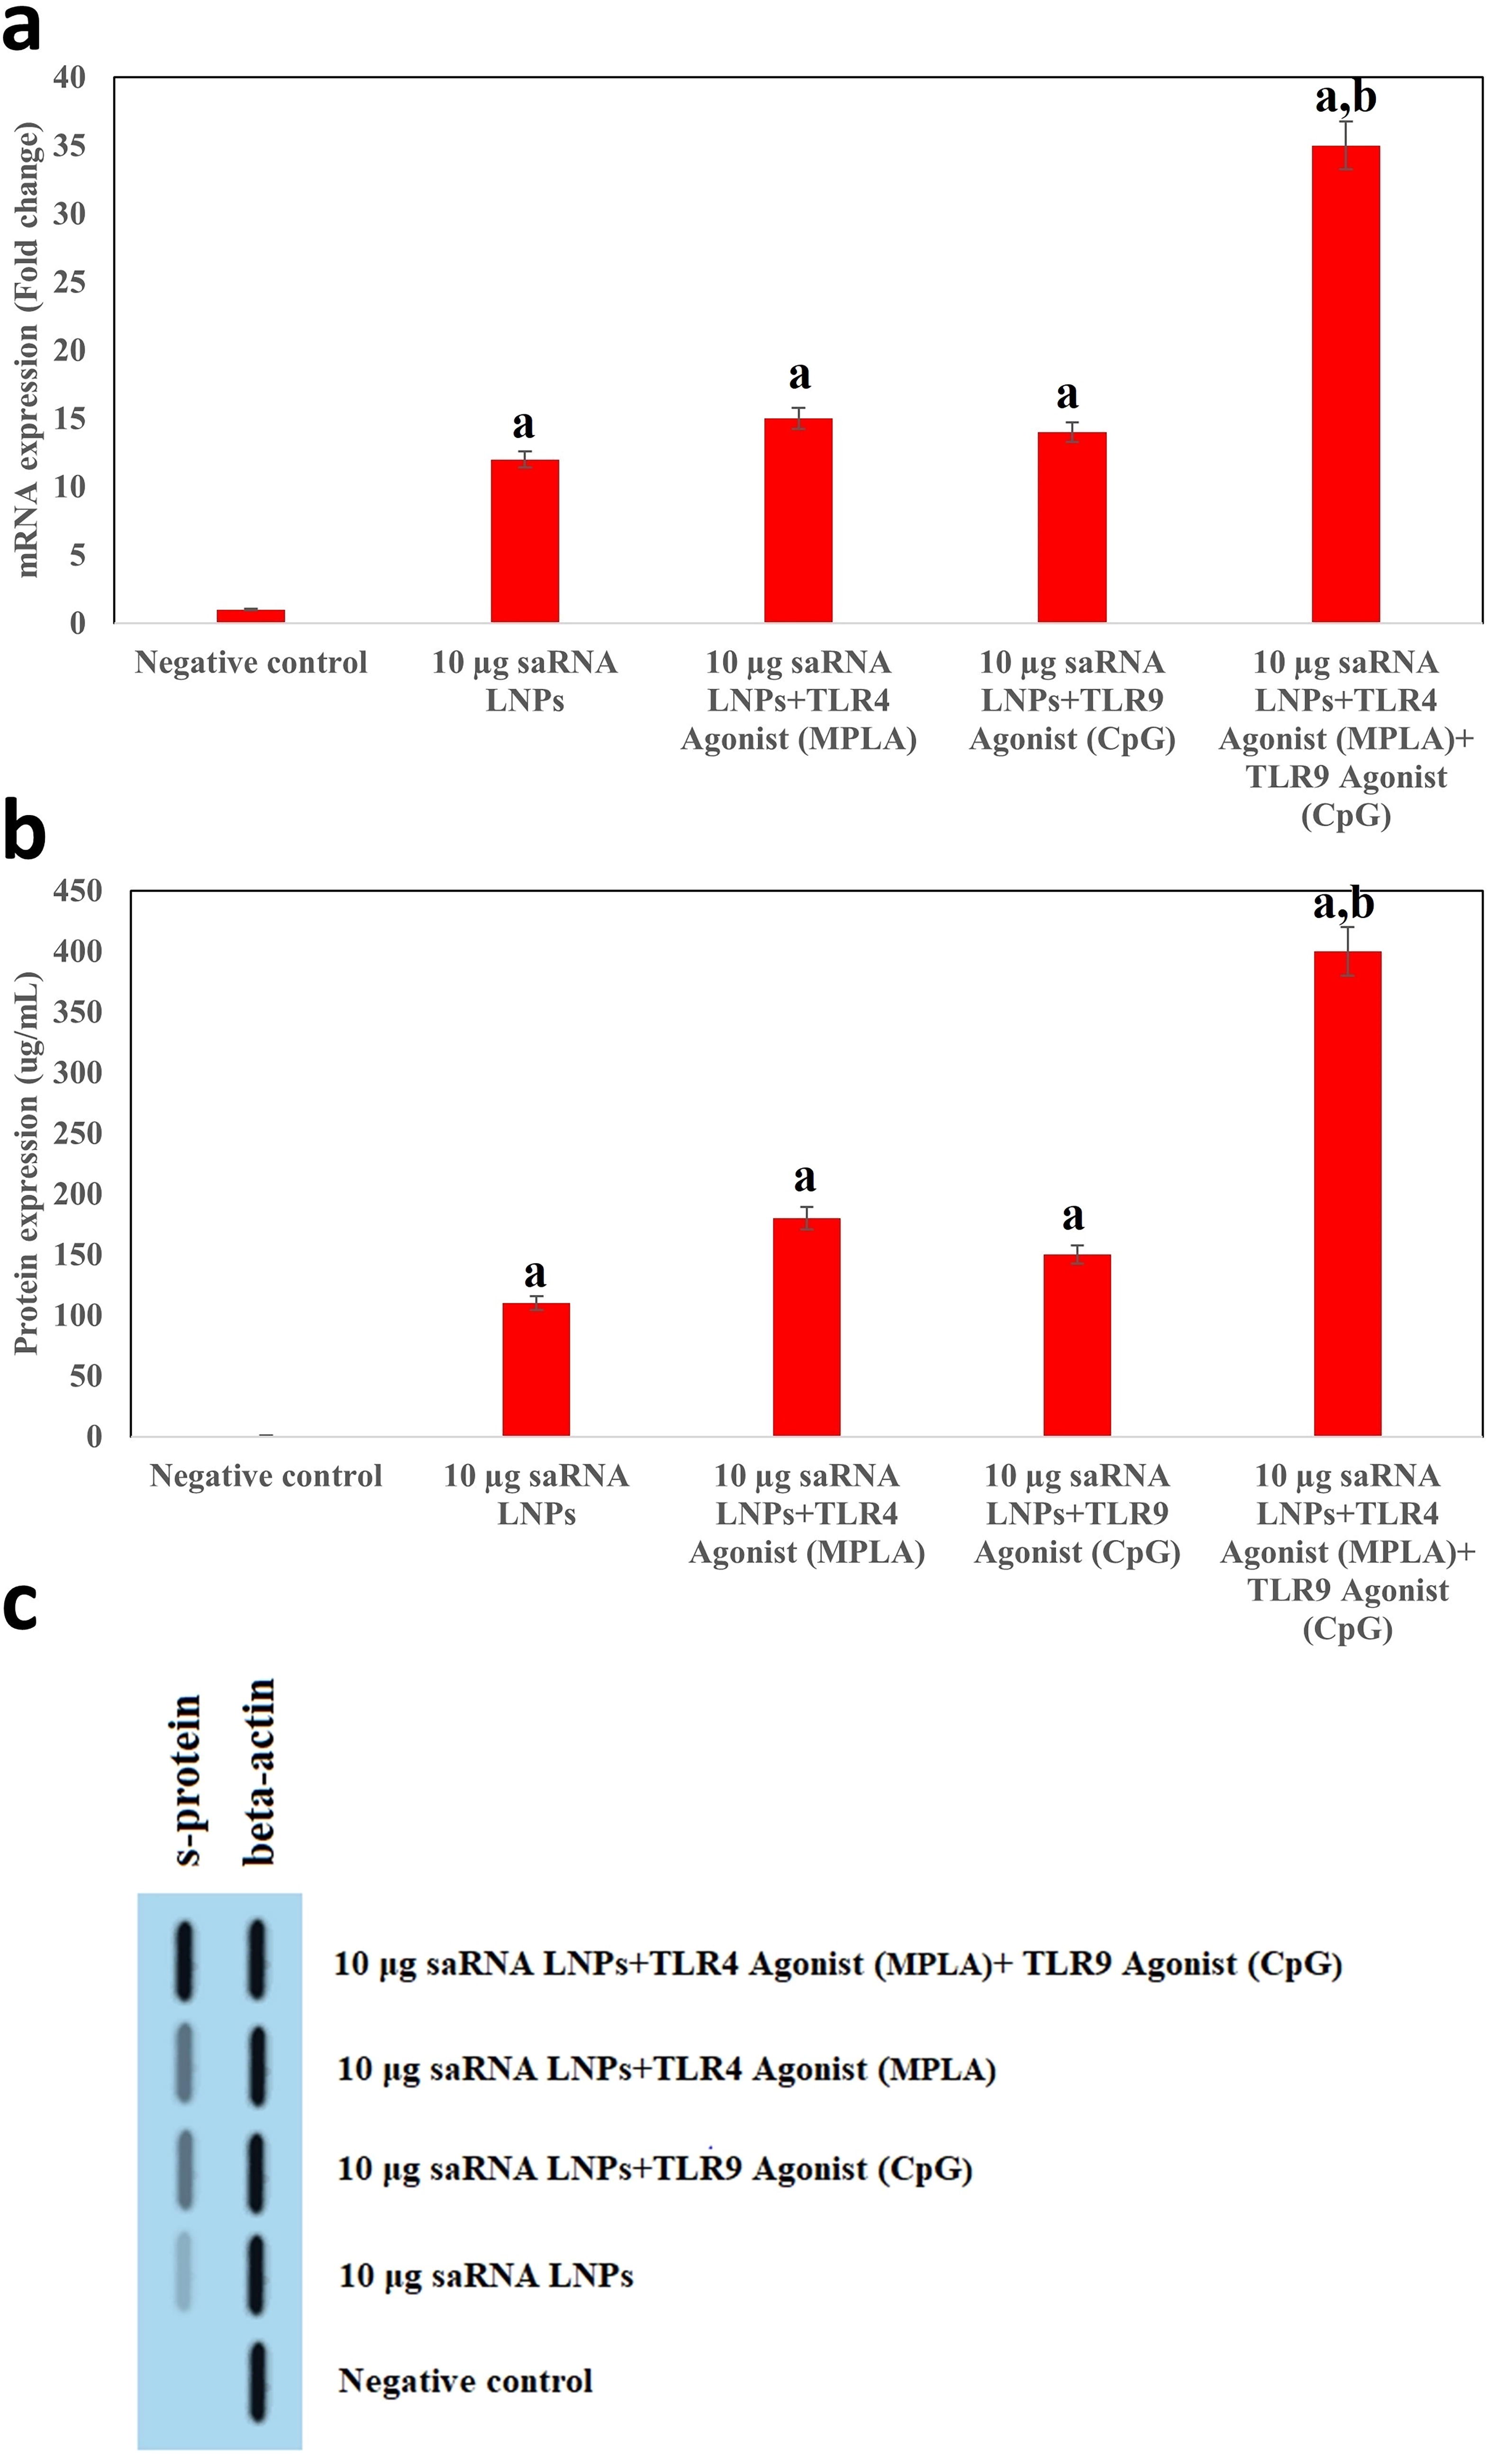
The in vitro expression of S-protein. Before immunization of mice, HEK293T/17 cells were treated with (1) saRNA LNPs, (2) saRNA LNPs+TLR4 Agonist (Adjuvant 1), (3) saRNA LNPs+ TLR9 Agonist (Adjuvant 2), and (4) saRNA LNPs+TLR4 Agonist+ TLR9 Agonist and the expression of S-protein was evaluated by real-time PCR
Although MPLA and CpG were associated with induced Th1 and Th2 immune responses against SARS-CoV-2, interestingly, we found they increase the transcription and translation of the S-protein in HEK-293T cells.
The antibody titer
After immunization of BALB/c mice with (1) saRNA LNPs, (2) saRNA LNPs+ TLR4 Agonist, (3) saRNA LNPs+ TLR9 Agonist, and (4) saRNA LNPs+ TLR4 Agonist +TLR9 Agonist, a high titer of IgG (Fig. 3a) and IgA (Fig. 3b) was seen in weeks 0, 1, 2, and 3 (p < 0.05). Although the combination of TLR4 Agonist and TLR9 Agonist with saRNA LNPs increased the antibody titer, no significant differences were seen between them. Sharply, when both adjuvants were used together, the antibody titer was significantly increased (p < 0.05). Here, the ratio of IgG2a/IgG1 was measured to find Th1-biased responses in vaccinated mice. The ratio of IgG2a/IgG1 was upper 1 in all study groups, indicating a Th1-biased response (Fig. 3c). Also, we observed a dose-response phenomenon. Here, we explored a range of doses for saRNA LNPs or adjuvants, and the best results was demonstrated. A dose-response study could provide insights into the optimal concentration for maximizing immunogenicity while minimizing potential side effects. We analyzed four time points, including 0, 1, 2, and 3 weeks. Additional time points could reveal more about the kinetics of the immune response, the duration of antibody titers, and the potential for long-term protection. Although the antibody titers and cytokine levels were measured, we assessed the functional quality of the antibodies, neutralization capacity against SARS-CoV-2. This is critical to determine the actual protective efficacy of the vaccine formulation (Supplementary Data S3).

The antibody titration against SARS-CoV-2. After immunization of BALB/c mice with (1) saRNA LNPs, (2) saRNA LNPs+TLR4 Agonist (Adjuvant 1), (3) saRNA LNPs+ TLR9 Agonist (Adjuvant 2), and (4) saRNA LNPs+TLR4 Agonist+ TLR9 Agonist, a high titer of IgG
ELISpots and the secretion of IL-4 and IFN-γ
Splenocytes from immunized mice were re-stimulated by S-protein. Finally, they were observed under an optical microscope and the number of secreting cells was calculated (Fig. 4a). In this test, we found that the mice vaccinated with saRNA LNPs, saRNA LNPs+TLR4 Agonist, and saRNA LNPs+ TLR9 Agonist had the same number of secreting cells. However, the mice vaccinated with saRNA LNPs+TLR4 Agonist+ TLR9 Agonist had significantly more secreting cells compared with other vaccinated mice (p < 0.05). The secretion of IL-4 (Fig. 4b) and IFN-γ (Fig. 4c) by re-stimulated splenocytes confirmed these data. Significant differences were also seen between the concentration of IL-4 and IFN-γ produced by activated splenocytes in the mice vaccinated with saRNA LNPs+TLR4 Agonist+ TLR9 Agonist compared with other groups (p < 0.05). The ELISPOT imaging of stimulated splenocytes is shown in Supplementary Data S4 for clarity and reproducibility.
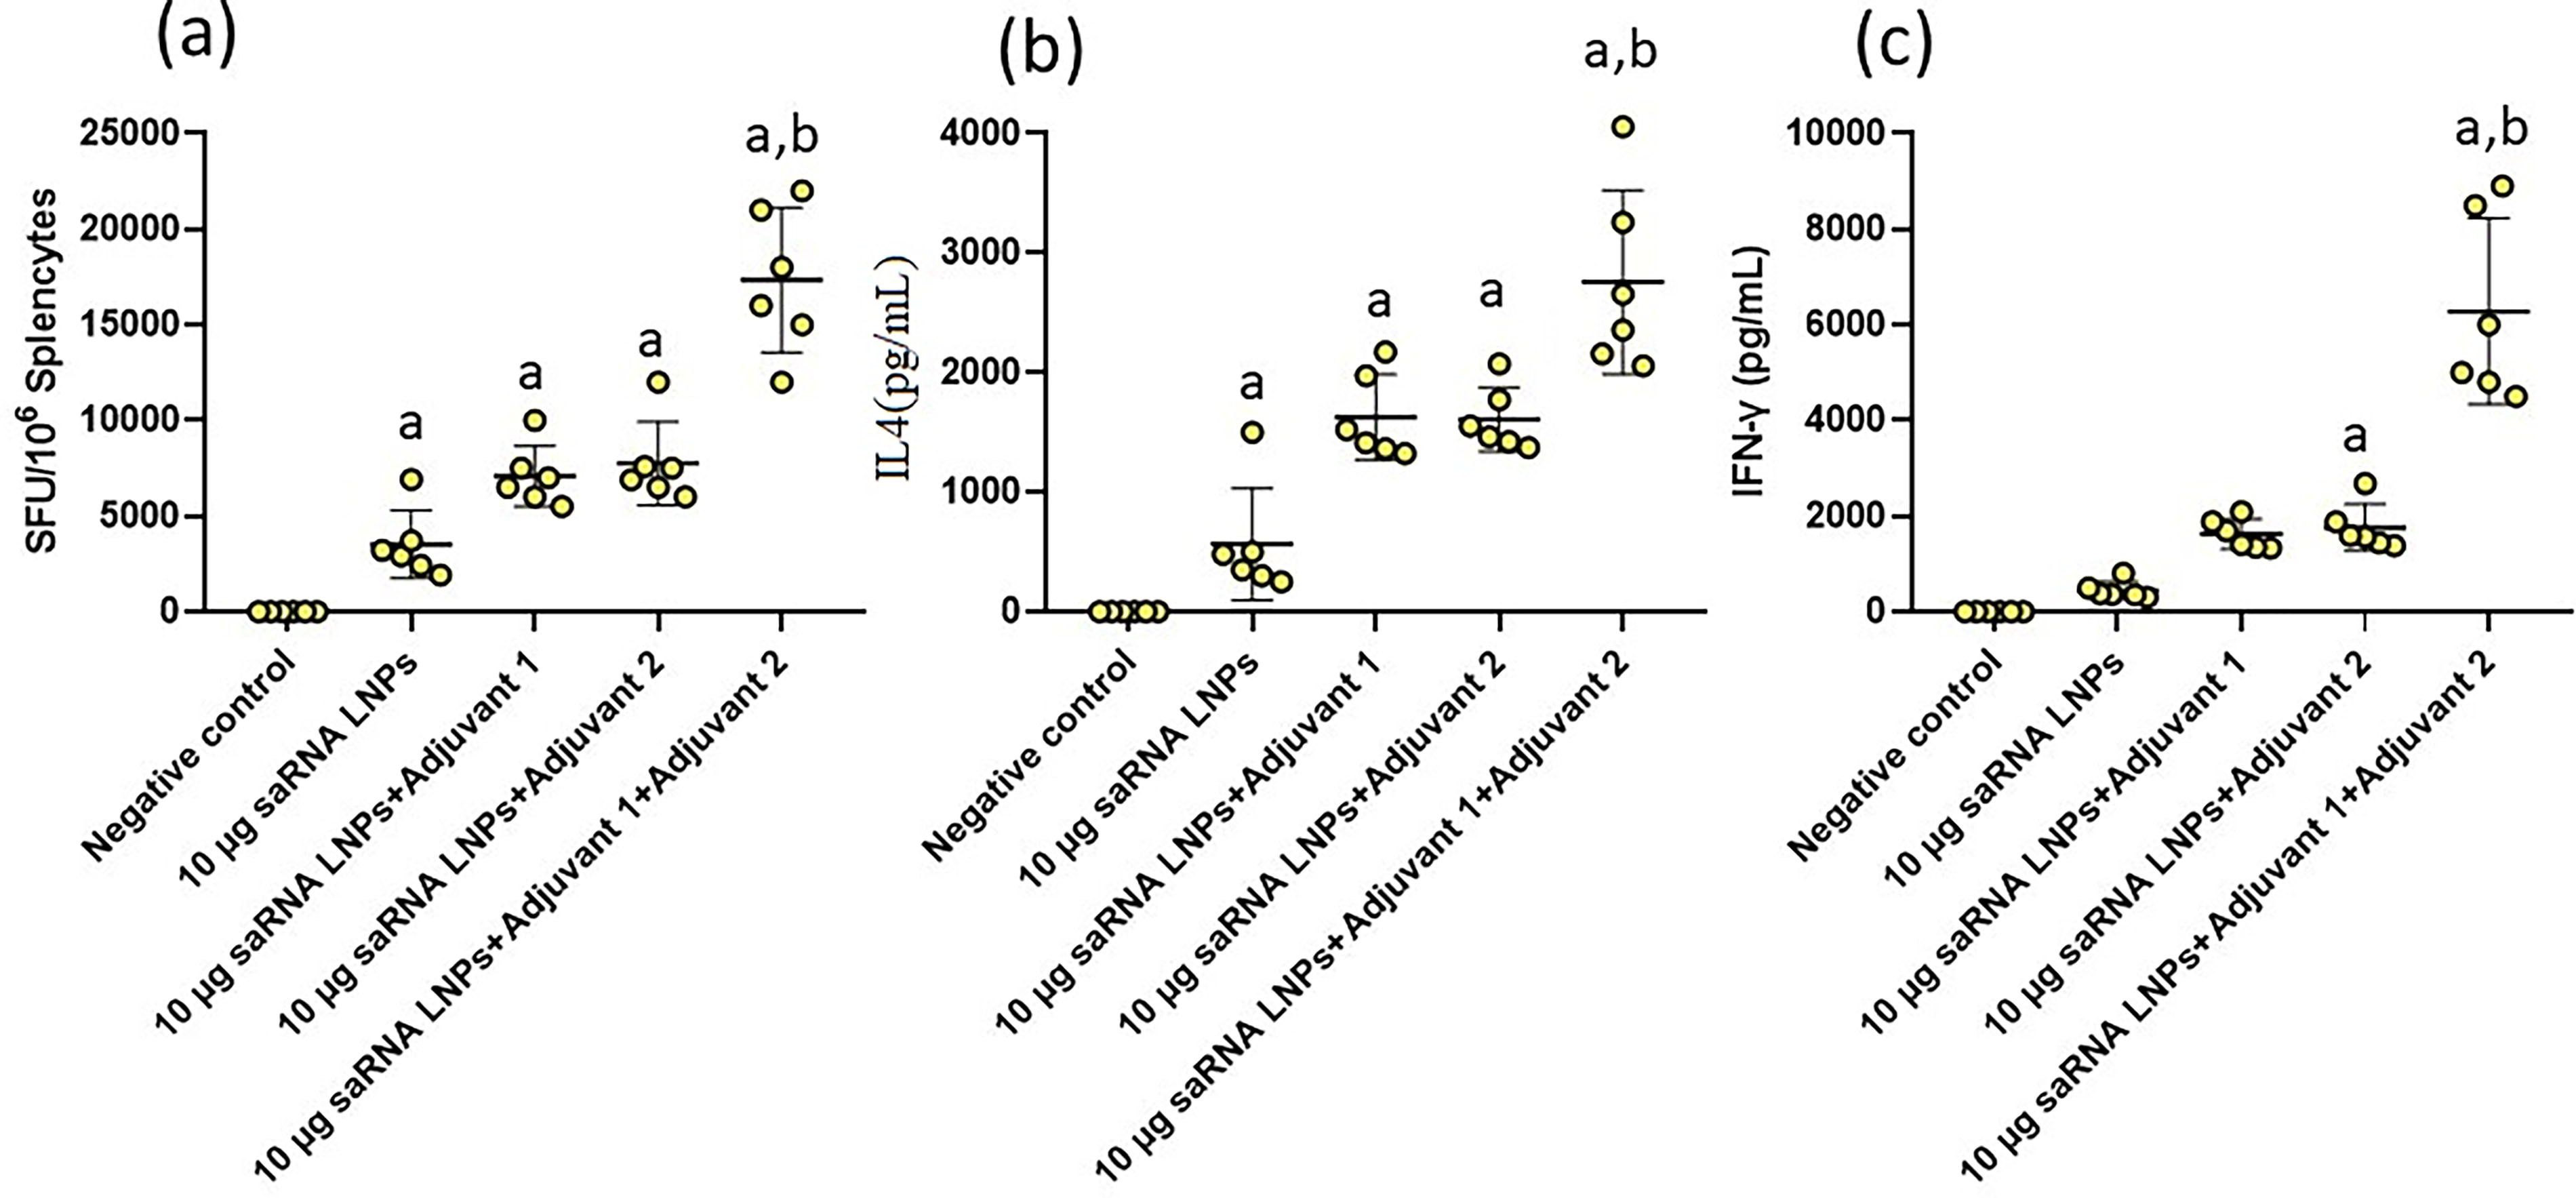
The results of ELISpots
Biodistribution assay
After immunization of BALB/c mice with (1) saRNA LNPs, (2) saRNA LNPs+ TLR4 Agonist, (3) saRNA LNPs+ TLR9 Agonist, (4) saRNA LNPs+ TLR4 Agonist +TLR9 Agonist, the concentration of S-protein (Fig. 5a–d) and the level of mRNA of S-protein (Fig. 6a–d).
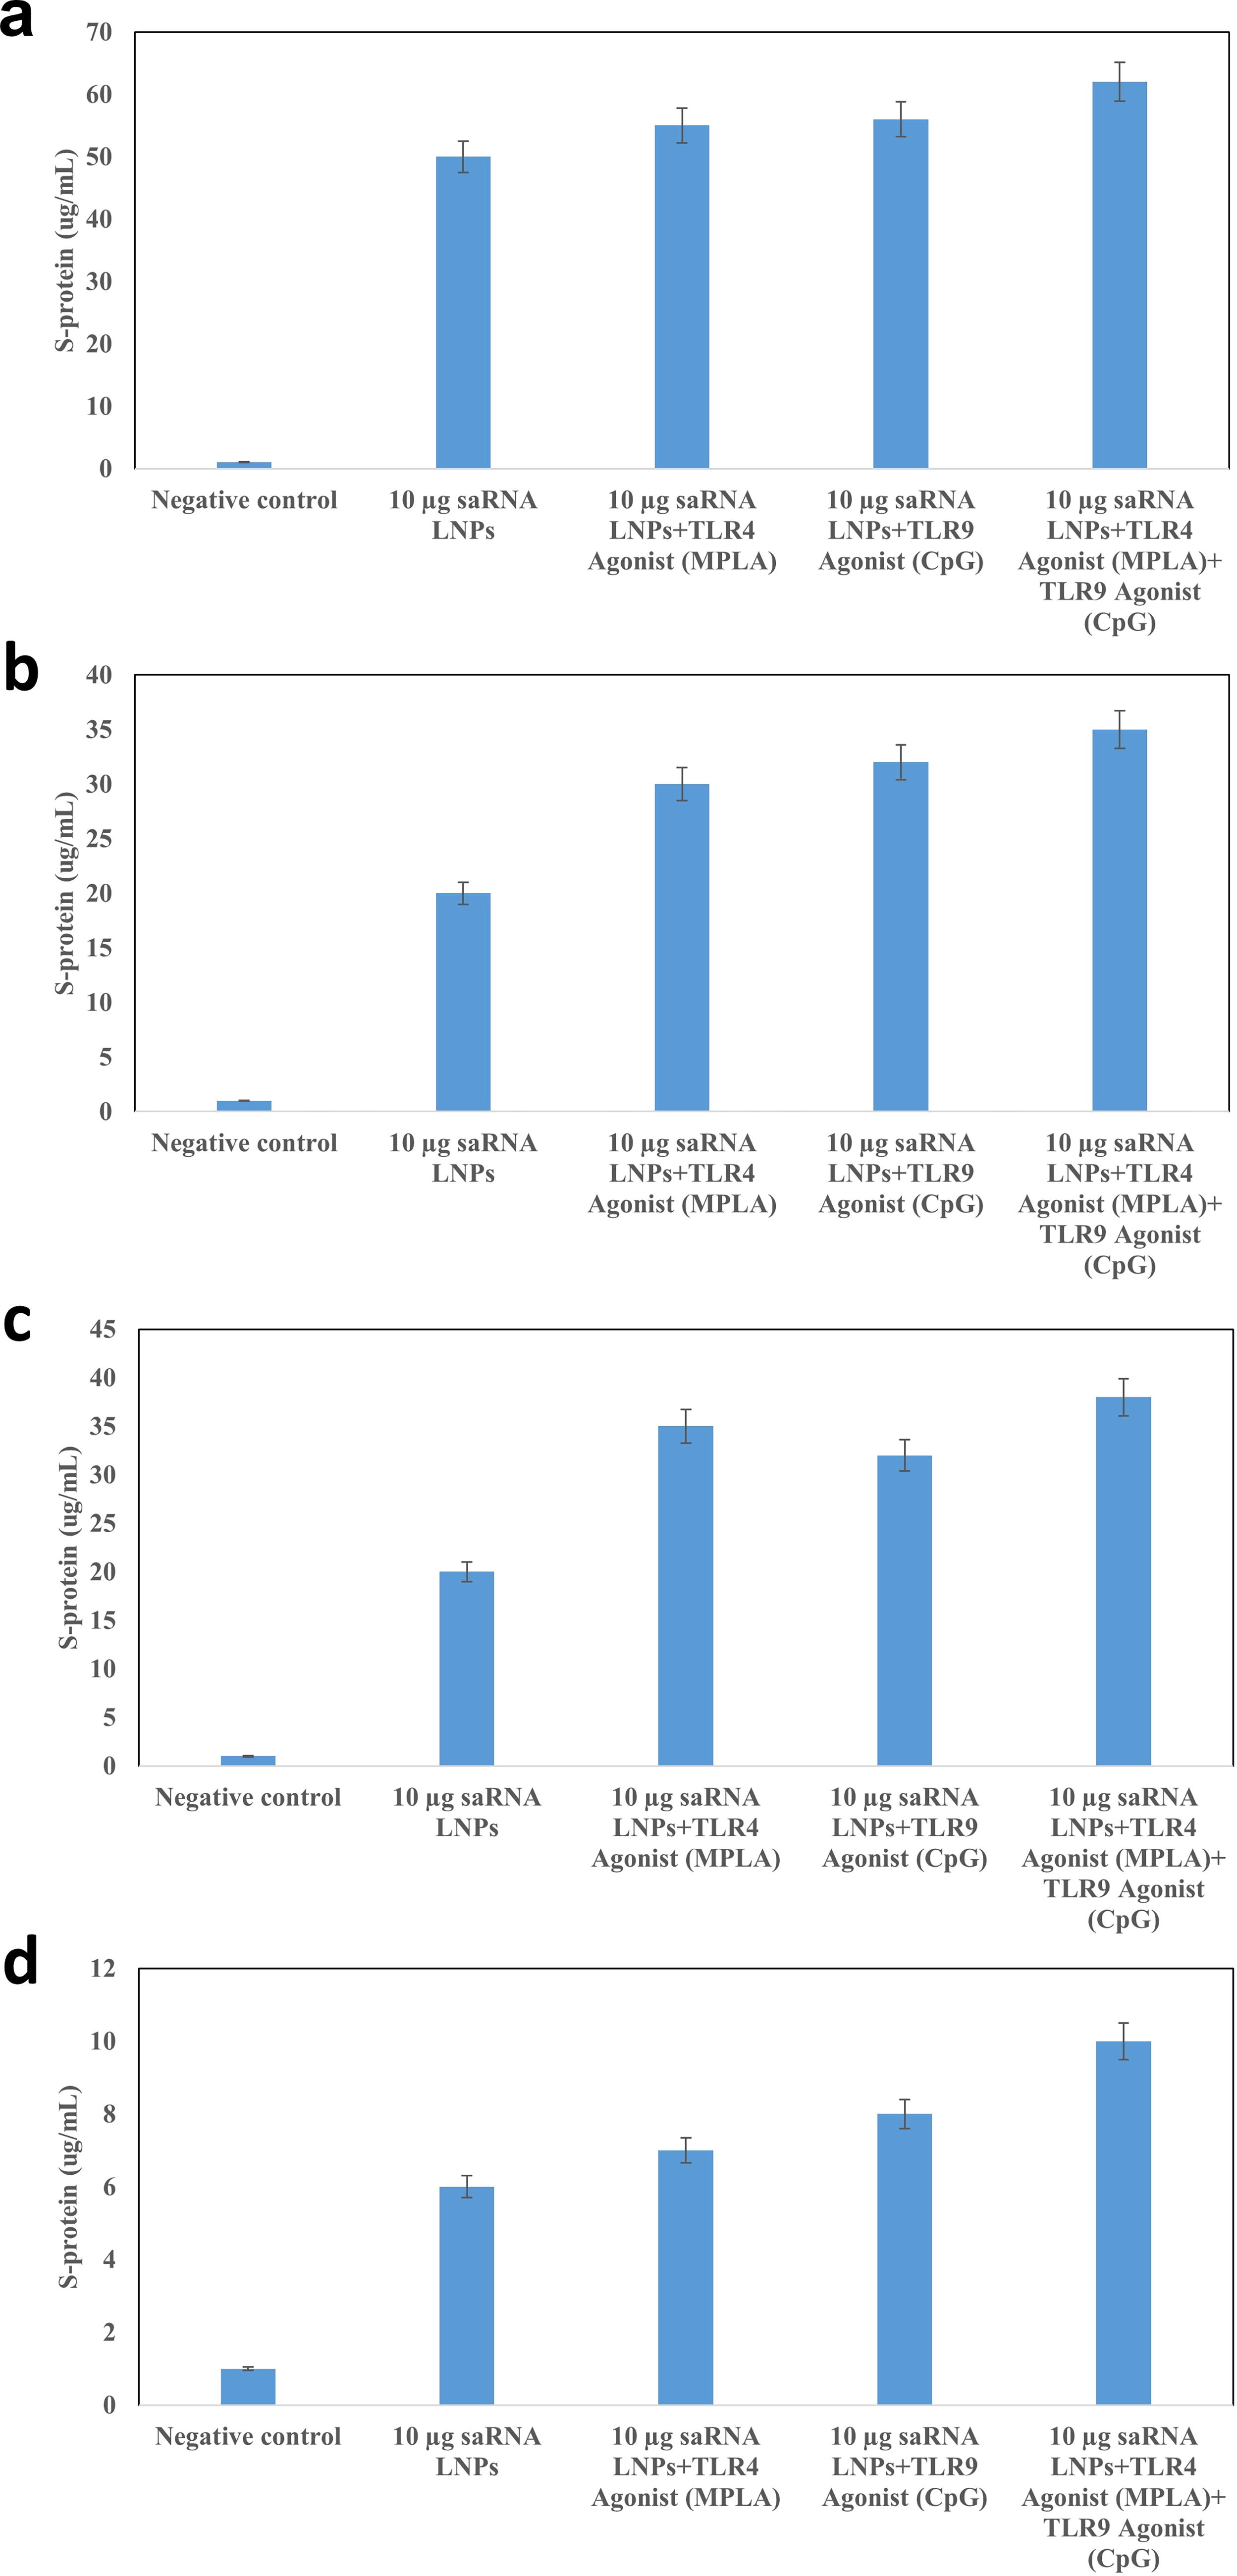
Biodistribution assay by ELISA. After immunization of BALB/c mice with (1) saRNA LNPs, (2) saRNA LNPs+TLR4 Agonist (Adjuvant 1), (3) saRNA LNPs+ TLR9 Agonist (Adjuvant 2), and (4) saRNA LNPs+TLR4 Agonist+ TLR9 Agonist, the concentration of S-protein was quantified in blood

Biodistribution assay by realtime PCR. After immunization of BALB/c mice with (1) saRNA LNPs, (2) saRNA LNPs+TLR4 Agonist (Adjuvant 1), (3) saRNA LNPs+ TLR9 Agonist (Adjuvant 2), (4) saRNA LNPs+TLR4 Agonist+ TLR9 Agonist, the mRNA expression of S-protein was quantified in blood
The Ss-protein was quantified in small intestine, blood, spleen, and liver of vaccinated mice. The S-protein produced locally by the replication of the saRNA. The highest quantity of S-protein and its mRNA was detected in blood, followed by the small intestine and the spleen. The interesting thing is that no significant difference was seen between the amount of S-protein and mRNA induced by different formulations, and the type of adjuvant did not affect the biodistribution. The biodistribution study suggests no significant differences in S-protein levels or its mRNA across different formulations. This might indicate either a limitation in the sensitivity of the assay or an issue with the formulation’s delivery mechanism.
Discussion
In this study, we compare the immune response against SARS-CoV-2 in Balb/C mice when saRNA LNPs are combined with TLR4/TLR9 Agonists. We found that although TLR4 Agonist and TLR9 Agonist could increase the expression of S-protein in HEK293T/17 cells compared with saRNA LNPs alone, the combination of both adjuvants had a significant effect on the expression of the S-protein. Also, we found that the combination of TLR4 Agonist and TLR9 Agonist increased the antibody (IgG and IgA) titer with a Th1-biased response, IFN-γ secreting cells, the secretion of IL-4 and IFN-γ. It must be mentioned that IL-4 promotes CD4+ Th2 differentiation and inhibits Th1 differentiation, and this is a potential implication for immune polarization (Diehl and Rincón, 2002). No significant difference was seen between the amount of S-protein induced by different formulations, and the type of adjuvant did not affect the biodistribution.
This study had some novel aspects. First, we found that the combination of these two adjuvants had a synergistic effect and stimulated the immune system more. This finding had not been previously reported in previous articles. Interestingly, not only did these two adjuvants stimulate the immune system, but they also increased expression and translation in the HEK cell line. We also found that the saRNA technology was effective in stimulating the immune system and producing antibodies against the virus. Alum and CpG were associated with induced Th1 and Th2 immune responses against SARS-CoV-2 (Lan et al., 2014). The development of severe eosinophilic immunopathology can be prevented by delta-inulin adjuvant (Honda-Okubo et al., 2015). Also, TLR agonist adjuvants inhibit eosinophil infiltration into the lung after SARS coronavirus infection (Sekimukai et al., 2020). On the other hand, S-protein-bound gold nanoparticles can elicit specific IgG responses but cannot induce protective antibodies and reduce lung eosinophil infiltration (Sekimukai et al., 2020). Hollow polymer nanoparticles loaded with interferon gene agonists protect mice from lethal MERS-CoV challenge and prevent severe eosinophilic immunopathology (Lin et al., 2019). Mice immunized with saRNA LNPs showed a Th1 response and increased antibody titers specific to SARS-CoV-2 (McKay et al., 2020). The use of S-proteins and Matrix M1, as a novel adjuvant, significantly increased the production of antibodies against SARS-CoV-2 (Coleman et al., 2014). TLR agonists with S-protein significantly increase antibody production and reduce the injection dose (Sekimukai et al., 2020). The inulin-related polysaccharide adjuvant with S-protein enhanced neutralizing antibody capacity (Honda-Okubo et al., 2015). The addition of MF59 significantly enhanced the immunogenicity of the MERS-CoV and elicited strong IgG and neutralizing antibodies (Zhang et al., 2016). An engineered S-protein with RNA adjuvant can induce a strong humoral immune response in MERS, characterized by IgG1 production (Kim et al., 2020). After vaccination with recombinant RBD protein, alum, and CpG as adjuvants high antibody response was seen (Lan et al., 2014). For the best protective immune response, the ratio of adjuvants, the sequence of adjuvants, and their location must be optimized (HogenEsch et al., 2018). A multivalent nucleocapsid protein-based vaccine with a mucosal adjuvant, macrophage-activating lipopeptide, could induce an immune response (Schulze et al., 2008). MF59 nanoparticle adjuvant with RBD antigen-induced weak IgG1 responses and very low IgG2a levels (Tang et al., 2015). The adjuvant formulation significantly enhanced protein-specific immunoglobulin responses. Advax-1 (a polysaccharide adjuvant based on delta inulin) significantly increased IgG1 responses, and Advax-2 significantly increased the broad antibody isotypes IgG1, IgG2a, IgG2b, and IgG3 (Gai et al., 2008). Note, T-cell responses against SARS-CoV-2 could not be enhanced by some commercial adjuvants, including aluminum, Freund’s adjuvant, MPLA, MF59, and ISA51 montanide (Zhang et al., 2016). A recombinant fragment of mouse calreticulin, rCRT/39–272, can induce CD4+ helper T-cell responses and has a stimulatory effect on mouse B cells and DCs (Kim et al., 2020). Using delta-inulin adjuvant to produce SARS-CoV antigens, elicited persistent T-cell IFN-γ responses (Honda-Okubo et al., 2015). Immunization with exogenous nucleocapsid protein and Freund’s adjuvant can enhance antibody responses, increasing the ratio of IL-4 and IFN-γ responses (Gupta et al., 2006).
Conclusion
Taken together, we found that the combination of TLR4 and TLR9 Agonists increased the antibody (IgG and IgA) titer with a Th1-biased response, IFN-γ secreting cells, the secretion of IL-4 and IFN-γ. No significant difference was seen between the amount of S-protein induced by different formulations and the type of adjuvant did not affect the biodistribution.
Footnotes
Acknowledgments
The authors thank Dr. Cristian Smerdou (Cima Universidad de Navarra, Spain) and PD.Dr. Vladimir Temchura, Institute of Clinical and Molecular Virology, Friedrich-Alexander-University Erlangen-Nürnberg, 91054 Erlangen, Germany for valuable help. The authors also thank the Zahedan University of Medical Sciences, Zahedan, Iran, for providing sera from recovered COVID-19 patients.
Authors’ Contributions
R.K. and A.J.: Conception and design. R.K. and A.J.: Administrative support. R.K.: Provision of study materials or patients. A.J.: Collection and assembly of data. R.K. and A.J.: Data analysis and interpretation. All authors: Article writing and final approval of the article.
Ethics Approval for Animal Experiments
All experiments were under the guidelines of the National Institute of Health, the provisions of the Declaration of Helsinki, and the ethics committee of Zahedan University of Medical Sciences, Zahedan, Iran (ethical code: IR.ZAUMS.REC.1400.071).
Ethics Approval for Human Experiments
No human sample was used in this study.
Availability of Data and Material
All data of this article are available based on the official request of researchers.
Author Disclosure Statement
There is no conflict of interest. R.K. is from Zahedan University of Medical Sciences (Zahedan, Iran). E.B., R. Khadivi, and A.J. are from Tehran Medical Sciences, Islamic Azad University (Tehran, Iran). Education and research are the primary functions at both universities. The authors confirm that all experiments were performed by ARRIVE guidelines and regulations of Zahedan University of Medical Sciences, Zahedan, Iran. The authors confirm that all experimental protocols were approved by Zahedan University of Medical Sciences, Zahedan, Iran. The authors confirm that all methods were carried out according to relevant guidelines and regulations of Zahedan University of Medical Sciences, Zahedan, Iran. The authors confirm that all methods were reported by ARRIVE guidelines (https://arriveguidelines.org) for the reporting of animal experiments.
Funding Information
This article was financially supported by Zahedan University of Medical Sciences, Zahedan, Iran (grant number: 10191).
Supplementary Material
Supplementary Data
References
Supplementary Material
Please find the following supplemental material available below.
For Open Access articles published under a Creative Commons License, all supplemental material carries the same license as the article it is associated with.
For non-Open Access articles published, all supplemental material carries a non-exclusive license, and permission requests for re-use of supplemental material or any part of supplemental material shall be sent directly to the copyright owner as specified in the copyright notice associated with the article.