
Abstract
Objective:
High-frequency ultrasound (HFUS) images are being researched for use in the prevention, detection, and monitoring of pressure injuries in patients at risk. This seminal longitudinal study in mechanically ventilated adults describes image quality, the incidence of image artifacts, and their effect on image quality in critically ill subjects.
Approach:
Mechanically ventilated subjects from three adult intensive care units were enrolled, and multiple sacral images from each subject were obtained daily. Using a subset of best image per patient per day, artifacts were grouped, and their effect on image quality was statistically evaluated.
Results:
Of a total of 1761 images collected from 137 subjects, 8% were rated as poor. In the subset, 70% had good quality ratings. Four groups of artifacts were identified as follows: “bubbles,” “texture problems,” “layer nondifferentiation,” and “reduced area for evaluation.” Artifacts from at least one group were found in 83% of images. Bubbles were most frequently seen, but artifacts with adverse effect on image quality were “layer nondifferentiation,” “texture problems,” and “reduced area for evaluation.”
Innovation:
HFUS image evaluation is still in the development phase with respect to tissue injury use. Artifacts are generally omnipresent. Quickly recognizing artifacts that most significantly affect image quality during scanning will result in higher quality images for research and clinical applications.
Conclusion:
Good quality images were achievable in study units; although frequent artifacts were present in images, in general, they did not interfere with evaluation. Artifacts related to “layer nondifferentiation” was the greatest predictor of poor image quality, prompting operators to immediately rescan the area.

Introduction
P
Ultrasonography, increasingly used in practice areas, has low cost, portability, and ease-of-use. Recently, high-frequency ultrasound (HFUS) using a 20 megahertz (MHz) probe has been used to provide computer-generated images for both dermatologic diagnostics and research to evaluate lymph nodes, 7 chronic injuries, 8,9 skin lesions, and tumors. 7,10 –12 However, the use of 20 MHz HFUS to investigate the development of PrIns is relatively new. A hypoechogenic (appearing darker in HFUS images) subepidermal layer has been noted in HFUS images in conjunction with known skin tissue injury. 13 –15 The hypoechogenic areas are thought to reflect increasing fluid content associated with inflammation indicating soft tissue edema before visible damage is noted at the skin surface. 8,10,13 –18 HFUS was validated as a sensitive method for changes in dermal hydration associated with edema formation by nuclear magnetic resonance imaging. 19
In the acute care setting, HFUS may be used for documentation, detection, and monitoring of soft tissue injury in patients at risk upon hospital or long-term care admission; however, little is known regarding its accuracy or reliability. Many HFUS images have artifacts from less-than-optimal technique resulting from difficulty of probe placement in the acute care setting. It is not known which artifacts have the greatest effect on image quality. Poor-quality images can be a significant source of missing patient data, preventing identification of earliest PrIns. Using HFUS imaging technology to identify early inflammation, which may precede PrIn formation, may allow intervention to reduce adverse outcomes and promote cost effectiveness.
Clinical Problem Addressed
Since a variety of clinicians/operators may obtain HFUS images, it is important that quality images are collected, and factors that may affect image quality are recognized immediately to prompt rescanning. Currently, no data are available about the frequency of obtaining quality images and factors that affect the ability to obtain an ideal image, especially in the critically ill. Therefore, this study describes HFUS image quality, the incidence of HFUS image artifacts, and their effect on image quality in critically ill subjects.
Materials and Methods
Sample and setting
The parent study, from which this analysis is derived, was a descriptive, longitudinal study of skin integrity of 150 intubated and mechanically ventilated adult subjects from a medical respiratory intensive care unit ([ICU]MRICU), surgical trauma ICU (STICU), or neuroscience ICU (NSICU) in an academic medical center. 20 Subjects were enrolled in the study within 24 h of intubation, and sacral images were obtained daily for up to 7 days. Data were collected from February 2010 to May 2012. Because the parent study included use of a pressure mapping system that may limit the moisture reducing aspect of the ICU bed, exclusion criteria included subjects who had significant skin moisture risk as determined by the Braden scale of ‘‘constantly moist’’. 21
Procedures
The study was approved by the University Institutional Review Board and informed consent was obtained from the subject or their legally authorized representative. HFUS images were obtained daily on each study subject up to 7 days or until hospital discharge, whichever occurred first. Five operators with training to obtain and identify good-quality images saved at least three images from several collected per subject per day if possible, with review at the bedside until determining that a good image was captured. Weekly monitoring and compliance evaluation of operators with retraining were performed every 3 months, or as needed. All saved images from the bedside were stored for later analysis. Operators not only performed scans in the early morning whenever possible but also coordinated with the patient's usual care activities and turning schedule so as to not disturb the patients unnecessarily and were instructed to minimize time spent on obtaining scans.
Key variables and their measurement
A high (20 MHz)-frequency ultrasound dermal scanning system (EPISCAN; Longport, Inc., Glen Mills, PA) was used to collect data for evaluation of sacral tissue. The EPISCAN settings on all scans were as per manufacturer's recommendation for sacral scans and were consistent to insure uniformity of measurement between images: size—512 × 1024; time-gain compensating amplifier start = 0%; position = 16.0; depth = 10.2 millimeters; and time-gain compensating amplifier = 10%; gain = 20%.
The procedure for HFUS scanning is as follows: sacral palpation to determine probe placement, brief cleaning of the skin, the application of ∼1 teaspoon of nonirritating hypoallergenic coupling gel to the sensor probe cover, the probe placed lightly and motionless at right angles to the skin surface, and then scanning is initiated. The operator observes the scans as they are generated and saves the best scan(s) for later analysis. Approximately one HFUS image is produced each second. The entire scanning procedure from entering the ICU room took about 10–12 min per patient. In this critically ill population, it was not possible to obtain scans in the prone position as recommended by the manufacturer, rather, sacral scans were obtained in patient side-lying positions as close to a side-lying, 90 degree lateral rotation as possible, based on the clinical condition of the patient to accommodate the HFUS probe. Our previous study evaluated the quality of images obtained by multiple operators in different subject positions (prone, left side-lying with 60 degree rotation, left side-lying with 90 degree rotation) and found that the overall scan quality was similar in all positions with all operators. 22
Image quality
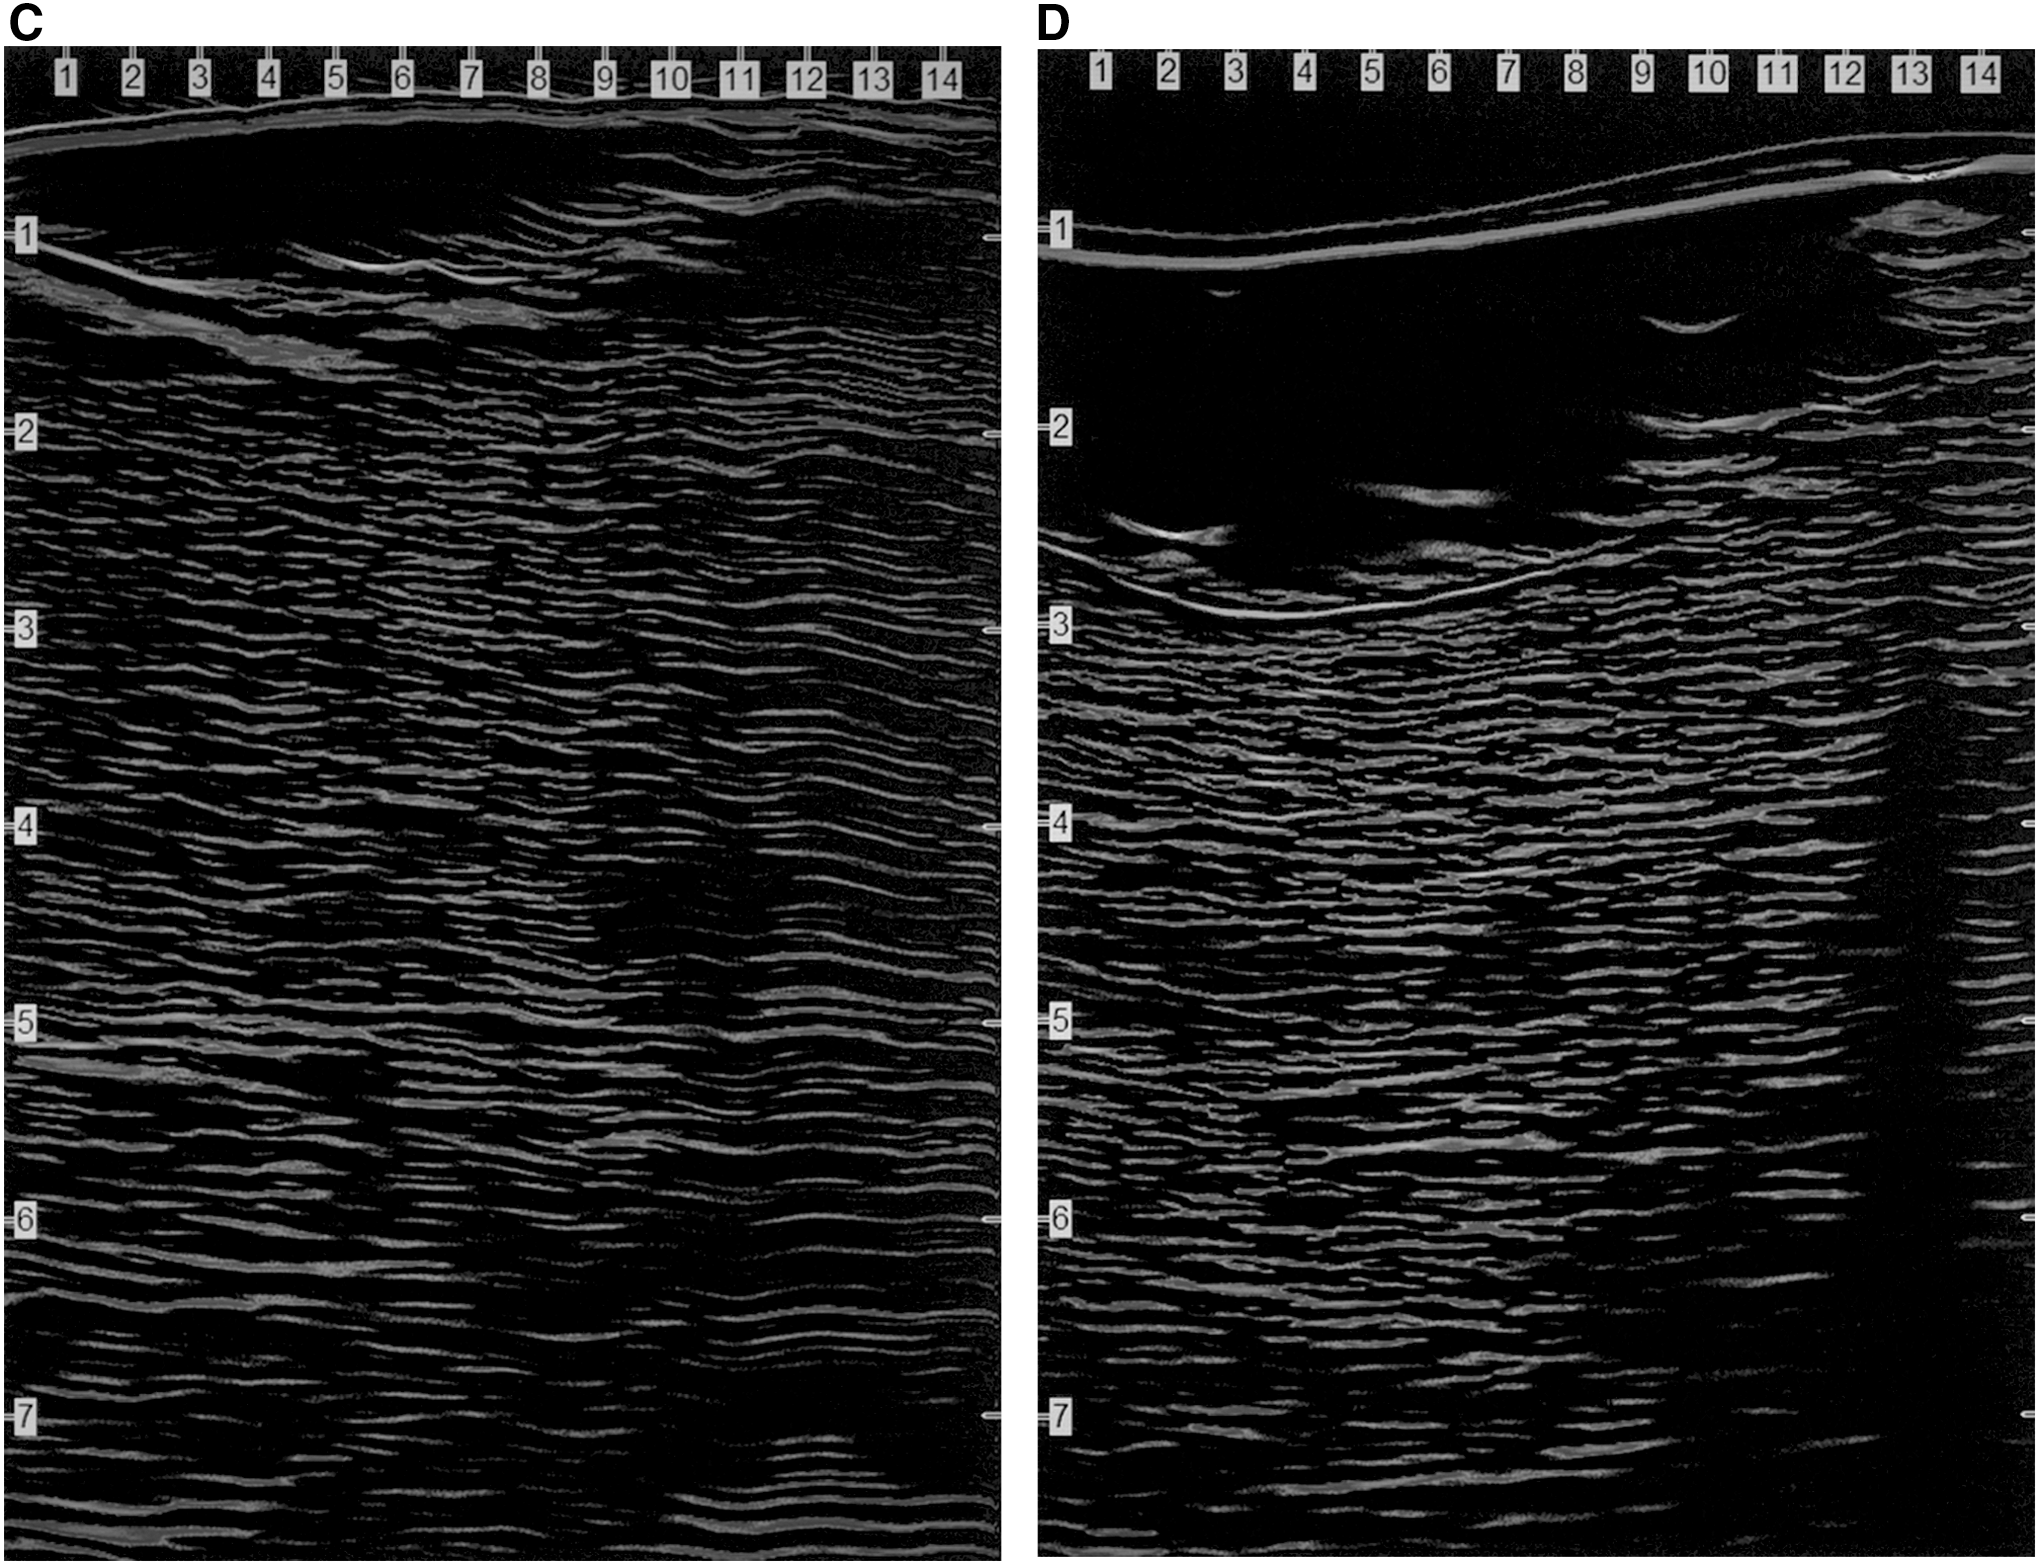
Higher quality HFUS images have specific components for confident evaluation of possible edema in skin tissue: reflections from probe membrane and coupling gel, a defined epidermal entry echo, and uniform and clearly visualized texture (collagen bundles and ground substance) differences between the dermal and hypodermal skin layers (Fig. 1). Artifacts in the image resulting from bubbles in the gel, improper probe placement, and/or technique may distort or occlude image components preventing optimal evaluation (Fig. 2, panels A–D).
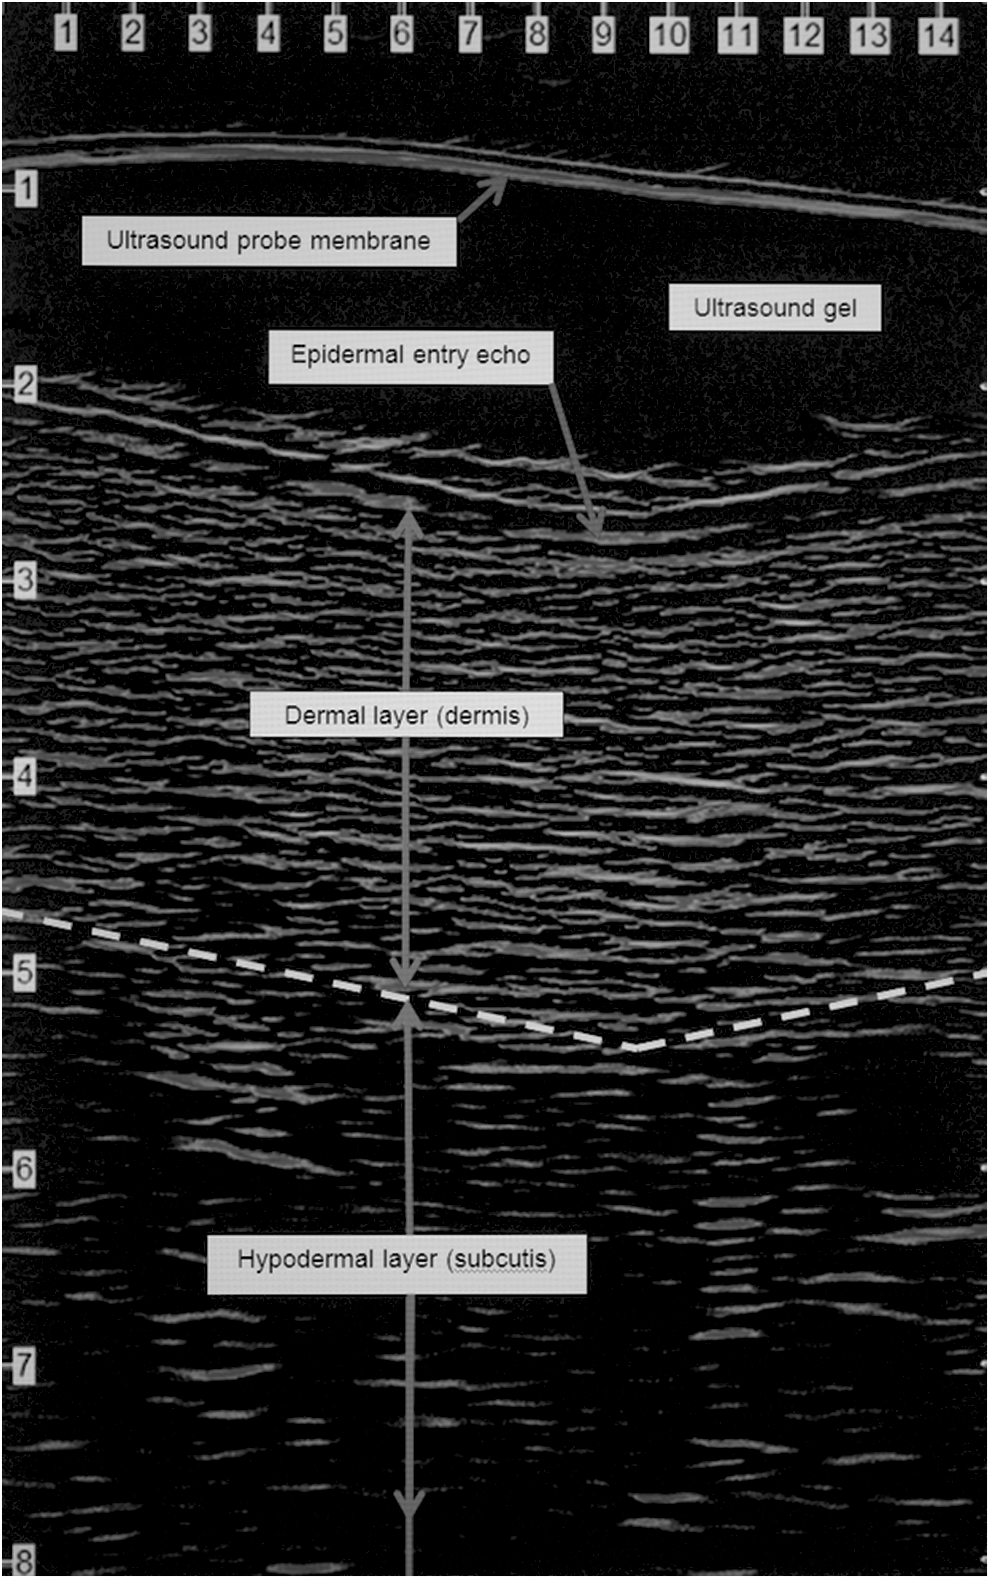
Good quality HFUS scan image with components. HFUS, highfrequency ultrasound.
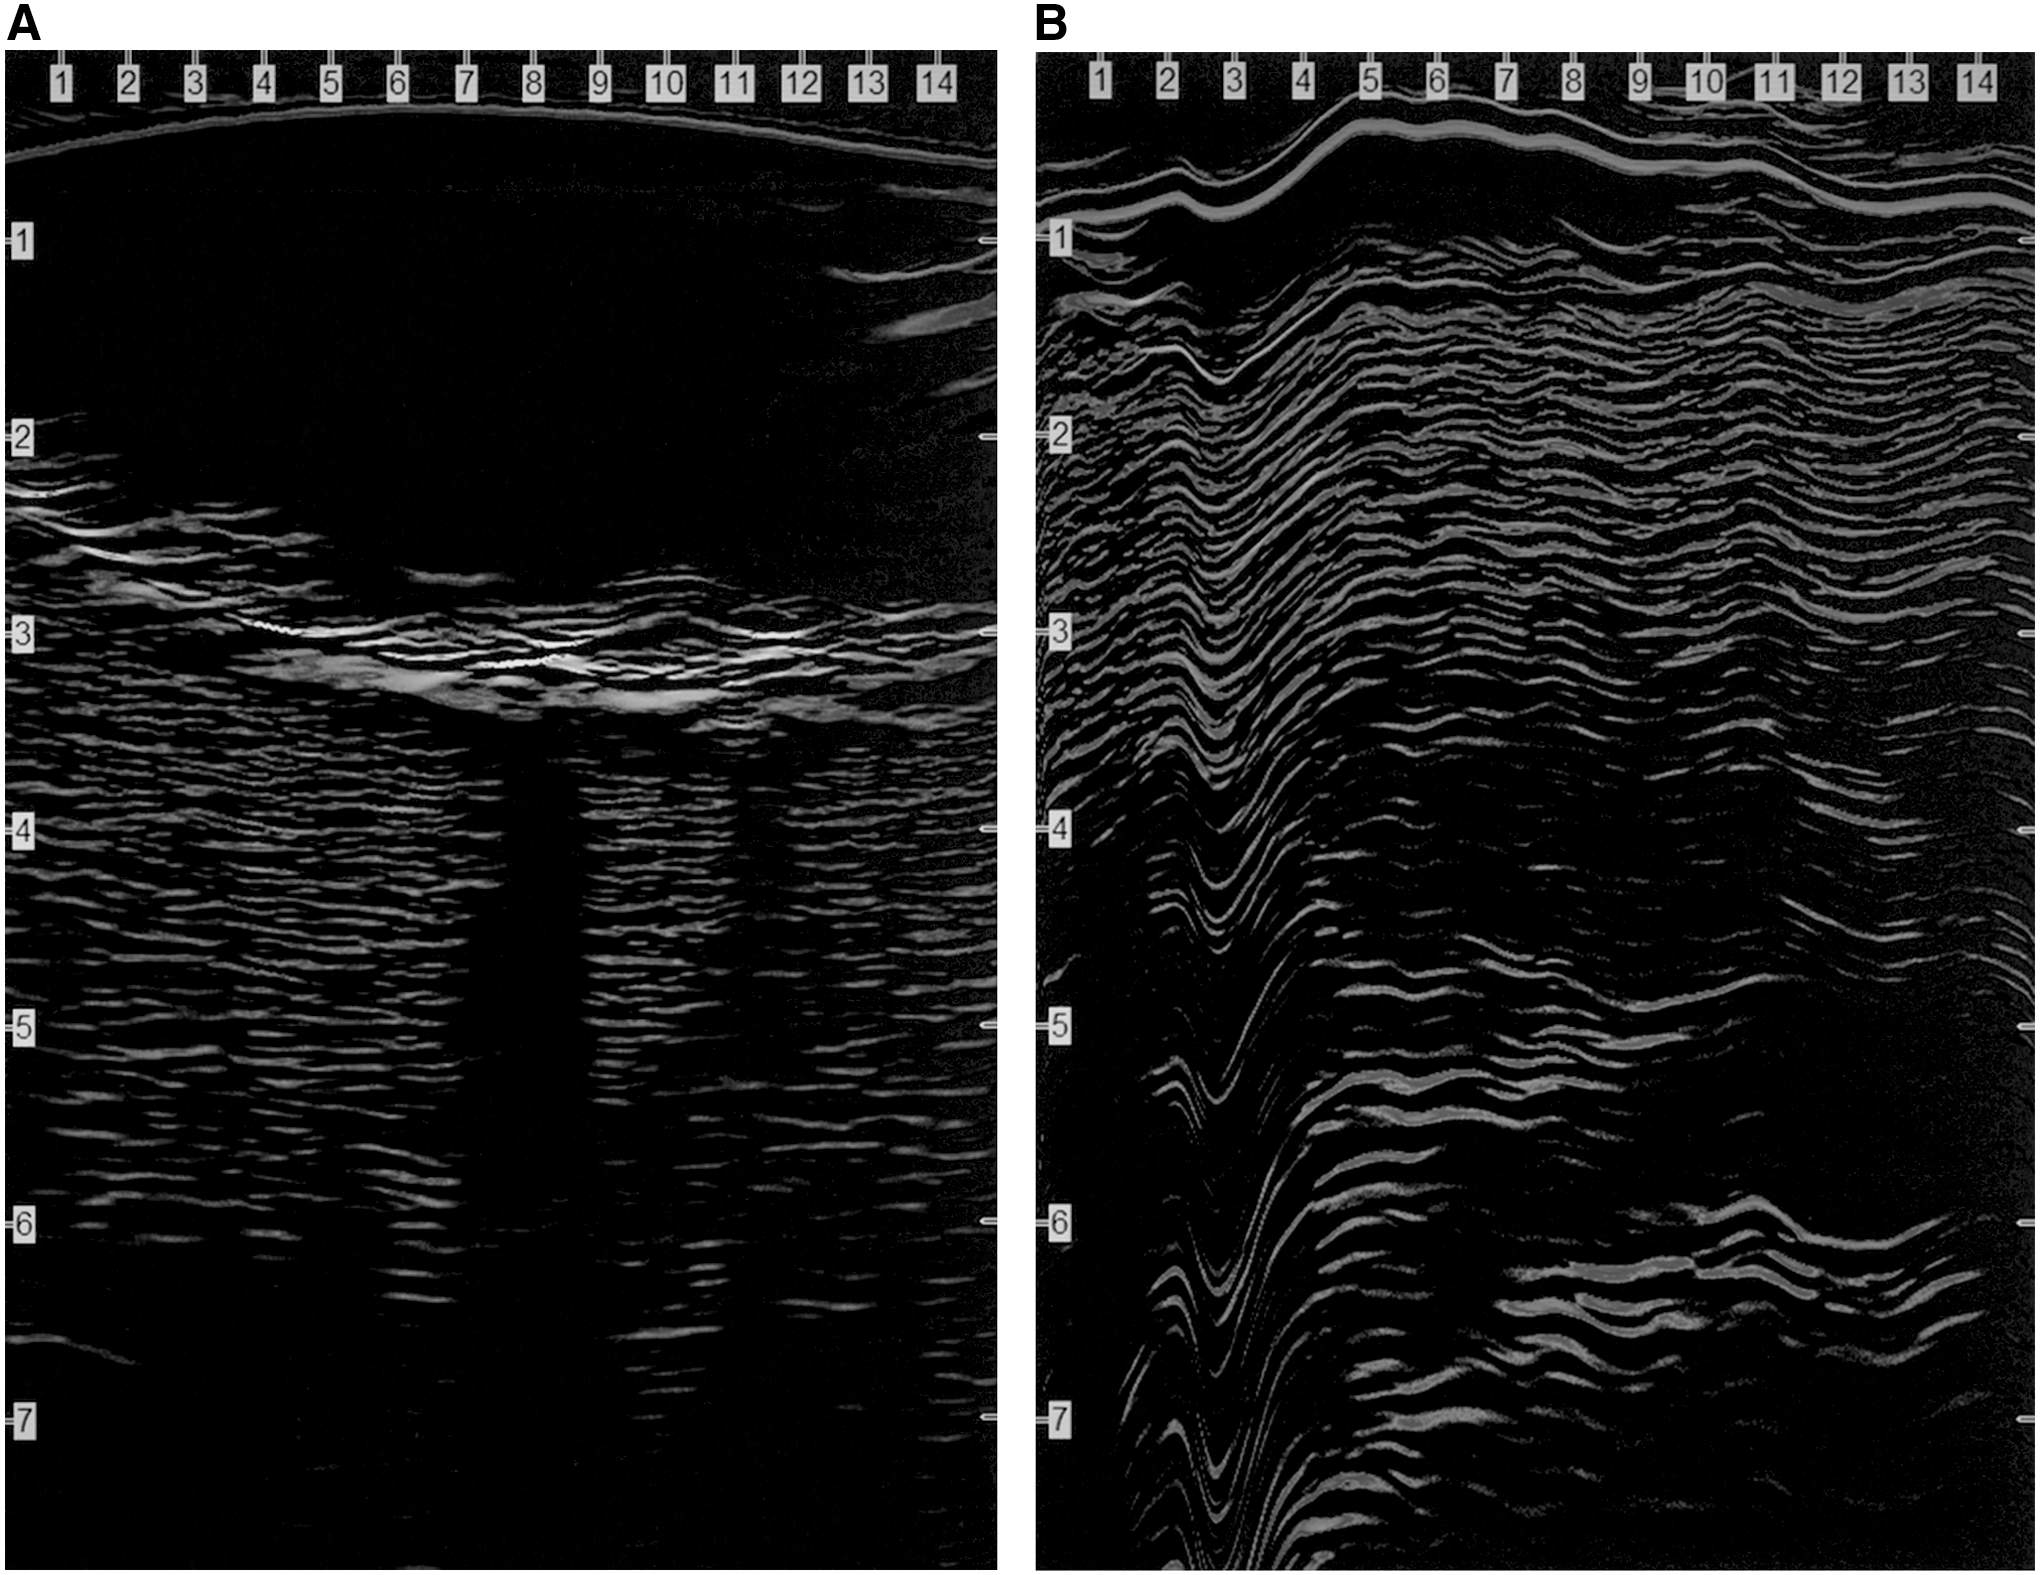
HFUS scans showing examples of artifacts.
Creating an image rating scale and determining interrater reliability were initially performed using the first 40 subjects (of 150) and are reported fully in a previous article. 23 This study is a report of overall image quality and artifacts of the entire 150 subject sample.
Image quality for this study was investigated in a two-step procedure. First, two image evaluators with training and experience in image assessment (RB, VL) rated the quality of the full dataset images with a 1 to 4 scale—1, the poorest and 4, the best—with higher quality scans (usable for assessment) at the 3 and 4 levels (Table 1). The evaluators then agreed on one best image for each day and for each subject creating the best image per patient per day subset for HFUS data analysis. Ratings of 3 (at least part of both layers evaluable) had wide variation in quality requiring greater specification, and therefore, a second step was initiated. Using this best image per patient per day subset, a simplified Refined Rating Scale (3.0, 3.1, 3.3, 3.5, 3.7, 3.9) for the ratings of 3, providing additional discrimination was developed, evaluated, and implemented. 23 Due to both minimal differences between group definitions and small sample size, both the lowest (3.0 and 3.1) and highest (3.9 and 4.0) ratings were grouped together, resulting in five image quality levels for analysis.
HFUS image quality rating scales
Bolded ratings indicate the original 1–4 ratings.
At least 50% of the widths of the image of both layers are evaluable with the evaluable portions positioned over each other.
HFUS, high-frequency ultrasound.
HFUS image artifacts
Artifacts are the result of improper probe handling and placement during the scanning process. Artifact data were collected concurrent with scan rerating using the best image per patient per day subset. In our previous work with volunteers evaluating the effect of position on image quality, artifacts observed were identified and grouped. 24 That process resulted in five image artifact categories for grouping; for differentiation and analysis, they were collapsed into four. Table 2 describes the artifact categories and Figure 2 (panels A–D) presents examples of the artifacts.
Artifacts interfering with HFUS image evaluation using the best image per patient per day subset a
The best image per patient per day subset (n = 787) included eight images with no defects. This table describes only images with artifacts.
Totals and percentages over 100 reflect the possibility of multiple image defects per scan image.
In the final analysis this group was subsumed under “Reduced Area for Evaluation” for best differentiation and analysis.
Image artifacts are multifactorial, and all groups obscure the evaluation of HFUS image components and therefore echogenicity. A bubble in the probe gel masks all tissue definition below the bubble causing a completely dark area. It is believed that oily skin may also cause bubbles as it prevents the ultrasound gel from wetting the skin, resulting in small surface air bubbles, hence the importance of the skin cleaning step. With “texture problems” the inability to visualize the appearance of skin structures such as collagen bundles significantly interferes with image evaluation. Collagen bundles and ground substance appear as brighter elements in the dermis providing contrast to hypoechogenic (darker) edematous areas. It is important that the HFUS probe is held motionless and perpendicular to the skin's surface to prevent several textural artifacts, including a “feathering” or “smearing” effect and/or distorted or diagonal image. “Layer nondifferentiation” involves consistently overly bright or dark components preventing discrimination of skin tissue layers, a baseline for echogenic comparisons. The artifact group of “part of tissue structure off scanned image” reflects lack of adequate area to evaluate hypoechogenicity and was combined with “reduced area for evaluation” for analysis.
Data analysis
To describe overall image quality, the full dataset of all images was used for evaluation. Use of all images obtained provides general information about the ability to quickly and efficiently obtain adequate quality images. The use of the best image per patient per day subset (with rating ≥3) provides information of the quality of the chosen best image to be used for HFUS evaluation and allows description of the incidence of image artifacts and their effect on image quality. 23
As this was a seminal study of HFUS image quality evaluation, there was no effect size to consider nor expectations with respect to variation to specifically determine sample size. For image artifact analysis, multivariable ordinal logistic regression was used to establish artifacts associated with reduced image quality. The five different Refined Rating Scale model groups (3.0/3.1, 3.3, 3.5, 3.7, 3.9/4.0) were treated as ordinal to provide a more robust analysis. The odds ratios for reduced image quality and their associated 95% confidence intervals were computed for each artifact. An experiment-wise alpha level was set to 0.05, and all computations were completed using JMP 10 and SASv9.2.
Results
Sample characteristics and images
One hundred fifty subjects were enrolled in the parent study, 137 subjects had HFUS images collected over all or some of the 7-day observation period. The majority of subjects were non-Hispanic and male (n = 77, 56%), but were generally evenly divided between race (Table 3). Mean APACHE III scores and Braden scores on admission are also shown in Table 3.
Subject demographics
ICU, intensive care unit; MRICU, medical respiratory intensive care unit; NSICU, neuroscience intensive care unit; STICU, surgical trauma intensive care unit.
For the 137 subjects with images, a total of 1761 images were collected for initial rating (using the rating scale of 1 to 4) for a mean number of images per subject over the entire collection period of 12.9 (SD 6.05, range 1–33) and a mean number of images per patient per day of 1.6 (SD 0.2, range 0–7). There were 787 images for the best image per patient per day subset data, using one image per patient per day, selected for final rating and artifact analysis.
HFUS image quality
Of the full dataset of all 1761 images collected, 139 (8%) were rated 1 or 2, too poor to use for HFUS evaluation; the mean rating for this full dataset was 3.18. Figure 3 describes the frequency of each rating of the best image per patient per day subset of 787 images (using the Refined Rating Scale described above) by type of artifact.
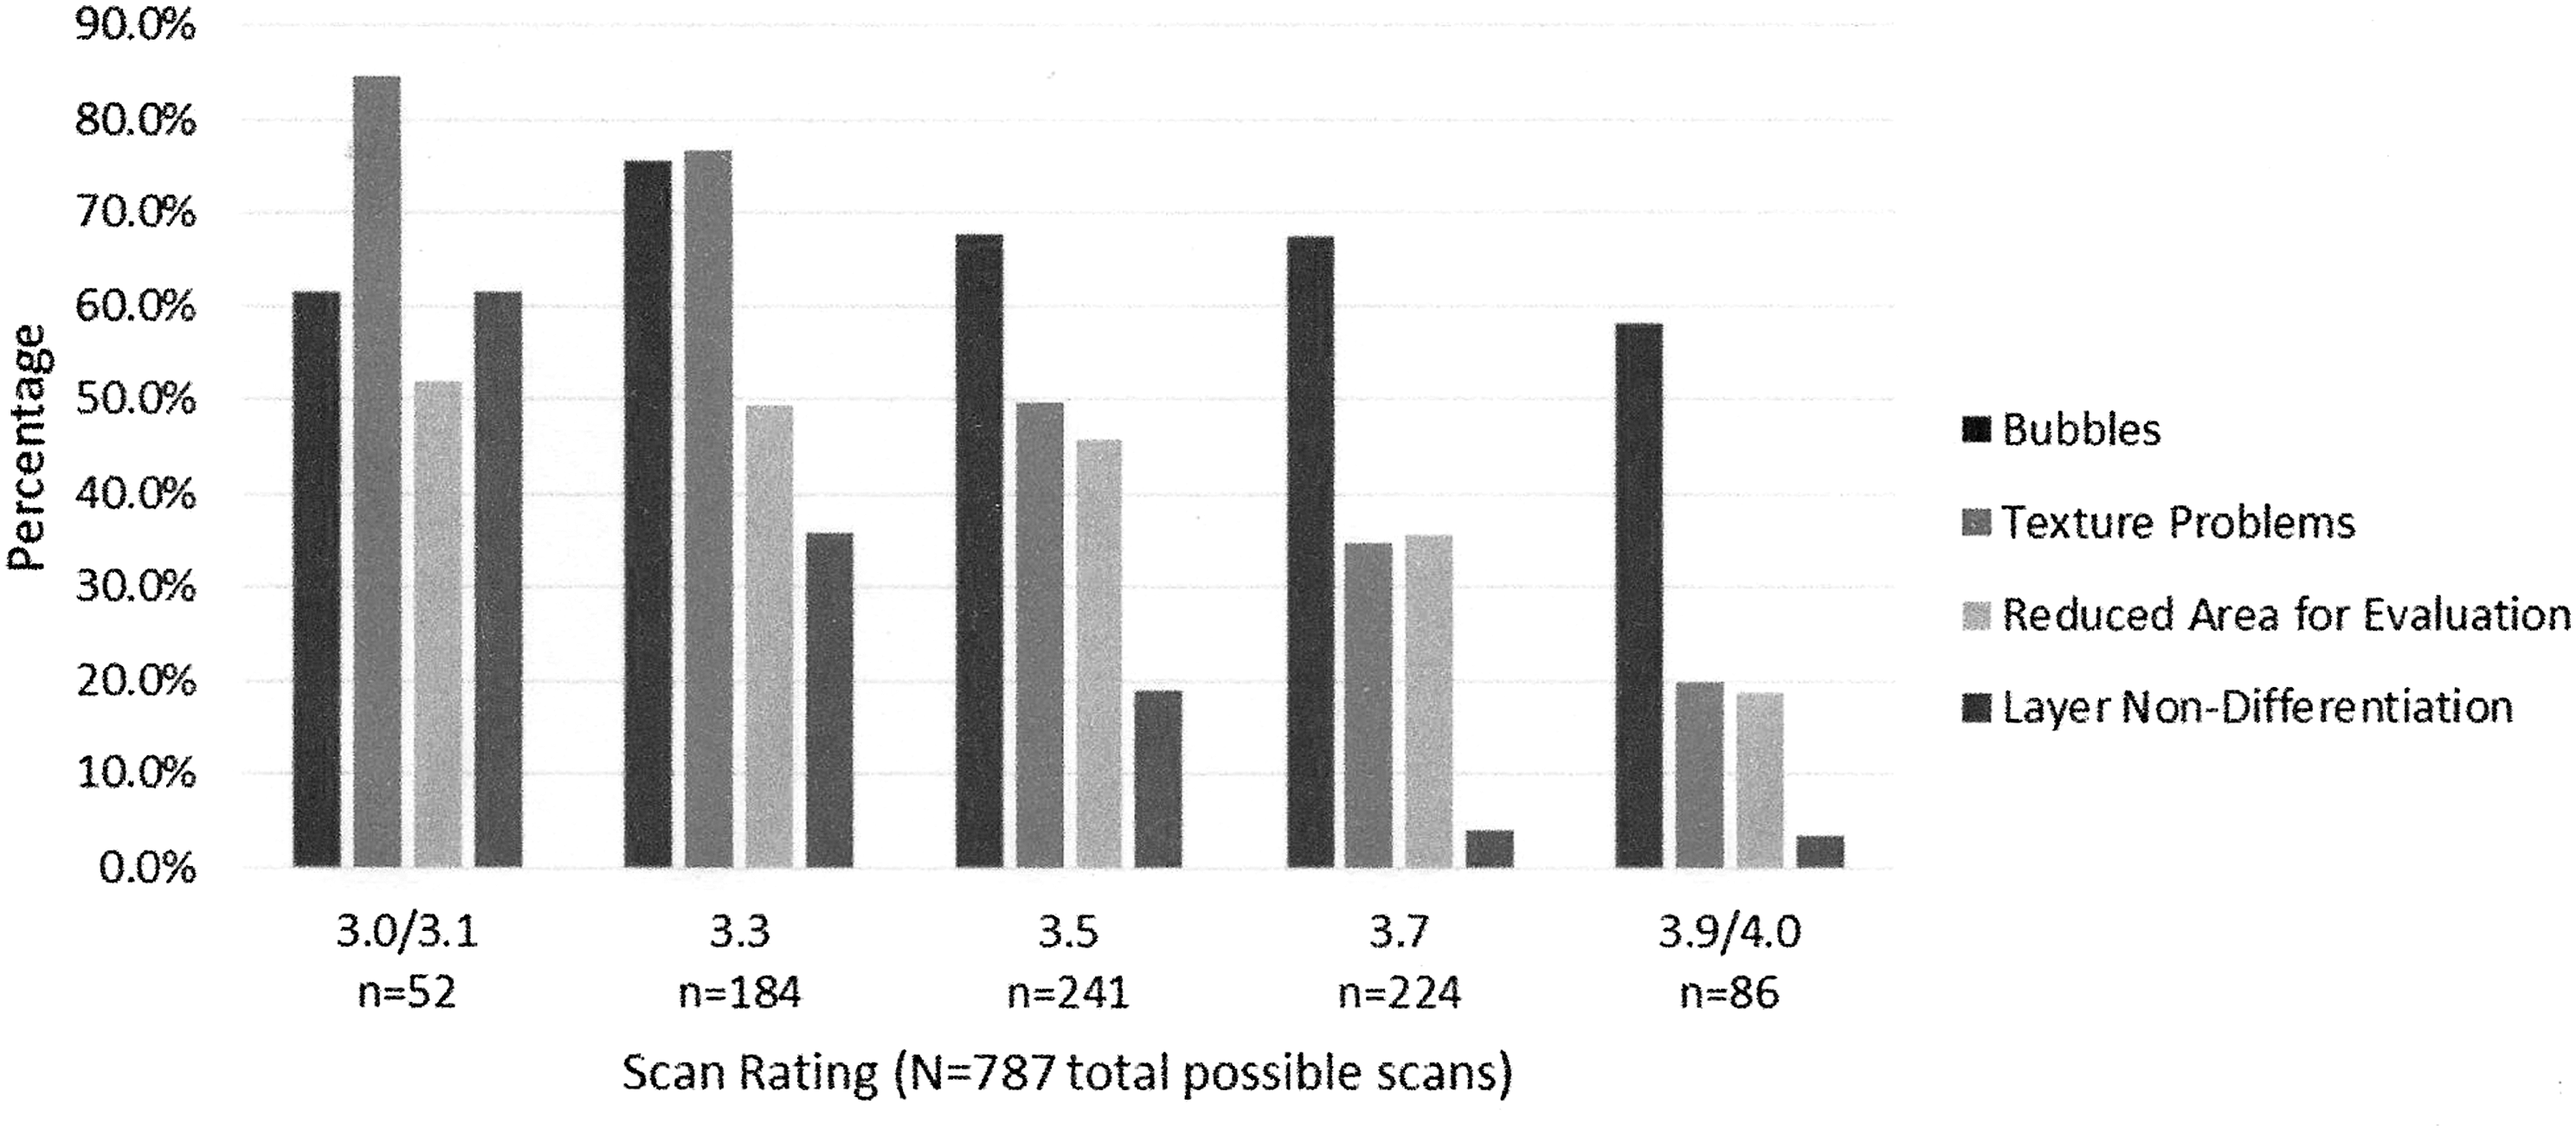
Percentages of artifacts occurring within each category of image ratings, using the best image per patient per day.
On average, operators collected 2.3 images per patient per day to acquire at least one good image. Of the best image per patient per day subset, 551 (70%) had quality ratings ≥3.5 (median 3.5, mean 3.53, SD 0.23), and the majority of images were rated 3.5 (n = 241, 30.6%) to 3.7 (n = 224, 28.5%), with a few at the lower and upper ratings.
Incidence of HFUS image artifacts in best image per patient per day subset
Image artifacts were found frequently (83% of images) with “bubbles” (68%) and “texture problems” (50.8%), the most frequently encountered, while “reduced area for evaluation” was seen the least often encountered (Table 2). Of the 10 that were rated 4.0, 2 had artifacts, and the remaining 8 were free of any artifact. Of the 779 images with artifacts, “bubbles” were the most frequent (68%), and part of tissue structure off the scanned image was the least (1%). A greater number of “texture problems” were present with lower rated images, while bubbles were present in greater numbers in the higher rated images (Fig. 3). Overall, there was an average of 1.5 total artifacts per image.
HFUS image artifacts' effect on image quality
In the ordinal logistic model, all artifacts except “bubbles” had a significant effect on image quality (Table 4). “Layer nondifferentiation” was the most predictive of poor image quality increasing the odds of having a poor-quality image over five times followed by “texture problems” increasing the odds of a poor-quality image by almost four times. Higher order interactions were examined, and none was significant at 0.05 alpha.
Artifact type as predictors of poor image quality
CI, confidence interval.
Discussion
Critically ill patients are at high risk for PrIns. The use of HFUS images to identify inflammation associated with developing tissue damage may allow earlier identification of tissue changes to enhance early intervention. The use of HFUS technology is gaining popularity due to its noninvasive process and ease of use. Since a variety of clinicians may obtain and evaluate HFUS images, it is important that quality images are collected, and factors that may affect image quality are identified. However, limited data are available about the frequency of obtaining quality images and factors impacting image evaluation, especially in the critically ill. Highest quality images are obtained in patients who are able to position themselves to expose the skin facing upwards for greatest probe access and control as well as unrestricted time for probe adjustment by the operator. Quality images can be extremely difficult to achieve in critically ill patients due to the need to minimize patient repositioning and avoid interference with medical therapies in ventilated, critically ill, and frequently unstable patients. High-acuity patients require operators frequently to scan upwards to reach sacral areas under patients in low side-lying positions. This may negate HFUS ease of use assumptions, but HFUS still may be valuable to identify incipient PrIns. Identifying artifacts associated with reduced image quality assists the operator in rapidly recognizing the need to restart the entire scanning procedure immediately to obtain a quality image, improving evaluation and documentation of PrIns. Therefore, this study describes HFUS image quality as well as the incidence of HFUS image artifacts and their effect on image quality in critically ill.
With respect to image quality (rating) in all datasets, it was found that in general, sufficient quality HFUS images can be attained; operators with basic training generally collected good-quality images. However, operators with knowledge of the impact of specific artifacts on image evaluation could rescan immediately resulting in minimal or no missing data as well as highly evaluable images. Even with multiple operators scanning, despite position and time limitations, good and evaluable HFUS images were achieved. As described, all operators received periodic review with retraining to achieve quality image; this may not occur as often and monitored as closely in clinical settings. It is crucial that operator training be comprehensive and detailed with frequent quality checks by the investigator. Operators also gain experience with practice.
The incidence of HFUS image artifacts was frequent (83% of images). Although operators only saved the best images for later review, most had multiple artifacts, which still resulted in good-quality images. With the significant number of artifacts, however, even the least frequent artifact groups of “layer nondifferentiation” and “part of tissue structure off the image,” occurred 21% or less. “Bubbles” followed by “texture problems” were the most frequently encountered artifacts. Bubbles exist in only the area of surface gel producing a dark shadow obscuring all tissue layers below, rendering the image difficult or impossible for assessment. Correcting a bubble artifact requires starting the entire scanning procedure again from reapplication of the HFUS gel, which may not be possible due to time constraints, especially in the critically ill. It is likely that operators may have discarded more images with this artifact due to its tissue-masking effect. Texture problems generally make tissue evaluation difficult if not impossible as differences in texture must be appreciated to identify pockets of lower echogenicity indicating edema. “Texture problems” can largely be attributed to probe placement errors. Holding the probe motionless and at exact right angles to the skin surface on a critically ill, ventilated patient can be quite difficult. Although subjects were in side-lying or partially turned positions, the length of the probe made using low body turning angles difficult. Operator body position may be quite awkward at times to achieve good probe position with the operator's head sometimes upside down due to patient manipulation, ventilator equipment, medical devices, and patient high-acuity limitations. Although there was a higher incidence of “texture problems,” these can be corrected by careful probe adjustment and motionless scanning while observing the developing scan. Images with texture problems may have been retained if the issues were on the edges of scan. The relatively lower number of artifacts in the groups of “layer nondifferentiation,” “reduced area for evaluation,” and “part of tissue structure off image,” could be expected as these three groups are quickly identified as the scan develops, and a small, quick correction in probe technique could produce better quality HFUS images.
The investigation of artifacts' effects on image quality in critically ill subjects showed that all groups of artifacts were significant except “bubbles”. The greatest predictor for poor-quality image was “layer nondifferentiation,” as this artifact was found only in 7.3% of the good-quality scans. This artifact prevents the evaluator from forming an understanding of baseline echogenicity contrast of the entire image. In the assessment of each image, it is crucial to recognize the standard echogenicity between tissue layers to discern if darker density areas signaling the onset of inflammation are present. “Layer nondifferentiation,” “texture problems,” and “reduced area for evaluation” reflect categories that directly interfere with HFUS image evaluation and therefore scan quality. In contrast, “bubbles” were most frequently seen in the higher rated images on the edge of the image out of the direct field of interest.
There are several limitations to this study. The results may not be generalizable in all ICU settings because it was conducted in specific ICU populations of MRICU, STICU, and NSICU. We identified the presence but not scope of artifacts. Noting the degree of size or grading of artifacts was not undertaken and these could impact image quality scoring. It is important to note that evaluation is a subjective skill. Experience in evaluating images is required; results could be significantly different with evaluators with less experience.
• We found that good-quality images are achievable in the study of ICUs, and although frequent artifacts are present in HFUS images, in better quality images, they did not interfere with evaluation of HFUS echogenicity.
• Artifacts that operators need to recognize quickly during scanning due to their adverse effect on HFUS evaluation are “layer nondifferentiation,” “texture problems,” and “reduced area for evaluation.” “Layer nondifferentiation” has the greatest impact on achieving a quality image. With these artifacts, the technician should rescan the area immediately to obtain an appropriate quality image.
• Bubbles/Shadows are frequent but less significant if not within the evaluation area.
Innovation
HFUS image acquisition and evaluation for pressure injury identification are still in the development phase with respect to research use. Although artifacts are omnipresent in HFUS images, we found that quality images were not difficult to achieve with thorough and detailed training. Quickly recognizing artifacts that significantly affect image quality during scanning will result in higher quality HFUS images collected for research and clinical applications. HFUS images can be used in documentation of tissue injury at a specific timepoint. As collection of images/data can be time sensitive, our data inform clinicians, which artifacts have the most impact requiring immediate rescanning, to prevent omissions in evaluation and documentation during later review and analysis.
Footnotes
Acknowledgments and Funding Sources
This study was supported by funding from NIH, NR010381 (Grap PI).
The authors acknowledge Mr. Harold M. Messler for technical assistance.
Author Disclosure and Ghostwriting
For all authors: No competing financial interests exist. The content of this article was expressly written by the authors listed. No ghostwriters were used to write this article.
About the Authors