




Abstract
Objective:
The objective of this study is to characterize breath-hold (BH)-induced oxygenation changes in diabetic foot ulcers (DFUs) and develop an oxygenation flow index (OFI) to discern nonhealing from healing DFUs.
Approach:
The imaging approach utilizes an innovative BH stimulus that induces vasoconstriction and measures for altering oxygenation flow in and around the tissues of DFUs and controls. The modified Beer–Lambert law was utilized to calculate hemoglobin-based spatiotemporal oxygenation maps in terms of oxygen saturation.
Results:
We found controls had synchronous BH-induced oxygenation changes across the dorsal (OFI: 29.0%) and plantar (OFI: 57.6%) aspects of the foot. Nonhealing DFUs, however, had less synchronous BH-induced oxygenation changes (OFI <28%). In addition, two complicated healing DFU cases, or cases with underlying issues or poor long-term healing outcomes, were observed to have OFIs <28%.
Innovation:
An OFI was developed to differentiate nonhealing DFUs from healing DFUs using a single, noncontact, near-infrared optical scanner for spatiotemporal oxygenation monitoring. The OFI has potential to provide immediate feedback on the microcirculation in DFUs, through hemoglobin-based oxygenation parameters.
Conclusion:
A preliminary threshold (OFI <28%) could differentiate nonhealing and complicated DFUs from healing DFUs. The overall oxygenation flow pattern was less synchronous (or the OFI value reduced) in the nonwound areas of the feet that were nonhealing. In other words, the reduced OFI value (<28%) in the entire foot, excluding the wound region is a possible indicator that the wound may not heal.

INTRODUCTION
Globally, nearly 578
According to the Wound Healing Society, a 50% reduction in wound size by 4 weeks of treatment is the accepted standard of improvement for a treatment. 4 Any reduction below this value results in the reevaluation of the wound with alternative treatments considered. 5 –7 Regardless of treatment approach, oxygen supply to DFUs is a key limiting factor for successful healing due to increased demand for reparative processes, such as: cell proliferation, bacterial defense, angiogenesis, and collagen synthesis. 8 Prognostic imaging of tissue oxygenation is, therefore, essential 9 to assess if the treatment approach is effective in improving oxygen supply to wounds (for enhancing healing rates).
Transcutaneous oximeter (TCOM) is the gold-standard approach to assessing the oxygen supply to DFUs by measuring the partial pressure of diffused oxygen beneath the surface of the skin. 4 TCOM is contact based and uses probes positioned in the periwound region for point location assessments of oxygenation. 10
Various optical modalities have been used to assess oxygenation or the extent of perfusion to DFUs. Perfusion-based measurements of blood flow, in terms of blood flow velocity, can be obtained using laser doppler flowmetry and laser doppler imaging. However, laser doppler-based techniques cannot determine the extent of tissue oxygenation in and around the wound bed. On the contrary, modalities such as hyperspectral imaging (HSI), multispectral imaging (MSI), and near-infrared spectroscopy (NIRS) measure tissue oxygenation in and around the wound bed. While HSI and MSI provide two-dimensional (2D) spatial maps of tissue oxygenation (in terms of oxygen saturation), NIRS techniques to date have been focused on point-based measurements of hemoglobin concentrations (in terms of oxy-, deoxy-, total hemoglobin, and oxygen saturation).
In spite of these various emerging modalities to assess healing status of DFUs, TCOM remains most recommended modality to assess healing potential in DFUs. 4 Past studies have demonstrated TCOM to be a good indicator of healing across a range of ulcers. 11 It has shown to be a good measure of assessing revascularization surgeries in diabetics 12 and at assessing healing in DFU. 13 –15
In a recent study that investigated the ability of TCOM and HSI to predict wound healing, one team found TCOM to be a better predictor of healing. 15 This is possibly because the gold standard TCOM assesses how the vasculature responds to an oxygenation demand by inducing tissue heating (or vasodilation) to measure for partial pressure of oxygen under the skin. Unlike TCOM, optical imaging modalities such as HSI, MSI, and NIRS do not alter the extent of oxygenation to assess how the vasculature responds. This is important because physiological microcirculatory abnormalities exist in all patients with diabetes, even in the absence of peripheral arterial disease. 16,17
Microvascular impairments in the foot begins in the prediabetic phase and culminates in the microvascular dysfunction seen in patients with DM. 18 The impairments are mediated by endothelial and neurovascular dysfunction that inhibits the foot's ability to regulate oxygenated blood flow through vasoconstrictive and vasodilative mechanisms. 17,19 Furthermore, physiological microcirculatory abnormalities have been reported; the most prominent being thickening of the capillary basement membrane. 20 The basement membrane affects cellular functions such as: vascular permeability, cellular adhesion, and proliferation. 21 While a thickened basement membrane has been widely accepted to not be the primary cause of DFUs, it has been accepted that it does intensify the effects of microvascular dysfunction. 19 Hence, it is vital to assess the extent of blood flow or tissue oxygenation changes in response to a vasoconstrictive or vasodilative mechanism in DFUs.
Recently, we developed an NIRS-based optical imaging device, or a near-infrared optical scanner (NIROS) that can perform spatiotemporal oxygenation mapping of tissues. NIROS performs noncontact imaging to obtain 2D spatial and dynamic maps of tissue oxygenation (in terms of oxy-, deoxy-, total hemoglobin, and oxygen saturation).
The imaging approach utilizes an innovative breath-hold (BH) stimulus that induces vasoconstriction and measures the altering oxygenation flow in and around the tissues. The BH-induced oxygenation changes can be used as a stimulus to assess the ability of peripheral vasculature 22 –26 to respond to an oxygenation demand in diseased tissue models such as DFUs. 27 Thus, the measurement of tissue oxygenation using our approach is similar to that of TCOM, which also assesses how the vasculature responds in DFUs. The added advantage of our technique is the ability to image the entire wound region, unlike discrete point measurements by TCOM. Additionally, the overall imaging time using our imaging approach is <2 min in comparison to the >30-min procedure using TCOM.
Breath holding as a potential stimulus to assess for extent of oxygenation flow changes has been applied in our prior studies. 27,28 Our past pilot studies have demonstrated that the oxygenation flow patterns differed in the feet of the controls and DFU cases 27 and was also shown to be further altered in the feet of nonhealing DFUs. 28 Hence, the objective of our study is to characterize BH-induced oxygenation changes in DFUs and develop an oxygenated flow index to discern nonhealing from healing DFUs.
INNOVATION
The optical imaging modalities currently used to image DFUs do not assess the extent of change in blood flow (or perfusion) or tissue oxygenation in response to any of the vasoconstrictive or vasodilative mechanisms as in the gold-standard TCOM. We developed an innovative NIRS-based optical imaging technique that performs spatiotemporal mapping of tissues by inducing vasoconstriction and measuring the altering oxygenation flow in and around the tissues and an oxygenated flow index that differentiates nonhealing DFUs from healing DFUs.
CLINICAL PROBLEMS ADDRESSED
Our innovative technique images in <2 min in comparison to 30+ min procedure using the gold-standard TCOM to obtain similar vasculature response in DFUs. The oxygenated flow index has potential to provide immediate feedback on the microcirculation in DFUs, through hemoglobin-based oxygenation parameters, and help clinicians better cater to the wound treatment process.
MATERIALS AND METHODS
Subject recruitment
In this study, both control subjects and subjects with DFUs were recruited. Three control subjects were recruited at Florida International University (IRB #13-0092) with written consent. The recruited control subjects (between 18 and 30 years of age) were nondiabetic subjects and without injuries to the foot. Ten subjects (between 40 and 67 years of age) with DFUs were recruited (as provided in Table 1) at the University of Miami Wound Care Center (IRB#20140672) with written consent and Health Insurance Portability and Accountability Act (HIPAA) authorization for their DFU-related medical records.
A pivot table of the demographic information of the recruited subjects
Represent control subjects.
DFU, diabetic foot ulcer.
Instrumentation
Near-infrared optical scanner
An in-house-built continuous-wave NIROS was utilized to conduct noncontact imaging of the feet, 27 and schematic provided in Fig. 1. Diffuse reflectance signals at near-infrared wavelengths (682 nanometer [nm] and 826 nm) were acquired at 1 hertz frequency using NIROS to obtain 2D spatiotemporal maps of the imaged tissue in response to a BH stimulus (as described in the Imaging protocol and data acquisition section). Further details of the NIROS device are provided elsewhere. 27 The detected diffuse reflectance near-infrared (NIR) signals at both the wavelengths (682 and 826 nm) were used to obtain hemoglobin concentration and tissue oxygenation flow maps (as described in the Image analysis section).

Schematic of NIROS utilized for noncontact imaging of control and DFU subjects. Arrows indicate the flow of information throughout the NIROS components. CMOS, complementary metal-oxide semiconductor; DFU, diabetic foot ulcer; LED, light-emitting diode; NIROS, near-infrared optical scanner.
Imaging protocol and data acquisition
The recruited subjects were imaged using a 120-s-long BH paradigm, as illustrated in Fig. 2. The paradigm consisted of an initial rest (40-s), end-exhalation BH (20-s), and recovery phase (60-s). All subjects were seated in the fowler position and their feet imaged. Before imaging the feet, a calibration sheet was imaged to obtain a reference image 29,30 at each imaging wavelength. An electronic laboratory notebook was not used for the current study.

Schematic of the 120-s-long BH paradigm. The paradigm consisted of 40-s of initial rest, 20-s of end-exhalation breath holding, and 60-s of recovery. BH, breath-hold.
Control subjects
The left foot was imaged thrice in response to BH paradigm, with 15-min rest between repetitions. NIROS was positioned 15 centimeters from the foot during the imaging studies, and both the dorsal and plantar were imaged thrice in each subject.
DFU subjects
DFU subjects were imaged in response to BH either once or across weeks during their treatment process (Table 2). The distance between NIROS and the DFU was measured during the first visit and maintained across subsequent visits in the same subject. The DFU wound size and wound healing status was obtained from the clinician. Unless noted otherwise by the attending clinician, wound healing was defined as a reduction in wound size from the prior week, and nonhealing was defined as an increase in wound size from the prior week. Data acquired from consecutive weeks with significant motion artifacts during imaging were discarded from analysis. Thus from 10 DFU subjects, a total of 17 labeled cases of healing (12 cases) or nonhealing (5 cases) DFUs were acquired during our study (as shown in Table 2).
Diabetic foot ulcer imaging timeline across the 10 recruited subjects imaging once or multiple times during their treatment
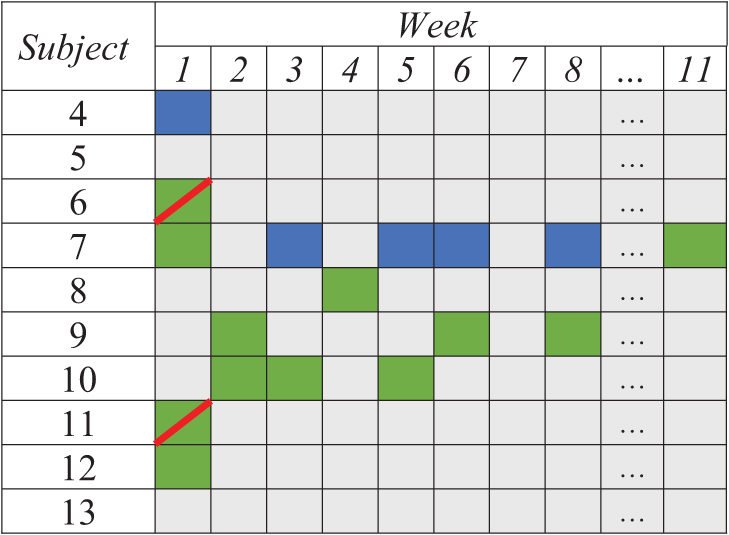
Weeks were numbered with respect to their enrollment date, where week 1 is their first week of enrollment and imaging. Gray indicates weeks where the subject was either not imaged or significant motion artifacts was present that the imaging data were not available for further analysis. The weeks when imaging was performed is shaded in green and blue. The boxes were shaded green for DFUs assessed as healing and blue for those that were assessed as nonhealing (as determined by the clinical team). Green with a diagonal red line is healing cases that were later identified to either have a complicated (infected) DFU during that week of imaging or had poor long-term healing outcome.
Image analysis
The time-varying spatial maps of detected diffuse reflected NIR signals across the 120 s of imaging were spatially coregistered with respect to the first image acquired at t = 0 s. An intensity-based image coregistration algorithm was used and the geometric transformations during image coregistration were limited to translation and rotation.
Spatiotemporal tissue oxygenation maps
The modified Beer–Lambert's Law was used to calculate the effective hemoglobin-based oxygenation map (in terms of oxy, ΔHbO, and deoxyhemoglobin, ΔHbR) spatially and across time (spatiotemporal). 27,29,30
Oxygen saturation (or tissue oxygenation)-based measurements have suggested to be a good indicator of wound healing.
15,31
Herein, spatiotemporal maps of effective oxygen saturation (ΔStO2) at each pixel location (x,y) and time point (t) was calculated using equation (1), as redefined in the past.
32,33
During image analysis, regions outside the tissue region and regions encompassing fiducial markers were manually segmented out of the spatiotemporal analysis to minimize background noise. Figure 3A depicts an example oxygen saturation-based spatial map of the imaged foot at a given time point.
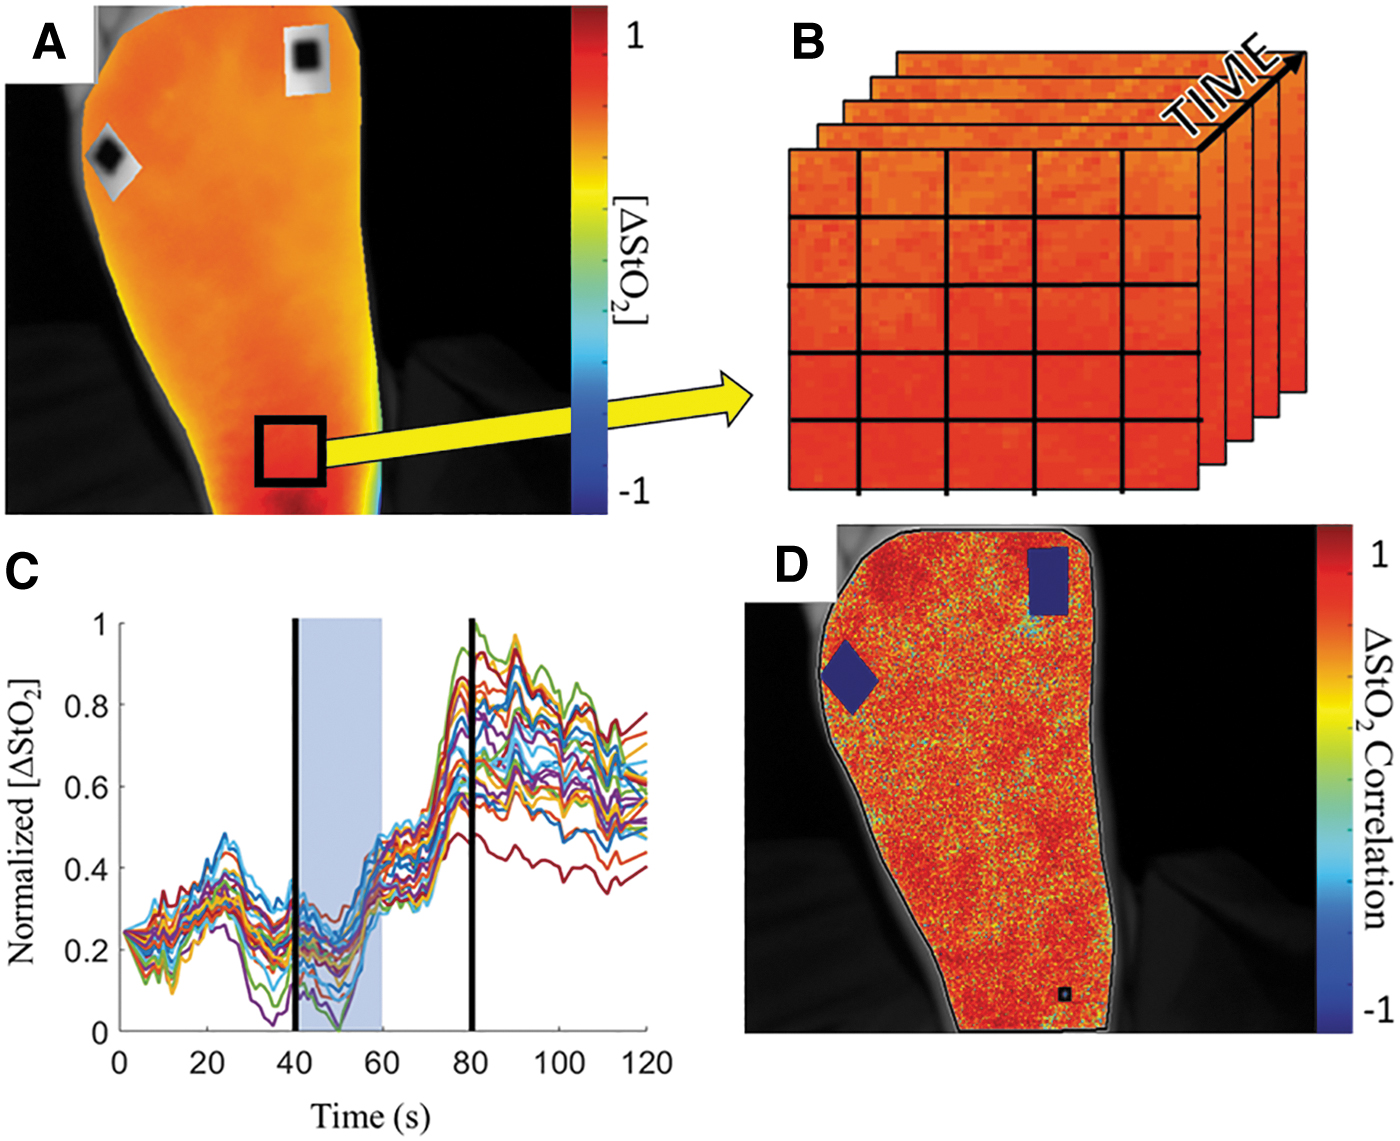
Pearson-based correlation analysis approach.
Tissue oxygenation-based flow correlation maps
The time-varying 2D spatial maps of ΔStO2 were further analyzed to obtain flow correlation maps. Initially, the Savitzky–Golay filter was applied to each pixel of the 2D ΔStO2 maps to smoothen the time-varying signal and reduce noise. The changes in ΔStO2 were distinct during the 20-s of the BH phase and within the first 20-s of the recovery phase, as determined from our prior studies in optimizing the BH paradigm.
28
The flow correlation maps of tissue oxygenation (i.e., ΔStO2) were thus generated using only these 40-s period of the 120-s BH paradigm. Pearson-based linear correlation analysis was carried out at each pixel of the tissue oxygenation map using equation (2).
where PCC(x,y) is the Pearson's correlation coefficient at every imaged pixel (x,y),
Oxygenation flow index
An oxygenation flow index (OFI) was estimated as the median value of the 2D Pearson-based correlation coefficient [PCC(x,y)] distribution for each imaging case. The extracted median value of PCC(x,y) distribution was used as a measure to assess the overall extent of synchrony or asynchrony in the tissue oxygenation flow across the imaged tissue region in each case. The median tends to reflect the middle position of a distribution and is not susceptible to skewness 34 unlike the average values.
OFI analysis in control subjects
Unlike in DFU cases, control subjects do not have wounds to guide reference region selection. Hence, the median of the PCC(x,y) distribution was calculated thrice using correlation maps that had a reference region selected medially in the distal, middle, and proximal region of the foot. The three median PCC(x,y) values were averaged to obtain the OFI for each imaged case in control subjects. Using multiple reference region locations mitigates subjectivity in region selection in control subjects with no wounds.
Imaging was repeated thrice in each of the three recruited control subjects, who were imaged on either side of their left foot (dorsal and plantar) in response to the BH paradigm. The OFI was further averaged across the three repetitions in each subject and imaged side of the foot. The Kruskal–Wallis test was performed to test the null hypothesis that there was no statistically significant difference in the OFI across the three controls and for each imaged side of the foot (dorsal and plantar) at significance level of alpha = 0.05.
Receiver operating characteristic analysis
A receiver operating characteristic (ROC) analysis was conducted to statistically assess the predictive capability of the OFI in DFU cases. In the current study, OFIs were calculated from the immediate background region of the DFU and the whole imaged tissue region. In addition, two healing cases were imaged that were later identified to be complicated healing cases—or cases that had underlying issues or poor long-term healing outcome. Several permutations of the ROC analysis were conducted to assess the sensitivity and specificity of the OFI to distinguish healing from nonhealing DFUs.
RESULTS
Tissue oxygenation flow changes in control subjects
Tissue oxygenation (ΔStO2) flow correlation maps were determined for all control subjects and across all repetitions. A sample correlation map of the plantar (using the proximal reference) and dorsal (using the middle reference) side of the foot for each control subject is given in Fig. 4. Correlation maps of the segmented regions of interest were overlaid onto the grayscale-detected NIR images. For each map, it was observed that the foot had a similar degree of correlation with respect to the selected reference (black circle). The distinct blue squares are the segmented out fiducial markers. Overall, the plantar side of the foot was more positively correlated (red in the color bar) than the dorsal side with respect to the reference regions. The positive correlation represents a synchronous oxygenated flow in response to the BH paradigm (within the 40-s time range as described earlier).
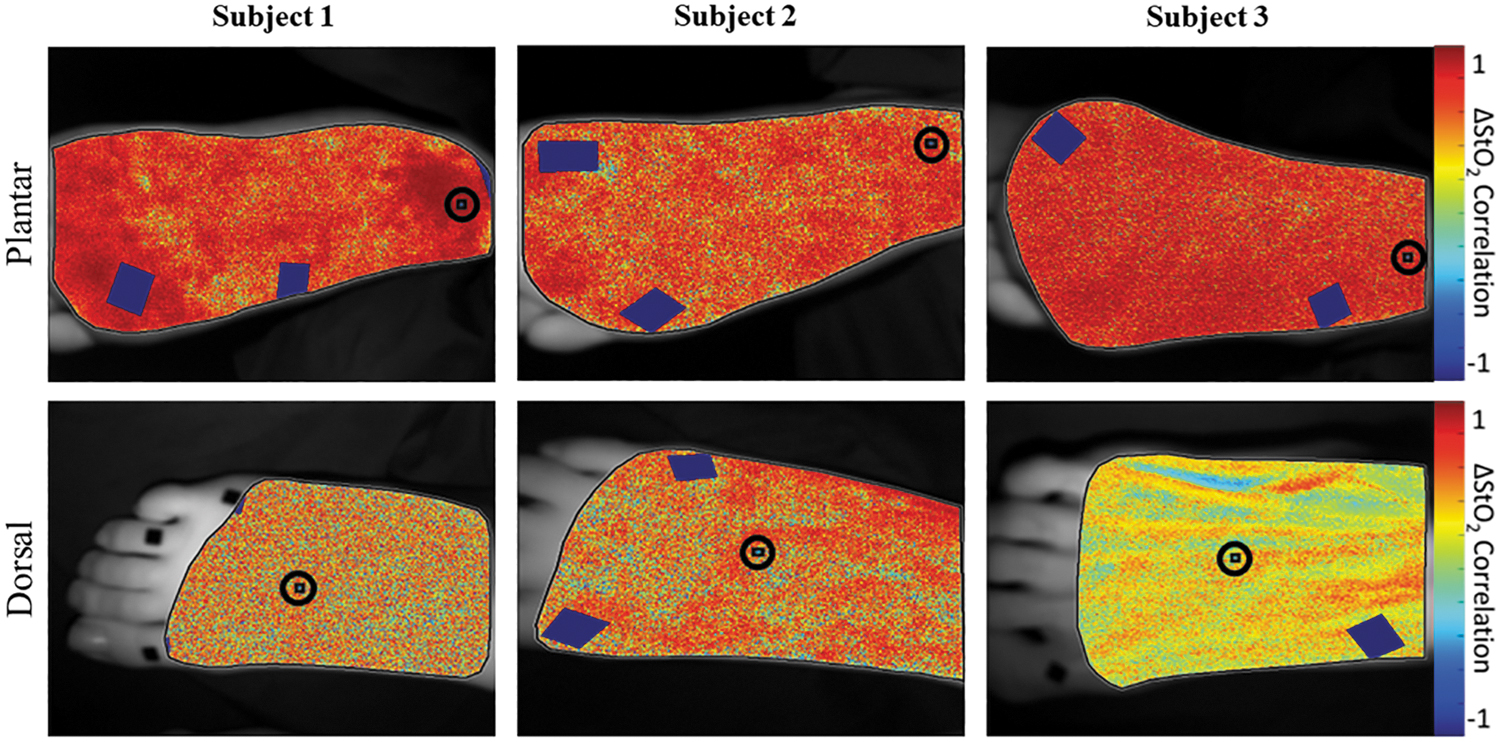
Correlation maps in terms of ΔStO2 for control subjects (case 1–3) acquired from one repetition of dorsal and plantar imaging. Blue squares are segmented out fiducial markers. The selected reference region is demarcated by an encircled black square within an encircled boundary. The color bar for each map ranges from +1 (red) to −1 (blue). Red areas indicate regions of synchronous oxygenation changes with respect to the reference region (i.e., positive correlation), whereas blue areas indicate regions of asynchronous oxygenation changes (i.e., negative correlation). ΔStO2, effective oxygen saturation concentration.
The OFI across each repetition, imaged side and control subject is given in Table 3. The average OFI was 57.56% ± 23.3% and 29.0% ± 14.4% across all repetitions and control subjects when imaged on the plantar and dorsal side, respectively.
Tabulation of the oxygenation flow index values calculated for each repeated (Rep) measure across each control subject and each side of the foot (dorsal and plantar)
OFI, oxygenation flow index.
The Kruskal–Wallis test results revealed no significant difference in the OFI between the controls when imaged on the dorsal (p = 0.875) or the plantar (p = 0.561) side of the foot. Overall, it was determined that there was not a significant difference in OFI between the dorsal and plantar aspect across all subjects (p = 0.236). Thus, control subjects with no wounds had similar (and positive) Pearson's correlation coefficient ranges, demonstrating an overall synchronous oxygenation flow as a typical response to BH paradigm.
Tissue oxygenation flow changes in DFU cases compared with controls
While the OFI for control subjects were calculated based on median of PCC(x,y) of the entire imaged ROI, OFI in DFUs were calculated two different ways. In the first approach, the median of PCC(x,y) distribution of the entire foot region was used to calculate OFI to assess the flow synchrony against controls. In the second approach, a portion of the immediate background tissue nearest to the wound and periwound region, as traced by clinicians, was used to calculate the OFI. The immediate background region was defined as the tissue region outside the periwound boundary, but within the area consisting of a two-times dilation (magnification) of the periwound boundary. The immediate background region (excluding the wound and periwound region) was selected to determine how synchronous was the oxygenated flow to the periwound and wound region between healing and nonhealing wounds.
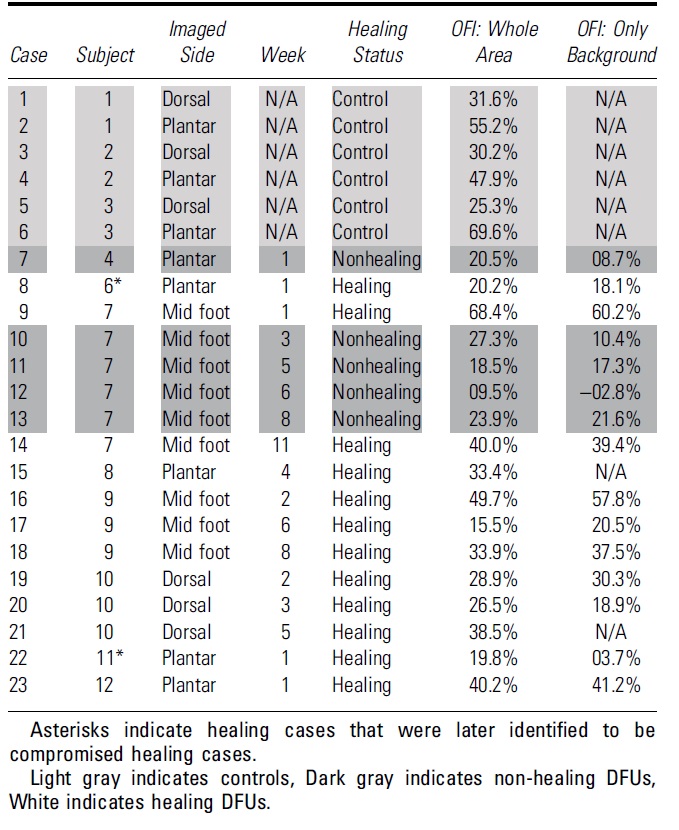
The OFI values for all imaged cases are given in Table 4. For cases 15 and 21, the wound and periwound traces were not available as the wound healed. Hence, OFI of only the whole imaged map is provided.
Oxygenated flow index values across all diabetic foot ulcer and control cases
Whole map OFIs
A scatter plot of the OFIs calculated from the whole map and background region, across all cases, is given in Fig. 5. It was observed that the OFI values for nonhealing DFUs (on the plantar side) was <28%. Of the 12 healing DFU cases (on the plantar or dorsal sides), 8 cases had OFIs >28%. Only 4 cases (cases 8, 17, 20, and 22) had OFIs <28%. Of these four cases three DFUs were on the plantar side and only one (case 20) was on the dorsal side. Plantar-side OFIs from controls were notably higher than OFIs extracted from nonhealing DFUs. Of the midfoot/plantar side healing DFU cases, only two cases came within range of plantar side control cases. It was observed that dorsal-side healing DFUs and controls had a similar range of OFI values.

Scatterplot of
Background region OFIs
A scatter plot of the OFI values (accounting for only the background regions away from the wound) across DFU cases is given in Fig. 5. From this background region based OFI values, it was observed that OFI <22% in all nonhealing cases and the same four healing cases (cases 8, 17, 20, and 22).
ROC analysis of the OFI
Table 5 details the results of the ROC analysis using the permutations described in the materials and methods section. When using the immediate background region to calculate OFIs, a 26% OFI threshold yielded 100% sensitivity. However, the specificity improved to 75% with a maximum area under curve (AUC) of 96.4% when nonhealing and complicated cases were grouped together (third row in Table 5).
Receiver operating characteristic analysis results of healing versus nonhealing diabetic foot ulcers

DISCUSSION
OFI in control subjects
The OFI values estimated from the dorsal and/or plantar aspects of the foot in control subjects were statistically not different. However, the average OFI of the dorsum side of the foot was lower (29.0%) than the plantar side (57.6%). Anatomical differences, such as layer thickness and vasculature depth, may affect the measured flow synchrony between sides of the foot.
Skin thickness (epidermal+dermal layer) is affected by a multitude of factors such as age, gender, anatomical location, and ethnicity. 35 –37 In general, however, epidermal thickness on the sole of the foot is thicker than the dorsal side of the foot 38,39 due to the presence of the stratum lucidium layer used to protect the sole of the foot from damage. 40 Furthermore, the presence of superficial structures under the skin may affect the oxygenated flow measurements. In one control subject (subject 3), the outline of their tendons was visually apparent from the surface of the skin. In addition, veins located on the dorsum of the skin are among the most superficial veins in the body. 41
The combination of relatively thin skin and superficial vascular structures on the dorsum may have allowed for NIR light from NIROS to reach the underlying vascular structure. Thereby, it captured oxygenation information from the hemoglobin that diffused throughout the tissue and the blood-rich vasculature.
OFI in DFUs versus control cases
All of our nonhealing DFU cases were located on the plantar or midfoot and had distinctly lower OFI values when compared with controls. The OFIs acquired from nonhealed DFUs were <28% when calculated using the whole map, or when only the background region was considered. In addition, six of the nine healing plantar or midfoot DFUs had greater OFIs than the nonhealing DFUs. In other words, the OFIs in non-healed DFUs were always at the lower end than most of the healing DFUs. These findings were observed regardless of whether or not the OFI was calculated using the whole map or immediate background region alone.
Of the four healing DFU cases (cases 8, 17, 20, and 22) with OFIs below 28%, or depicting nonhealing, cases 8 and 22 were determined to be complicated. DFU related to case 8 indicated a poor healing outcome. In 3-month increments following their completion, the patient had: vascular bypass surgery to the DFU leg, followed by osteomyelitic bone resection of the DFU, and finally transmetatarsal amputation of the DFU foot. Case 22 was clinically determined to have an infected DFU at the time of imaging. Based on these results, evidence suggests that low OFIs in clinically assessed healing cases may reflect a compromise in oxygenated flow to the foot either at the time of clinical inspection or an underlying compromise that may hinder overall healing.
DFUs most commonly occur on the plantar side of the foot as the increased pressure and friction increase the chances of injury. In one cohort study consisting of 1,229 DFU cases, it was found that ∼58% of cases occurred on the plantar side of the foot. 42 During this study, only three dorsal side DFU cases were imaged and clinically assessed as healing. Two of the three healing DFUs (on the dorsal side) had similar OFI range as the control subjects (imaged on the dorsal side). Due to a small sample size with DFUs on the dorsal side, extensive inferences cannot be drawn. The dorsal side of the foot is home to superficial vascular structures lying under relatively thin skin. Given the similar OFI range of healing DFUs and controls on the dorsal side, evidence suggests that dorsum and plantar side OFIs may have their own typical range.
ROC analysis of the OFI to detect issues in DFUs
From whole and immediate background tissue regions, it was demonstrated that healing DFUs had greater OFI values compared with their nonhealing counterparts. The low OFIs calculated from the whole tissue region of nonhealing DFUs may indicate that the overall oxygenated flow to the foot is compromised. Results of the ROC analysis supports these inferences. It was determined that an OFI threshold of 26–28% could detect nonhealing (and complicated healing) cases with 100% sensitivity across the recruited subjects. However, as noted earlier, the best ROC performance (i.e., 100% sensitivity, and 75% specificity, and >96% AUC) was observed when using OFIs calculated from the immediate background region (third row in Table 5).
Wound healing utilizes wound contraction to reduce tissue defects by growing new tissue at the wound boundary that expands toward the center of the wound. Hence, comparing the OFI of only the immediate background regions of the wound seems to improve the overall ROC analysis results.
In conclusion, an OFI threshold was developed to differentiate nonhealing DFUs from healing DFUs using typical synchrony in BH-induced oxygenation changes. Our noncontact NIROS was used to image BH-induced oxygenation changes in the feet. While the current results indicate that the perfusion response to the stimulus differs between groups, various factors, such as age, may play a role in influencing the perfusion response. Measurements from the dorsal side of the foot may be more subjective to the effects of age since vasculature tends to be more prominent in older individuals as compared with their younger counterparts. In these cases, monitoring the OFI changes with respect to baseline (first week of imaging) on a weekly basis may yield a timelier indication onto the healing status of the wound. As such, the current ROC analysis is preliminary and extensive longitudinal studies (across with the healing status) will be carried out on a larger cohort of recruited DFU subjects.
Hence, future work will consist of recruiting a larger cohort monitored longitudinally to assess the effectiveness of using an oxygenation flow-based parameter (OFI) to differentiate a DFU that can potentially heal or not heal.
KEY FINDINGS
Control subjects with no wounds have an overall synchronous oxygenation flow as a typical response to BH paradigm.
The overall oxygenation flow pattern was less synchronous (or the OFI value reduced) in the background feet regions of nonhealing cases, indicating that oxygenated flow to the wound is compromised.
All nonhealing DFUs had OFIs <28%, indicating that the oxygenated flow to the foot, as a whole, may be compromised as well.
Footnotes
ACKNOWLEDGMENT AND FUNDING SOURCES
The authors would like to acknowledge and thank the nursing staff at the University of Miami Hospital's Wound Healing, Ostomy, and Hyperbaric Medicine Clinic. Research reported in this publication was supported by the National Institute of Diabetes and Digestive and Kidney Diseases of the National Institutes of Health DiaComp Award (5U24DK115255-02) and F31 Predoctoral Fellowship F31DK125153.
Coulter Undergraduate Research Experience (CURE) program in the Department of Biomedical Engineering at FIU.
AUTHORs' CONTRIBUTIONS
K.L.: Conceptualization (support), methodology (lead), investigation (lead), formal analysis (lead), software (lead), validation (lead), visualization (lead), writing (original draft), writing (review and editing—equal), and funding acquisition (lead). A.T.: Investigation (support). I.G.: Formal analysis (support), software (support). A.E.: Investigation (support), formal analysis (support), and validation (support). T.Z.: Investigation (support) and validation (support). J.E.L.: Investigation (support) and validation (support). M.A.R.: Investigation (support) and validation (support). H.L.-T.: Investigation (support) and validation (support). W.W.: Formal analysis (support) and validation (support). R.S.K.: Funding acquisition (lead), supervision (support), and writing (review and editing—support). A.G.: Conceptualization, funding acquisition (lead), supervision (lead), and writing (review and editing—support).
DISCLAIMER
The content is solely the responsibility of the authors and does not necessarily represent the official views of the National Institutes of Health.
AUTHOR DISCLOSURE AND GHOSTWRITING
There is no conflict of interest with regard to the research in the current article. The corresponding author's university (Florida International University) holds patents on the described NIROS technology and currently filing patents on the proposed innovative techniques related to OFI. The content of this article was expressly written by the authors listed. No ghostwriters were used to write this article.
ABOUT THE AUTHORS
Mr. Kevin Leiva, was a Doctoral student in our Optical Imaging Laboratory (OIL) at Florida International University (FIU) and graduated in December 2022. Kevin received NIH predoctoral (F31) fellowship to develop and test near-infrared optical imaging technologies for DFUs. Alexander Trinidad and Isabella Gonzalez, both are undergraduate research assistants in OIL at FIU and graduated in Spring 2022. Dr. Aliette Espinosa, is a Certified Clinical Research Professional since 2005 and worked for the University of Miami since 2003 in the Clinical Research Unit. Dr. Thomas Zwick, is a Board-Certified American Board of Podiatric Surgery Reconstructive Surgery of the Foot and Ankle Wound Care and Limb Salvage of the Lower Extremity since 1994. Dr. Jason Edward Levine, is an Assistant Professor of Clinical Medicine, Division of Endocrinology, Metabolism and Diabetes, Podiatric Medicine and Surgery since 2017. Dr. Magaly Adelaida Rodriguez, is a clinician specializing in preventive medicine, vascular surgery, general surgery, and undersea and hyperbaric medicine, and was affiliated to Univ of Miami Wound Care Center during this study. Dr. Hadar Lev-Tov, is an Associate Professor for the University of Miami Department of Dermatology and Cutaneous Surgery since 2016. Dr. Wensong Wu, is an Associate Professor in the Department of Mathematics and Statistics at FIU.
Dr. Robert Kirsner, is Chair and Harvey Blank Professor in the Dr. Phillip Frost Department of Dermatology and Cutaneous Surgery at the University of Miami Miller School of Medicine. His research interests include understanding the pathophysiology and developing new treatments for chronic wounds. Dr. Anuradha Godavarty, is an Associate Professor in the Department of Biomedical Engineering at FIU. Her research interests are in developing low-cost, portable NIROSs, which have an impact on global health, especially for DFUs.