




Abstract
Objective
: Volumetric muscle loss results in intramuscular axotomy, denervating muscle distal to the injury and leading to paralysis, denervation, and loss of muscle function. Once the nerve is damaged, paralyzed skeletal muscle will atrophy and accumulate noncontractile connective tissue. The objective of this study was to determine differences in connective tissue, atrophy, and inflammatory signaling between two paralysis models, botulinum toxin (Botox), which blocks acetylcholine transmission while keeping nerves intact, and neurectomy, which eliminates all nerve-to-muscle signaling.
Approach
: Twenty male Sprague Dawley rats were randomized and received a sciatic-femoral neurectomy (SFN), Botox-induced muscle paralysis of the proximal femur muscles, quadriceps femoris, hamstrings, and calf muscles (BTX), or sham. Muscle force was measured 52 days postsurgery, and samples were collected for histology, protein, and mRNA assays.
Results:
SFN and BTX decreased twitch and tetanic force, decreased fiber size by twofold, and increased myogenic expression compared with controls. SFN increased the levels of all major extracellular matrix proteins correlating with fibrosis [e.g., laminin, fibronectin, and collagen type(s) I, III, VI]. SFN also increased profibrotic and proinflammatory mRNA compared with BTX and controls.
Innovation
: SFN and BTX were similar in gross morphology and functional deficiencies. However, SFN exhibited a higher amount of fibrosis in histological sections and immunoblotting. The present study shows evidence that nerve signaling changes NF-κB and TGF-β signaling, warranting future studies to determine the mechanisms involved.
Conclusion:
These data indicate that nerve signaling may influence fibrogenesis following denervation, but the mechanisms involved may differ as a function of the method of paralysis.

INTRODUCTION
Extremity soft tissue trauma such as volumetric muscle loss (VML) can result in permanent loss of skeletal muscle mass, denervation, and ischemia posing a significant clinical challenge. VML injuries disrupt normal tissue architecture in addition to intramuscular axons, which are critical elements in muscle regeneration. 1 One of the hallmarks of VML biology is the development of noncontractile tissue (mainly fibrosis) in the muscle injury with persistent functional deficits, and reduced regenerative capacity. This large-scale scarring within the VML site is associated with significant axotomy, 2 impaired vascularity, 1 and changes in gene expression profiles that favor fibrosis further complicating whether muscle regeneration is even feasible. 3 Interruption of the intramuscular neural connections in these devastating injuries is a serious regenerative obstacle that is rarely considered. 4 Sorensen et al. showed that denervation in existing muscle fibers was another sequela of VML. 5 In addition, when existing muscle fibers denervate, contractile properties of those fibers are compromised and lack the ability to generate force, 6,7 contributing to persistent muscle weakness.
INNOVATION
The goal of the present study was to investigate differences between two paralysis models, neurectomy and botulinum toxin A (Botox). The premise was that neurectomy severed nerve signaling, while Botox blocked nerve transmission but preserved the neuromuscular junction (NMJ) (Fig. 1). To characterize these models, we focused on muscle function, histology, fibrosis, myogenic regulation, and end plate levels. We tested the hypothesis that muscle recovery correlated with levels of fibrosis, myogenesis, and end plate protein, and those functional deficits and histomorphometrics would be similar between models. A comparison of these models can provide insights into nerve-driven changes to skeletal muscle to develop potential therapeutics.
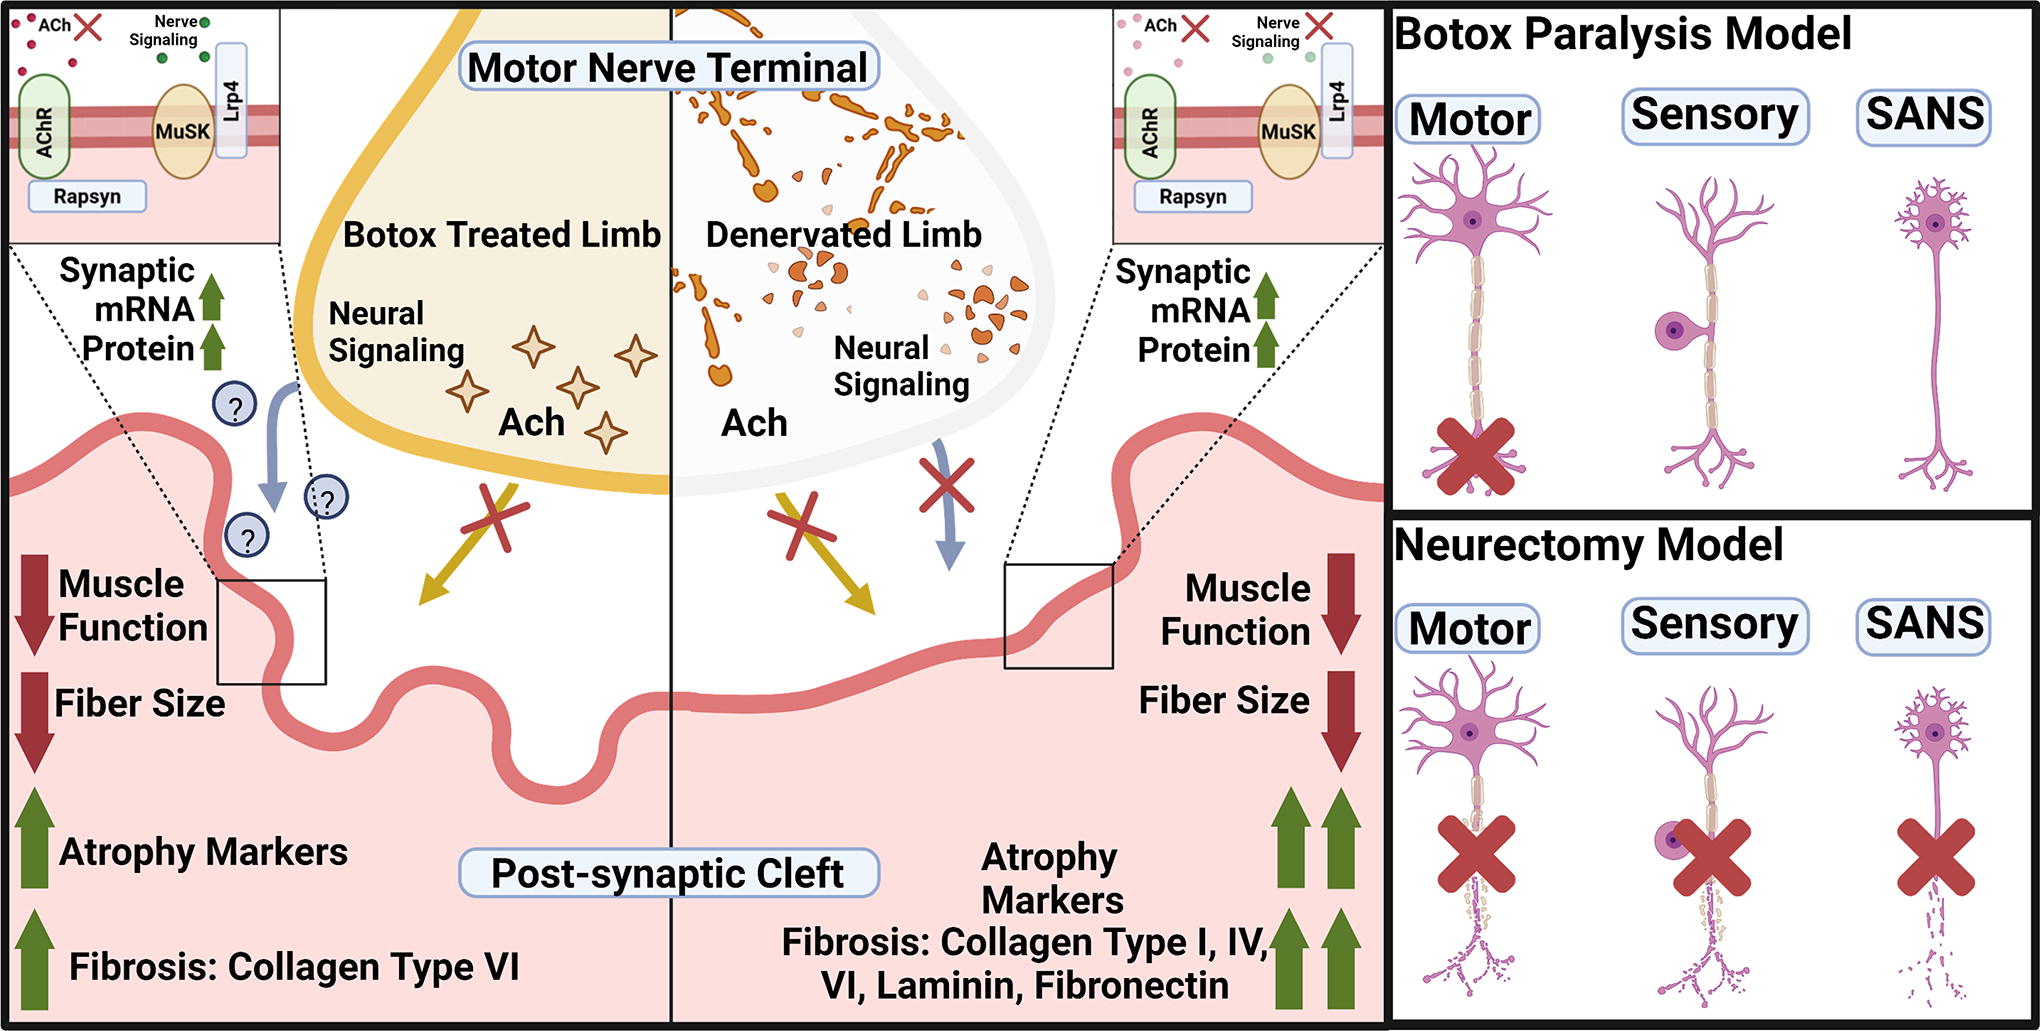
Graphical abstract. Botox paralysis blocks acetylcholine release from the motor neuron end-terminal while keeping the nerve structures intact. SFN cuts all nerves; motor, sensory, and sympathetic-autonomic nerves. Both treatments resulted in decreased muscle function, decreased fiber size, and increased myogenic remodeling mRNA expression. However, only SFN treatment resulted in an increase in all the measured ECM proteins, whereas BTX treatment only increased collagen type VI. Botox, botulinum toxin A; ECM, extracellular matrix; SFN, Sciatic-femoral neurectomy.
CLINICAL PROBLEM ADDRESSED
Limited research has been performed to explore the causes for long-term changes in skeletal muscle following denervation, especially those that investigate fibrosis. Fibrosis is a major impediment to muscle and motor nerve regeneration and recovery following VML and peripheral nerve injury, and is generally characterized by an abnormal accumulation of extracellular matrix (ECM). In skeletal muscle, the origin of ECM production comprised several cell types, including myocytes, myoblasts, fibroblasts, and fibroadipogenic progenitor cells (FAPs). 8 –13 Previous evidence showed that cultured myocytes and myoblasts participated directly in the deposition of collagen I, III, V, and laminin, while fibroblasts produced collagen IV, VI, and laminin, contributing to the total muscle ECM. A limitation of these earlier studies was they were based on in vitro cultures. The most recent evidence from Chapman et al. used in vivo data to demonstrate that myoblasts, fibroblasts, and FAPs were the primary cell types involved in fibrosis. These data underscore the importance of understanding how fibrosis develops in muscle injury models to foster future targeted therapies that mitigate fibrosis.
Denervation atrophy is a condition marked by rapid degeneration of denervated muscle fibers and rapid accumulation of fibrosis. As denervation persists, peripheral nerves break down and motor end plates fragment at the NMJ. The NMJ includes the nerve terminal, motor end plate, specific muscle synaptic proteins, regulatory Schwann cells, and structural ECM components. Fragmentation is a key feature of denervation and describes the combinatory loss of muscle end plate and structural ECM proteins. This process is marked by an upregulation of end plate-specific proteins such as acetylcholine receptors (AChRs), rapsyn, muscle-specific kinase (MuSK), and low-density lipoprotein receptor-related protein 4 (LRP4). 14 In addition, fragmentation is marked by a gradual dispersion of AChR clusters away from the end plate followed by resorption of the end plate entirely. 15
Following denervation, a pool of reparative stem cells, muscle satellite cells (MuSCs), are activated, proliferate, and fuse either into new fibers or with existing muscle to bolster degenerating fibers. The activation of MuSCs is marked by an upregulation of paired box 7 (Pax7) and myogenic factor 5 (Myf5), and other later myogenic factors such as myogenic differentiation factor 1 (MyoD1) and myogenin, all of which are regulated by muscle ECM. 16 Although MuSC activation can temporarily maintain recovery potential, negative changes such as fibrosis become more pronounced with time and consequently the longer a muscle takes to reinnervate, the poorer the final motor recovery. Ultimately, the regenerative capacity of muscle after an injury is dependent on the communication between muscle and nerve, and this could be regulated by the ECM.
While less profound than denervation atrophy, Botox A-induced muscle paralysis and atrophy have many similar characteristics. Botox-induced atrophy is a sequela of lack of acetylcholine release and muscle activity rather than a withdrawal of the nerve and nerve-related trophic factors. This is important because unlike denervation atrophy, features of Botox atrophy are reversible and respond to exercise. 17 –19 Clinically, Botox is used cosmetically and for patients with joint contractures, further highlighting its ability to recover. 20 The recovery potential and neurotransmitter-specific blockage while keeping the nerve intact make the Botox model a valuable tool in understanding the effects of nerve signaling on fibrosis and recovery.
MATERIALS AND METHODS
Animals and surgical procedures
Twenty male Sprague-Dawley rats (300–325 g) were obtained from Charles River Laboratories (Wilmington, MA). The rats were randomly assigned into the sciatic-femoral neurectomy group (SFN, n = 8 rats), Botox paralysis group (BTX, n = 8 rats), or control group (C, n = 4 rats). Botox is a well-established and well-researched neurotoxin, and prior research showed no differences between PBS-injected shams and baseline control animals. 21 Thus, a PBS injection control was not included. One animal from the SFN group was withdrawn because it met the criteria for early endpoint outlined in the Institutional Animal Care and Use Committee (IACUC) protocol due to self-injury and subsequent destress. In addition, one animal from the Botox study passed away due to unknown causes following secondary Botox injection and was removed from the study resulting in a final group size of n = 7 for both the SFN and BTX groups. Contralateral legs were used as internal controls for comparison with treatment limbs, whereas sham was used as a no-surgery control for both treatment groups.
All surgeries were performed humanely under a protocol approved by the IACUC at the Virginia Commonwealth University and followed the National Institutes of Health guide for the care and use of laboratory animals. All animals were single-housed in an individually ventilated, solid-bottomed polysulfone cage and were kept in an AAALAC-accredited animal facility in indoor housing capable of temperature and humidity control within limits appropriate for the species and a 12-h/12-h light/dark cycle. Food pellets and water were provided ad libitum. Rats were acclimated to their environment for five days before surgery.
Animal surgery
Before surgery, animals were anesthetized using aerosolized 4–5% isoflurane/400 mL/min O2, and anesthesia was maintained during surgery with 2.5% isoflurane, 400 mL/min O2. The hind limb surgery site was shaved with electric clippers and cleaned with 3× alternating swabs of isopropanol and chlorhexidine. Rats were transferred to the heated surgical table covered in a clean disposable underpad.
The sciatic neurectomy was performed with the rat in a prone position. A dorsolateral incision was made in the proximal thigh extending from the femoral head to mid-diaphysis. An intramuscular window was made in the bicep femoris to expose the sciatic nerve. Two to three centimeters of sciatic nerve was removed and the nerve stumps were knotted with 10-0 sutures to prevent nerve regeneration. The surgical site was closed with 4-0 vicryl sutures and wound clips. Next, to perform the femoral neurectomy, the rats were placed in a supine position before a dorsomedial incision was made extending from mid-diaphysis to the rat’s midline exposing the femoral nerve and artery. The femoral nerve was carefully separated from the surrounding tissue without damaging the femoral artery and a 5 mm segment was removed. The nerve stumps were sutured and the surgical site was closed. Control sham groups received the same surgery, but the nerves were left intact.
Paralysis was induced using Botulinum Toxin A (BOTOX®, Allergan Inc., Irvine, CA [Botox]) acquired from the VCU Hospital Pharmacy (Richmond, VA) dissolved in 0.9% sterile saline at a concentration of 10U/mL. Each animal was injected with 2 units/muscle-group intramuscularly into the right hind limb muscles of the proximal femur, quadriceps femoris, hamstring, and calf muscles for a total of 8 units/limb/animal. Animals were prepared as outlined presurgery before day 32 injections. The secondary injection (day 32) was performed to maintain muscle paralysis for the full duration of the study.
For both procedures, rats were monitored during recovery to check for side effects. Animals were observed once daily at a minimum for health checks and monitoring Botox-treated animals for recovered mobility. No Botox-treated animal showed identifiable signs of recovered mobility by the end time point. Each rat was weighed weekly with free access to food and water while housed in a ventilated, temperature humidity-controlled, single rat cage contained in a room with a 12-h/12-h light/dark cycle. Wound clips were removed two weeks following neurectomy surgery and additional Botox injections were made on day 32 to maintain muscle paralysis. Fifty-two days following surgery, muscle force was measured and then animals were euthanized using 10% CO2/volume/minute inhalation.
Muscle function and physiology
Muscle force measurements were performed in vivo using the 1300A Whole Animal System (Aurora Scientific, ON, Canada). Rats were anesthetized following the same anesthetization methodology as performed for surgery. Following general anesthesia, each rat was placed in a supine position on the sterile device platform. Each leg was individually fixed at the knee with the paw pressed firmly onto the footpad. Two electrodes (Grass Technologies subdermal electrodes, Fisher Scientific) were inserted into the lateral subdermal space adjacent to the distal crural muscle compartment. Muscle length and stimulating voltage were optimized for each limb before twitch and tetany measurements. Muscle length was optimized by gently stretching the limb to full extension while the knee was fixed. With electrodes in place, the stimulation voltage was optimized by slowly increasing the stimulation voltage until full motor recruitment was achieved denoted by a sustained plateau in muscle force output. Twitch measurements were performed three times in a row by sequentially stimulating with a 1 ms electrical pulse with a 1-s waiting period between pulses. After a 120-s waiting period after the twitch tests, tetany measurements were performed by stimulating the muscle in 500-ms intervals at 150 Hz followed by 120-s rest periods between stimulations to allow for muscle recovery. Maximum force, total time, contraction rates, total energy, minimum force, and relaxation rates were recorded for each test.
Muscle and nerve morphology and weight
Immediately after euthanasia, each limb’s muscles were exposed and the surgical sites were checked for signs of abnormal fibrosis or irregularities. Following the preliminary quality control check, the gastrocnemius and the available intact sciatic nerves along with the remaining distal nerve stumps were isolated and removed. Both tissues were individually weighed. Images of respective treatment and contralateral muscles were taken using a Nikon Rebel T3 camera after placing the muscles next to a surgical ruler, and then weighed. Muscles were then measured for width and length. Following measurements, muscles were cut in half. One half of the muscle was transferred to individual tubes containing 4% paraformaldehyde stored at room temperature. The other half muscle was put in empty 50 mL conical tubes stored at −80°C.
RNA isolation and Real Time quantitative polymerase chain reaction (RT-qPCR)
Total RNA was isolated from each gastrocnemius muscle in each group. While on ice, a 30–40 mg sample was taken from the muscle belly, minced, and transferred to a Bead Bug Zirconium 6 mm Bulk Bead tube (Benchmark Scientific, Sayreville, NJ) containing 1 mL TRIzol (Thermo Fisher Scientific, Waltham, MA). Each tube was run three times through the device at a maximum speed for 60 s with a 5-min rest period on ice between runs. Sciatic nerve samples were homogenized using the same method as muscle except with QIAzol, but due to the nerve’s high lipid content, the RNeasy Lipid Tissue Mini Kit (Qiagen, Hilden, Germany) was used to isolate RNA. Isolated RNA concentration and purity were measured using a microplate spectrophotometer (BioTek Take3, BioTek Synergy H1, Winooski, VT). Primers used in RT-qPCR to measure myogenesis and synaptogenesis are listed in Table 1. Primers used to measure markers of fibrogenesis and inflammation are listed in Table 2. All PCR data are presented as fold change (2 -ΔΔCT) against sham.
List of Primers Used in all RT-qPCR Measurements
Primers Used in the Fibrogenesis and Inflammatory Marker RT-qPCR Panel
Histology and morphometrics
Gastrocnemius muscles were stored in 4% paraformaldehyde at room temperature, dehydrated, and embedded in paraffin wax. Five-micron sections were placed on Histobond slides (VWR, Radnor, PA) and then deparaffinized and rehydrated before staining with Weigert’s hematoxylin Masson’s trichrome (Sigma-Aldrich, St. Louis, MO), Biebrich scarlet-acid fuchsin (Sigma-Aldrich), and aniline blue (Sigma-Aldrich). Coverslips were mounted with xylene-based mounting media and dried before imaging at 10× magnification. Each region of interest (ROI) was measured for both fibrosis and Feret diameter. Fibrosis was measured by thresholding the image for blue pixels detecting the aniline blue-stained collagen ECM compared with the total number of pixels of the ROI as a percentage using MATLAB. Feret diameter and fiber counts in each ROI were manually measured in ImageJ.
Immunoblotting
All immunoblotting was based on our previously published protocol,
22
the STAR protocol,
23
an improvement on the standard Bio-Rad protocol, and with protein loading conditions optimized for skeletal muscle using previously published literature.
24
A biopsy punch from the muscle belly of the gastrocnemius was taken for protein samples. The 40–50 mg of tissue was homogenized in 1 mL NP-40 (BP-119, Boston BioProducts, Ashland, MA) with protease inhibitor cocktail and 25 mM sodium fluoride with a 6.0 mm zirconium bead in a beadbug homogenizer (BeadBugTM Cat #: 31–212, Genesee Scientific, San Diego, CA) at 4000 rpm for 60 s 5 times. The tubes were kept on ice for at least 5 min between runs. The homogenate was centrifuged at 9703 rpm (10,000× g) (Centrifuge 5427R, Eppendorf, Hamburg, Germany) for 5 min to remove insoluble cellular material, and the supernatant was used for dot blotting according to the Bio-Rad manufacturer’s protocol, which uses a 0.45 μM nitrocellulose membrane. Following sample application, the blots were stained with the Revert 700 Total Protein stain for 5 min followed by two washes with Revert Wash buffer for 30 s each. The blots were briefly rinsed with 1×TBS twice and then rehydrated in 1×TBS for 10 min before blocking. Membranes were then blocked for an hour at RT with StartingBlock blocking buffer (Thermo Fisher Scientific). Blots were incubated overnight with primary antibodies (Table 3) at 4°C on a 3D rocker. Next, the membranes were washed 3× with 1×TBS, 0.1% Tween20 solution and then incubated with secondary antibodies (926–32210, LI-COR Biosciences, Lincoln, NE) for 60 min at room temperature. Blots were imaged on the LI-COR Odyssey CLx (LI-COR Biosciences) at medium scan quality, 85 µm resolution, and 0.0 mm offset. A silicone roller was used to remove bubbles before scanning. The entire dot, including rings, was considered for quantification and background noise accounted for in each dot in the LI-COR Image Studio v5.5 software. Signal intensity of targets was normalized to their respective individual sample taken as a percentage of the total protein intensity. All blots were quantified using the following equation.
List of Antibodies Used in Immunoblotting, Including Catalog ID, Clonality, and Host Species
Statistical analysis
Surgical group size was based on a power analysis with an α = 0.05 and power = 0.8 using the a dz = 2.43 for the SFN group and dz = 2.7 for the BTX. These data were based on prior gene expression experiments. The analysis led to a final group size of n = 8/group for treatment groups. (sham, n = 4; BTX C, n = 8; BTX T, n = 8; SFN C, n = 8; SFN T, n = 8). Statistical tests were performed using GraphPad Prism 10.0 (GraphPad, LA Holla, CA) and are represented as mean ± SEM. A one-way analysis of variance test with a Tukey post hoc test was used for each data set, with different letters representing statistical significance. Bar graphs with different letters (e.g., A vs. B, B vs. C, or A vs. C) from each other are deemed significant (p value < 0.05). This also includes bars with multiple letters (e.g., AB vs. C) and are significant between these comparisons (p value < 0.05). Bars sharing a letter (e.g., A vs. A, AB vs. B, or BC vs. C) are not significant compared with each other. If the bar contains the same letter, then they are not significant. Outliers from assays were determined with a modified Z-score test removing outliers, three scaled absolute deviations from the median. 25
RESULTS
Muscle function
SFN and BTX treatments caused similar functional deficits in twitch and tetanic muscle force results. In twitch testing, both treatments resulted in decreased maximum torque, a slower contraction rate, and a slower relaxation rate (Fig. 2A–C). Tetanic results showed a similar trend with maximum torque and maximum contraction and relaxation rates decreased in treatment limbs compared with contralateral limbs (Fig. 2D–F), Supplementary Fig. 2.
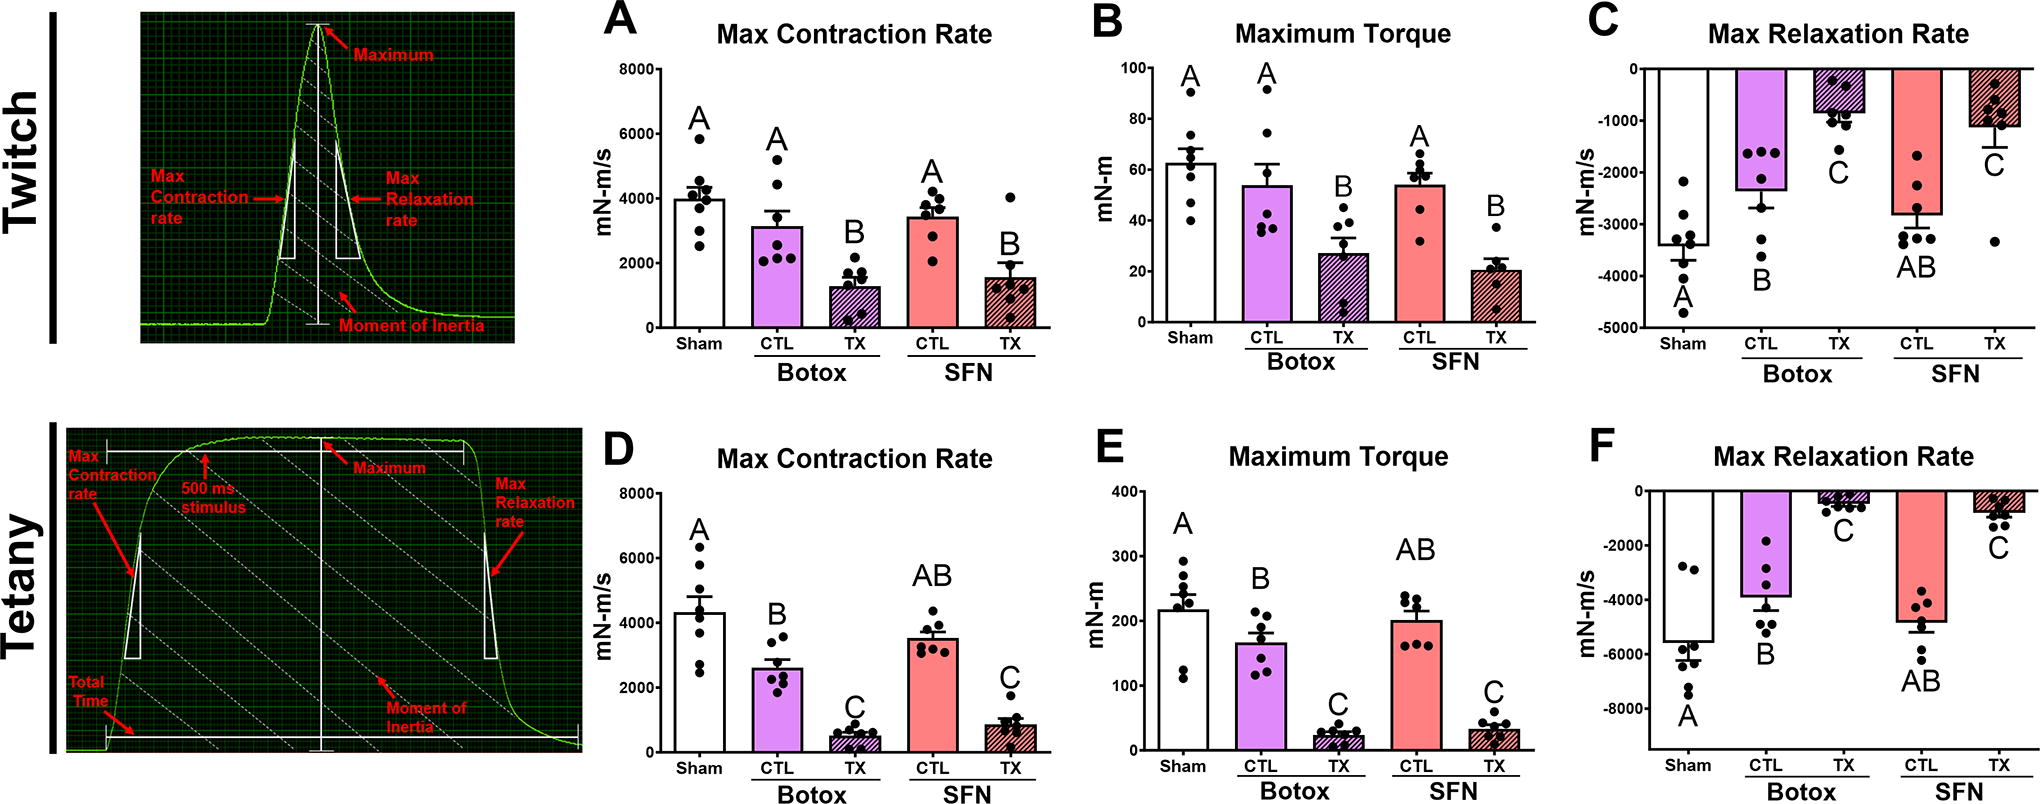
Limb functional force testing demonstrates deficits in both Botox paralysis and SFN treatments compared with their respective contralateral group after 52 days. Representative force curve diagrams included for reference. Twitch testing showed maximum torque
Gross morphometrics and histology
Gross images of the muscle show decreased muscle size in the treated gastrocnemius muscles (Fig. 3A). Gastrocnemius muscle weight and anatomical cross-sectional area decreased compared with contralateral groups and sham both qualitatively and quantitatively (Fig. 3B). Histological sections were taken from the midsection of the gastrocnemius in each limb and stained with Masson’s trichrome. Sham limbs and contralateral control legs displayed typical morphology consistent with healthy muscle (Fig. 3C). Treated limbs showed decreased fiber diameter and increased levels of aniline blue stain compared with contralateral groups and sham (Fig. 3D). These results were quantified morphometrically, demonstrating increased fibrosis in SFN compared with controls, while BTX-treated limbs were not significant (Fig. 3E). In addition, Feret diameter (Fig. 3F) and fiber count (Fig. 3G) showed decreases in both SFN- and BTX-treated limbs compared with the contralateral groups and sham.
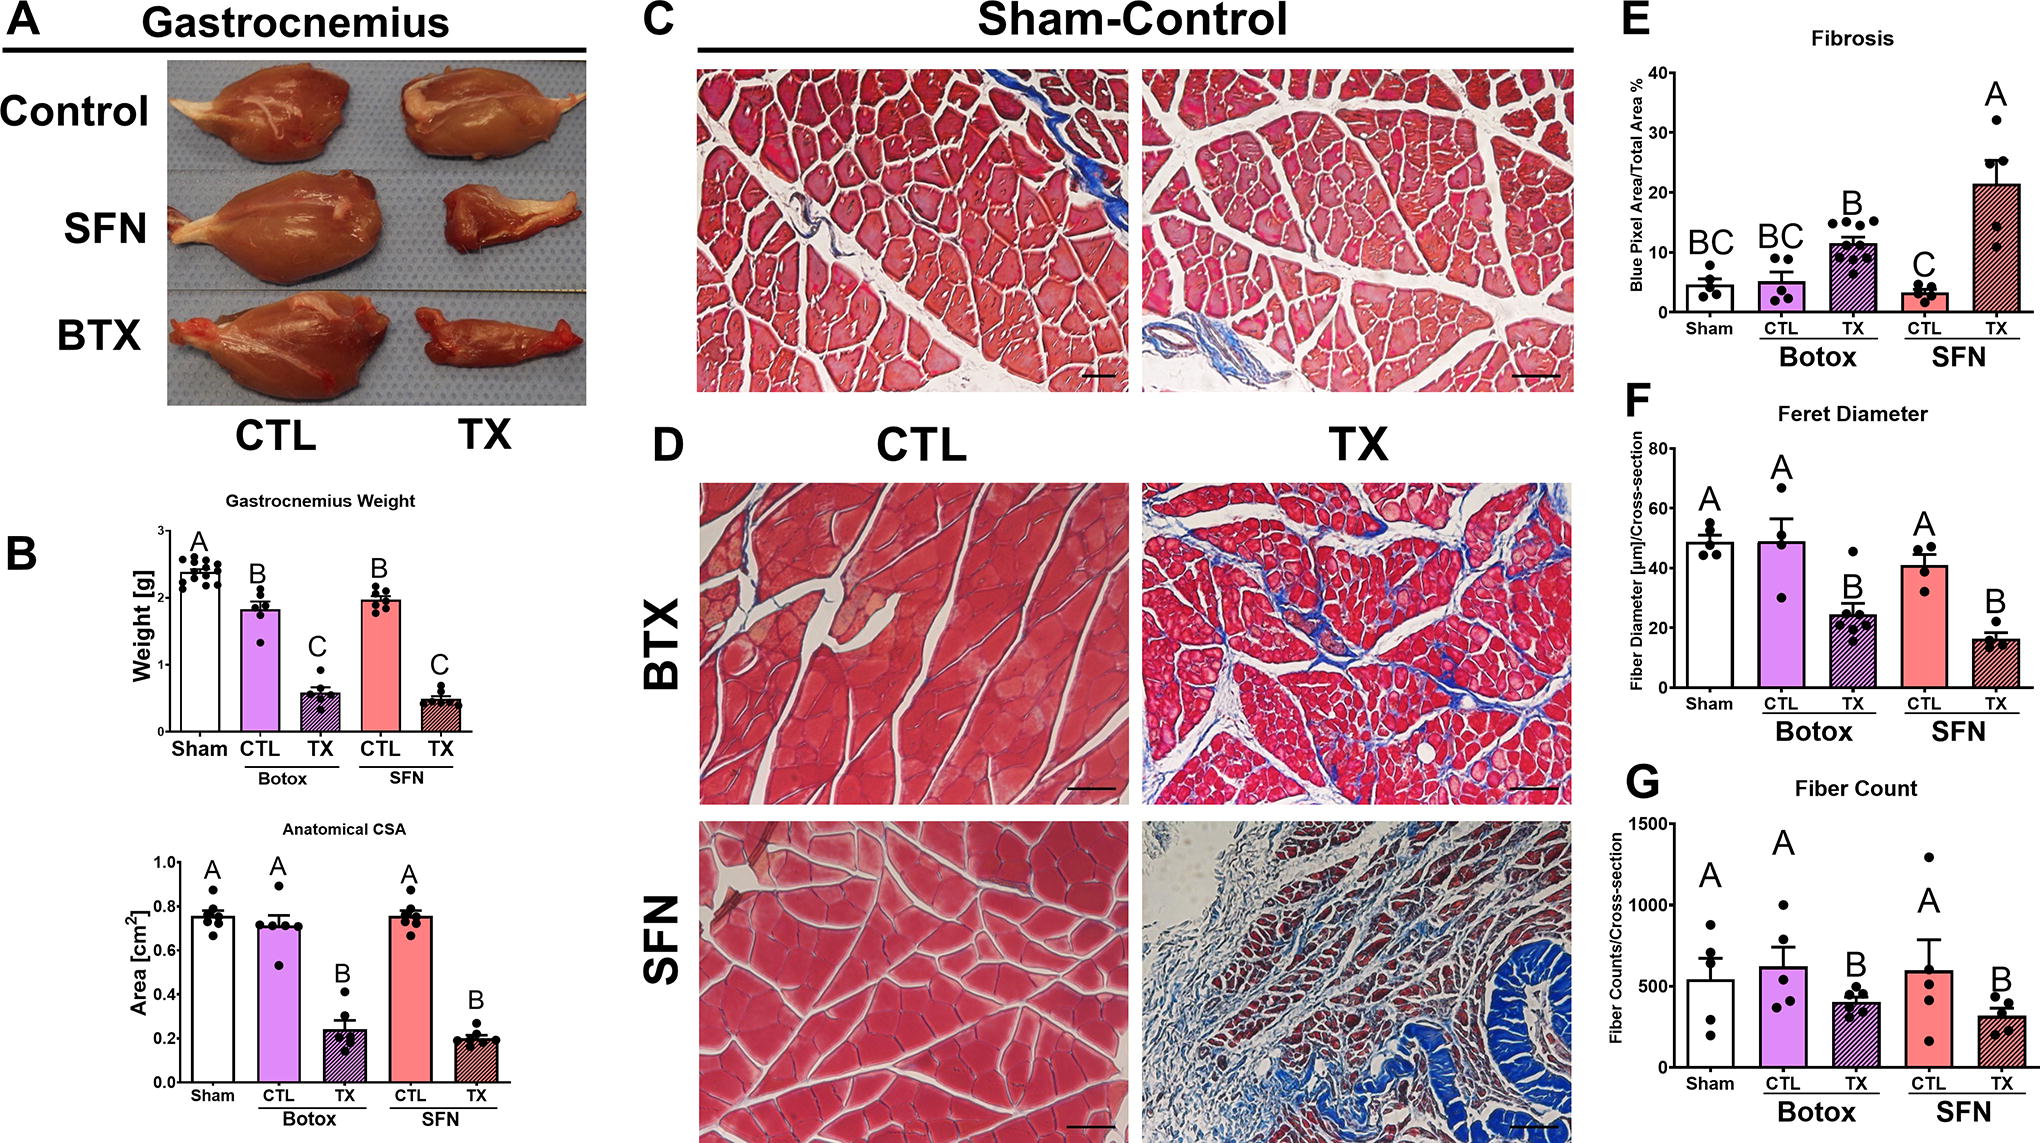
Gross morphology and histomorphometrics of gastrocnemius tissue receiving either a BTX or SFN treatment. Qualitative and quantitative assessments in gastrocnemius size showed decreases in tissue size, wet weight, and anatomical CSA
Gastrocnemius RNA expression
Both treatment groups demonstrated increased levels of mRNA expression in markers for remodeling and new fiber formation as indicated by Myh1, Myh3, Pax7, Myog, Myf5, Myf6, and Itga7. Myh1 and Myh3 expression increased in the SFN and BTX treatment groups, with Myh3 increasing over 40-fold than sham (Fig. 4A, B). Myh7 was not significantly different in treatment limbs compared with contralateral or sham (Fig. 4C). Myh2 was not different between each group (Supplementary Fig. S1). Pax7 levels increased in both the SFN and BTX treatment groups compared with the contralateral groups and sham (Fig. 4D). Myog, Itga7, Myf5, and Myf6 increased compared with controls for both SFN and BTX but were lower in BTX compared with SFN (Fig. 4E–H).
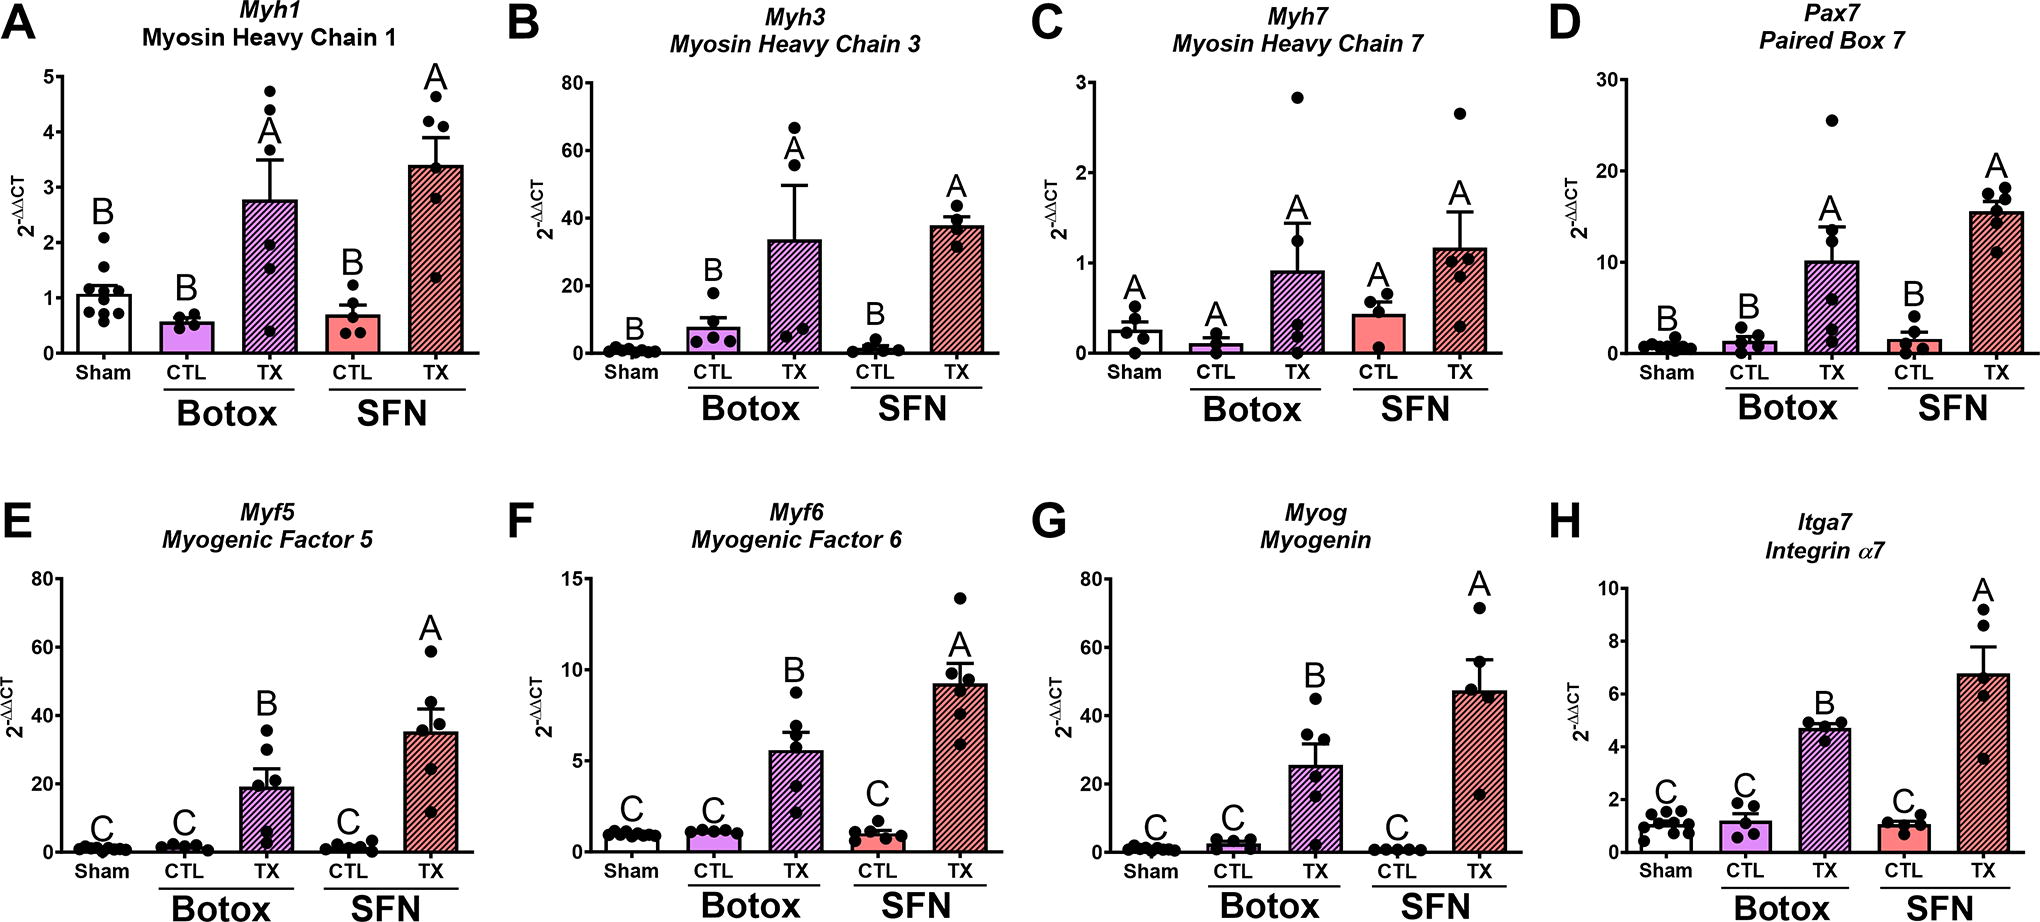
RT-qPCR measuring markers of satellite cell activation and myogenic regulatory genes. Myh1
NMJ mRNA and protein level
While only SFN-treated limbs increased mRNA production of Acetylcholine receptor gamma (Chrng) compared with its contralateral group and sham (Fig. 5A), both treatments upregulated mRNAs for Chrne, Musk, Lrp4, and Rapsn (Fig. 5B–E). Furthermore, mRNA levels for Chrne and Musk were highest in SFN muscles compared with BTX, while mRNA levels for Lrp4 and Rapsn were unchanged between treatments. Similarly, both treatments caused increases in the associated proteins AChR-γ, AChR-ε, MuSK, LRP4, and Rapsyn (Fig. 5F–J), Supplementary Fig. 3–5. Differences between SFN and BTX treatments were also observed at the protein level where AChR-γ, AChR-ε, and Rapsyn were higher in SFN-treated limbs compared with BTX-treated limbs.
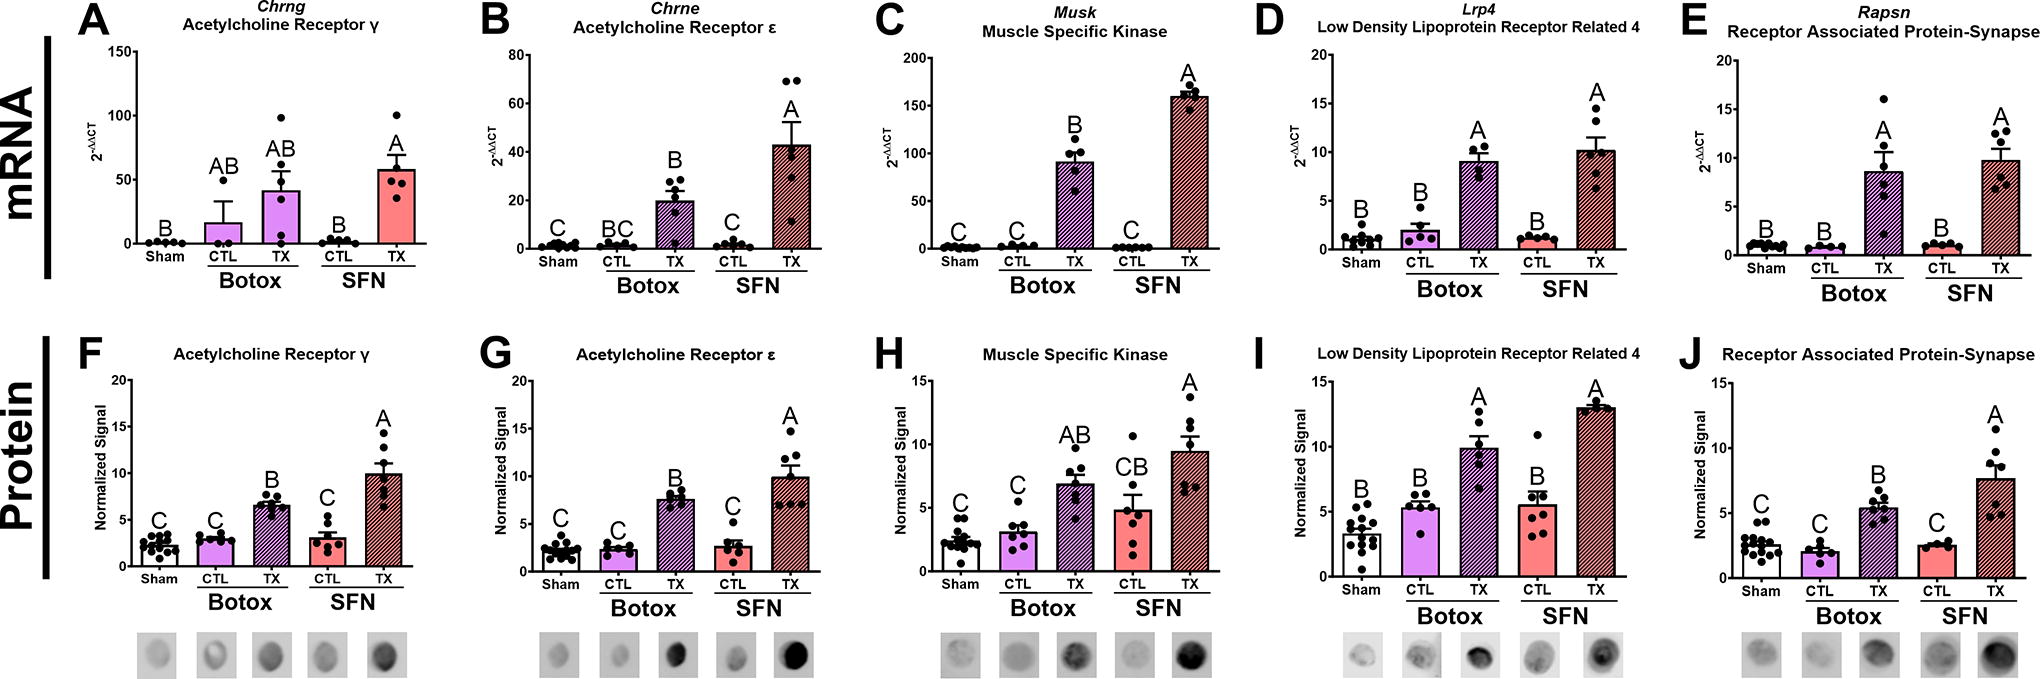
RT-qPCR measuring neuromuscular junction end plate genes.
ECM protein level
After 52 days of paralysis, collagen types I (Fig. 6A, Supplementary Fig. 6) and IV (Fig. 6C, Supplementary Fig. 7) increased in SFN-treated limbs twofold than in contralateral and sham controls. Collagen type III levels were not different between any group (Fig. 6B, Supplementary Fig. 6). In contrast, collagen type VI (Fig. 6D, Supplementary Fig. 7) increased in both SFN- and BTX-treated limbs compared with its contralateral and sham groups. In SFN-treated limbs, laminin and fibronectin levels increased compared with all other groups (Fig. 6E, F, Supplementary Fig. 8), while chondroitin sulfate proteoglycan was not statistically different in treated limbs compared with the respective contralateral and sham controls (Fig. 6G, Supplementary Fig. 9). Heparan sulfate proteoglycan was upregulated in BTX-treated limbs compared to its contralateral but was not different compared with sham (Fig. 6H, Supplementary Fig. 9).

Protein blotting analysis probing for key ECM proteins confirmed histomorphometrics and showed distinct changes in the composition of fibrosis between BTX and SFN treatments. Collagen types were differentially produced between SFN and BTX treatments, with collagen type 1 increasing only in SFN
Fibrosis and inflammatory mRNA level
In healthy tissues, fibrotic and inflammatory-related markers such as interleukin-, TGF-β-, and NF-κB-related mRNAs were maintained at low basal levels. Interleukin IL1A was not significantly different between groups, while IL1B and IL12B were increased in SFN and BTX (Fig. 7A–C). IL6 was not different between groups, while IL33 was twofold higher in SFN compared with BTX (Fig. 7E). Tgfb1 expressed 10-fold higher in SFN compared with sham, while BTX was fourfold higher (Fig. 7F). Tgfb2 and Tgfbr1 were not different between treatment limbs but were increased compared with sham (Fig. 7G, H). Akt1 and Ctgf increased in both treatment groups, and SFN was highest (Fig. 7I, J). Nfkb1 only increased in SFN compared with sham and BTX (Fig. 7K). Ikbkg, Nfkbia, and Ikbkb increased in both treatment limbs compared with sham (Fig. 7L–N). Traf6 increased in both treatment groups, but was higher in SFN compared with BTX (Fig. 7O).
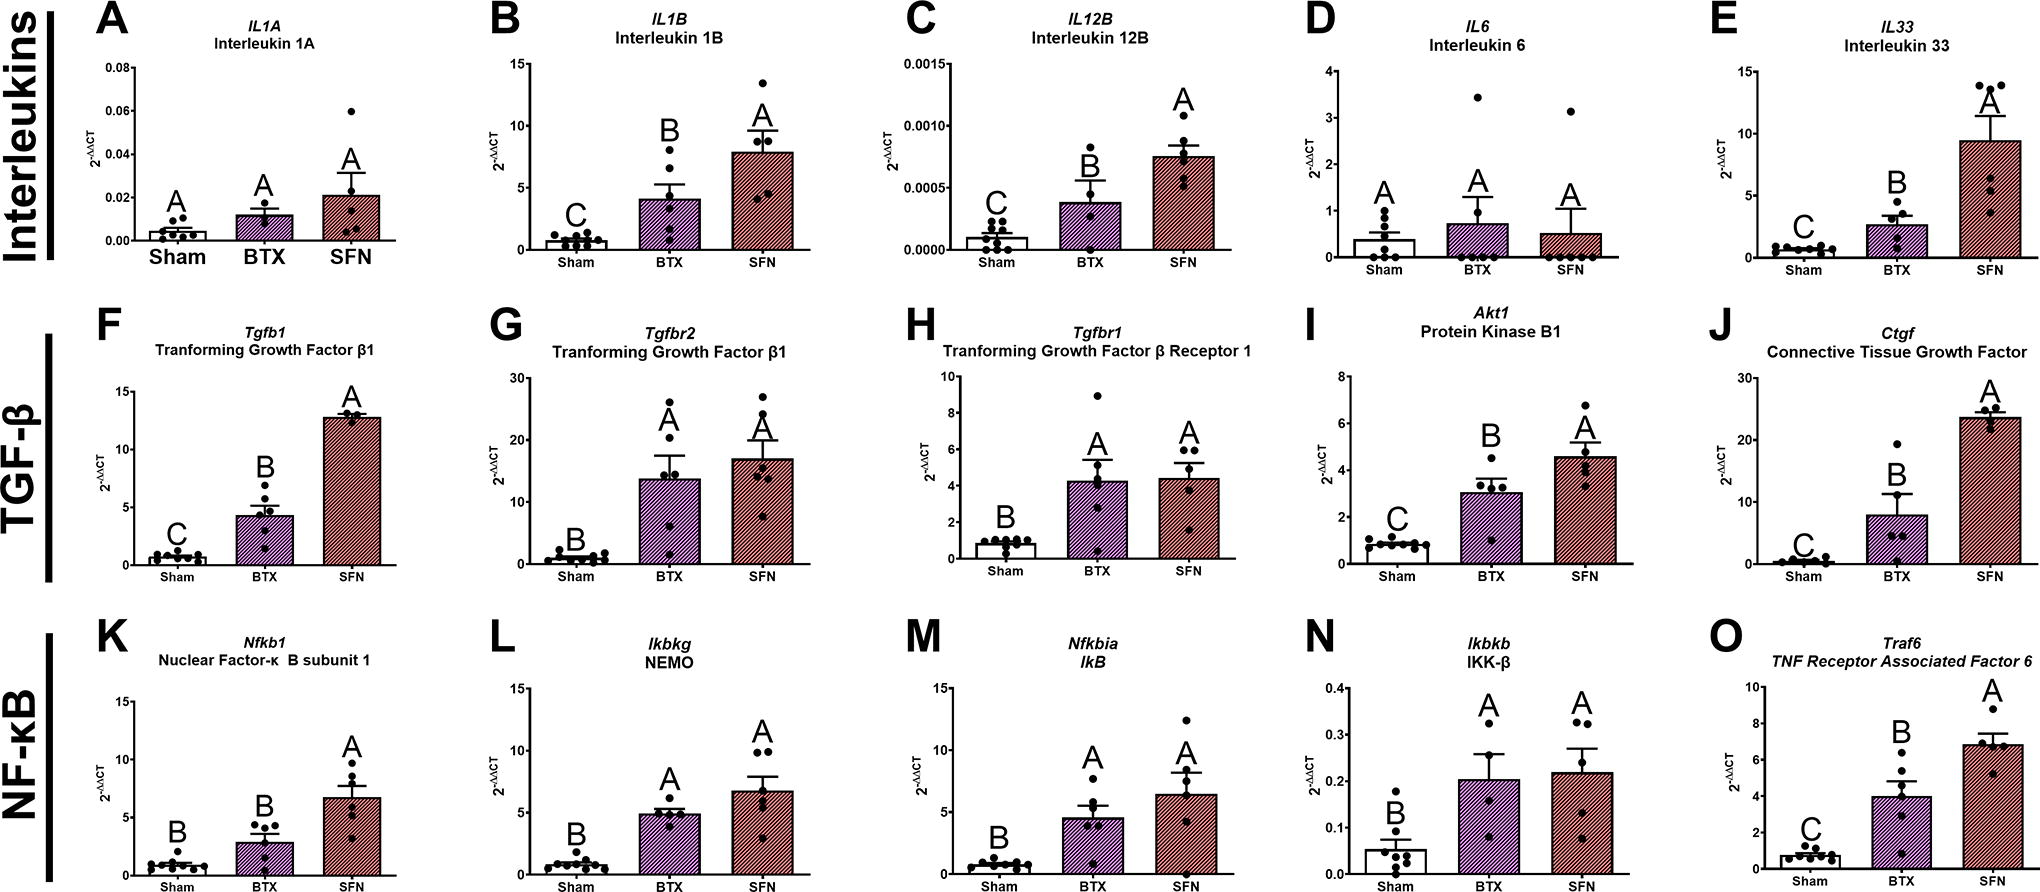
Overview of the inflammatory and fibrosis RT-qPCR displaying genes associated with interleukin, TGF-β, and NF-κB pathways. Groups shown are sham control, Botox-treated limbs, and SFN-treated limbs. Contralateral limbs were removed from the analysis as they showed no difference from sham. Bars with different letters indicate a significant difference (e.g., A vs. B) (p < 0.05), while bars containing the same letter are not significant (e.g., AB vs. B) using a one-way ANOVA with a Tukey’s post-hoc test. Data are shown as mean ± SEM (n = 7/limb). Botox, botulinum toxin A; SFN, Sciatic-femoral neurectomy.
Of the 71 total genes, 66 were detected and 48 were significantly different compared with sham between BTX and SFN. Of the 48 significantly expressed, 19 were shared between both treatment limbs, 28 uniquely significant in SFN, and only 1 was unique to BTX. The heatmap shows qualitatively the differences in expression compared with sham (Fig. 8A), while the Venn diagram breaks down the differences in significant gene expression (Fig. 8B). Edn1 was increased twofold higher above Sham and SFN and was unique to BTX (Fig. 8C). The full gene panel results are shown in Supplementary Figures S10–S12.
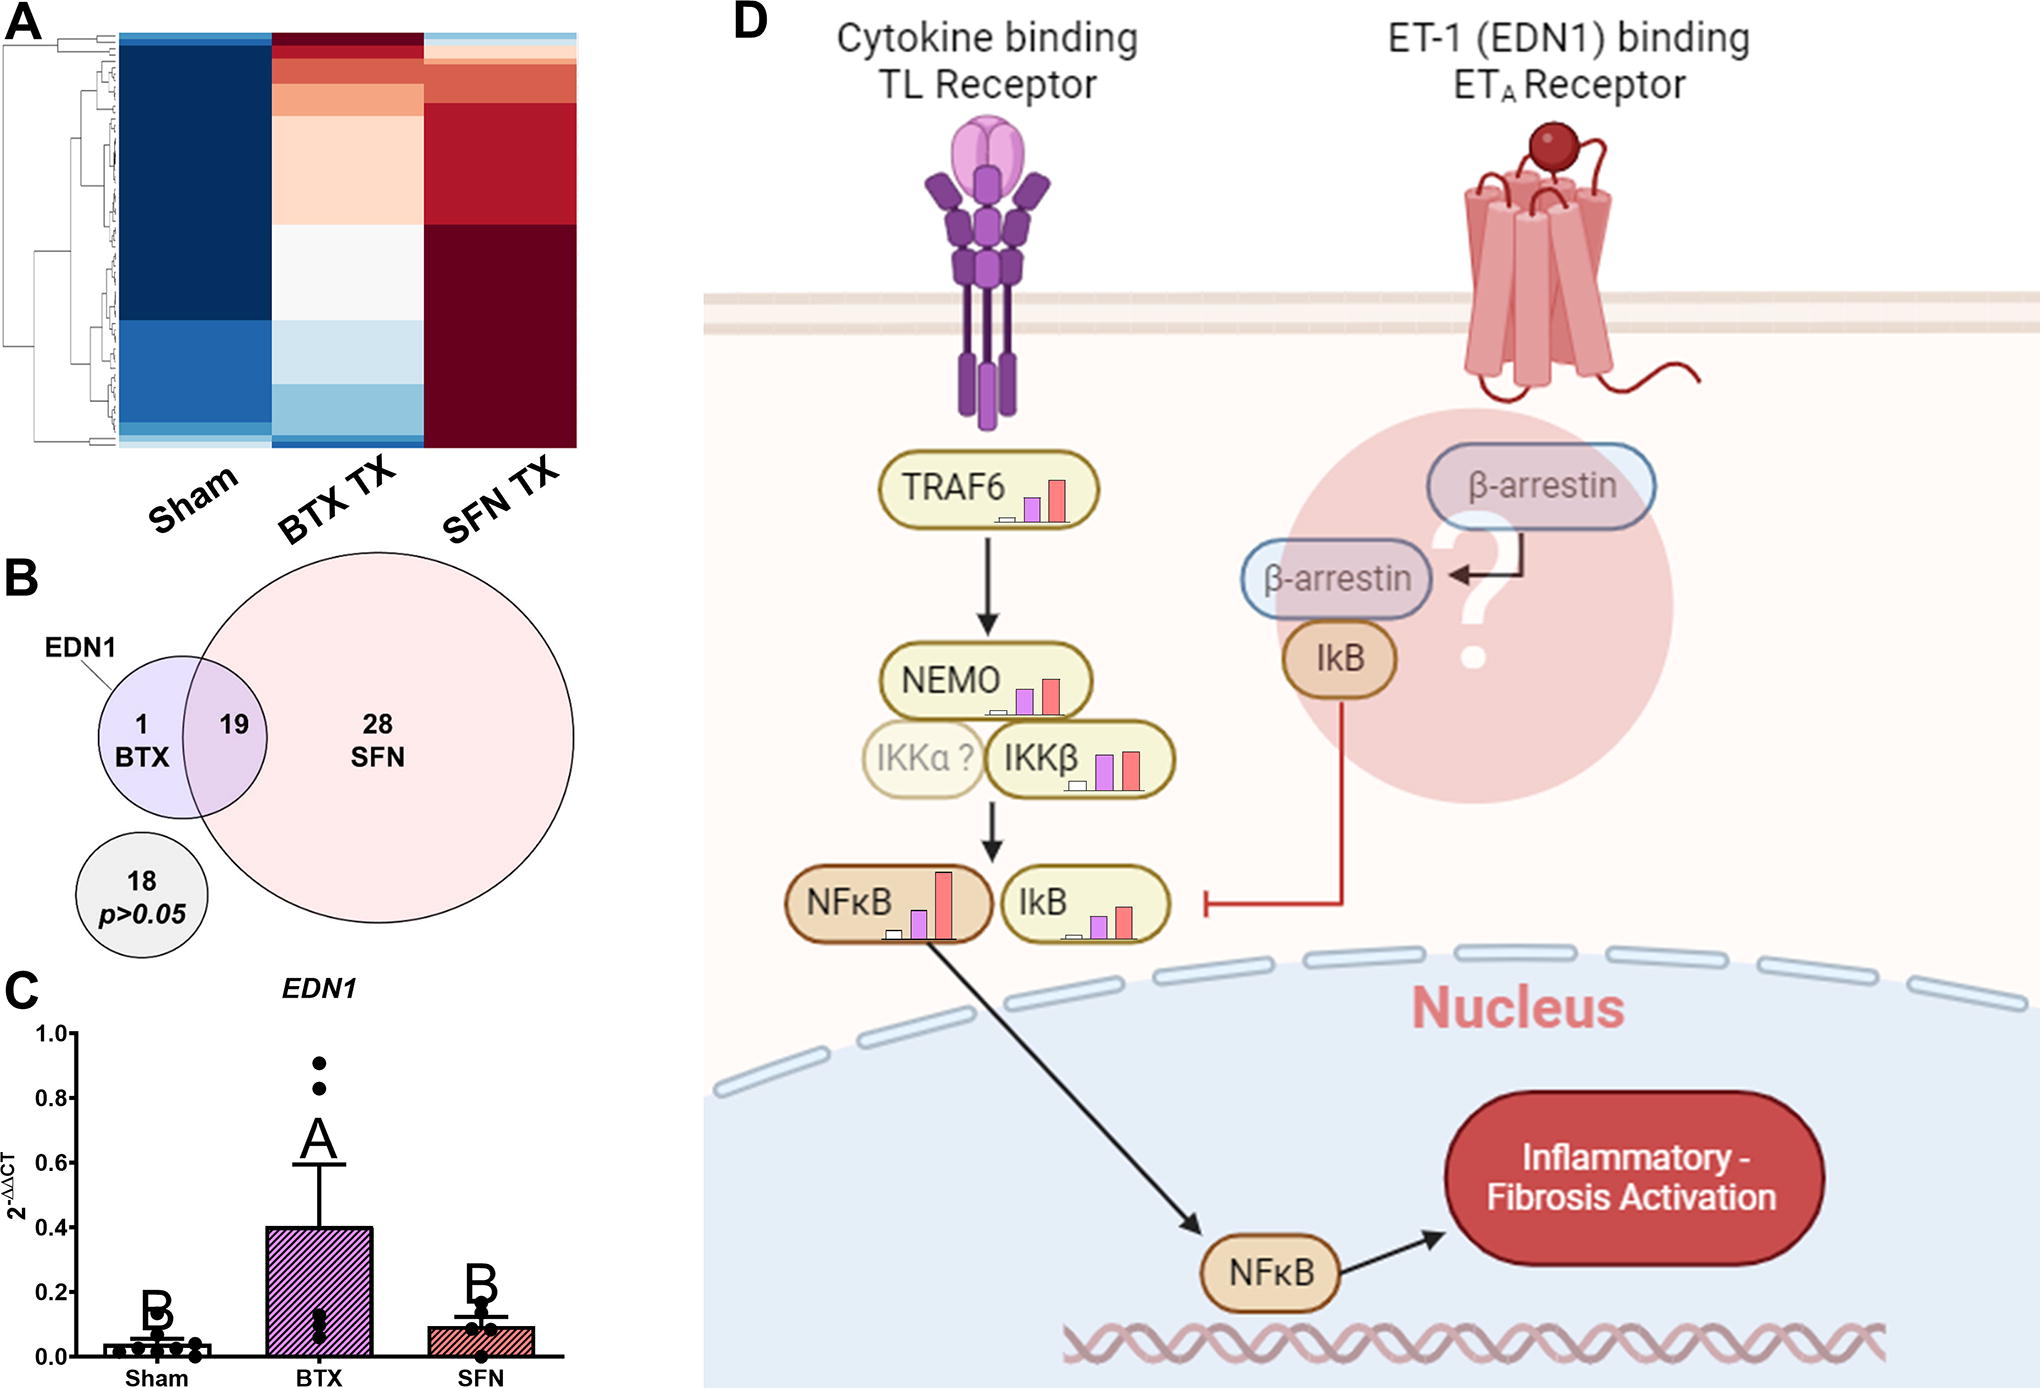
Theoretical signaling pathway of endothelin-1 (EDN1) causing activation of β-arrestin may be responsible in mitigating inflammation and fibrogenesis in Botox-treated limbs compared with the neurectomy model, despite the two models having similar atrophy and functional deficits. Twenty-eight genes are significantly expressed higher in SFN-treated limbs, and 19 genes are increased in both treatments, while only EDN1 was significantly increased in BTX-treated limbs
DISCUSSION
Fibrosis that develops following VML injuries blunts muscle regeneration, and, while this process is multifactorial, loss of intramuscular axons and denervation could provide some insights into its mechanism. Indeed, Sorensen et al. already demonstrated that denervation is a secondary sequela of VML. 5 To better understand how muscle paralysis regulates fibrosis, we characterized differences between neurectomy and Botox models using muscle atrophy, NMJ remodeling markers, MuSC markers, and ECM. This study focused on comparing the functional, morphological, and gene expression changes to determine broad differences before a longitudinal study, which would require greater animal sacrifice. We hypothesized that maintaining an intact muscle–nerve connection would minimize the degree of ECM turnover, markers of myogenesis, and markers of motor end plates. Overall, the major findings from this study were the differences in ECM components, reduced myogenic markers, and reduced NMJ markers in Botox-treated animals compared with neurectomy.
The NMJ is a highly regulated microenvironment that is stabilized by continuous feedback between the nerve, muscle, and ECM. Loss of the motor nerve signal will produce functional deficits and muscle atrophy. As a first step in characterizing paralysis, we measured functional outcomes. As expected, twitch and tetanic muscle forces decreased in both treatment groups, and the observed functional deficits were consistent with previous literature on denervation atrophy. 26 Muscle fiber diameter measurements also showed no differences in atrophy between BTX and SFN, demonstrating that functional and morphological changes were similar. However, Masson’s trichrome stains showed noticeable differences in fibrosis between SFN and BTX treatments, indicating that regulation of ECM synthesis was different.
Changes in ECM composition are associated with altered muscle fiber and MuSC gene expression. Myh1 encodes for myosin heavy-chain IIx fast twitch, while Myh3 encodes for embryonic myosin heavy chain, 27 and are associated fiber types during atrophy. 28 We showed increased Myh1 levels indicating a fiber type switch to glycolytic fibers, and increased Myh3 demonstrating newly formed fibers in response to atrophy. Elevated Pax7 suggested increased activation from quiescence. 16 In addition to Pax7, concomitant increases in Myf5, Myog, and Myf6 expression indicated that muscle was undergoing active myogenesis following paralysis, and this is in alignment with the literature. 29 Interestingly, Myf5, Myog, and Myf6 were all reduced in BTX-treated muscles compared with SFN. Myf5 is an essential early driver of MuSC to myoblast transition, 30 Myog indicates a commitment to a fusogenic phenotype, 31 and Myf6 promotes the maturation of myotubes. 32,33 This change in myogenic markers could be a reduction in the number of activated myoblasts and myotubes, a faster return to baseline following Botox treatment, 34 or a difference in the effects of Botox versus neurectomy on Hdac4, which regulates myogenic factor expression. 35
Itga7 is a key marker for myoblast motility and adhesion during new fiber formation and a key receptor for laminin. 36 Furthermore, Itga7 expression is heterogenous across the fiber and has been found to localize at the NMJ assisting in stabilization. 37 We observed elevated levels of Itga7, which indicate a compensatory mechanism in injured or diseased muscle. 38,39 These changes in expression can be due to increased numbers of muscle progenitors, preservation of sarcolemma integrity, or a supportive role in preserving AChRs at the motor end plate.
Maintained accumulation and stabilization of postsynaptic proteins are required for reliable acetylcholine transmission, but in injured or denervated muscle, synaptic markers are overexpressed in an attempt to rescue the tissue. The coexpression of Chrng, Chrne, Musk, Lrp4, and Rapsn may suggest NMJ remodeling and attempts to preserve the remaining junctions 40 even when the NMJ remains intact. In addition, the turnover rate of AChRs increases following denervation and results in extrasynaptic AChR distribution with eventual instability leading to NMJ breakdown. 41 This high turnover rate could explain the variability in Chrng mRNA levels measured in Botox-treated muscles due to differences in turnover between BTX and SFN. The SFN treatment resulted in higher expression and protein level of AChRs compared with BTX, suggesting an overcompensation to preserve the NMJ. However, mRNA and protein data are insufficient to explain localization of synaptic proteins as these proteins localize extrasynaptically in response to fragmentation.
Inflammation drives fibrosis, and we observed distinct changes in ECM and inflammatory pathways when we compared Botox to denervation. Prior reports demonstrated increased collagen following Botox and denervation atrophy, 42,43 and this was initially confirmed via histological assessment of paralyzed muscles despite no differences in atrophy or function. When we tested specific ECM components, we found that BTX-treated limbs only increased levels of collagen type VI, but collagen types I, IV, and VI, laminin, and fibronectin were elevated in SFN limbs. Our inflammatory and fibrotic gene panel showed similar patterns as our myogenic and synaptic protein expression, where many of the genes measured in BTX were lower than SFN. Interestingly, Edn1 encoding endothelin-1 was the only gene upregulated in BTX but not in SFN. Endothelin-1 signaling is typically associated with profibrotic phenotypes activating the COX-2/PGE2, NF-κB, and interleukin pathways, which was associated with muscle atrophy. 44,45 More, TGFβ signaling also contributes to NF-κB upregulation, 46,47 and was elevated in SFN muscle. Overall, the results presented in this study suggest differential regulation of key inflammatory pathways between paralysis models.
A limitation of the Botox model is its potential off-target effects. While Botox effectively prevents acetylcholine transmission, it should be noted that Botox is used to treat chronic pain and other targeted effects aside from muscle paralysis. It was also suggested that Botox has systemic effects via retrograde travel of the toxin, but evidence for this remains controversial. 48 The 2 units per muscle injections are higher than clinical doses and were strictly used as a model of paralysis, limiting the translation of these findings regarding the clinic. In addition, higher dosage could have potential spillover effects into the contralateral limb and may explain the slight decreases in contralateral limb strength measured. However, for most measures presented in the study, the BTX contralateral limb was not different compared with sham or SFN contralateral limbs.
There are also limitations of the neurectomy model where both sensory and sympathetic nerves are ligated making it difficult to isolate the role of sensory and sympathetic nerve signaling in fibrogenesis and atrophy. 49,50 Collectively, while the present study is well-accepted to model muscle atrophy, the role of sensory and sympathetic nerves needs to be considered in future studies. In addition, future studies should increase the power size to accommodate animal loss due to complications. Power sizes were calculated based on a preliminary study, but unforeseen loss of animals in treatment groups reduced the statistical power, resulting in missing significance in certain assays presented in this study. The sample sizes will be increased in future studies to avoid this issue.
In summary, the data presented in this study showed that fibrogenesis in the Botox-induced paralysis model was lower than the neurectomy model, with collagen type VI as the primary elevating ECM protein in the Botox model. Fibrogenesis in the Botox model, despite being lower than SFN, still occurred despite similar functional deficits and fiber diameters to the neurectomy model. This suggests that there are other signaling pathways responsible for the differences in fibrosis, which we theorize may involve the NF-κB and TGF-β pathways.
Fibrosis in clinical cases of VML and denervation can impede nerve regrowth and functional reconnections since fibrosis plays both a mechanical and signaling role disrupting regeneration. Understanding the specific sources of fibrogenesis is key to producing therapeutics that target these pathways. Although the present study sought to understand broad differences between the neurectomy and Botox-induced paralysis models, to better solidify the potential of these models, more in-depth assays are needed to understand the complex signaling that regulates the ECM following paralysis.
KEY FINDINGS
Myogenic and motor end plate markers were reduced in animals treated with a nerve block (Botox) compared with nerve degeneration (neurectomy). Fibrotic ECM was more prevalent in nerve degeneration-treated limbs compared with the nerve block. Inflammatory factors were higher in animals with nerve degeneration compared with those treated with the nerve block.
Footnotes
ACKNOWLEDGMENT AND FUNDING SOURCES
The authors would like to thank the funding sources from the Department of Defense (
AUTHOR DISCLOSURE AND GHOSTWRITING
The authors declare no financial interests or conflicts of interest to disclose. The article was exclusively written by the authors without any help from ghostwriters.
AUTHORS’ CONTRIBUTIONS
J.T.R., J.D., and D.J.C. performed the experiments and analyses. J.T.R., D.J.C., Z.S., and M.J.M. conceptualized the study, wrote the article, and created the figures. All authors provided editorial review.
ABOUT THE AUTHORS
SUPPLEMENTARY MATERIAL
Supplementary Figure S1
Supplementary Figure S2
Supplementary Figure S3
Supplementary Figure S4
Supplementary Figure S5
Supplementary Figure S6
Supplementary Figure S7
Supplementary Figure S8
Supplementary Figure S9
Supplementary Figure S10
Supplementary Figure S11
Supplementary Figure S12
Abbreviations and Acronyms
References
Supplementary Material
Please find the following supplemental material available below.
For Open Access articles published under a Creative Commons License, all supplemental material carries the same license as the article it is associated with.
For non-Open Access articles published, all supplemental material carries a non-exclusive license, and permission requests for re-use of supplemental material or any part of supplemental material shall be sent directly to the copyright owner as specified in the copyright notice associated with the article.
