




Abstract
Significance:
Postoperative Pressure Injuries (PIs) present unique risks, requiring dedicated research for accurate assessment. Despite the increasing number of Intraoperative Acquired Pressure Injury (IAPI) prediction models, their risk of bias and clinical applicability remains unclear.
Recent Advances:
Adhered to the 2020 Preferred Reporting Items for Systematic Reviews and Meta-Analyses statement requirements, IAPI prediction models of adult inpatients (≥18 years) were systematically retrieved from eight databases. Bias risk and applicability were evaluated using the Prediction model Risk Of Bias Assessment Tool (PROBAST), followed by narrative synthesis.
Critical Issues:
From 837 studies, 25 were included, covering 32 prediction models. Most studies (88%) were single-center and conducted in China, Korea, the United States, or Singapore, spanning various surgical specialties. Among 26,142 participants, IAPI incidence ranged from 4.1% to 41.75%. Common predictors included surgery duration, age, and diabetes. Areas Under the Curve (AUC) values varied from 0.702 to 0.984, but calibration was underreported. All studies had high bias risk, with 22 models exhibiting applicability concerns.
Hongying Pan, MSc
Future Directions:
The development of IAPI models requires a clear definition of the timing and personnel responsible for assessing PIs, with a preference for prospective data collection and thorough internal and external validation. Adherence to the critical appraisal and data extraction for systematic reviews of prediction modeling studies checklist and PROBAST guidelines can improve reporting quality. Models should be user-friendly, clinically applicable, and rigorously validated. Precisely defining and rigorously selecting predictors is critical to reducing variability. Future research should adopt more stringent designs to develop high-quality models capable of effectively guiding clinical practice.
PROSPERO registration number: CRD42024502726.
SCOPE AND SIGNIFICANCE
Surgery is a significant risk factor for PIs, and IAPI is among the most common types, imposing a substantial burden on patients. Risk prediction models can help identify high-risk patients to guide clinical practice; however, their performance and quality require careful attention. This review systematically examines and evaluates existing IAPI models, identifies critical issues, and gaps, and provides constructive recommendations for future model development to enhance their clinical applicability and reliability.
TRANSLATIONAL RELEVANCE
IAPI imposes a significant burden on surgical patients, highlighting the critical need for accurate risk prediction models. This systematic review identifies key limitations and gaps in existing IAPI models, including high bias risk, inadequate external validation, and limited clinical applicability. By addressing these issues, future models can bridge the gap between predictive research and clinical practice. Implementing robust, validated, and user-friendly IAPI prediction tools could enable personalized risk assessment, enhance preventive strategies, and ultimately improve patient outcomes in surgical settings.
CLINICAL RELEVANCE
Common predictive factors for IAPI models, such as surgical duration, age, and diabetes, warrant close attention when assessing the risk of PIs in surgical patients. The prediction of IAPI risk holds significant clinical value, offering the potential to guide targeted interventions, improve patient outcomes, and optimize resource allocation. Integrating these predictors into robust and validated models can enhance clinical decision-making and contribute to more effective pressure injury prevention strategies.
INTRODUCTION
Studies have shown that surgeries lasting more than two hours significantly raise the incidence of PIs. 1 PIs are characterized by localized damage to the skin and underlying tissues, often developing over bony prominences or near medical devices. They result from prolonged or intense pressure, often exacerbated by shear forces, with severity ranging from intact skin to open ulcers, which may be painful. 2 Postoperative PIs worsen patient outcomes by delaying recovery, increasing complications, prolonging hospital stays, and raising health care costs.3–5 In the United States, the annual treatment cost for IAPI is estimated between $75 million and $150 million, with an associated increase of 10 days in hospital stay. 6 These findings underscore the importance of addressing PIs in surgical patients. In 2023, the Chinese Nursing Association identified IAPI as one of the most common hospital-acquired PIs, typically developing during surgery. 3 IAPIs may appear immediately after surgery or within hours to 3 days postoperatively. Therefore, accurate IAPI risk assessment is essential for clinical nurses to implement targeted preventive measures, providing a foundation for reducing IAPI incidence.
The Braden Scale is the most widely used tool for PI risk assessment in clinical settings. However, its applicability to postoperative patients is limited, as it does not account for specific intraoperative risk factors. Furthermore, it has been found inadequate for predicting short-term PIs, such as those occurring immediately after surgery. 7 In contrast, risk prediction models, which combine multiple predictors to estimate risk (diagnostic models) or predict future events (prognostic models), 8 are more suitable for identifying patients at high risk of IAPI. As early as 2012, researchers began developing IAPI risk prediction models using methods such as the Mahalanobis Taguchi System (MTS), support vector machines (SVMs), decision trees (DT), and logistic regression (LR), incorporating machine learning into risk prediction. 9 Since then, numerous models have been developed across different surgical specialties, populations, and countries, employing various methodologies.6,10–12 While these models offer valuable tools for personalized IAPI risk assessment, their practical utility depends not only on predictive performance but also on the rigor of model development, completeness of reporting, reproducibility, and generalizability. Therefore, systematically evaluating the bias risk and applicability of existing IAPI models is crucial for advancing the development of clinically useful, high-performance models. This study aims to systematically assess the bias risk and applicability of IAPI risk prediction models, identify their limitations, and provide a foundation for future efforts to create models that can be effectively integrated into clinical practice.
METHODS
This systematic review was registered on the International Prospective Register of Systematic Reviews database and the number is CRD42024502726. This study was conducted in accordance with the requirements of the 2020 Preferred Reporting Items for Systematic Reviews and Meta-Analyses statement. 13 The comprehensive overview of this study is illustrated in Fig. 1.
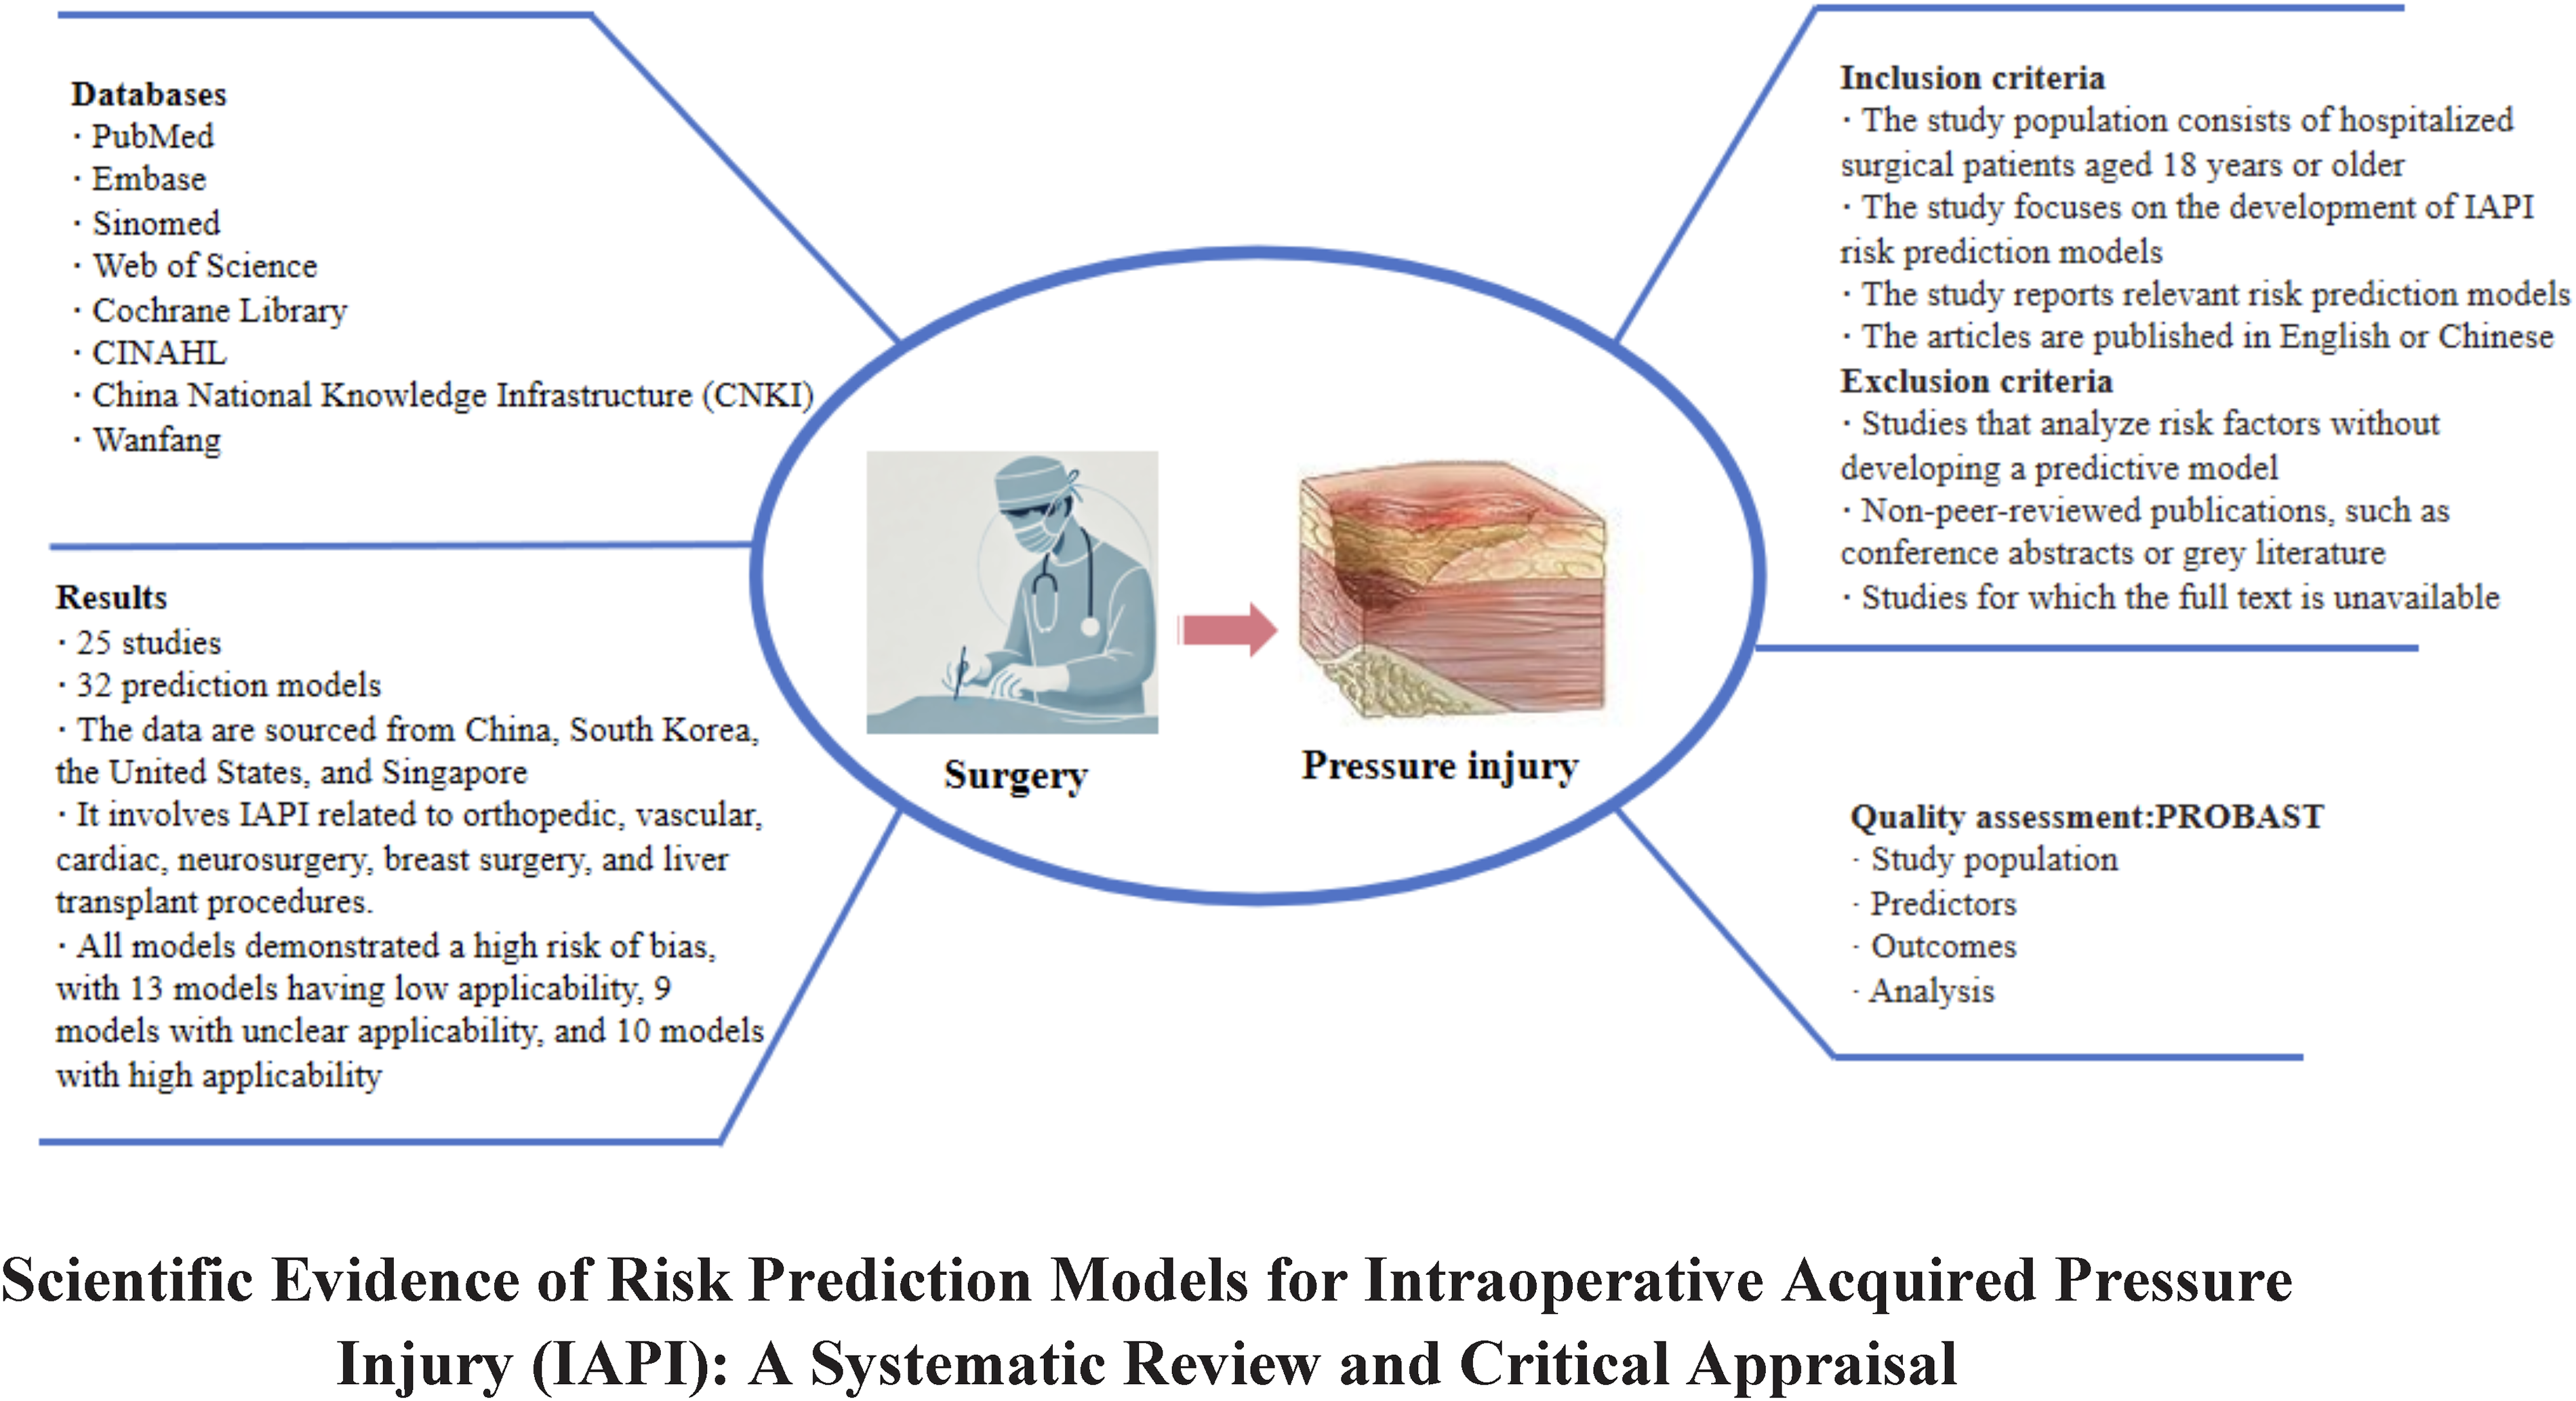
The summary graphic illustration of this study.
Data sources and search strategy
Studies were retrieved from PubMed, Embase, Sinomed, Web of Science, Cochrane Library, CINAHL, China National Knowledge Infrastructure, VIP Database and Wanfang Database, covering the period from the inception of these databases to January 23, 2024. The search strategy includes the following English keywords: “predict*/risk assessment/nomogram/risk model/risk score/diagnos*/risk factor,” “pressure ulcer/decubitus ulcer/pressure sore/bed sore/ulcer pressure/pressure injury/pressure damage/decubitus sore,” and “surgical/intraoperative*/surgery-related/operati*.” A combination of subject headings and keywords is used for the search, primarily employing automated methods supplemented by manual searches. Additionally, the references of retrieved studies are reviewed for further relevant articles. The detailed search strategy is provided in Supplementary Data. Electronic laboratory notebook was not used.
Inclusion and exclusion criteria
The inclusion criteria for the study were as follows: (1) the study population consisted of hospitalized surgical patients aged 18 years or older; (2) the study focuses on the development of IAPI risk prediction models; (3) the study reports relevant risk prediction models; and (4) the articles were published in English or Chinese. Articles were excluded if they met any of the following criteria: (1) studies that analyze risk factors without developing a prediction model; (2) non-peer-reviewed publications, such as conference abstracts or gray literature; and (3) studies for which the full text was unavailable.
Study selection
Two researchers (Y.X. and H.Z.) independently screened the literature and extracted data according to the inclusion and exclusion criteria. Each step was cross-verified, and any discrepancies were resolved through discussion or, if necessary, by consulting a third researcher (S.W.) for further judgment. The literature screening process involved using NoteExpress software to automatically remove duplicates, followed by a manual check for any remaining duplicates. Titles and abstracts were initially reviewed to exclude clearly irrelevant studies, and the full texts of the remaining articles were assessed to finalize the study selection. The detailed process of literature selection is presented in Fig. 2.
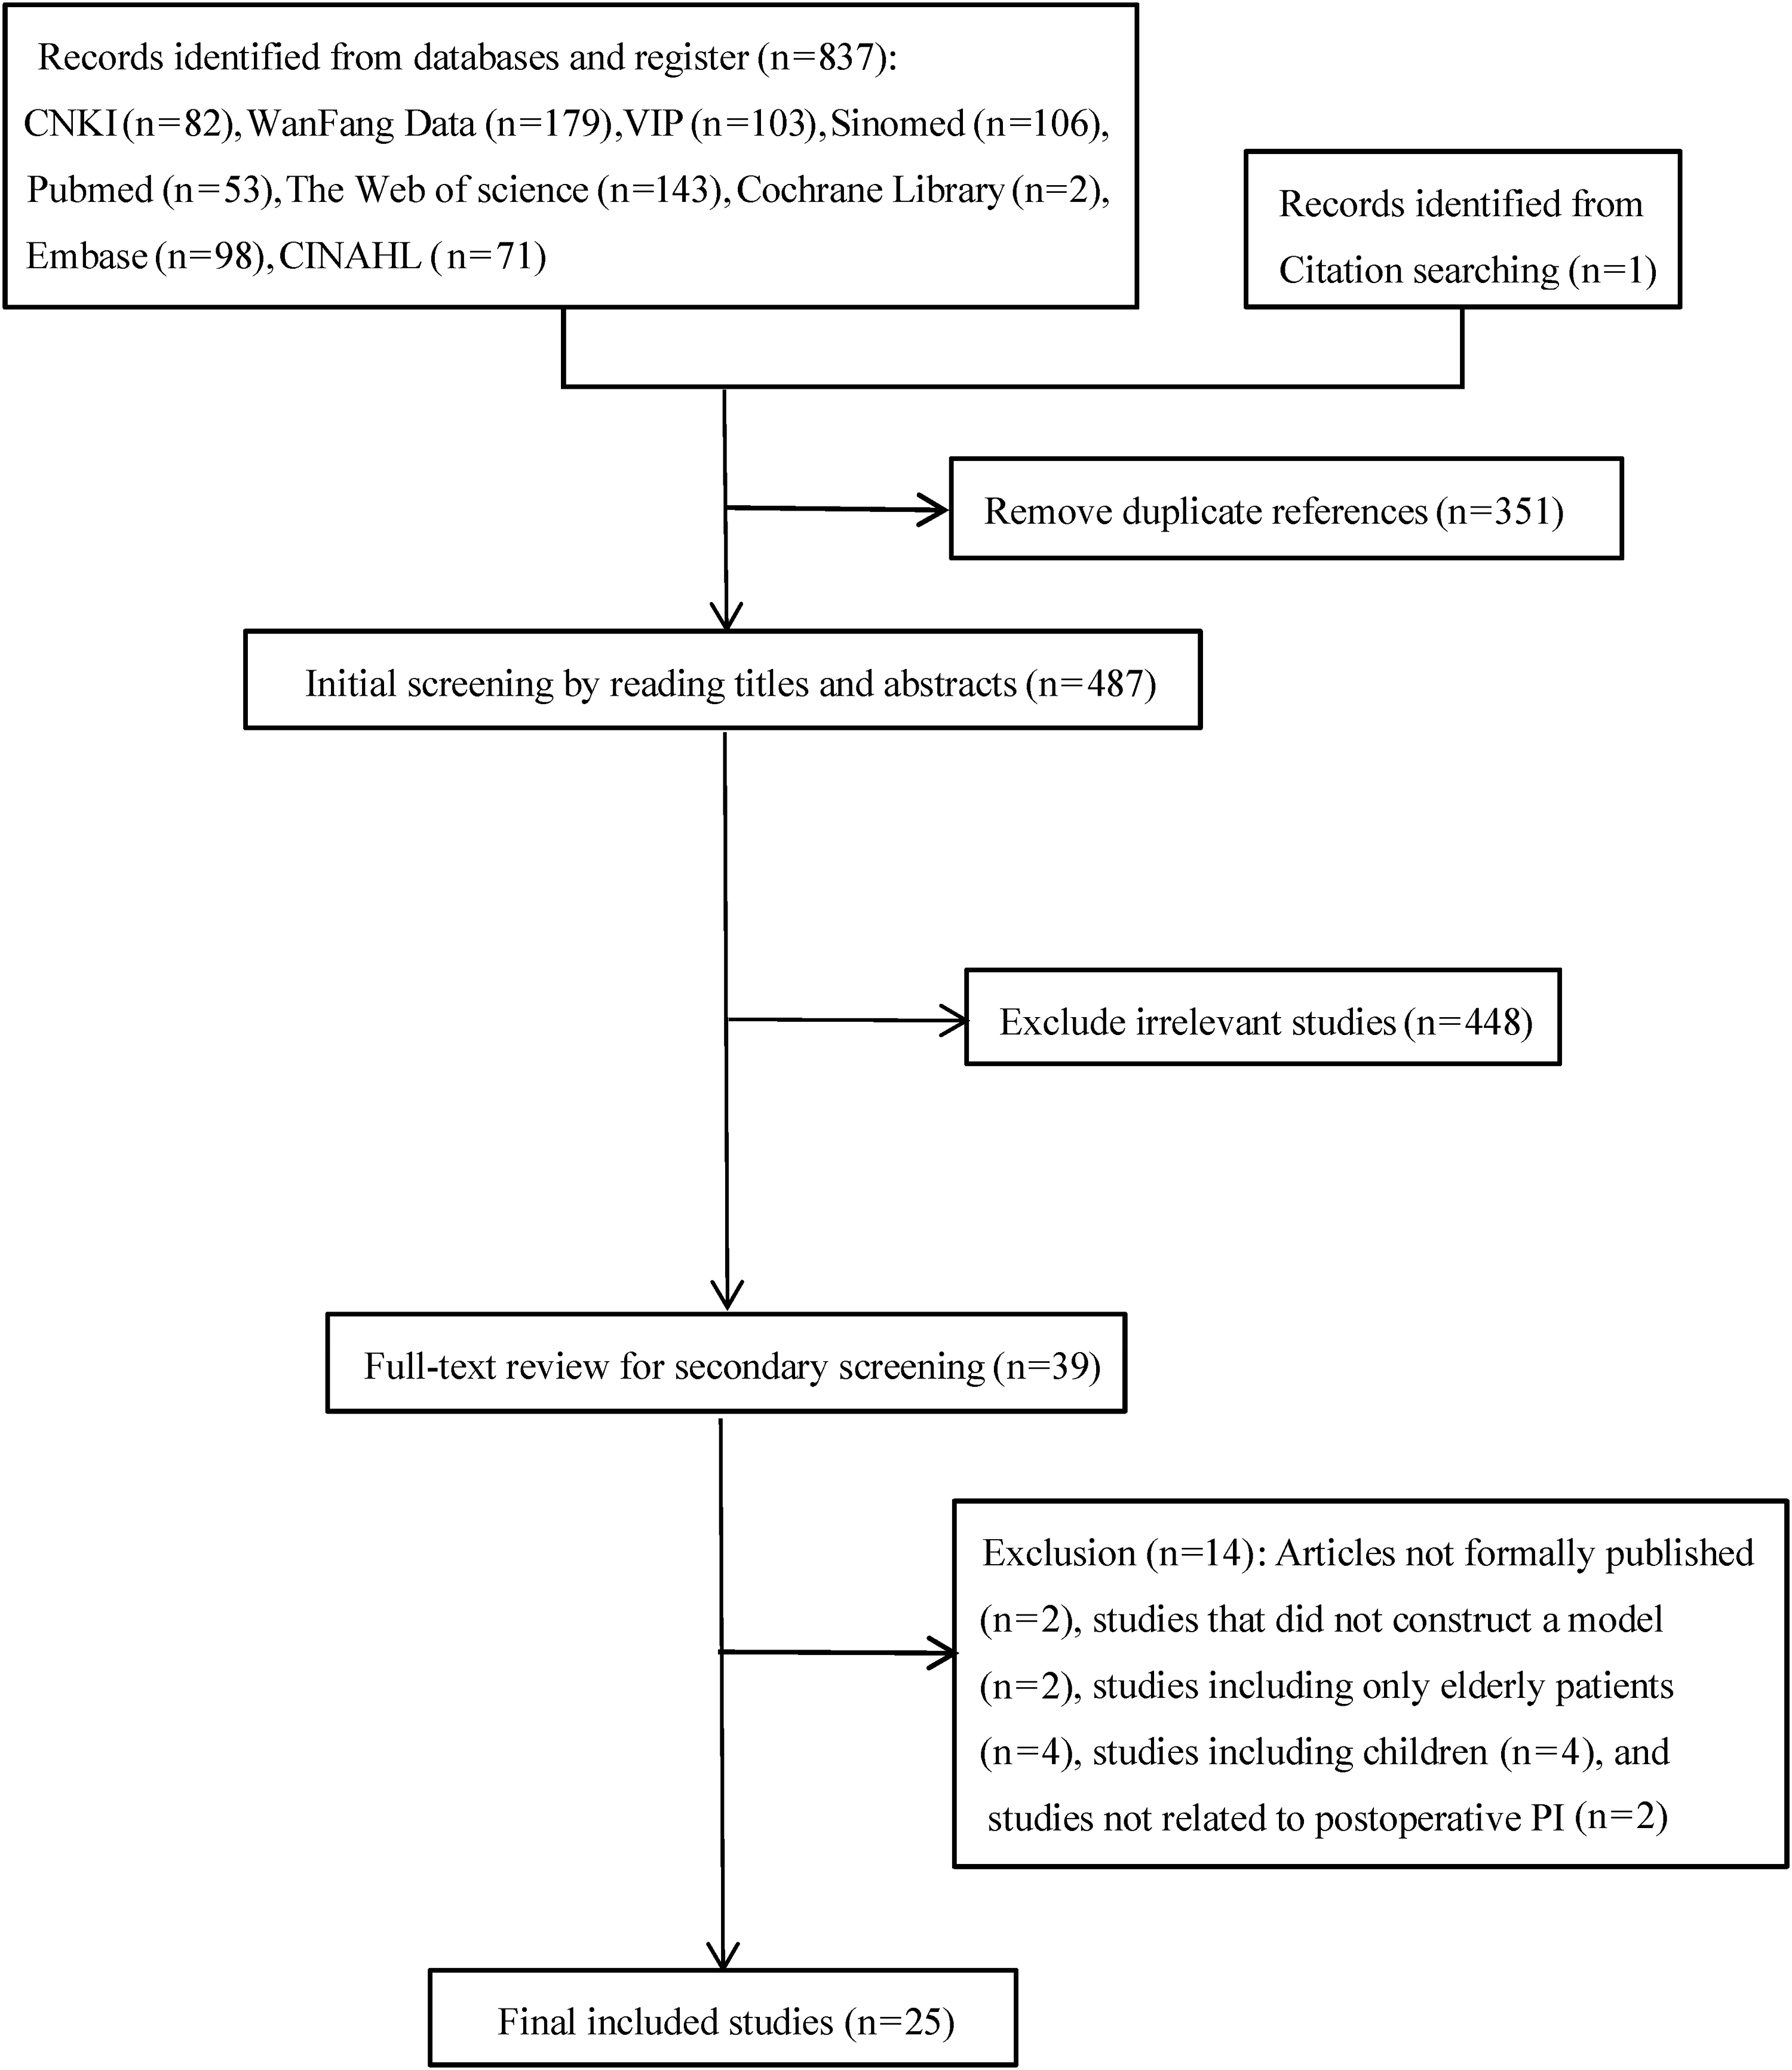
PRISMA flow diagram of the study selection process. PRISMA, Preferred Reporting Items for Systematic Reviews and Meta-Analyses.
Data extraction
After selecting the included studies, a standardized data extraction form was developed based on the critical appraisal and data extraction for systematic reviews of prediction modeling studies (CHARMS) framework. 14 This led to the creation of Table 1 (overview of basic data of the included studies), which presents information such as country, study design, participants, location, data source, timing of IAPI measurement, and IAPI cases/total sample (%). Additionally, Table 2 (overview of the included prediction models) was developed, detailing aspects such as continuous variable processing methods, candidate variables, event per variable (EPV), variable selection, handling of missing data, model development methods, model AUC, calibration methods, validation methods, and model presentation.
Overview of basic data of the included studies (n = 25)
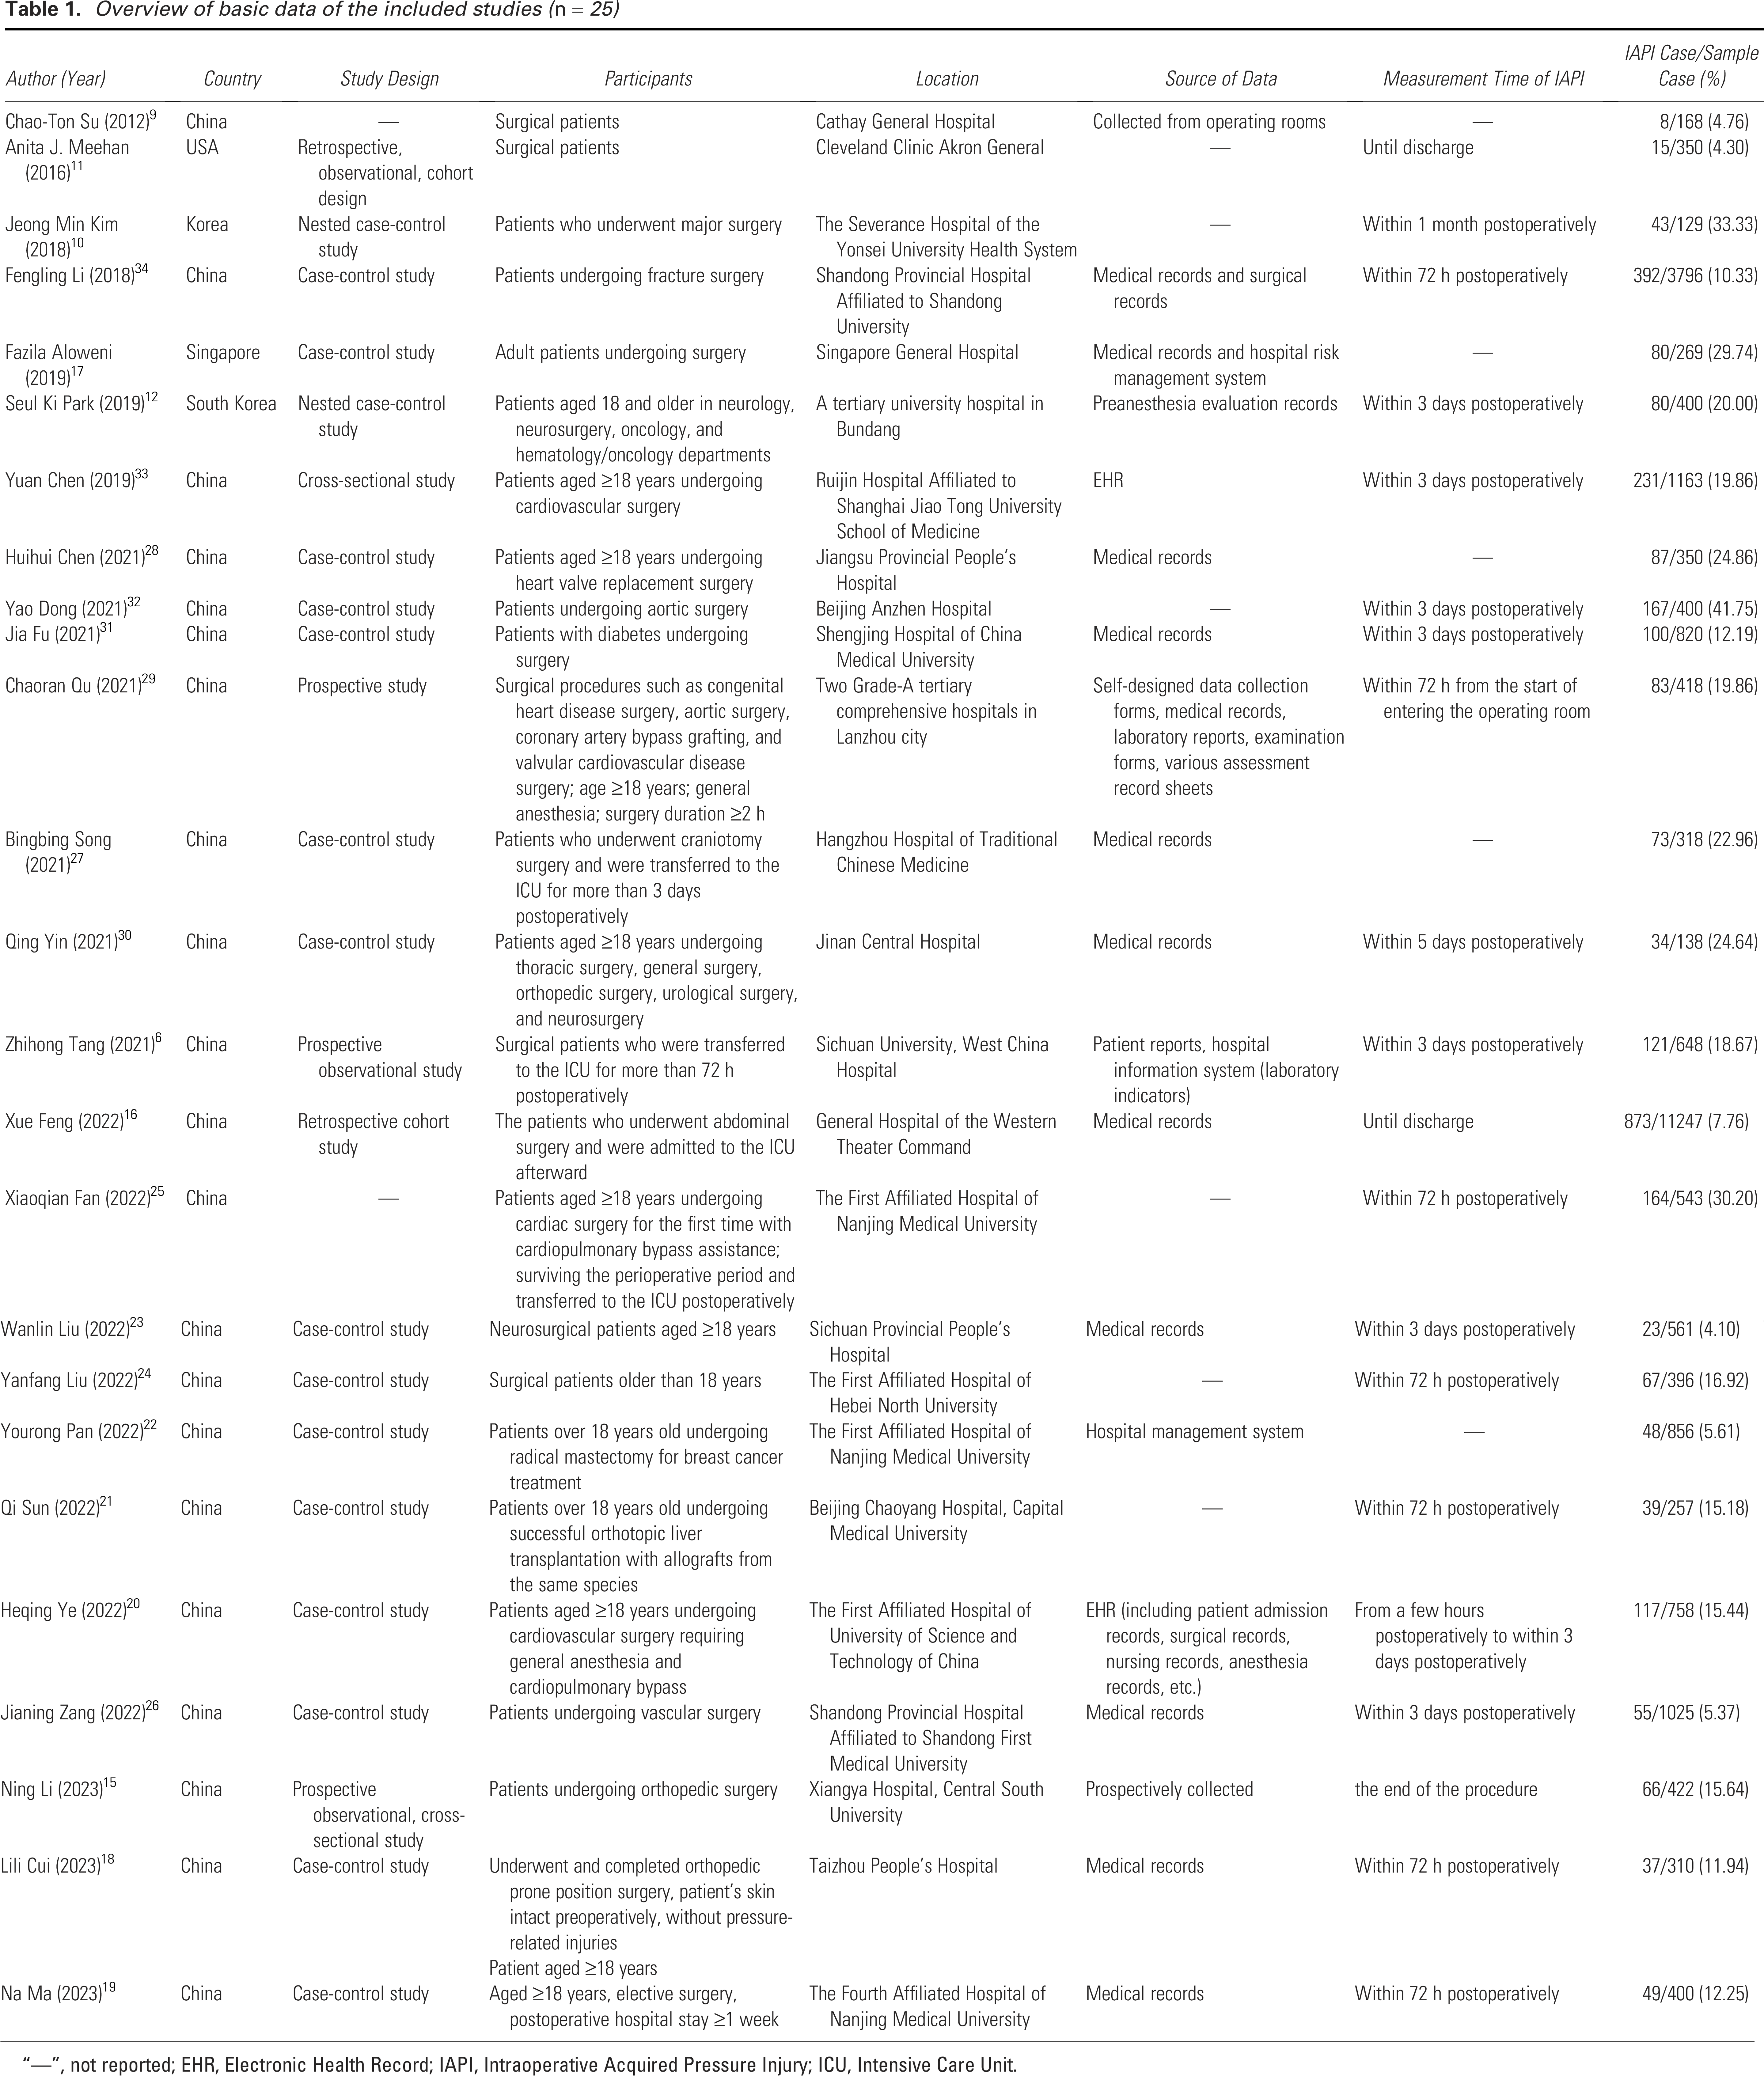
“—”, not reported; EHR, Electronic Health Record; IAPI, Intraoperative Acquired Pressure Injury; ICU, Intensive Care Unit.
Overview of the information of the included prediction models (n = 25)
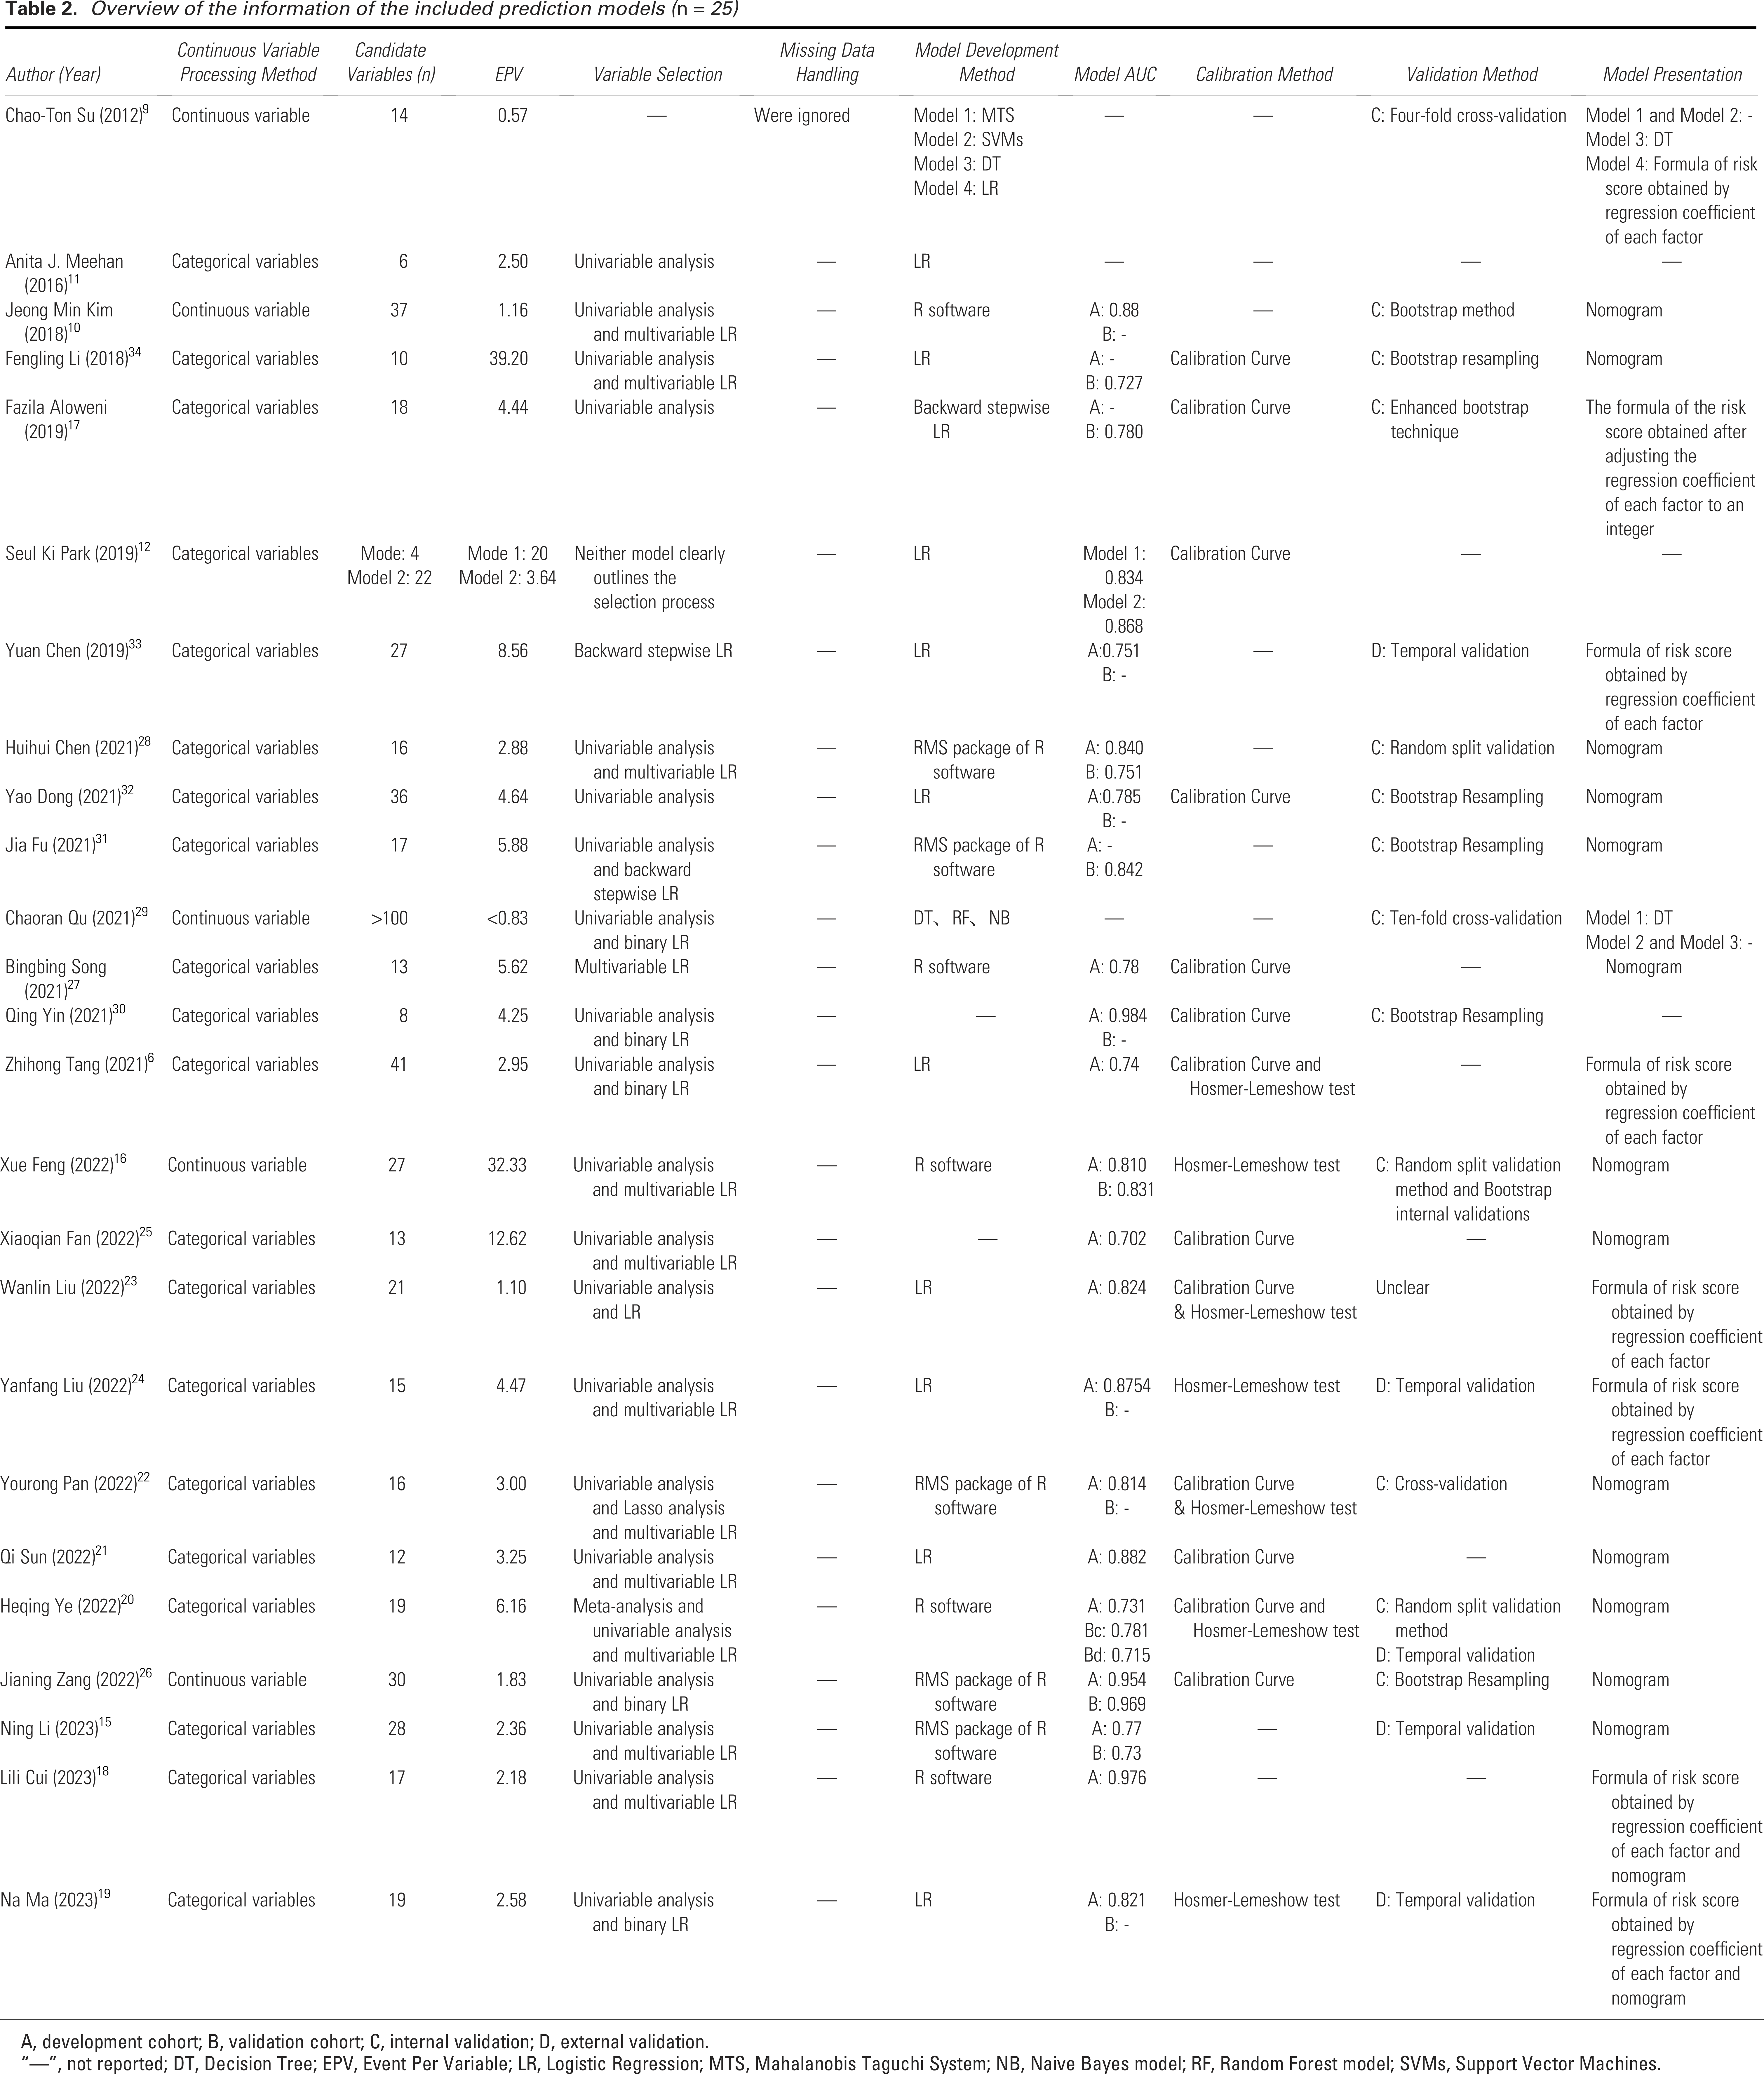
A, development cohort; B, validation cohort; C, internal validation; D, external validation.
“—”, not reported; DT, Decision Tree; EPV, Event Per Variable; LR, Logistic Regression; MTS, Mahalanobis Taguchi System; NB, Naive Bayes model; RF, Random Forest model; SVMs, Support Vector Machines.
Quality assessment
Two researchers (Y.X. and J.Z.) independently utilized the PROBAST 8 to evaluate the risk of bias and applicability of the models included in the literature. In cases of disagreement, the fourth author (S.W.) participated in discussions to reach a consensus on the final assessment results regarding bias risk and applicability. The PROBAST tool categorizes potential bias risks in prediction model studies into four domains: study population, predictors, outcomes, and analysis, encompassing 2, 3, 6, and 9 signaling questions, respectively, for a total of 20 signaling questions. The applicability assessment focuses on the first three domains—study population, predictors, and outcomes—following a process similar to that of the bias risk assessment, though it does not include specific signaling questions.
Assessors evaluated each signaling question based on the literature content, classifying results as “Yes,” “Probably Yes,” “Probably No,” “No,” or “No Information Provided”. Response of “Yes” indicates a low risk of bias, while “No” indicates a high risk. If the original study did not address a relevant signaling question, it was classified as “No Information Provided.” If all signaling questions within a domain were answered “Yes” or “Probably Yes,” that domain was deemed “Low Risk.” Conversely, if at least one signaling question was answered “No” or “Probably No,” the domain was considered potentially “High Risk.” If a signaling question was classified as “No Information Provided,” while all other questions in that domain were assessed as “Low Risk,” the domain was classified as “Unclear Risk.” The overall risk of bias assessment is based on the results from each domain. Notably, even if all four domains are assessed as low risk, the overall risk of bias for the model may still be downgraded to high risk due to a lack of external validation.
Data synthesis
We first presented the specific details of the included studies and the basic characteristics of the risk prediction models using Tables 1 and 2. Due to the heterogeneity of the included studies, particularly with regard to the types of surgeries and predictors, a meta-analysis was not feasible. For example, predictors for cardiac surgery differ significantly from those for other types of surgeries. Therefore, instead of conducting a meta-analysis, we adopted a descriptive review approach to present the findings, with a focus on identifying sources of bias and reporting deficiencies in the included studies.
RESULTS
Search results
The literature search strategy and results are illustrated in Fig. 2. The systematic search identified 837 records, with an additional record found through citation tracking. After removing 351 duplicates, 448 records were excluded based on title and abstract review. Full-text screening was conducted on the remaining 39 records, with 14 excluded for reasons outlined in Fig. 2. Ultimately, 25 studies were included in this systematic review.6,9–12,15–34 Among these, 21 studies (84%) were published in the last 5 years, 15 (60%) were in Chinese, and 2 (8%) were Chinese postgraduate theses. Additionally, eight studies (32%) were published in English-language journals, collectively reporting 32 IAPI risk prediction models.
Model development and validation
Table 1 presents the basic characteristics of the 25 included studies, while Table 2 details the features of the 32 risk prediction models. These models were developed using 25 data sources. Three models from Qu 29 utilized data from two hospitals, while the remaining 22 models (88%) were based on single-center data. The majority of data sources were from China (n = 21, 84%), followed by South Korea (n = 2, 8%), the United States (n = 1, 4%), and Singapore (n = 1, 4%). Nearly half of the model data originated from traditional case-control studies (n = 15, 46.88%) was derived from nested case-control studies, while five models (15.63%) used prospective data. Three models (9.38%) were based on retrospective cohort data, and one model was derived from cross-sectional survey data. Five models did not specify the data source. Seven models (21.88%) explicitly included multiple surgical types, while eight models (25%) did not specify the types of surgeries. Notably, 17 models (53.13%) clearly defined a single surgical specialty, with cardiac surgery being the most represented (n = 8, 25%). This was followed by orthopedic surgery (n = 3, 9.38%) and neurosurgery (n = 3, 9.38%). Additionally, there were prediction models related to vascular surgery (n = 1, 3.13%) and breast surgery (n = 1, 3.13%). One model (3.13%) focused specifically on IAPI related to liver transplantation.
Among the 26,142 participants involved in the model development, the number of cases of IAPI ranged from 8 to 873, with an incidence rate of 4.10–41.75%. Regarding the diagnosis of PI, seven models (21.88%) did not specify the diagnostic criteria used for PI diagnosis; the remaining models adopted the National Pressure Injury Advisory Panel 2 standards or other published PI staging criteria in collaboration with other organizations. Concerning the outcomes predicted by the models, while all final groupings were divided into PI and non-PI groups, only five models (15.63%) regarded any degree of PI as a predicted outcome. Five models (15.63%) considered stages 1 to 4 PI as the predicted outcome, while nine models (28.13%) focused on stages 1 to 2 as the outcome. One model even limited its outcome to Stage 1 PI (3.13%). Unfortunately, 12 models (37.5%) did not specify which stages of PI were included as outcomes. Regarding the timing of IAPI occurrence, the included models did not appear to reach a consensus; however, more than half of the models (n = 18, 56.25%) recognized postoperative day 3 as the cutoff time for IAPI outcome measures. Although the starting point of 3 days remains controversial, some models acknowledged the end of surgery (n = 1), postoperative day 5 (n = 1), 1 month postsurgery (n = 1), and before discharge (n = 3, 9.38%) as cutoff times for IAPI. Unfortunately, eight models (25%) did not specify the exact timing for IAPI.
Regarding the methods used for model development, 14 models (43.75%) employed traditional LR. Ten models (31.25%) utilized software packages in R, while six models (18.75%) employed machine learning methods, including MTS, SVMs, DT, random forest, and Naive Bayes. Two models (6.25%) did not specify the development methods used. The number of candidate predictive factors ranged from 4 to 41, with three models featuring over 100 candidate predictive factors. Eighteen models (31.25%) used univariable analysis and multivariable LR to determine the final predictive factors. Two models incorporated Lasso regression and meta-analysis, respectively, in addition to these two methods. Four models (12.5%) relied solely on univariable analysis, while two models used only LR. Additionally, six models (18.75%) did not report their variable selection processes.
The number of predictive factors included in each risk prediction model ranged from 3 to 13, covering a total of 79 distinct predictors. The detailed information of the final predictor variables is presented in Table 3. These factors were primarily categorized as preoperative or surgery related. The most frequently included predictor was the duration of surgery (n = 22, 68.75%), followed by age (n = 15, 46.88%), Diabetes Mellitus (DM) (n = 11, 34.38%), preoperative albumin level (n = 8, 25%), and Body Mass Index (BMI) (n = 8, 25%). Further details can be found in Supplementary Table S1. Figure 3 displays a histogram of predictors with a frequency of at least 2, addressing the large number of variables. EPV data, reflecting the ratio of outcome events to the number of candidate predictors, showed that only two models had an EPV greater than 30. The model by Fan et al. 25 had an EPV above 10, while the remaining models had EPVs below 10. Notably, more than half of the models (n = 23, 71.88%) had an EPV below 5, suggesting a high risk of overfitting.
Final predictor of the included prediction models (n = 25)

ALB, albumin; DM, diabetes mellitus; HB, hemoglobin; HTN, hypertension; INR, international normalized ratio; K+, potassium levels; MELD, Model for End-Stage Liver Disease; Na+, sodium level.
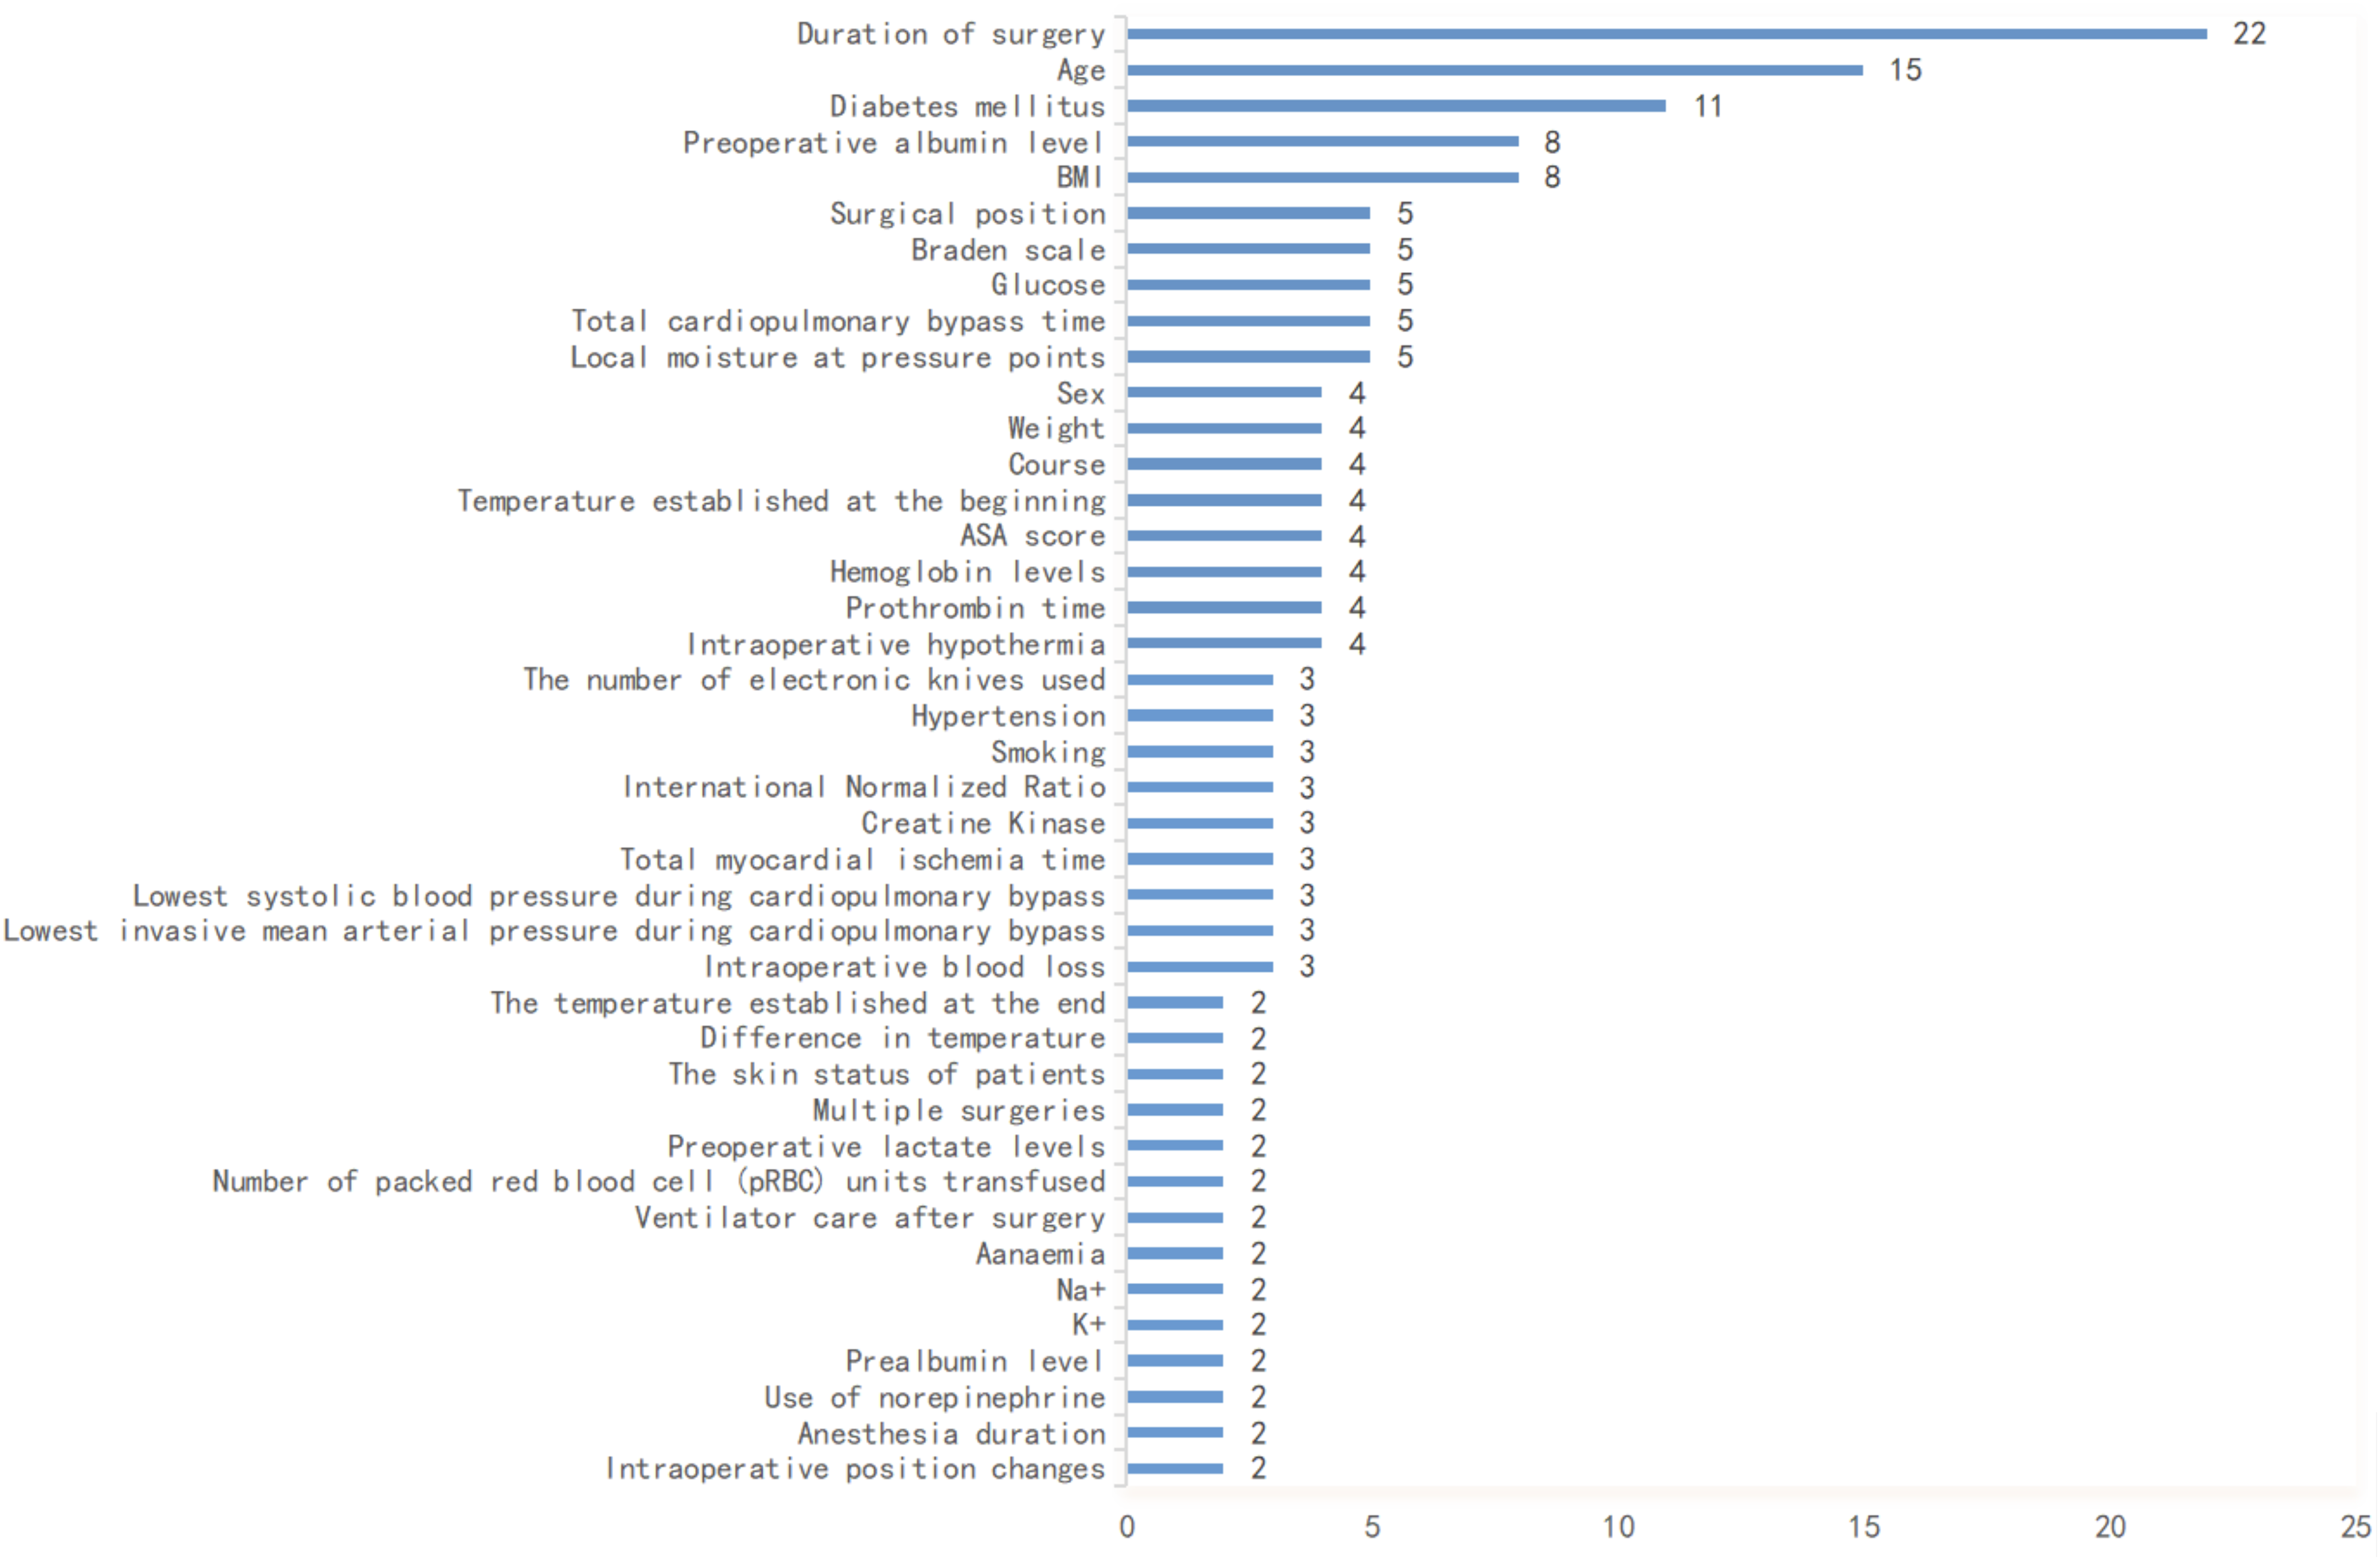
Summary of predictors included in the prediction models.
For continuous variables, more than half of the models (n = 22, 68.75%) categorized or classified continuous variables. Regarding the handling of missing data, nearly all models (n = 28, 87.5%) did not report any missing values or address how they were managed. Only four models (12.5%) mentioned missing data, all derived from the same study. The authors chose to exclude missing values directly, which may adversely affect the stability and interpretability of the models.
Inappropriate variable selection, low EPV, classification of continuous variables, and inadequate handling of missing data may contribute to overfitting in the final models. Thus, internal validation is particularly important. Eight models (25%) employed k-fold cross-validation, while seven models (21.88%) utilized bootstrap resampling validation. Three models (9.38%) implemented random split validation. To assess the extrapolation and generalization capabilities of the models, external validation is necessary. Only five models (15.63%) underwent external validation, all using temporal validation methods. The sample sizes for external validation ranged from 84 to 433 cases, confirming the consistency of model performance across different time periods. However, the timing of the external validation closely aligned with the model development period, potentially impacting the reliability of extrapolation. Therefore, we recommend that future studies extend the time intervals for temporal validation or adopt multicenter geographical validation to better demonstrate the robustness of the model. Nevertheless, regarding external validation, all models that underwent external validation clearly distinguished between the model development cohort and the validation cohort. However, among all models that underwent internal and/or external validation, only five models reported the performance of both the development and validation cohorts. This hinders a comprehensive evaluation of the models’ stability and generalizability across different datasets. Regarding model presentation, 13 models (40.63%) displayed risk prediction models using nomograms. Eight models (25%) derived risk assessment formulas from LR coefficients or rounded estimates. Two models presented their risk prediction models as DT, while nine models (28.13%) did not present their final prediction models.
Model performance
Discrimination of the included models
Nine models (28.13%) did not report discrimination results. The remaining models primarily utilized the AUC to assess discrimination, with values ranging from 0.702 to 0.984 during model development. Among the 18 models that underwent internal validation, only seven models reported discrimination results, all exceeding 0.7, indicating good discrimination; Zang et al. 26 achieved the highest AUC of 0.969. In the five models that underwent external validation, only those by Ye 20 and Li et al. 15 demonstrated discrimination, with AUC values of 0.715 and 0.73, respectively.
Calibration of the included models
The calibration of a prediction model refers to the consistency between predicted probabilities and actual occurrence probabilities. Ten models (37.81%) utilized calibration plots to assess calibration performance. Three models (12.5%) employed the Hosmer-Lemeshow test for calibration evaluation. Four models (12.5%) presented both calibration plots and Hosmer-Lemeshow test results. Unfortunately, 15 models (46.88%) did not report their calibration performance, which may affect the assessment of model reliability and its interpretability in clinical applications.
Practical applicability of the models
Six models (18.75%) were evaluated for their practical applicability using Decision Curve Analysis (DCA), and the reported net benefits all demonstrated excellent performance. However, it is worth noting that only the study by Feng et al. 16 performed DCA analysis during both the model construction and validation processes. Furthermore, their study compared the constructed model with the Braden Scale in DCA analyses. Nonetheless, a limitation of their analysis is that the net benefit was discussed only within a threshold range of 50%, which is insufficient for evaluating the overall practical applicability of the model. Unfortunately, other studies did not consider the practical applicability of the models, which represents a significant barrier to assessing their suitability for clinical environments.
Risk of bias and applicability of included studies
The risk of bias and applicability of the included studies were assessed using the PROBAST, a framework designed to evaluate the methodological quality of prediction models. The final evaluation results are presented in Table 4. All studies exhibited a high risk of bias, indicating methodological issues in the development of these models. Thirteen models (40.63%) were deemed to have low applicability, while nine models (28.13%) had unclear applicability. Ten models (31.25%) were considered to have high applicability. Our rigorous evaluation revealed consistent results regarding bias risk and applicability among multiple models derived from the same study. Consequently, the assessment results are presented based on the studies, with bias risk and applicability illustrated in Figs. 4 and 5.
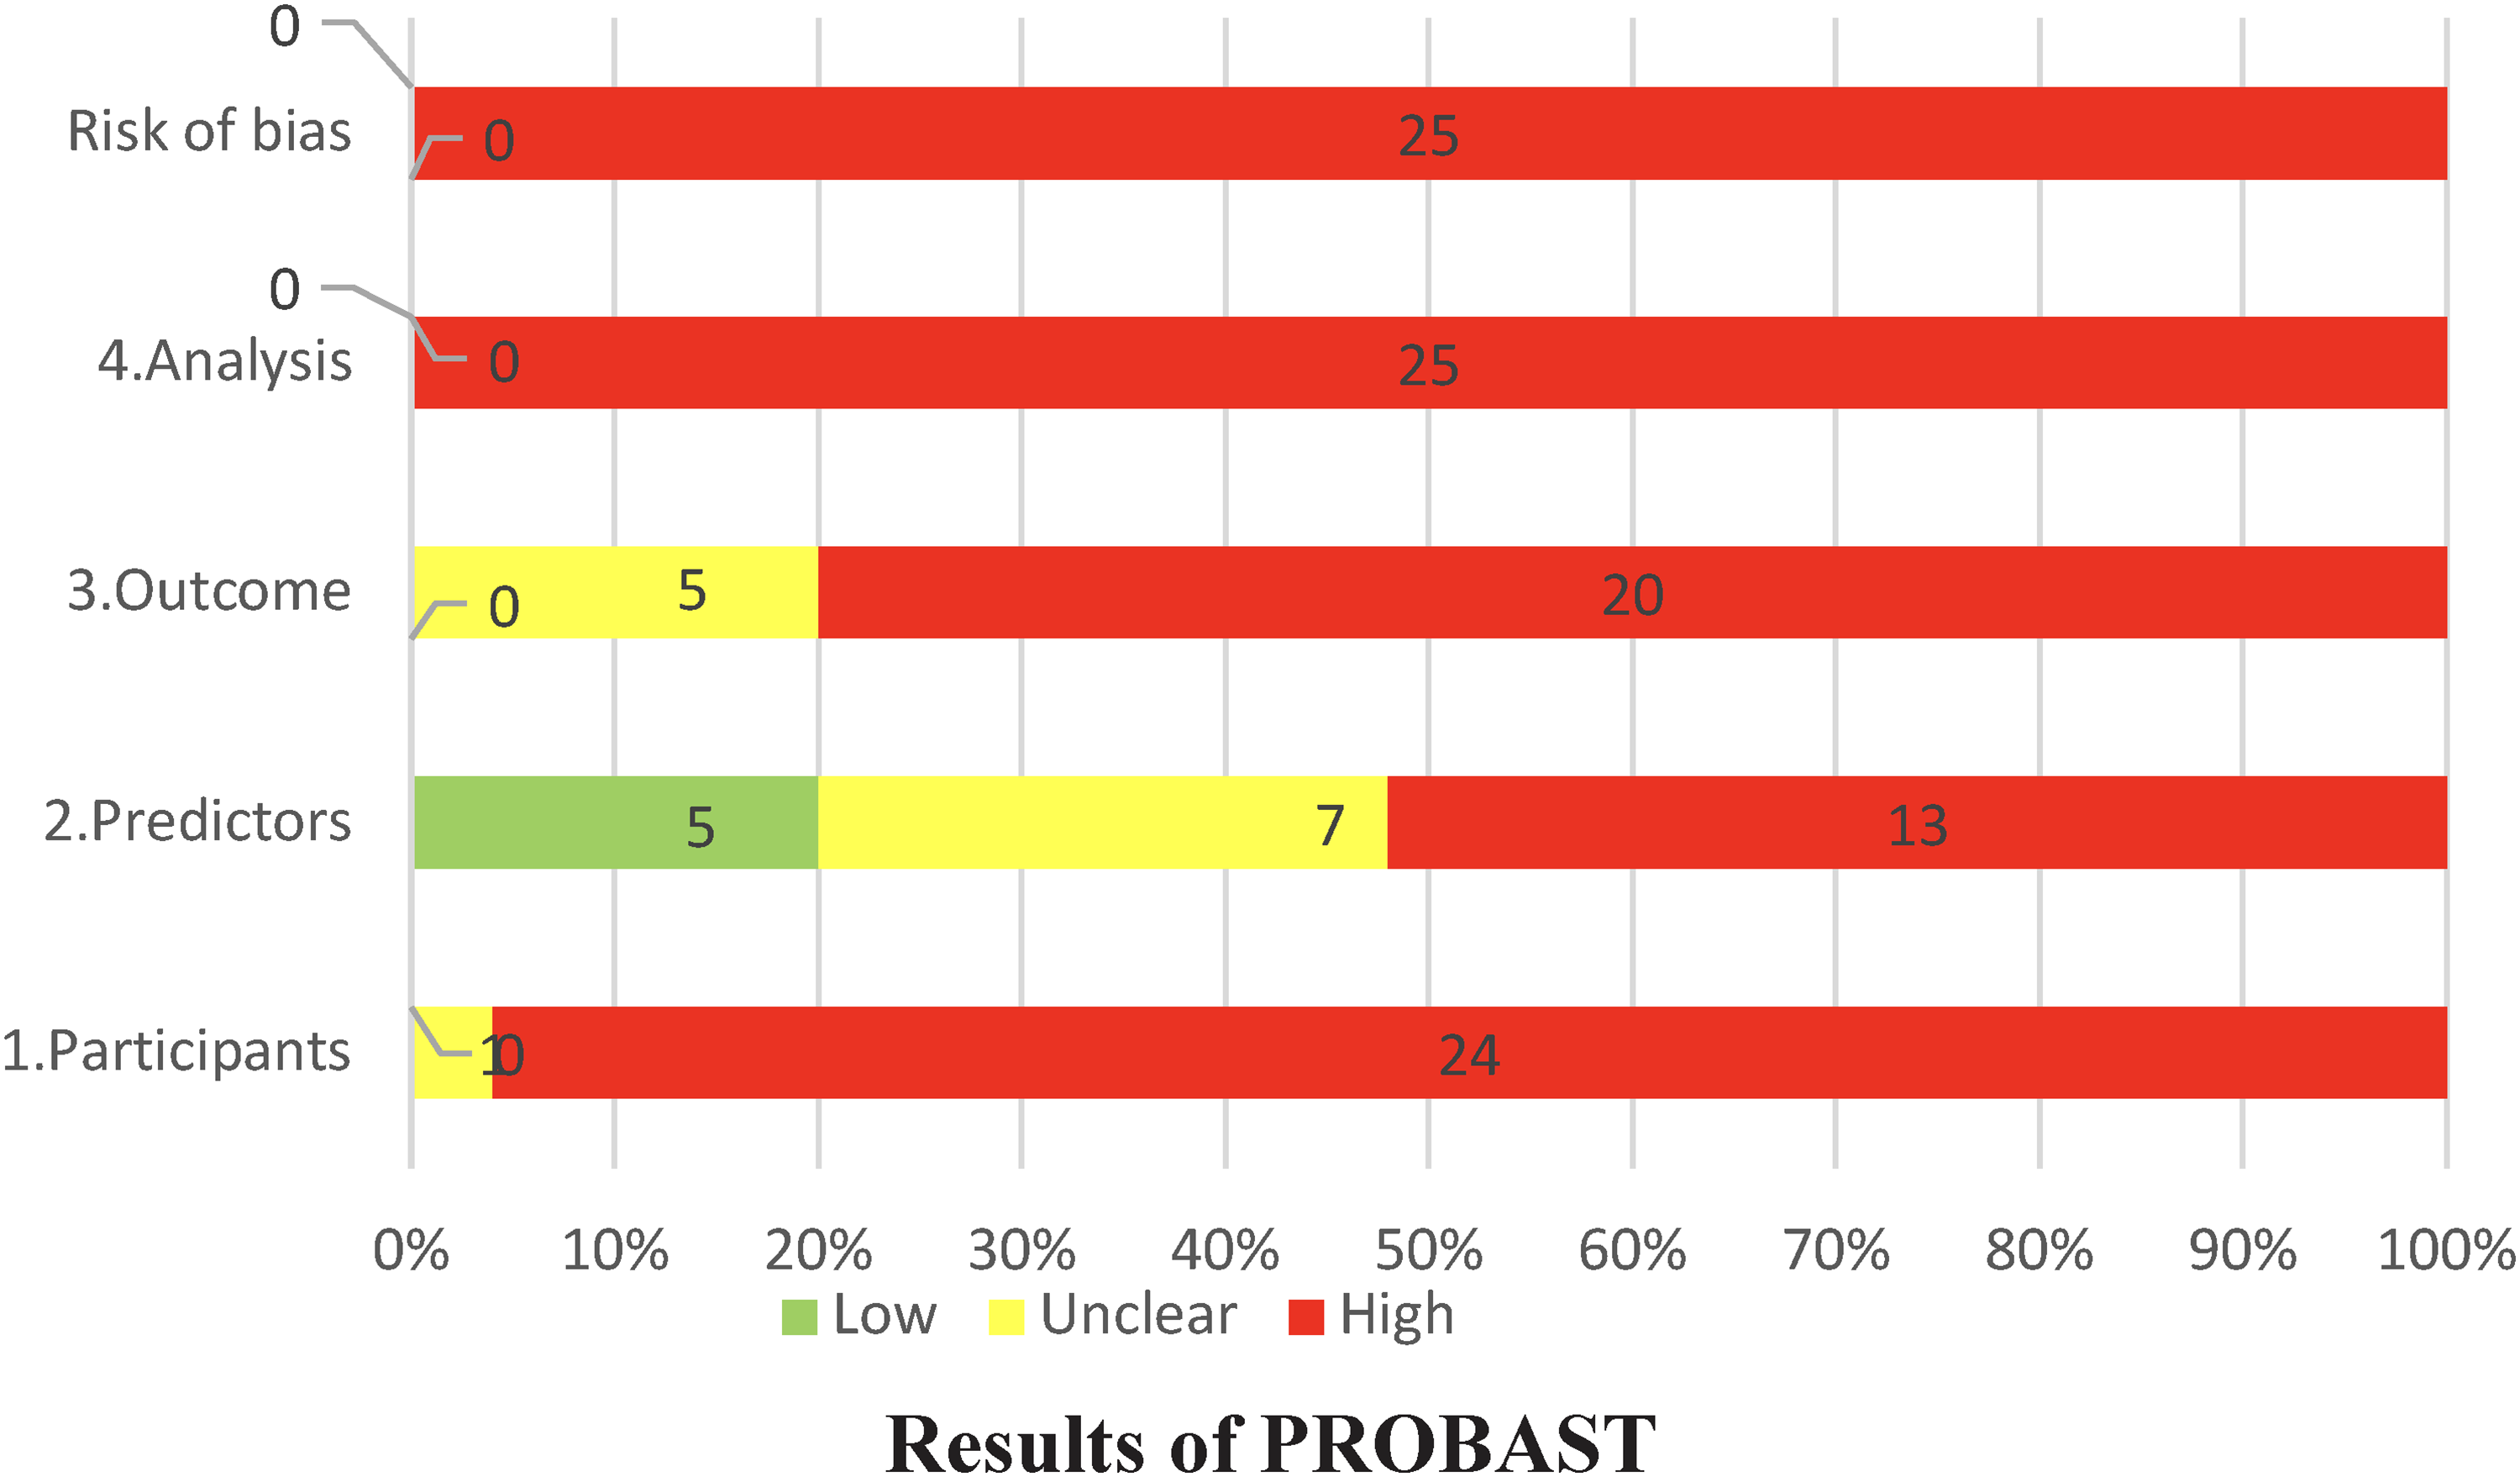
Risk of bias in included studies.
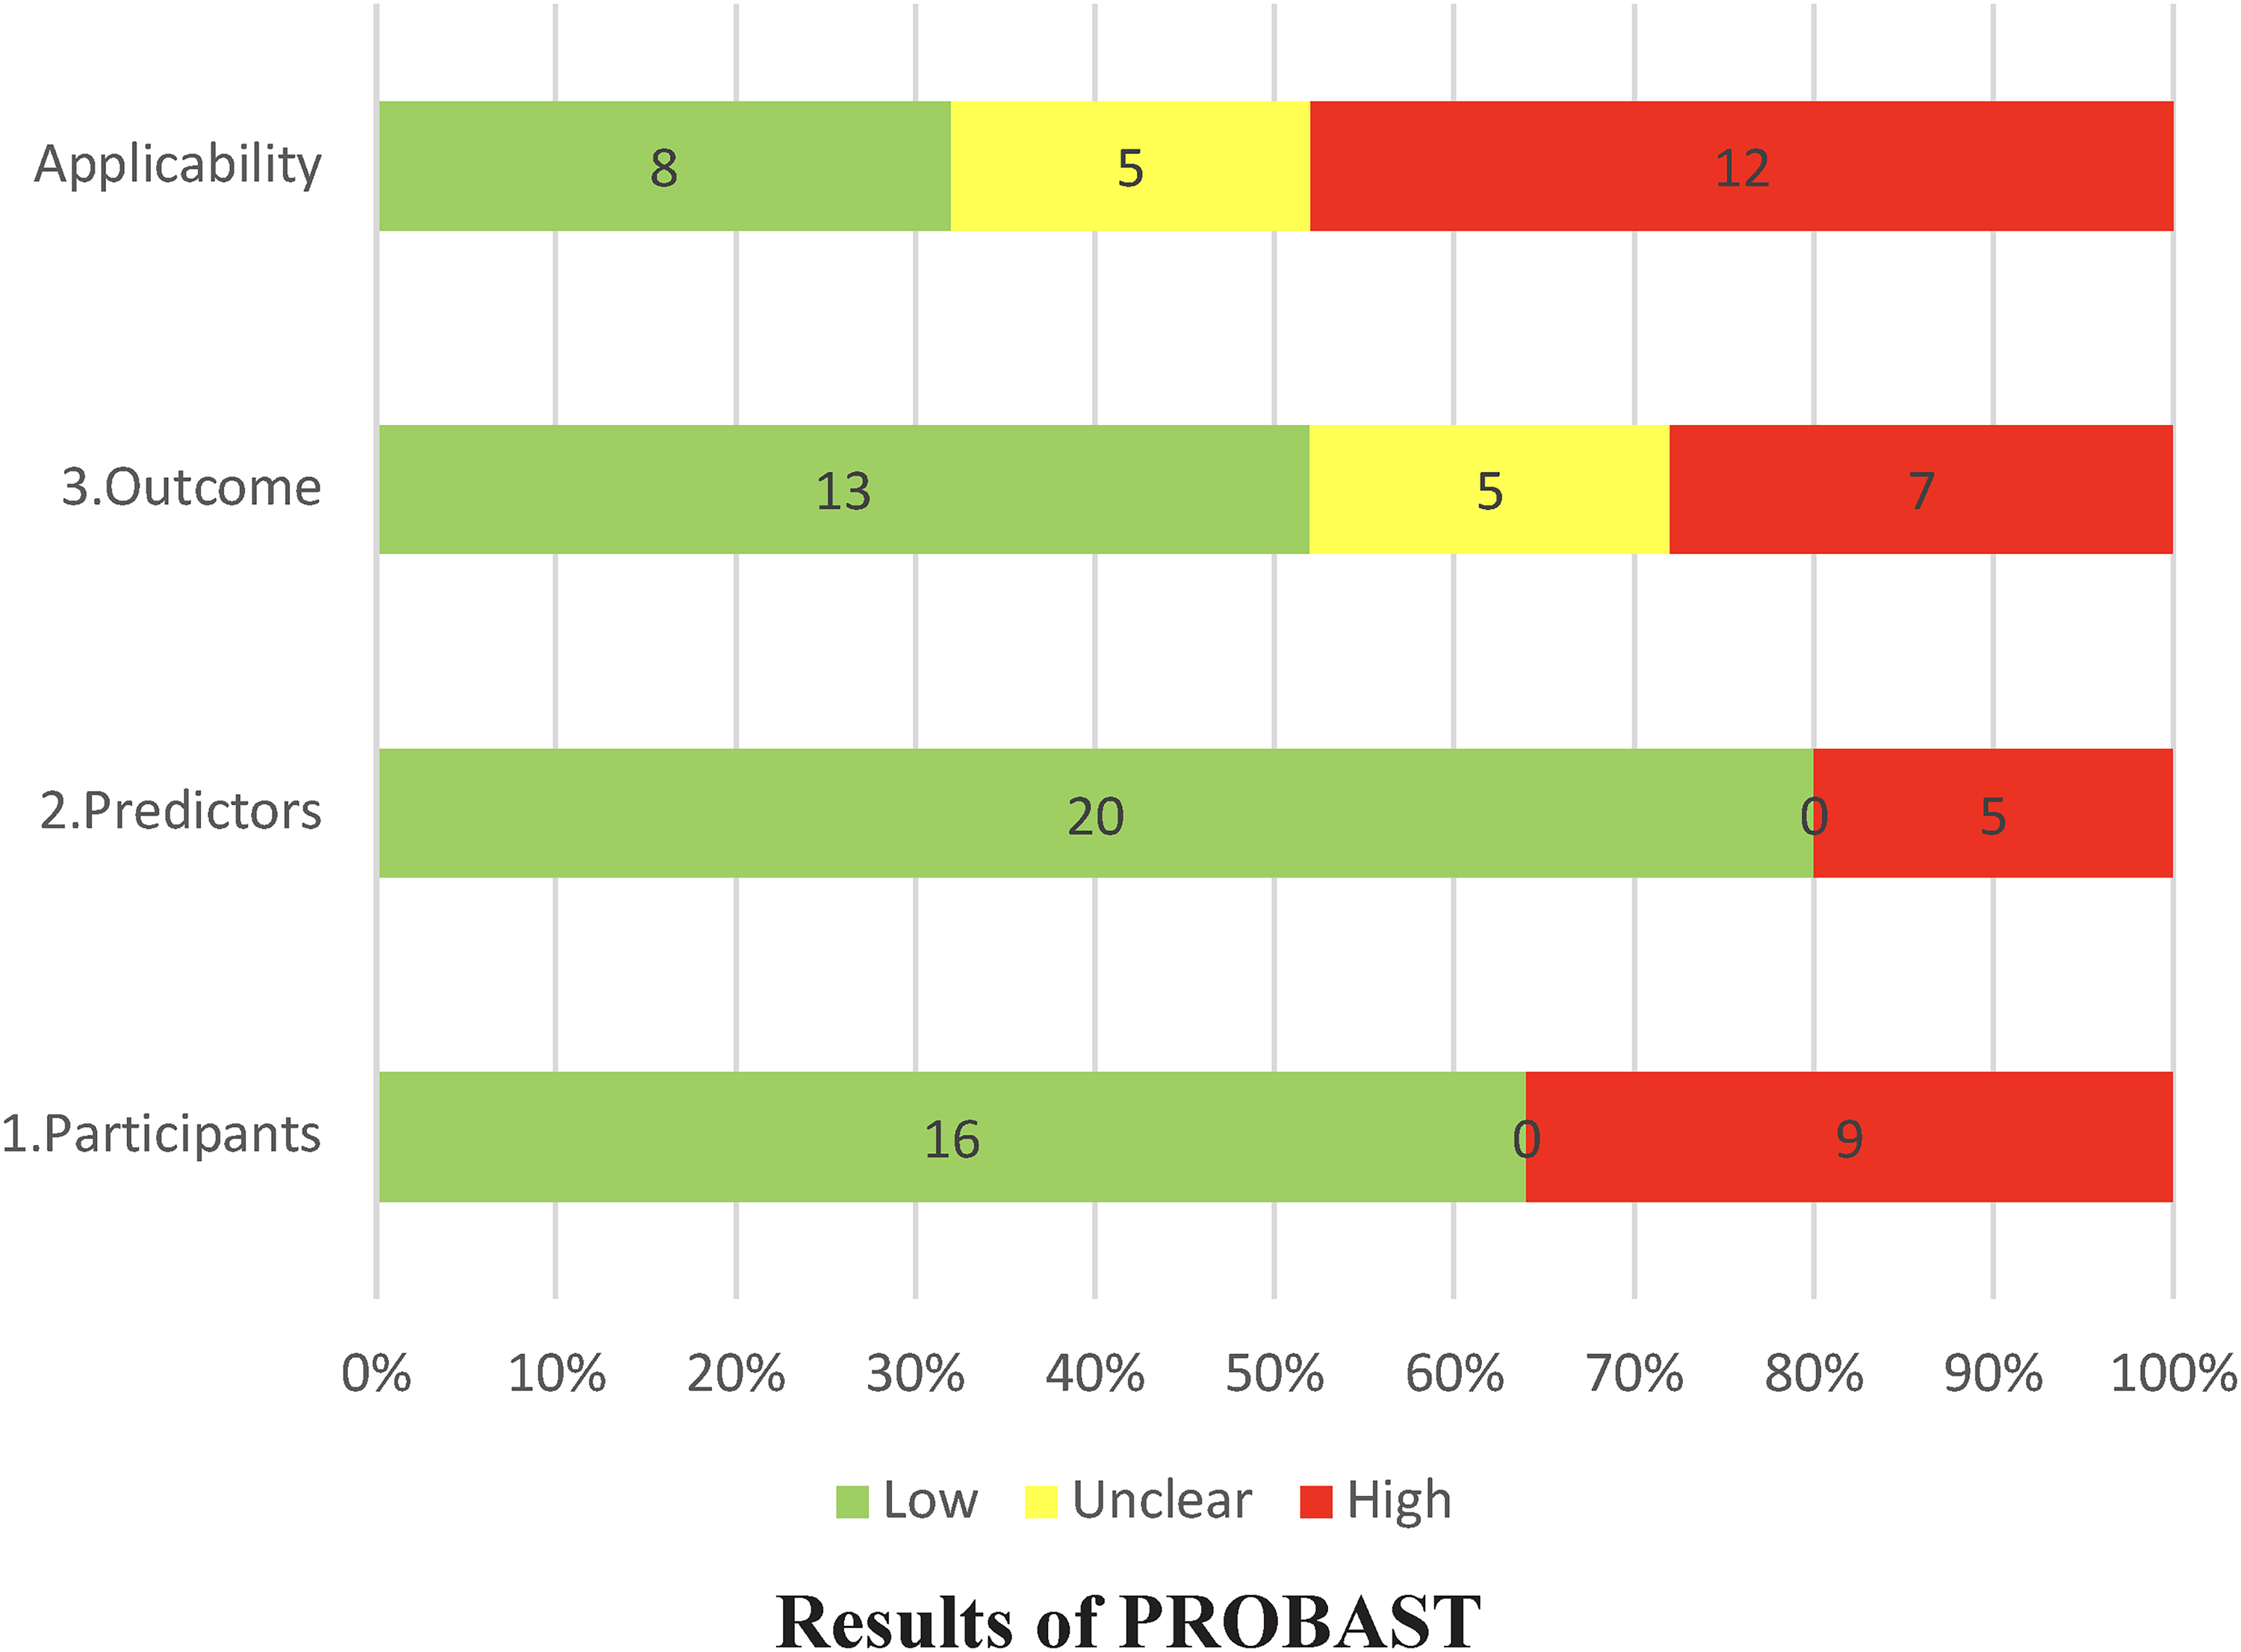
Applicability in included studies.
Prediction model Risk of Bias Assessment Tool results of the included studies
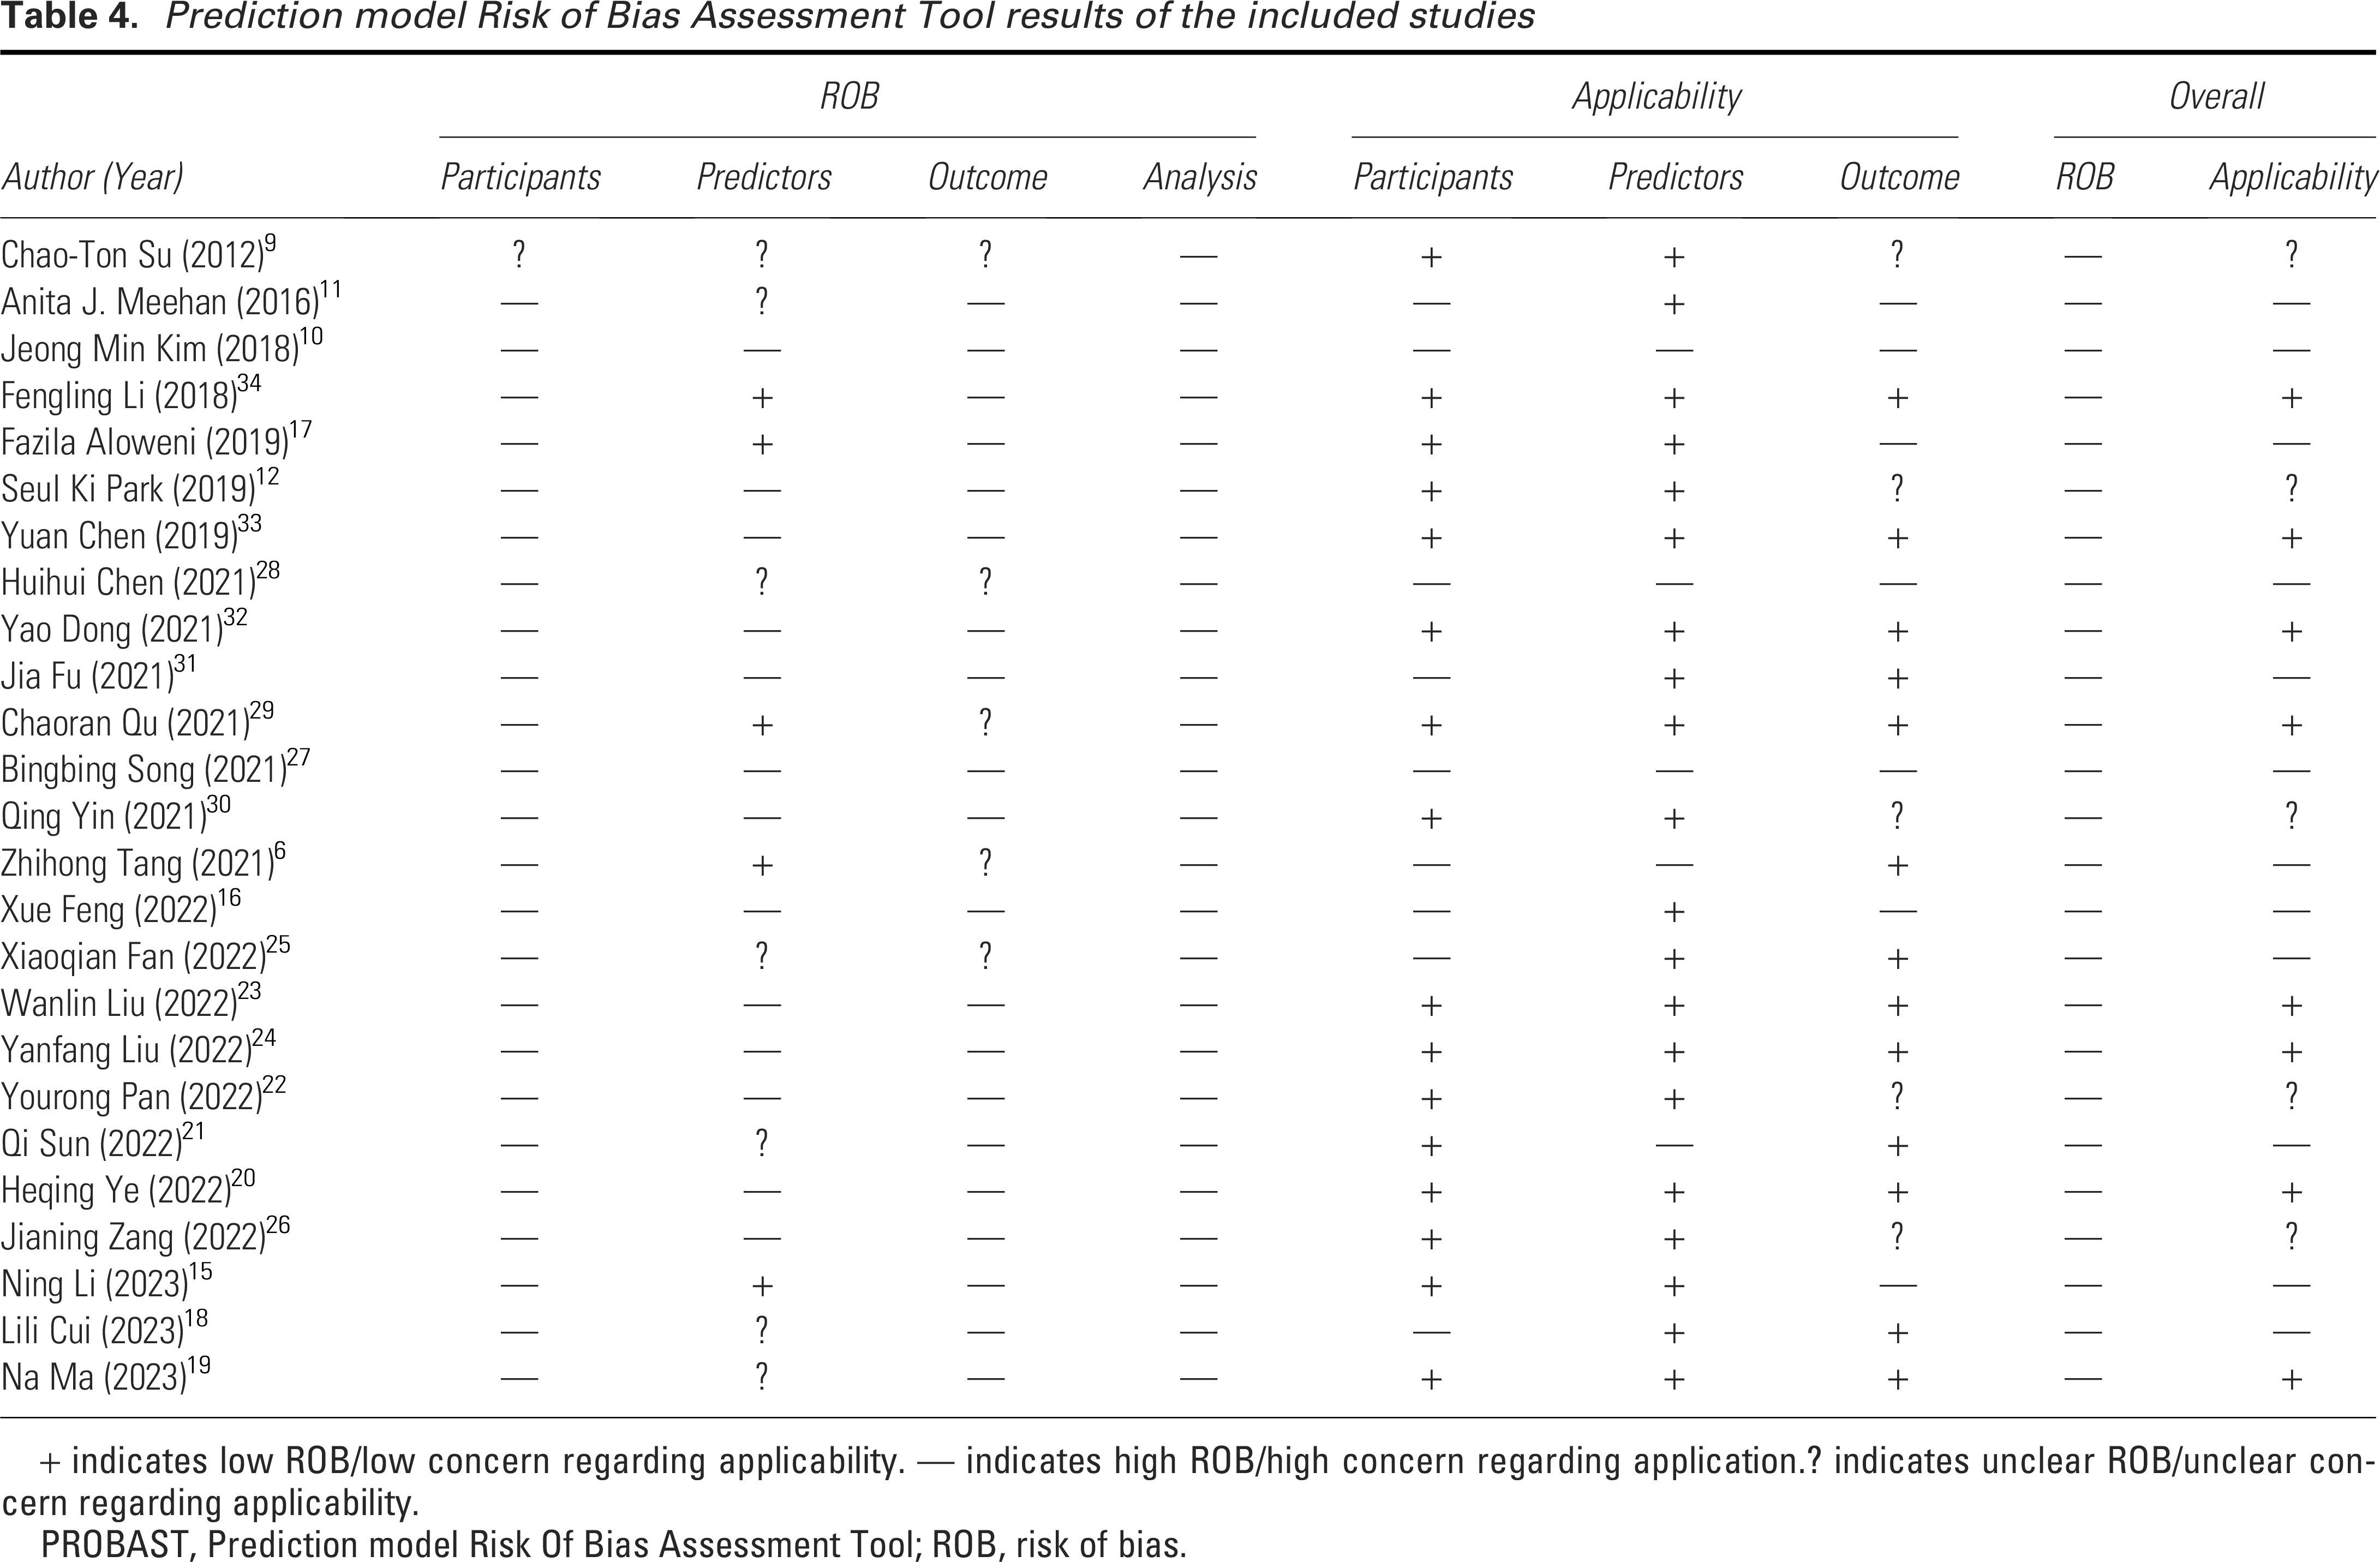
+ indicates low ROB/low concern regarding applicability. — indicates high ROB/high concern regarding application.? indicates unclear ROB/unclear concern regarding applicability.
PROBAST, Prediction model Risk Of Bias Assessment Tool; ROB, risk of bias.
Risk of bias assessment
Bias related to participants
Upon evaluation, one study exhibited unclear bias risk concerning the dimension of predictive factors, while the remaining 24 studies demonstrated a high risk of bias. Seventeen studies (68%) sourced their data from electronic health records or various hospital electronic systems. In terms of sample selection, 22 studies (88%) exhibited unreasonable exclusion criteria. The primary reason for these exclusions was related to skin diseases or conditions affecting the observation of skin status (n = 12, 48%). Additional reasons included the removal of incomplete data (n = 7, 28%) and exclusions based on mental illnesses, communication barriers, Stage 1 PIs, intraoperative hypothermia, multiple comorbidities, and poor compliance or non-participation in follow-up.
Bias related to predictors
Thirteen studies demonstrated a high risk in the area of predictive factors. Furthermore, 20 studies (80%) did not clearly specify the personnel responsible for measuring the predictive factors. This lack of clarity is particularly concerning for subjective indicators such as mobility, moisture of pressure areas, and tightness of restraints. Without information on the personnel’s work experience or standardized training, the reliability of these measurements is questionable. Additionally, eight studies failed to specify the exact timing of predictive factor measurements. Notably, the study by Su et al. 9 did not clarify whether predictive factors would be available at the intended time points for the prediction model. Finally, two studies included predictive factors such as the time of Intensive Care Unit (ICU) admission, which may not always be accessible.
Bias related to outcomes
Excluding five studies that exhibited unclear outcomes, the remaining 20 studies demonstrated a high risk of bias (80%). A prevalent issue across these studies is that nearly all (n = 22, 88%) failed to specify the timing for determining PIs, making it unclear whether the predictive factors were known at the time of diagnosis. Another concern is the inconsistency in defining the timeframe for IAPI across studies, which affected model performance in the outcome domain. Additionally, many models lacked clarity regarding the diagnostic criteria for PIs and did not specify the personnel responsible for assessment. While most studies employed appropriate PI diagnostic criteria, the standards used varied from publicly available guidelines. For example, three studies omitted definitions for unstageable PI and deep tissue PI in their diagnostic criteria.
Bias related to analysis
All studies exhibited a high risk of bias in the analysis domain, primarily due to the following reasons: (1) low EPV, which may lead to model overfitting. Only three models (9.38%) had an EPV greater than 20. (2) Predictors were categorized, with the most commonly categorized variables being age (n = 13, 52%), BMI (n = 11, 44%), surgery time (n = 10, 40%), and serum albumin (n = 5, 20%). (3) Three studies reported inconsistencies between the sample numbers in the baseline characteristics table and the total number of included samples. (4) Twenty-four studies (96%) failed to report missing data, and one study 29 directly excluded missing values. (5) Only five studies (20%) avoided selecting predictors solely based on univariate analysis, whereas the remaining studies did not. (6) Only two studies considered competing risk factors of death and whether patients received PI prevention, while the others did not. (7) Ten studies (40%) did not report calibration or both calibration and discrimination data, and four studies (16%) evaluated calibration solely using the Hosmer-Lemeshow test. (8) 11 studies (44%) did not conduct internal validation, while 13 studies (52%) conducted internal validation but failed to report the type of validation or clarify whether it covered all steps of model development. (9) A significant issue is that 13 models (40.63%) were presented solely as nomograms, making it impossible to verify if the nomogram results matched those of the multivariate analysis. Nine models (28.13%) did not present a final model, two models were displayed as DTs, one model 17 converted the regression coefficients from multivariate analysis into integer scores, and one model showed discrepancies between the regression coefficients and the results presented in the tables.
Assessment of applicability
The poor applicability of the study population was primarily due to the selection of patients admitted to the ICU after surgery (n = 6, 24%) and those remaining in the supine position postsurgery (n = 2, 8%). Furthermore, including patients with diabetes 31 further limited the applicability. The predictors were also constrained by the use of ICU-specific variables and specialty-specific indices like the Model for End-Stage Liver Disease (MELD). In terms of outcome applicability, inappropriate time frames for assessing IAPI were either too long (n = 6, 24%), too short (n = 1, 4%), or left undefined (n = 4, 16%).
DISCUSSION
A recent review on the risk factors for PIs in hospitalized adults 35 identified surgery as one of the four major categories of risk factors. This underscores the importance of distinguishing surgical patients from other high-risk groups in PI research and highlights the necessity of developing tailored risk prediction models specifically for surgical patients. PIs are preventable, as noted in the 2019 second update of the International Clinical Practice Guideline on the Prevention and Treatment of Pressure Ulcers/Injuries, 4 which emphasized the need to address special populations, particularly by implementing targeted interventions to prevent PI in surgical patients. Risk prediction models for IAPI are critical for clinical nurses in preoperative settings, as well as for surgeons and anesthesiologists during surgery. These models enable health care professionals to implement specific measures to mitigate or control risk factors and prevent IAPI. However, it is equally important to consider the competing risk factor of PI prevention measures when constructing prediction models. Failing to account for this can lead to inaccuracies, which represents a significant limitation in the IAPI models included in this study. The reviewed models focus on PIs occurrences following various surgical procedures, including cardiac, orthopedic, neurosurgery, vascular, breast, abdominal, and transplant surgeries.
When constructing risk prediction models for IAPI, the scope of outcome measures is a critical consideration. Stage 1 and Stage 2 PIs are the most commonly observed stages in hospital settings, 36 with more severe stages being relatively rare. Since the primary aim of prediction models is to identify risks early and allow for preventive interventions, it is debatable whether all PI stages should be included as outcome measures. It is recommended that risk prediction be limited to Stage 1 and Stage 2 IAPI for two reasons: (1) the probability of developing Stage 3 or more severe PI within 3 days postoperatively is low, and (2) early identification of high-risk patients for Stage 1 and Stage 2 IAPI facilitates timely interventions that prevent progression. As for the timing of IAPI assessments, our findings suggest that diagnosing IAPI within 3 days postoperatively is optimal for building prediction models. Only two of the included studies clearly identified the personnel responsible for IAPI assessments, highlighting the need for greater transparency in this regard. In retrospective studies utilizing electronic medical records, consistent PI diagnosis is often challenging. In contrast, prospective studies must report who performs PI assessments, how they are conducted, and what quality control measures are implemented. Even with standardized diagnostic criteria, PI diagnosis remains subjective and can be mistaken for conditions such as incontinence-associated dermatitis in clinical practice. 37 Thus, retrospective studies risk misclassification, while prospective studies must ensure rigor in both the methodology and personnel involved in PI diagnosis.
In addition to the outcome measures, the predictive factors for IAPI identified in this study provide valuable insights for constructing future prediction models. A total of 79 predictive factors were included across various models; however, only 27 factors were identified three times or more. This discrepancy highlights a potential shortcoming in the comprehensiveness of candidate predictive factors considered in the models. Notably, many models failed to assess key predictors such as duration of surgery,10,17 age, 32 and DM,9,19,24,30,32 which are among the most frequently included in final models. This oversight may stem from the reliance on retrospective electronic medical records, where researchers prioritize data availability and completeness over comprehensive factor consideration. The predictive factors identified can be categorized into preoperative (e.g., age, DM, preoperative albumin level, BMI, Braden Scale) and intraoperative (e.g., duration of surgery, surgical position, total cardiopulmonary bypass time, local moisture at pressure points, and American Society of Anesthesiologists [ASA] score). In different surgical specialties, specific preoperative and intraoperative indicators may have limited applicability; for instance, the MELD score is relevant for liver surgery, while total cardiopulmonary bypass time is pertinent for cardiac surgery. Therefore, we recommend developing prediction models for IAPI with a tailored approach that is specific to the various surgical specialties.
Research indicates that, alongside surgical patients, other special populations warranting consideration in the context of PI include patients with diabetes and those in the ICU. 35 In the ongoing exploration of prediction models for IAPI, some scholars have specifically developed models for patients with diabetes 31 and for ICU patients postsurgery.6,10,16,25,27,28 Fu et al. 31 conducted a rare effort focused on patients with diabetes; however, their model directly excluded samples with incomplete data, which may introduce selection bias. Furthermore, low EPV ratios could lead to model overfitting, and the final model did not retain the weight distribution of the multivariable analysis results, rendering it unsuitable for clinical application. It is worth emphasizing that developing population-specific or context-specific prediction models enhances the applicability of predictive factors. Moreover, refining these factors further improves the model’s sensitivity and specificity. Only two studies6,15 constructed prediction models using prospective data. Tang et al. 6 excluded patients with dermatosis, skin sensitivity, and mental illness during participant selection, potentially resulting in an overestimation of the model’s efficacy. Additionally, the classification of continuous variables, such as surgery duration, may adversely affect the model’s predictive ability and stability. While Li et al. 15 utilized a prospective research design, the data were still derived from cross-sectional sources, and the timing of IAPI measurement was immediately postoperative. This short interval may be insufficient for capturing the onset of PIs related to surgery. Among the included studies, only four models from a single study employed inappropriate methods for handling missing data, while other studies did not mention missing data handling at all. This highlights that the handling and reporting of missing data represent a significant source of bias in IAPI-related prediction models, which can undermine the reliability and interpretability of the models. The absence of reporting on missing data in publications may hinder external reviewers and users from understanding the impact of data completeness on model outcomes, thereby questioning the credibility of the research. Furthermore, it may impede the reproducibility and validation of studies, ultimately limiting their academic value and clinical applicability. Evidence suggests that multiple imputation is the most suitable method for handling missing data, both in model development and validation. 8 Notably, researchers 21 have begun investigating the risk prediction of PIs following transplant surgeries, marking an important development in IAPI prediction. However, their data reports suffered from significant gaps, and regrettably, the model underwent neither internal nor external validation. Among the 32 models included in this study, 6 models9,29 employed machine learning techniques. During our research process, we found that the PROBAST tool for assessing bias risk and applicability faced considerable limitations. Given the rapid advancement of machine learning in risk prediction, it is imperative to develop bias risk assessment tools specifically tailored for these prediction models.
Limitations
First, this study is limited by language and literature resources; we only included articles published in Chinese or English, which may not fully represent the global landscape. However, no relevant prediction models published in other languages were identified during the search of public databases. Second, significant heterogeneity in data sources and surgical types, along with the incomplete development of meta-analysis methods for risk prediction models, precluded us from conducting a meta-analysis in this study. Third, considering the differences in the occurrence of IAPI between children and adults, we excluded articles focusing on prediction models for IAPI in minors, as well as those that included all age groups encompassing adults. Fourth, although the included studies were published in both Chinese and English, the majority of the data still originates from China, which may limit the applicability of the findings to health care systems in other regions. Therefore, we suggest that future research should include diverse data from different countries and regions to enhance the external validity and generalizability of the models and prioritize cross-regional validation to ensure the models’ broad applicability globally. Fifth, despite rigorous processes for literature retrieval, selection, risk of bias assessment, and applicability evaluation, the included models exhibit a high risk of bias, which undermines the reliability of the synthesized evidence and limits its applicability to clinical practice.
TAKE-HOME MESSAGE
As the first systematic review of IAPI prediction models for adult inpatients, this study employed the CHARMS checklist to summarize the characteristics of included studies and used PROBAST to assess the risk of bias and applicability of the models.
The study highlights current deficiencies in IAPI prediction model research and reporting, which may inform the improvement of future model quality.
It also identifies the most widely recognized predictors for adult IAPI.
CONCLUSIONS
In this systematic review of IAPIs, we identified 25 studies comprising a total of 32 models. Overall, the included models demonstrated good performance in both internal and external validation; however, all studies exhibited a high risk of bias, with 22 models showing concerning applicability. The primary sources of bias stemmed from poor data sources, unreasonable exclusions of subjects, unclear definitions of predictive factors and outcome measures, timing of PI assessment, low EPV, categorization of continuous variables, neglect of missing data and competing risk factors, reliance on univariate variable selection, unreasonable evaluations of calibration, and lack of internal and external validation. To improve future IAPI model development, it is crucial to clearly define the timing and personnel responsible for PI assessment, utilize prospective data for model construction, and conduct both internal and external validations. Adhering to the CHARMS checklist 14 and PROBAST 8 guidelines will help minimize missing data reporting and enhance model quality. While ensuring the clinical applicability and user-friendliness of the models, it is essential to provide a comprehensive predictive framework, which serves as a prerequisite for external validation by other researchers. Before constructing models, careful consideration of potential candidate predictive factors is necessary, followed by a clear definition of the final predictive factors to reduce variability. Future research must adhere to rigorous study designs to develop higher-quality risk prediction models that can effectively guide clinical practice.
AUTHORS’ CONTRIBUTIONS
Y.X.: Writing—original draft, methodology, formal analysis, data curation, conceptualization, visualization. H.Z.: Writing—methodology, data curation, formal analysis. S.W.: Writing—review and editing, methodology, formal analysis. J.W.: Writing—review and editing, methodology, conceptualization. J.Z.: Writing—review and editing, methodology, visualization. S.D.: Writing—review and editing, formal analysis. W.L.: Writing—review and editing, formal analysis. W.W.: Writing—review and editing, methodology, formal analysis. Z.Y.: Writing—review and editing. H.X.: Supervision, writing—review and editing. H.P.: Resources, methodology, formal analysis, writing—review and editing, funding acquisition.
Footnotes
FUNDING INFORMATION
This study was supported by the following two projects: The 2024 General Program of Zhejiang Provincial Medical and Health Science and Technology Plan (Grant No.
DATA AVAILABILITY
The data used and/or analyzed in the current study are reasonably available from the corresponding author upon request.
ETHICAL APPROVAL
Ethical approval is not necessary for the systematic review.
AUTHOR DISCLOSURE AND GHOSTWRITING
The authors of this article have no financial conflicts of interest to disclose. No ghostwriters were involved in the writing of this article.