
Abstract
Abstract
With worldwide rates of obesity and type-II diabetes increasing, it is essential to identify and understand the mechanisms involved during nutrient absorption and fuel allocation. Recent studies demonstrate that nutrients (e.g., lipids and carbohydrates) play a major regulatory role in gene transcription of glycolytic and lipogenic enzymes in addition to hormones, including insulin and glucagon. These nutrients generally exert their effects through key cellular nutrient/energy receptors. Fasting was used to identify these nutrient/energy receptors known from mammalian studies to ascertain if zebrafish (Danio rerio) are a suitable model for the study of metabolic disorders. Zebrafish were subjected to a fasting/re-feeding regime for 3 weeks, and gene expression of sterol responsive binding protein 1 and 2 (SREBP), the mammalian target of rapamycin (mTOR), cAMP response element binding protein 3-like 3 (CREB3l3), and AMP-activated protein kinase alpha (AMPKα) was assessed. Fasted zebrafish lost ∼10% of their body mass over the 3-week experiment, with an associated depression in oxygen consumption. Increases in liver AMPKα and CREB3l3 mRNA transcript level were noted, concurrent with increases in the activities of the β-oxidation and gluconeogenic markers β-hydroxyacyl CoA dehydrogenase and phosphoenolpyruvate carboxykinase, respectively. Conversely, a depression in liver mTOR and SREBP1 and 2 expression was noted, with a decrease in pyruvate kinase and alanine aminotransferase activities and decreases in liver lipid and glycogen contents. Twenty-four hours after re-feeding, zebrafish rapidly recover, and the majority of parameters return to control values. Taken together, these data suggest adult zebrafish are an appropriate model for the further study of human metabolic disorders.
Introduction
SREBPs are considered to be global lipid synthesis regulators, and are linked to biosynthetic pathways involved in fatty acid, triglyceride, and cholesterol synthesis. 6 Under sterol-deprived conditions, SREBP induces multiple transcriptional responses to upregulate genes involved in lipid synthesis, including genes related to cholesterol synthesis and lipogenic enzymes. In both mammalian and fish studies, SREBP1 appears to be the most responsive to an acute fasting (24 h or less), and upon re-feeding, SREBP1 gene expression substantially increases.4,7 However, no study to date has examined the effects of chronic fasting on the SREBP receptor family in fish, even though lipid stores provide valuable fuel in a nutrient-deprived state. mTOR is an essential regulator of cellular growth and protein synthesis, and is responsive to a variety of stimuli, including growth factors, insulin, and amino acid concentrations.8–10 In mammals, mTOR pathway activation phosphorylates key regulators of protein synthesis and a study in rainbow trout (Oncorhynchus mykiss) demonstrated increased phosphorylation and activity of protein synthesis after feeding, suggesting that regulation of mRNA synthesis is tightly associated with amino acid load and mTOR activation. 11 Few studies have examined the impact of chronic fasting on the mTOR pathway in fish, and understanding how this pathway functions is critical as there is evidence to suggest high dietary protein consumption contributes to obesity and type-2 diabetes. 12 mTOR is additionally regulated by cellular energy status through negative feedback by the AMPK. AMPK is a highly conserved serine/threonine kinase that functions as a master regulator of cellular metabolism, and is sensitive to cellular AMP:ATP ratios and, once phosphorylated, shifts cellular metabolism from anabolic to catabolic processes to maintain cellular ATP homeostasis. 13 In both goldfish (Carassius auratus) and crucian carp (Carassius carassius), AMPK in the liver and other tissues is phosphorylated during hypoxic-induced metabolic depression to maintain adequate cellular ATP levels.14,15 Conditions of fasting in fish are known to result in metabolic depression to conserve energy,16,17 but AMPK gene expression and downstream targets have not been assessed during nutritional deprivation in fish.
Mammalian studies also focus on an ER-bound transcription factor, cAMP response element-binding protein H (CREBH), of which the homolog in zebrafish is CREB3l3. 18 CREBH is active in regulating key enzymes involved in hepatic gluconeogenesis, specifically phosphoenolpyruvate carboxykinase (PEPCK) and glucose-6-phosphatase (G6Pase) with fasting in rats. 19 Exposure to excessive fatty acids in mammalian hepatic cell cultures upregulate CREBH expression, implicating this protein during states of obesity and insulin resistance. 20 Although identified in zebrafish, no study to date has examined the expression of CREB3l3 or its downstream function in fish.
This study investigates nutrient receptors changes in a nutrient-restricted environment, and their downstream, functional consequences in the zebrafish. Fuel use, including markers of β-oxidation, glycolysis, gluconeogenesis, and protein metabolism are estimated to determine the dominant pathways activated during nutritional deprivation. This study will not only identify key nutrient receptors that may have implications for diabetic research but will also provide a base for future studies in which fasting occurs before/during experimentation, which may in itself have a functional consequence independent of the experiment undertaken.
Materials and Methods
Animals
Mixed-sex adult zebrafish (Danio rerio) were purchased from Big Al's Aquarium Services (Ottawa, ON) and maintained in 10-L acrylic tanks (n = 30 per tank) in closed, multi-rack aquatic housing systems (Aquatic Habitats, Apopka, FL). Fish were presumed to be of similar age based on size. All tanks were supplied with well-aerated dechloraminated City of Ottawa tap water at 28°C. Fish were maintained under a 12:12-h light-dark cycle and fed once daily to satiation (food composition: crude protein 55%, crude fat 15%, crude fiber 1.5%, moisture 12%; Adult zebrafish complete diet, Zeigler, Gardners, PA). Experimental procedures were preapproved by the University of Ottawa Animal Care Protocol Review Committee and undertaken in accordance with institutional animal care guidelines adhering to those of the Canadian Council on Animal Care.
Fasting experiment
Zebrafish were sorted for size, weighed (0.512 ± 0.01 g, n = 176), returned to their respective tanks, and allowed to recover for 24 h before the start of experimentation. Fish were fasted for 1, 2, or 3 weeks, and then euthanized with an overdose of MS-222 (tricane; Sigma, St. Louis, MO). Fish were weighed, and livers from 2 fish were pooled and immediately frozen in liquid nitrogen for analysis of gene expression (n = 4), enzyme activity (n = 6), lipid concentration (n = 6), and metabolite concentrations (n = 6). An additional group was fasted for 3 weeks, then re-fed ∼2% of their estimated body mass, and sacrificed for tissues 24 h later. A control group was housed in a similar manner, fed daily ∼2% of their estimated body mass, and sacrificed at 3 weeks, 24 h after their final feeding. Before harvesting tissues, a whole blood sample was taken for the analysis of blood glucose using an OneTouch Ultra glucose meter 3 (LifeScan, Milpitas, CA).Whole blood from the severed caudal peduncle was applied directly to the test strip. Calibration and use of the glucose meter followed manufacturer's instructions.
Oxygen consumption
Fish used for oxygen consumption measurements (n = 8) were separated from those used for tissue sampling to avoid handling effects. Individual fish were netted and placed in darkened 50 mL plastic tubes and allowed to adjust for 10 min with a continuous flow of 28°C water. Fish were allowed to move freely, although during pretrials, movement was observed to be minimal, and resulting oxygen consumption is presumed as standard metabolism. The tubes were sealed with a rubber stopper through which an 18 GG needle and a fiber optic oxygen sensor (Ocean Optics, Dunedin, FL) were inserted into the chamber to record oxygen consumption using Ocean Optics software. Measurements were recorded every minute for 20 min, after which the fish was returned to its original tank. The oxygen consumption rate (MO2), expressed as mg O2 g−1 h−1, was determined over this 20-min period for each fish.
Enzyme activity and metabolites
All chemicals were purchased from Sigma-Aldrich, and reaction buffers were prepared fresh daily. Liver and muscle tissues were homogenized in 20 vol ice-cold homogenization buffer (20 mM HEPES, 1 mM EDTA, and 0.1% Triton-X 100, pH 7.0) using a polytron homogenizer, and enzyme activities (U. mg wet mass−1) were assayed in 96-well plates using a SpectraMAX PLus 384 microplate reader and SOFTmax software 4.6 (Molecular Devices, Menlo Park, CA). Reaction media to achieve maximum enzyme activities were as follows (final concentrations):
Alanine aminotransferase (AAT, E.C. 2.6.1.2): 200 mM alanine, 10 mM α-ketoglutarate, 0.15 mM NADH, 0.025 mM pyridoxal-5-phosphate, and 20 U/mL (excess) lactate dehydrogenase.
β-Hydroxyacyl CoA dehydrogenase (HOAD, E.C. 1.1.1.35): 50 mM imidazole-HCl pH 7.4, 0.1 mM Acetoacetyl CoA, and 0.16 mM NADH.
PEPCK (E.C. 4.1.1.32): 80 mM Tris-HCl, pH 7.4, 1 mM MnCl2, 1 mM MgCl2, 1.5 mM IDP, 0.17 mM NADH, 1 mM PEP, 19 U/mL MDH, and 5 mM NaHCO3.
Pyruvate kinase (PK, E.C. 2.7.1.40): 50 mM MOPS, 0.01 mM fructose, 1–6 bisphosphate, 10 mM MgCl2, 100 mM KCl, 5 mM ADP, 0.15 mM NADH, 5 mM PEP, and 1 U/mL lactate dehydrogenase.
Activities of AAT, HOAD, PEPCK, and PK were measured immediately after homogenization. Tissue glucose and glycogen were determined spectrophotometrically following the protocol of Bergmeyer. 21
Lipid quantification
Lipids were extracted from combined liver tissue using a 2:1 chloroform:methanol (Folch) extraction protocol. Briefly, frozen liver tissue was ground in liquid nitrogen using a mortar and pestle, 5 mL Folch reagent added, and incubated for 20 min at room temperature; 2.5 mL 2 M KCl buffered with 5 mM EDTA was added, and the solution was vortex and allowed to incubate for an additional 10 min prior to centrifugation at 2000 g for 3 min. The lower phase was placed in a clean glass tube and the solution was evaporated under nitrogen until only the lipid residue remained. The extracted lipids were reconstituted in 0.5 mL ethylene glycol monomethyl ether. Triglycerides and cholesterol were quantified from the tissue extracts using diagnostic kits following the manufacturer's protocol (TECO Diagnostic, Anaheim, CA). Phospholipids were quantified using a diagnostic kit from Wako Chemicals (Richmond, VA), following the manufacturer's protocol.
Gene expression analyses
Total RNA from the liver and muscle tissues was extracted using TRIzol Reagent (Invitrogen, Carlsbad, CA). Total RNA concentrations were quantified using spectrophotometry, and RNA purity was verified using the Nanodrop ND-1000 (Fisher Scientific, Wilmington, DE). First-strand cDNA was synthesized using QuantiTect Reverse Transcription Kit (Qiagen, Mississauga, ON). mRNA expression was quantified in duplicate using a Stratagene MX3000P real-time PCR machine and probe-based (FAM labeled) PrimeTime Mini qPCR Assays (Integrated DNA Technologies, Coralville, IA). Probe-based assays were used to ensure product specificity, particularly with the SREBP isoforms, as probes were designed to span exon/exon boundaries. Each reaction contained 12.5 μL Brilliant II QPCR Master Mix (Agilent), 1 μL primer/probe mix, 0.375 μL ROX reference dye (1:500 dilution), 10.125 μL RNase/DNase-free H2O, and 1 μL 5 × diluted cDNA template. Cycling conditions were 10 min initial denaturation at 95°C, 40 cycles of 95°C for 30 s, and 60°C for 1 min. To account for differences in amplification efficiencies between different cDNAs, standard curves were constructed for each target gene using serial dilutions of quantified liver and muscle cDNA. To account for differences in cDNA production and loading differences, all samples were normalized to the expression level of the housekeeping gene elongation factor-1α (EF1α), which did not change over the experimental treatments. Gene expression data were calculated using the 2ΔΔ–Ct method. 22 Both RNase/DNase-free H2O and nonreverse transcribed RNA were assayed on each plate to ensure that no contamination was present in the reagents or in the primers used. Primers were designed using Integrated DNA Technologies online assay design program (www.idtdna.com/). Target genes of interest were sterol-regulatory element binding protein 1 and 2 (SREBP1 and SREBP2), mammalian target or rapamycin (mTOR), AMPKα, and CREB3l3. Primers and accession numbers can be found in Table 1.
Statistical analysis
Statistical analysis was performed using Sigma Stat 9.0 (SPSS, Chicago, IL). A one-way ANOVA and a Tukey's post hoc test were used to test for significance for all pair-wise treatments (p < 0.05). A Student's t-test was used to determine statistical significance between mean weight differences from initial to final sampling (p < 0.05). All data are expressed as mean ± SEM.
Results
Whole animal fasting results
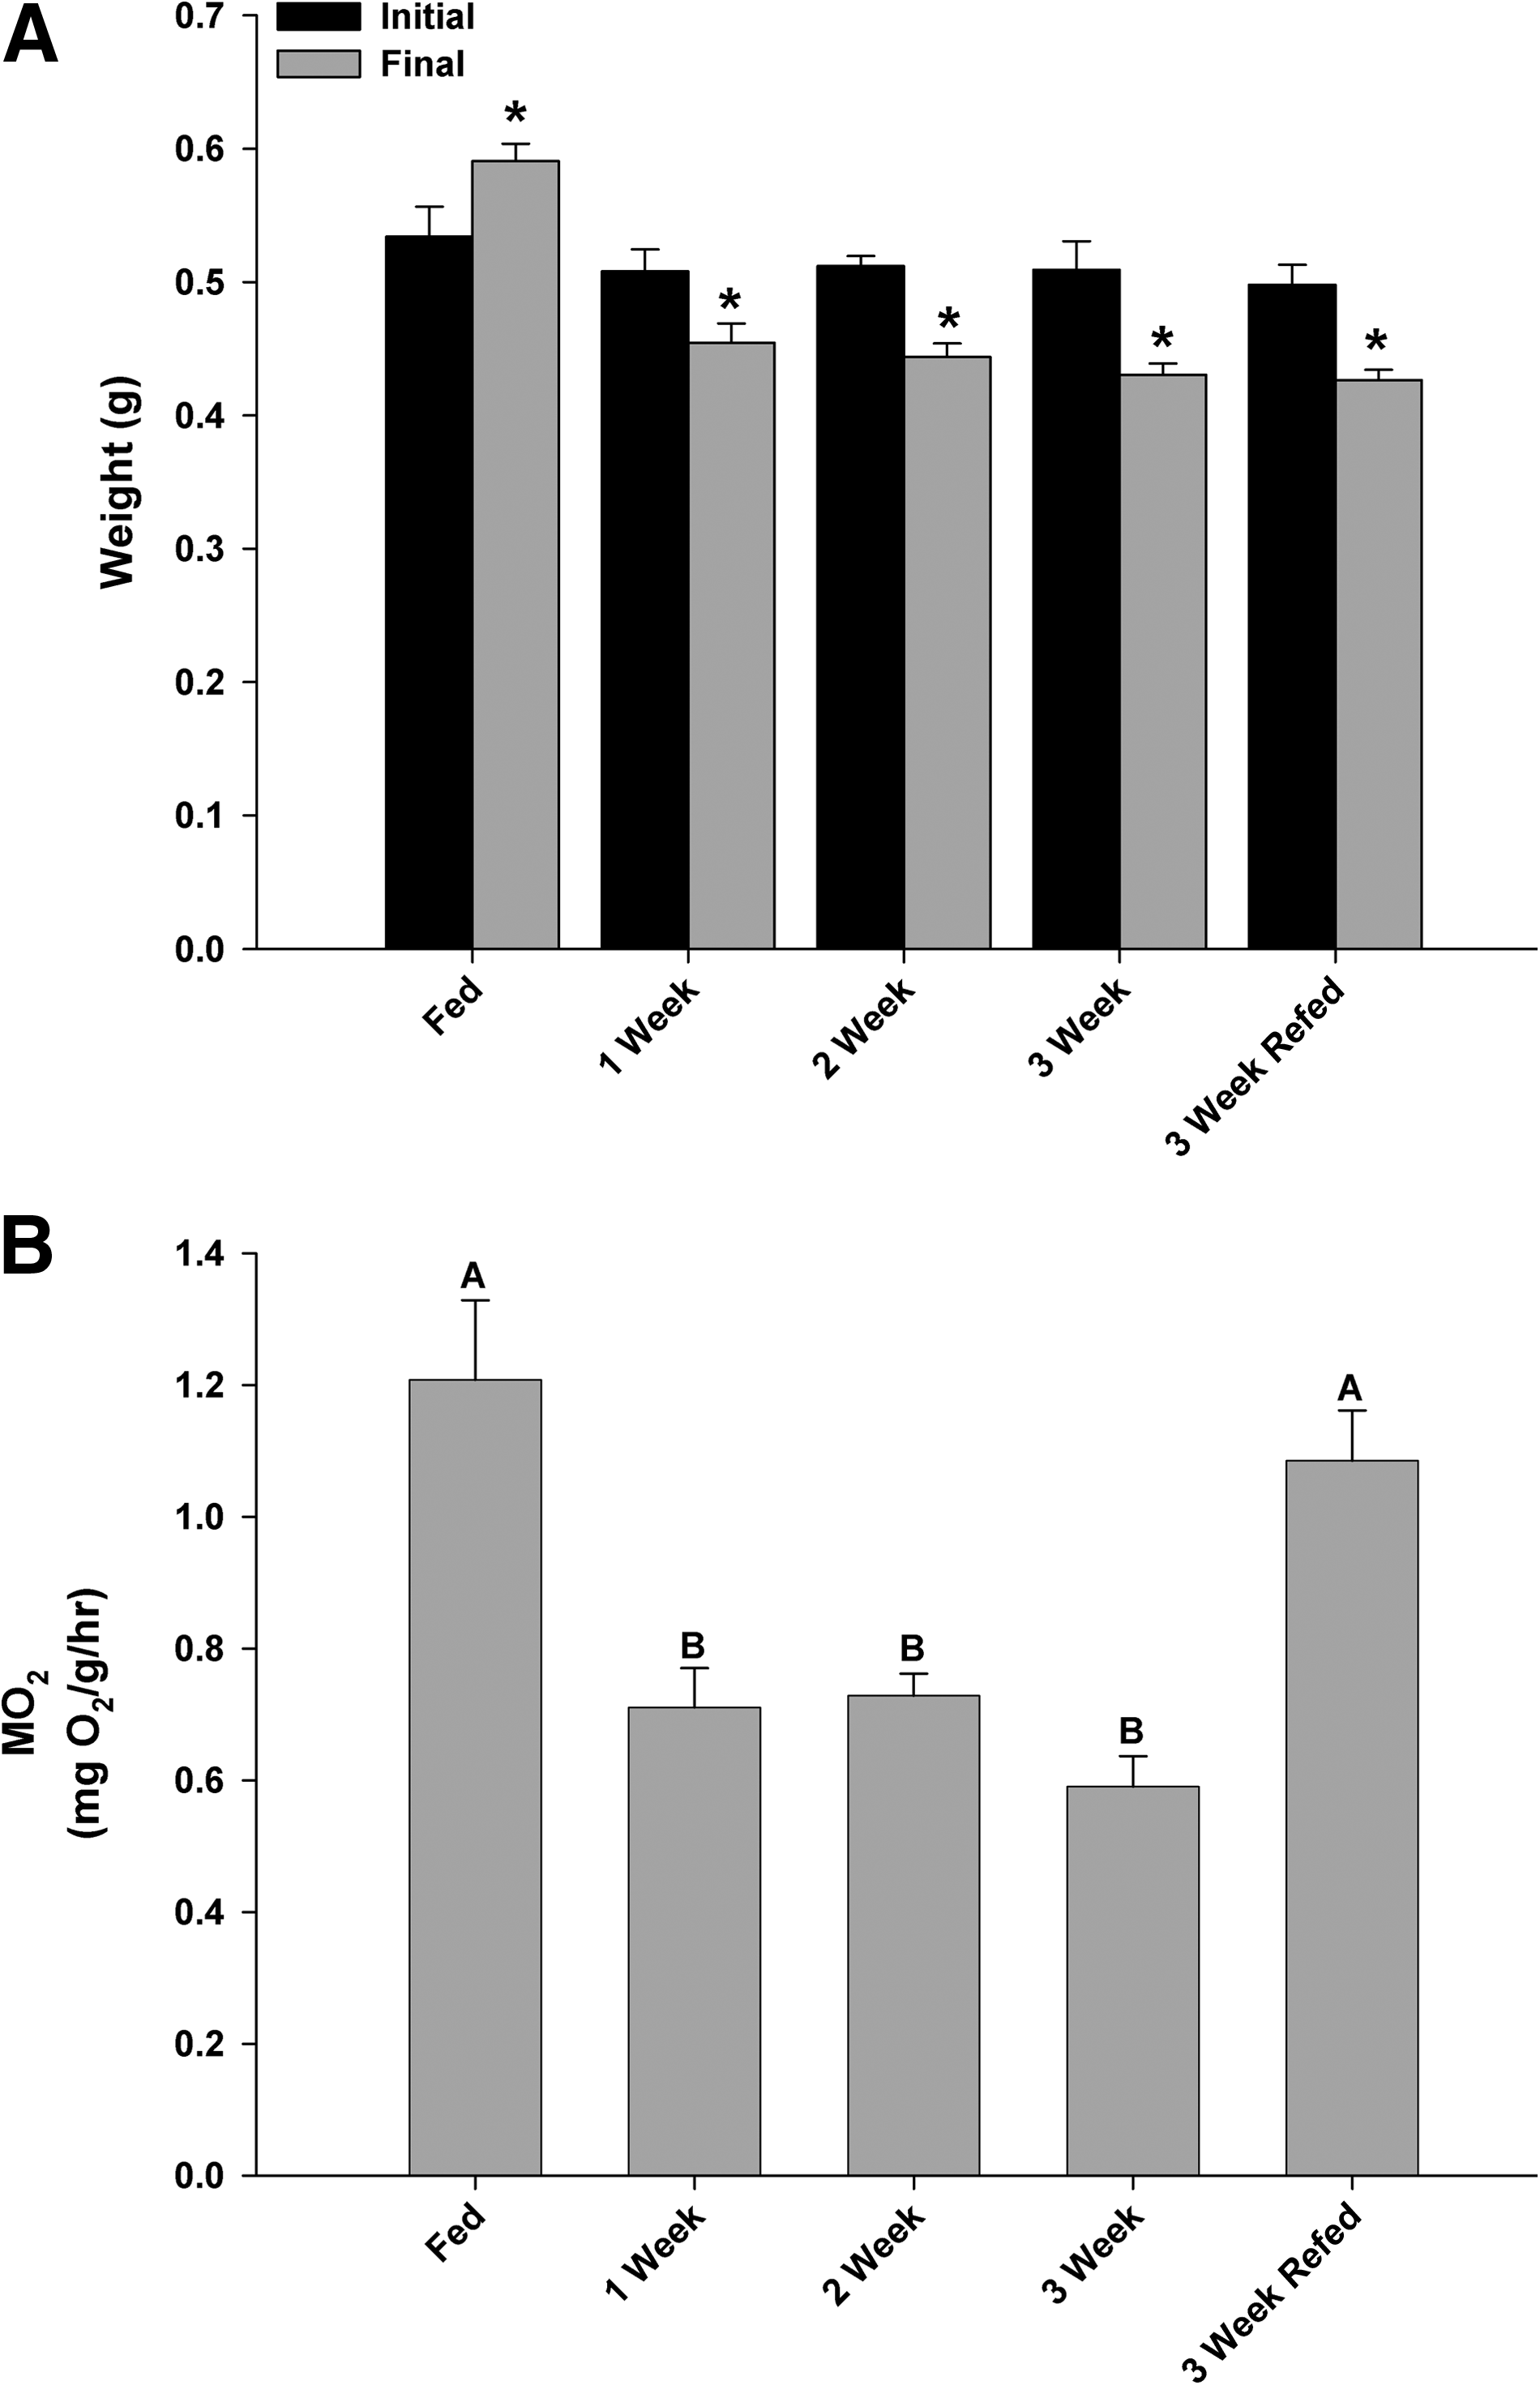
Zebrafish fasted for 1 week lost a significant percentage of body mass (∼10%) and this trend continued until the termination of the experiment at 3 weeks, at which point they had lost ∼15% total body mass (Fig. 1A). Twenty-four hours after initiating re-feeding, the zebrafish regained some lost mass although this was not significantly different from the 3-week fasted group (Fig. 1A). Associated with the loss in mass, a significant decline in oxygen consumption (MO2) was noted across the 3-week fasting period (Fig. 1B); however, 24 h after re-feeding, the MO2 had significantly increased and was not different from the control MO2, although a portion of this recovery may be attributed to digestion (Fig. 1B). Terminal blood glucose samples were assessed and although there was a trend to decrease across the fasting period, a significant depression in blood glucose concentration was noted only at the 3-week fasting point (Fig. 2A). Liver glycogen and glucose concentrations decreased over the duration of the experiment, with a significant decrease in liver glycogen after 1 week, which remained unchanged even after re-feeding after the 3-week fast (Fig. 2B). If differences are assessed between the 3-week fasted and 3-week re-fed groups (t-test, p < 0.05), liver glycogen did significantly increase 24 h after re-feeding. The lipid profile of the fasted zebrafish liver changed significantly, with decreased triglycerides, cholesterol, and phospholipids concentrations at 3 weeks compared with the control group (Fig. 3). After re-feeding, levels of cholesterol and phospholipids returned to control levels while the triglyceride content remained significantly below control values (Fig. 3A).

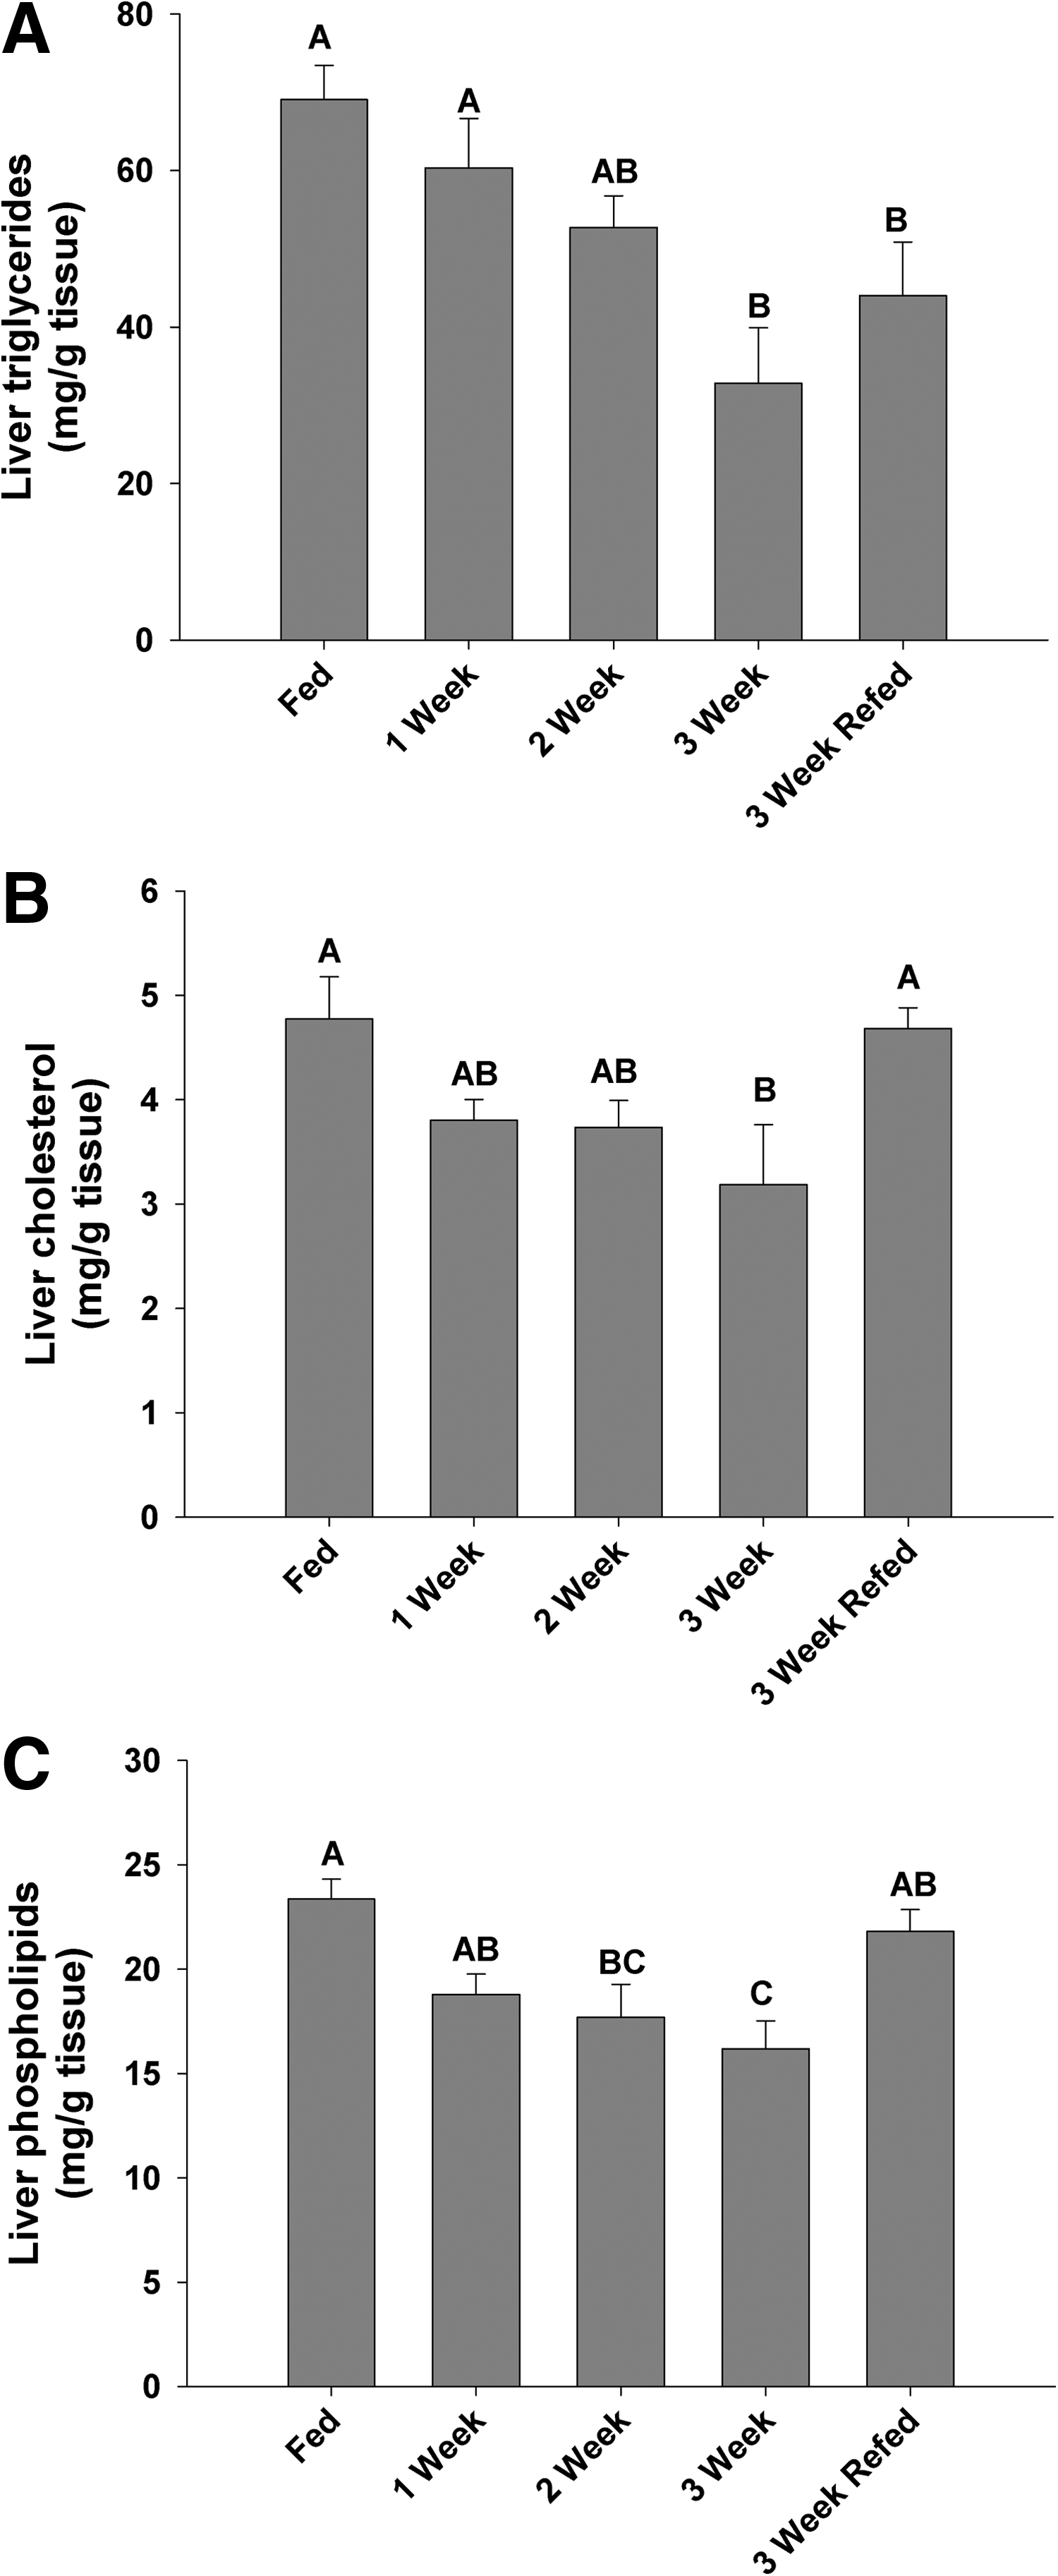
Liver tissue concentrations of triglycerides
Nutrient receptor response to fasting
EF1a was used to normalize all gene expression, as there were no significant changes associated with feeding or fasting. Relative transcript levels of zebrafish liver AMPKα, the catalytic subunit of AMPK, significantly increased at the 3 week fasted time point and returned to control values at 24 h of re-feeding (Fig. 4A). CREB3l3 transcript levels were sensitive to fasting in zebrafish, with a rapid increase in levels at 1 week that was sustained throughout the fasting exposure, and decline toward nominal values with re-feeding (Fig. 4B). Liver mTOR gene transcripts were significantly depressed over the entire 3-week fasting period, returning toward control values after the fish were re-fed (Fig. 4C). Both SREBP isoforms were examined to establish whether differential changes between SREBP1 and SREBP2 were associated with fasting in zebrafish. In the liver, both isoforms decreased at the 2-week fasted point, and continued to decrease at 3 weeks (Fig. 4D). Further, after re-feeding, an increase in both isoforms was noted, although levels remained below those of the control group.
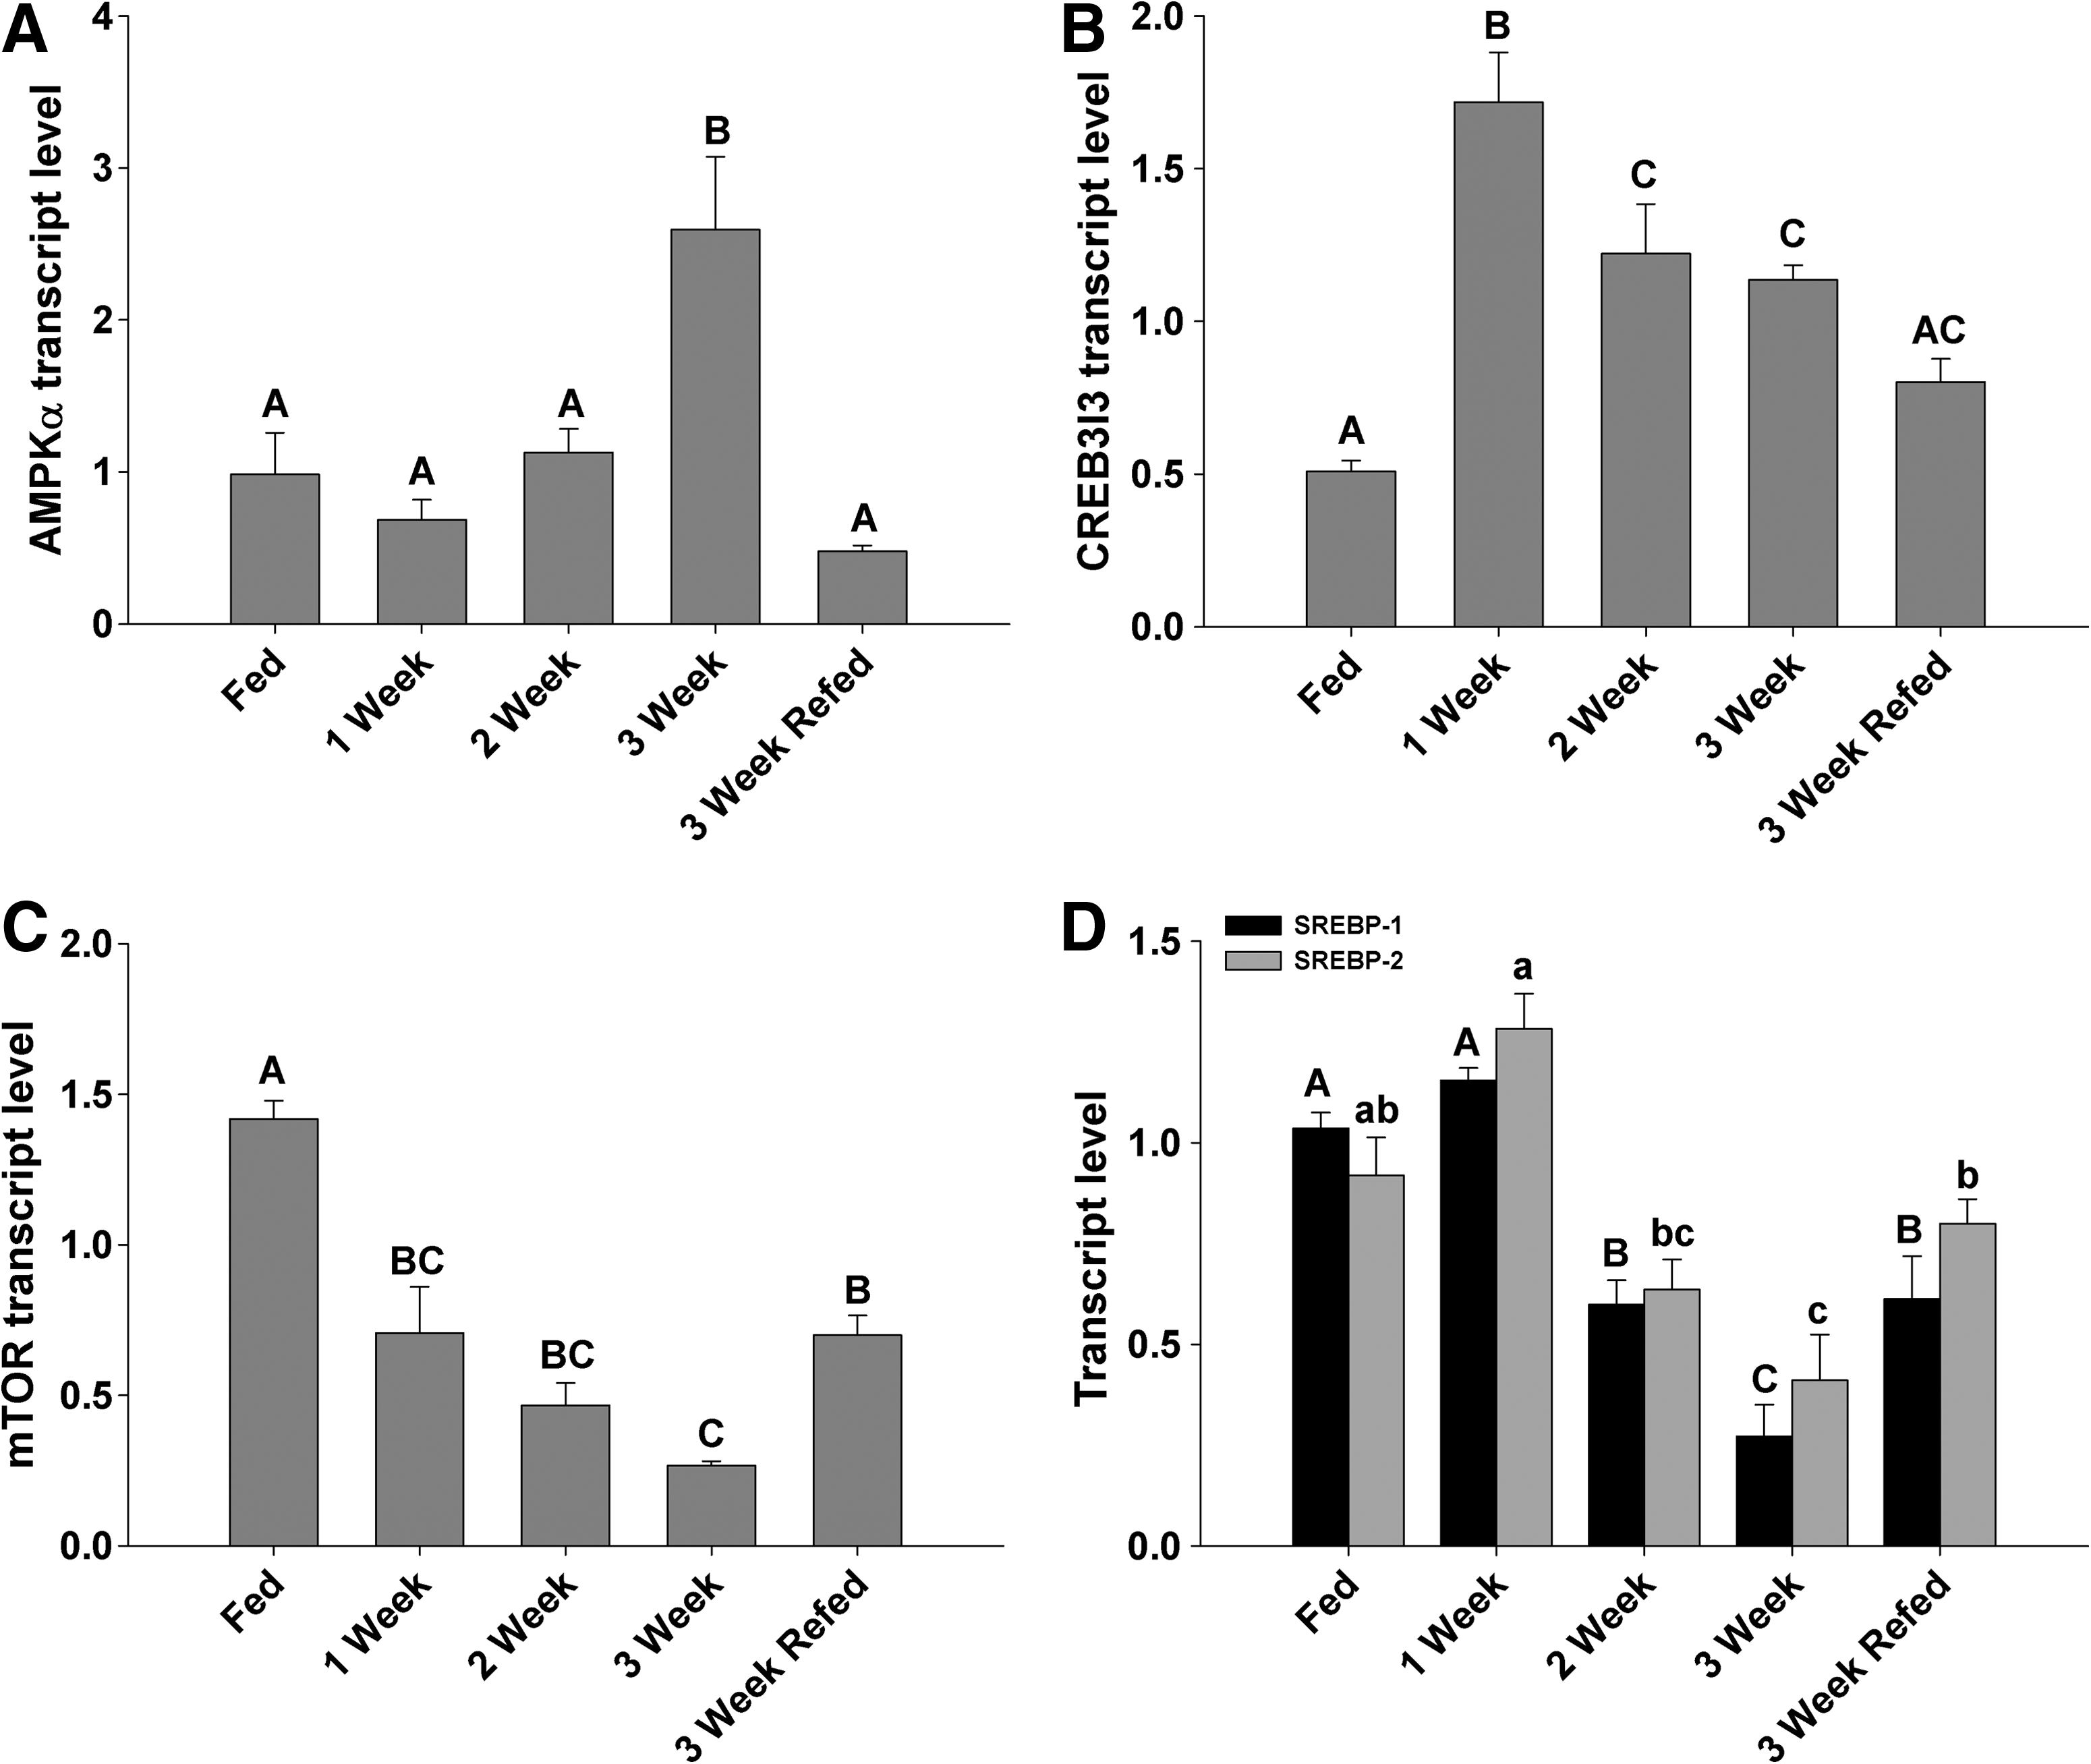
Transcript abundance (normalized to EF1α; n = 4) of
Enzyme responses to fasting
Evidence to suggest an increase in catabolic processes is the increase in HOAD, an enzymatic marker of β-oxidation, which was significantly increased at 2 weeks of fasting, and remained elevated, even after re-feeding (Fig. 5A), consistent with the absence of a recovery in liver triglyceride levels (Fig. 3A). Fasted zebrafish liver demonstrated a sustained depression in PK activity beginning at week 2, an effect that recovered toward control with re-feeding (Fig. 5C). This change suggests a reduction in glycolytic capacity, and a shift toward gluconeogenesis, as a step-wise increase in PEPCK activity was observed over the duration of fasting (Fig. 5B). AAT activities, a marker of protein catabolism, decreased significantly from 1 to 3 weeks of the fast, quickly returning to control values after re-feeding (Fig. 5D).
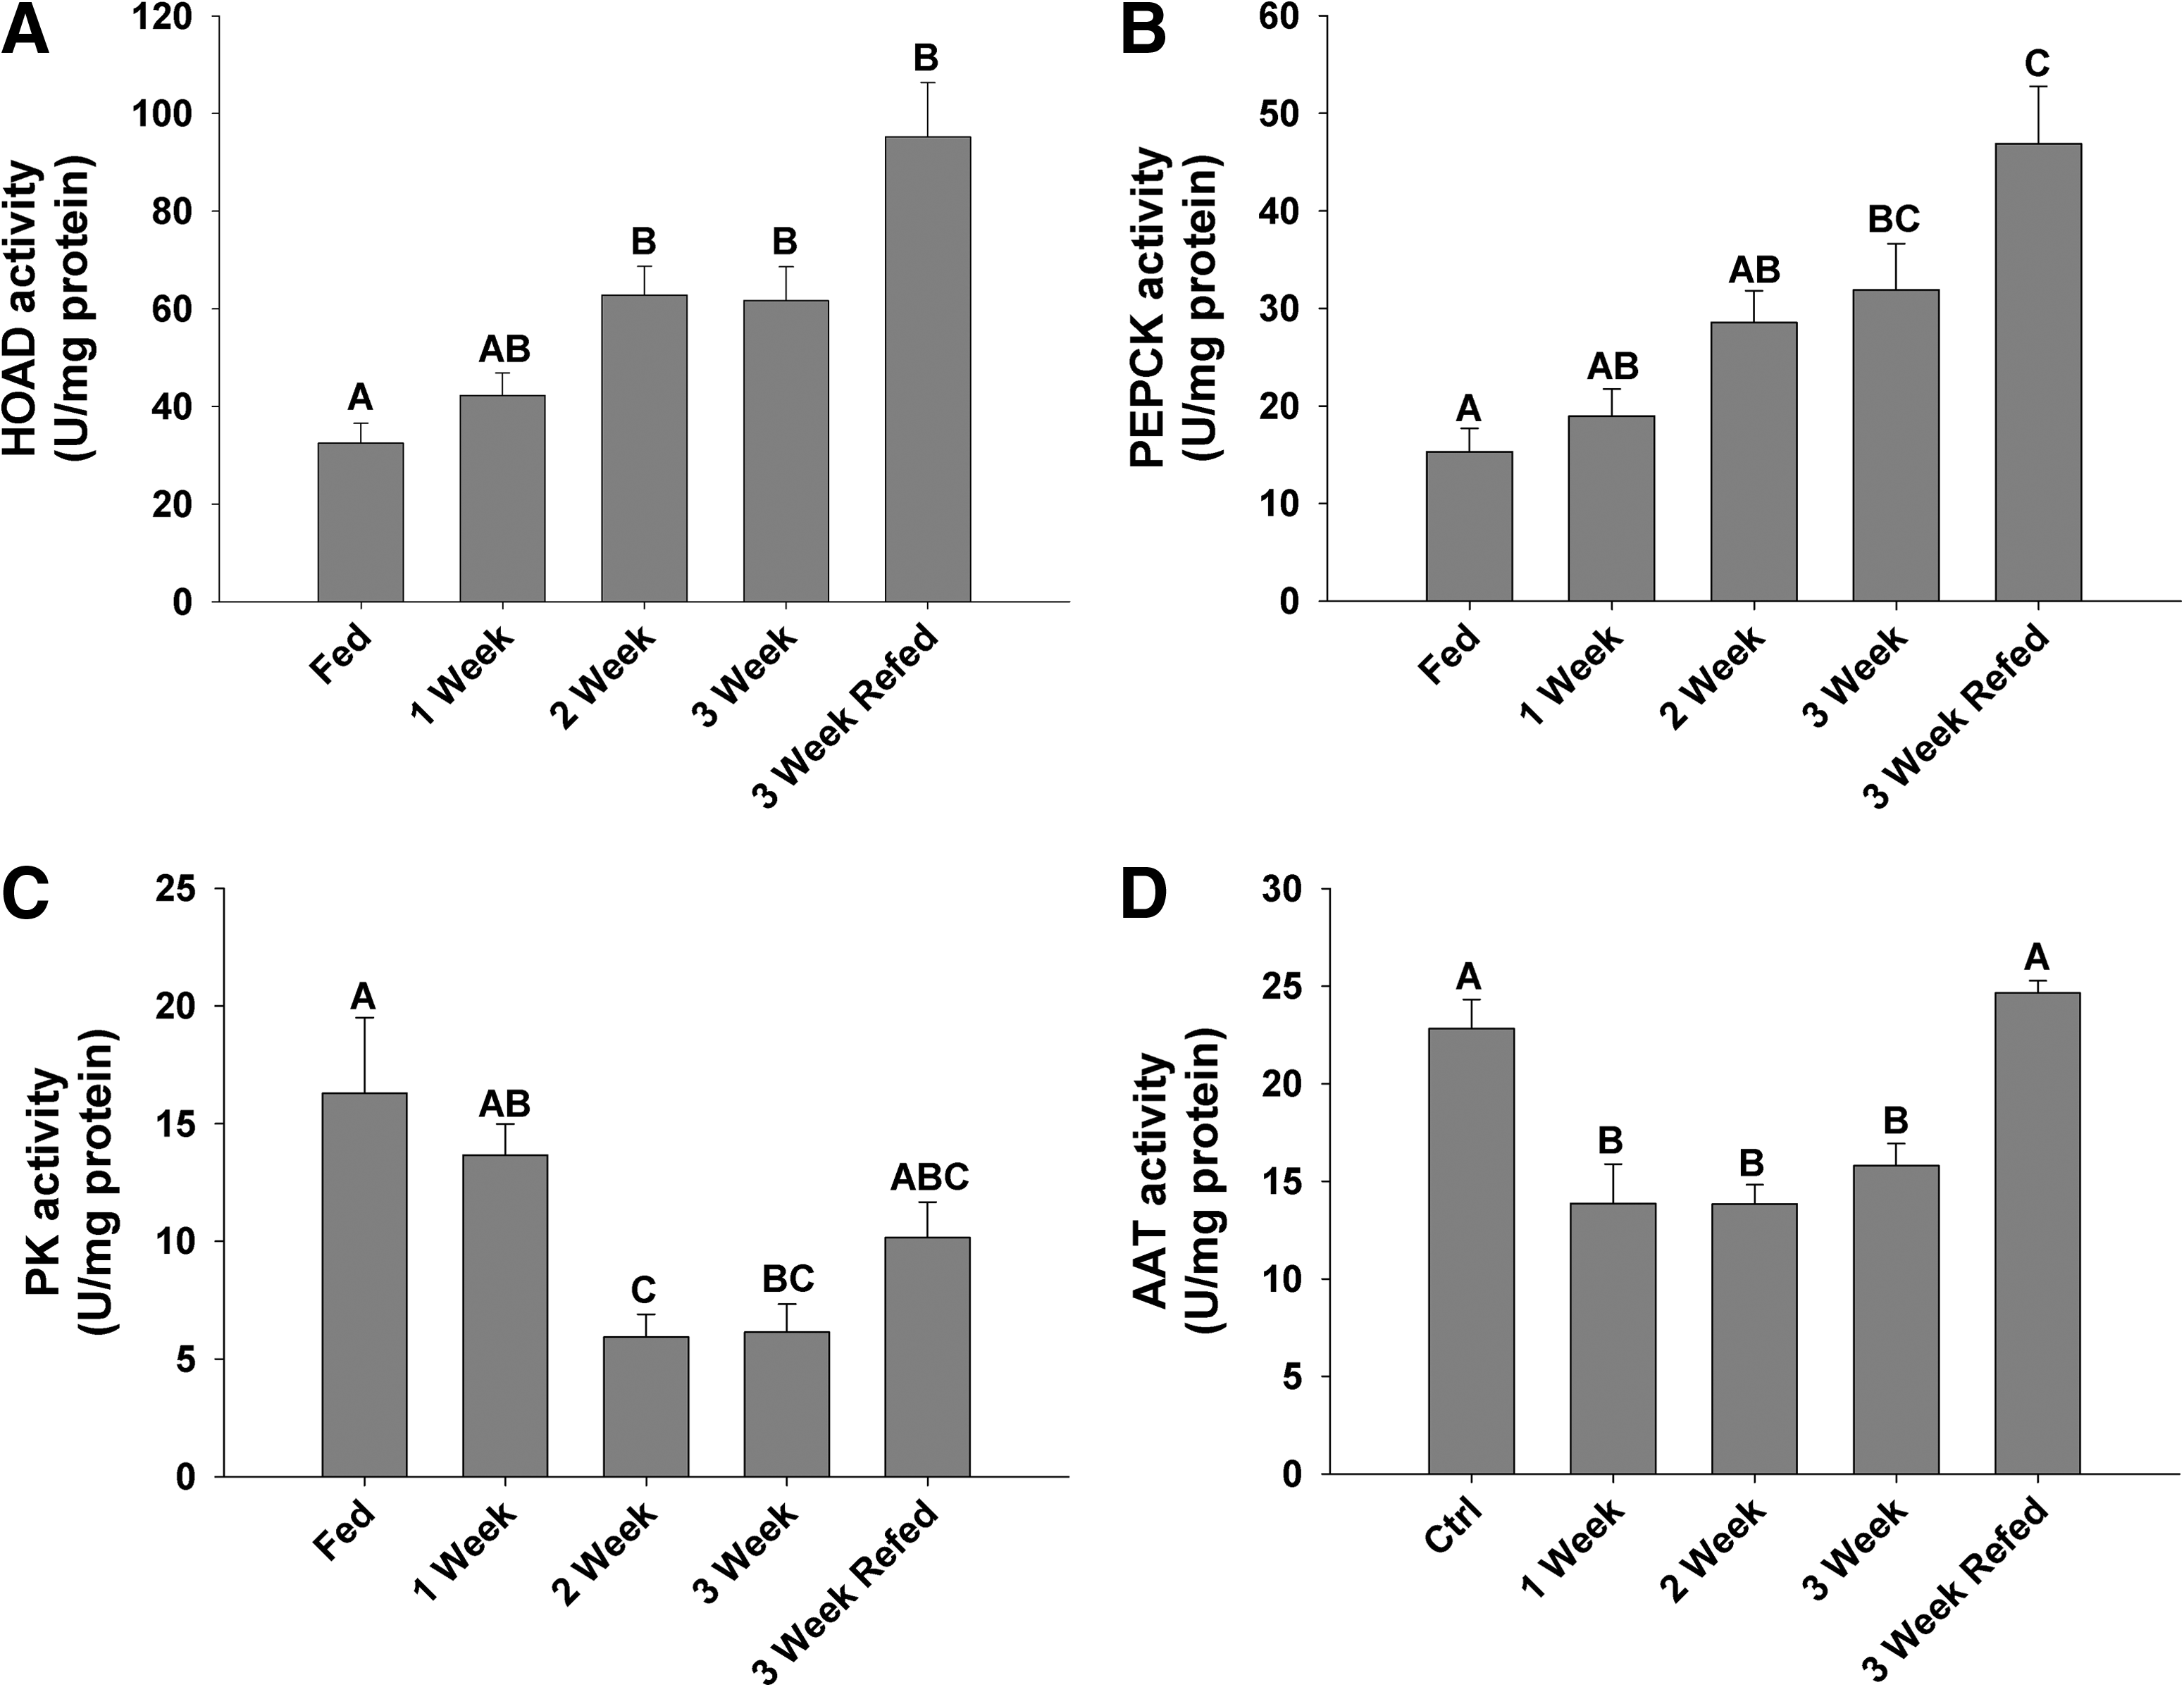
Liver enzyme activities (units per mg protein; n = 6) of
Discussion
This study demonstrates that zebrafish respond to fasting in a manner not unlike mammals, with comparable changes in fuel metabolism and nutrient receptor transcription. Zebrafish liver increased both β-oxidation (Fig. 5A) and gluconeogenesis (Fig. 5B) during fasting as glycogen and lipid stores declined (Figs. 2B and 3, respectively) likely a response to decreased cellular ATP concentrations and increased phosphorylation of AMPK. Conversely, liver protein metabolism and glycolysis were depressed, as was whole body oxygen consumption (Fig. 1B). Thus, the predominant effect of fasting is consistent with a rapid increase in gluconeogenic capacity, as both CREB3l3 expression and PEPCK activity rapidly increased (Fig. 4B and 5B, respectively). This discussion will examine the transcription and functional consequences of changes in the key nutrient receptors that could account for this fasting response in the zebrafish.
The mammalian liver is central to energy balance as it has a principle role in the metabolism of dietary carbohydrates and lipids by both storing and releasing glucose and synthesizing fatty acids. 23 The zebrafish liver plays a similar role. Unlike the carnivorous rainbow trout model of glucose intolerance, the zebrafish (family Cyprinidae) is an omnivorous species and more tolerant of excess glucose in their diets as demonstrated in the study of Eames et al. 3 Further, the metabolic rate, as indicated by oxygen consumption (Fig. 1B), decreased with nutrient restriction, which is consistent with previous studies examining reduced physical activity in a caloric restricted state in both zebrafish and mammalian models, which identifies the zebrafish as an excellent candidate model for related mammalian studies.15,16
If “carbohydrates are the key to metabolism of all vertebrates, including fish species,” 24 then the lack of dietary carbohydrate could impact the metabolism of zebrafish in terms of both molecular and physiological responses. This study examines transcript levels correlated to a functional response during fasting in an effort to determine if changes in suspected nutrient receptors impose a physiological response, which is a first step toward understanding the molecular mechanism involved during fasting in zebrafish. During a fasted state, there is a 2.5-fold increase in the transcript level of AMPKα, the catalytic subunit of AMPK, after 3 weeks (Fig. 4A). AMPK is activated through a variety of stimuli, including glucose deprivation in mammals 25 and hypoxia in goldfish and carp,13,14 that typically affect the AMP:ATP ratio within the cell so that AMP at high concentrations binds to and alters the conformation of AMPK inhibiting its dephosphorylation. 26 As zebrafish fast, a depletion of available energy is likely resulting in increased cellular [AMP], and inducing the phosphorylation of AMPK to reduce anabolic processes, including protein synthesis and lipogenesis. Neither AMPK activity nor phosphorylation was measured; however, through transcript analysis, increased expression of the AMPKα subunit occurred, indicating that total AMPK may have increased in this energy deprived state in fasted zebrafish. Certainly, a rapid stimulation of β-oxidation, a known target of phosphorylated AMPK, 27 and severe depression in transcripts involved in protein synthesis and lipogenesis, namely, mTOR and SREBP1 and 2, both support a significant stimulation of AMPK activity (Fig. 4A, B). A recent mammalian cell study identified that phosphorylated AMPK can directly inhibit mTOR, 28 and likely a similar situation persists in the fasted zebrafish liver, as after 1 week of fasting there is a significant depression in mTOR expression and AAT activity, a marker of protein metabolism, indicating a reduced potential for protein synthesis and anabolic consumption of ATP, which persisted to week 3 (Figs. 4C and 5D). In liver transplant recipients, pharmaceutically induced mTOR inhibition significantly reduced AAT activity, 29 which provides evidence for the validity of this linkage in fasted zebrafish. However, the depression in mTOR expression is complicated by the fact that TOR activity declines during nutrient starvation in yeast and Drosophila30,31 and amino acid starvation in mammalian models. 32 Therefore, it is difficult to determine whether mTOR depression is linked to increased AMPK activity or a nutrient-deficiency pathway, although it is likely a synergistic effect. AMPKα expression rapidly returns to control values 24 h after re-feeding, with an associated increase in liver mTOR transcript levels (Fig. 4A, C), an indication that AMPK may play a pivotal role in the coordination of the activity and expression of a number of enzymes involved in lipid and carbohydrate metabolism. Assifi et al. 33 demonstrated that re-fed rats have a 40% reduction in AMPK activity 1 h post re-feeding after a period of fasting, likely due to the effect of increased insulin/decreased glucagon on the activity of AMPK.34,35
The lipogeneic capacity of the zebrafish liver is reduced by fasting and conversely the rate of fat oxidation increased as supported by elevated HOAD activity (Fig. 5A) and by reduced levels of cholesterol, triglycerides, and phospholipids (Fig. 3). Regulation of lipogenesis is primarily by insulin and nutrient concentrations; however, evidence supports regulation of fatty acid synthesis by mTOR, which in turn activates SREBP1. 36 SREBPs are considered to be the global lipid synthetic regulators acting on numerous lipid and cholesterol targets (see 4 ) and are significantly repressed during short term fasting in both mammals and avian species.5,37,38 After 2 weeks of fasting, the SREBP transcript level is decreased in the zebrafish liver, likely reducing lipogenic activity in an effort to conserve energy—an effect that appears to be rescued 24 h after re-feeding (Fig. 4D). There are 3 isoforms of SREBP in mammals, SREBP1a, SREBP1c, and SREBP2, with SREBP1a and c being produced from the same gene with alternate promoter sites, and SREBP2 from a separate gene.39,40 Mammalian tissue expression profiles indicate that SREBP1c is primarily expressed in the liver and adipose tissue, with SREBP1a expression linked to the intestine and pancreatic tissue. 41 Primers used here were proximal to the 5′ end of the sequence, which likely contains shared regions of SREBP1a and c, although with significant repression in SREBP1 during fasting, SREBP1c was presumed targeted as these expression changes are similar to those in mammalian studies that report significant repression and then recovery of only the SREBP1c transcript during fasting/re-feeding regimes. 5 Horton et al. 42 demonstrated that SREBP1 primarily regulates genes associated with fatty acid synthesis, and SREBP2 regulates the cholesterol pathway. In the fasted zebrafish, there is significant repression in both SREBP1 and 2 concurrent with a reduction in triglycerides, cholesterol, and phospholipids, an indication that SREBPs in zebrafish perform a homologous function to their mammalian counterpart.
The increased activity in PEPCK, a key gluconeogenic enzyme during fasting in zebrafish, presents an interesting facet to this study. During fasting, glucagon is secreted from pancreatic tissues, which enhances glucose production through cAMP-dependent transcriptional stimulation of key gluconeogenic enzymes43–45 (PEPCK and G6Pase). Previous work by Elo et al. 2 indicated that treatment of zebrafish larvae with cAMP increased PEPCK activity, which demonstrated the presence of regulatory elements necessary for expression of the PEPCK gene. CREBH is a recently identified transcription factor that plays an important role in mammalian hepatic glucose metabolism whose expression is increased during fasting and is a known activator of PEPCK.18,46 The zebrafish homolog is CREB3l3, whose expressional pattern in fasted hepatic tissue of zebrafish mimics that of mammalian expression, with a rapid induction correlated to an increase in PEPCK activity. Conversely, in rainbow trout, Kirchner et al. 47 demonstrated no change in PEPCK activity after 14 days of fasting, which is significant in comparison to this study as this allows for identification of differences in glucose homeostasis between carnivorous and omnivorous species, such as zebrafish. This is the first study in zebrafish to examine the expression of this transcript and provides significant evidence of the importance of this gene in maintaining glucose homeostasis, as there is a significant depletion in glycogen stores and little impact on blood glucose until the third week of fasting (Fig. 2).
In conclusion, this study attempts to establish zebrafish as a valuable model for the study of targets applicable to obesity and diabetes, as the zebrafish response to fasting appears to mimic in many ways that of mammals. Although there is a wealth of information regarding the function of the individual components of the mTOR and AMPK pathways, the coordination of these pathways through multiple stimuli is poorly understood. This study has taken the initial steps to examine multiple transcriptional regulators that work together in a coordinated effort to maintain energy balance in a fasted state. Further, nutritional receptors and activators follow a similar pattern of expression between zebrafish and mammalian studies during fasted/re-fed experiments, and downstream functional responses are in tune with mammalian studies. Future studies are required to further elucidate exact mechanisms and the predominant regulator of nutrient metabolism in zebrafish; however, this study provides substantial evidence to indicate some of the key regulators to further examine, particularly CREB3l3.
Footnotes
Acknowledgments
The authors wish to thank Bill Fletcher for his assistance in fish husbandry at the University of Ottawa. Thanks are also extended to Dr. Charles Darveau for advice and use of equipment for tissue homogenization and enzyme analysis. Funding was provided through an NSERC Discovery grant to TWM. P.M.C. is a recipient of an NSERC Postdoctoral Fellowship award.
Disclosure Statement
No competing financial interests exist.