
Abstract
Abstract
The zebrafish (Danio rerio) is an increasingly used laboratory animal model in basic biology and biomedicine, novel drug development, and toxicology. The wide use has increased the demand for optimized husbandry protocols to ensure animal health care and welfare. The knowledge about the correlation between culturable zebrafish intestinal microbiota and health in relation to environmental factors and management procedures is very limited. A semi-quantitative level of growth of individual types of bacteria was determined and associated with sampling points. A total of 72 TAB line zebrafish from four laboratories (Labs A–D) in the Zebrafish Network Norway were used. Diagnostic was based on traditional bacterial culture methods and biochemical characterization using commercial kits, followed by 16S rDNA gene sequencing from pure subcultures. Also selected Gram-negative isolates were analyzed for antibiotic susceptibility to 8 different antibiotics. A total of 13 morphologically different bacterial species were the most prevalent: Aeromonas hydrophila, Aeromonas sobria, Vibrio parahaemolyticus, Photobacterium damselae, Pseudomonas aeruginosa, Pseudomonas fluorescens, Pseudomonas luteola, Comamonas testosteroni, Ochrobactrum anthropi, Staphylococcus cohnii, Staphylococcus epidermidis, Staphylococcus capitis, and Staphylococcus warneri. Only Lab B had significantly higher levels of total bacterial growth (OR=2.03), whereas numbers from Lab C (OR=1.01) and Lab D (OR=1.12) were found to be similar to the baseline Lab A. Sexually immature individuals had a significantly higher level of harvested total bacterial growth than mature fish (OR=0.82), no statistically significant differences were found between male and female fish (OR=1.01), and the posterior intestinal segment demonstrated a higher degree of culturable bacteria than the anterior segment (OR=4.1). Multiple antibiotic (>3) resistance was observed in 17% of the strains. We propose that a rapid conventional diagnostic bacteriological assay on the culturable microbiota profiles can be designed and used as quality measure of the husbandry routines of a zebrafish facility to ensure a bacterial standard safeguarding the zebrafish health and welfare.
Introduction
The zebrafish model has been introduced in a wide variety of research fields15–17 including studies of the importance of the gut microbiota composition including the generation and use of gnotobiotic zebrafish. 18 Comparative metagenomic profiling of zebrafish and mouse gut microbiotas revealed the presence of Proteobacteria, Firmicutes, Bacteroidetes, Verrucomicrobia, Actinobacteria, and Planctomycetes divisions in both species. 19 However, gut microbiota in domesticated and recently caught wild zebrafish were found to be similar, with a shared core gut microbiota identified by 16S rRNA gene sequence-based comparisons. 20 Still the normal composition of the culturable zebrafish intestinal microbiota has remained largely uncharacterized. Therefore, we chose the widely used AB/TU TAB14 (TAB) wild-type strain of zebrafish (http://zebrafish.org/zirc), which was established as standard laboratory fish stock among four different facilities (named Lab A, B, C, and D) belonging to the Zebrafish Network Norway (ZNN; http://zebrafish.no) for comparison of the composition of the culturable proportion of the intestinal microbiota in different zebrafish facilities. We evaluated the effect of the status of sexual maturity and gender on the composition of the intestinal microbiota. Further, the impact of husbandry introduced factors such as bacterial contents of the feed, the re-circulated water, and the water in the fish tanks were analyzed. In addition, phenotypical antibiotic resistance profiles of selected intestinal isolates were determined and compared among facilities. Antibiotic resistance has been documented to occur in bacteria related to ornamental fish living in aquaria and has been suggested to be a result of the use of antibiotics in the management of the fish health. 21 However, to our knowledge, the occurrence of antimicrobial resistance in the normal microbiota of established zebrafish lab strains like the TAB, has not previously been reported.
Materials and Methods
Study design
The study was performed as an Open and Single Central Trial with a Stratified, Sequential Parallel Group Design.22,23 Four separate facilities belonging to the ZNN were used as stratification factor. The reference population of the study consisted of the TAB strain zebrafish which was divided into two main clusters with regards to sexual maturity (<4 months: immature/adolescent and >6 months: mature/adult) and gender (male/female). With the feeding regime of the facilities, the age of sexual maturation is starting at 4 months post fertilization. The variation in the ages of the mature zebrafish was less than 2 weeks. A total of 72 TAB zebrafish (Lab A–C=20, Lab D=12) were studied. For each of the 4 Labs, both male and female fish were stocked together in 4 identical tanks (2 of each of Tankmature and Tankimmature). After morning feeding, fish were starved approx. 6 h prior to sampling. Facility records of water quality, environmental parameters, feed, and light regimes were provided by each laboratory. The year of facility establishment and the manufacturer of the rearing systems were included in the records.
Sampling procedure
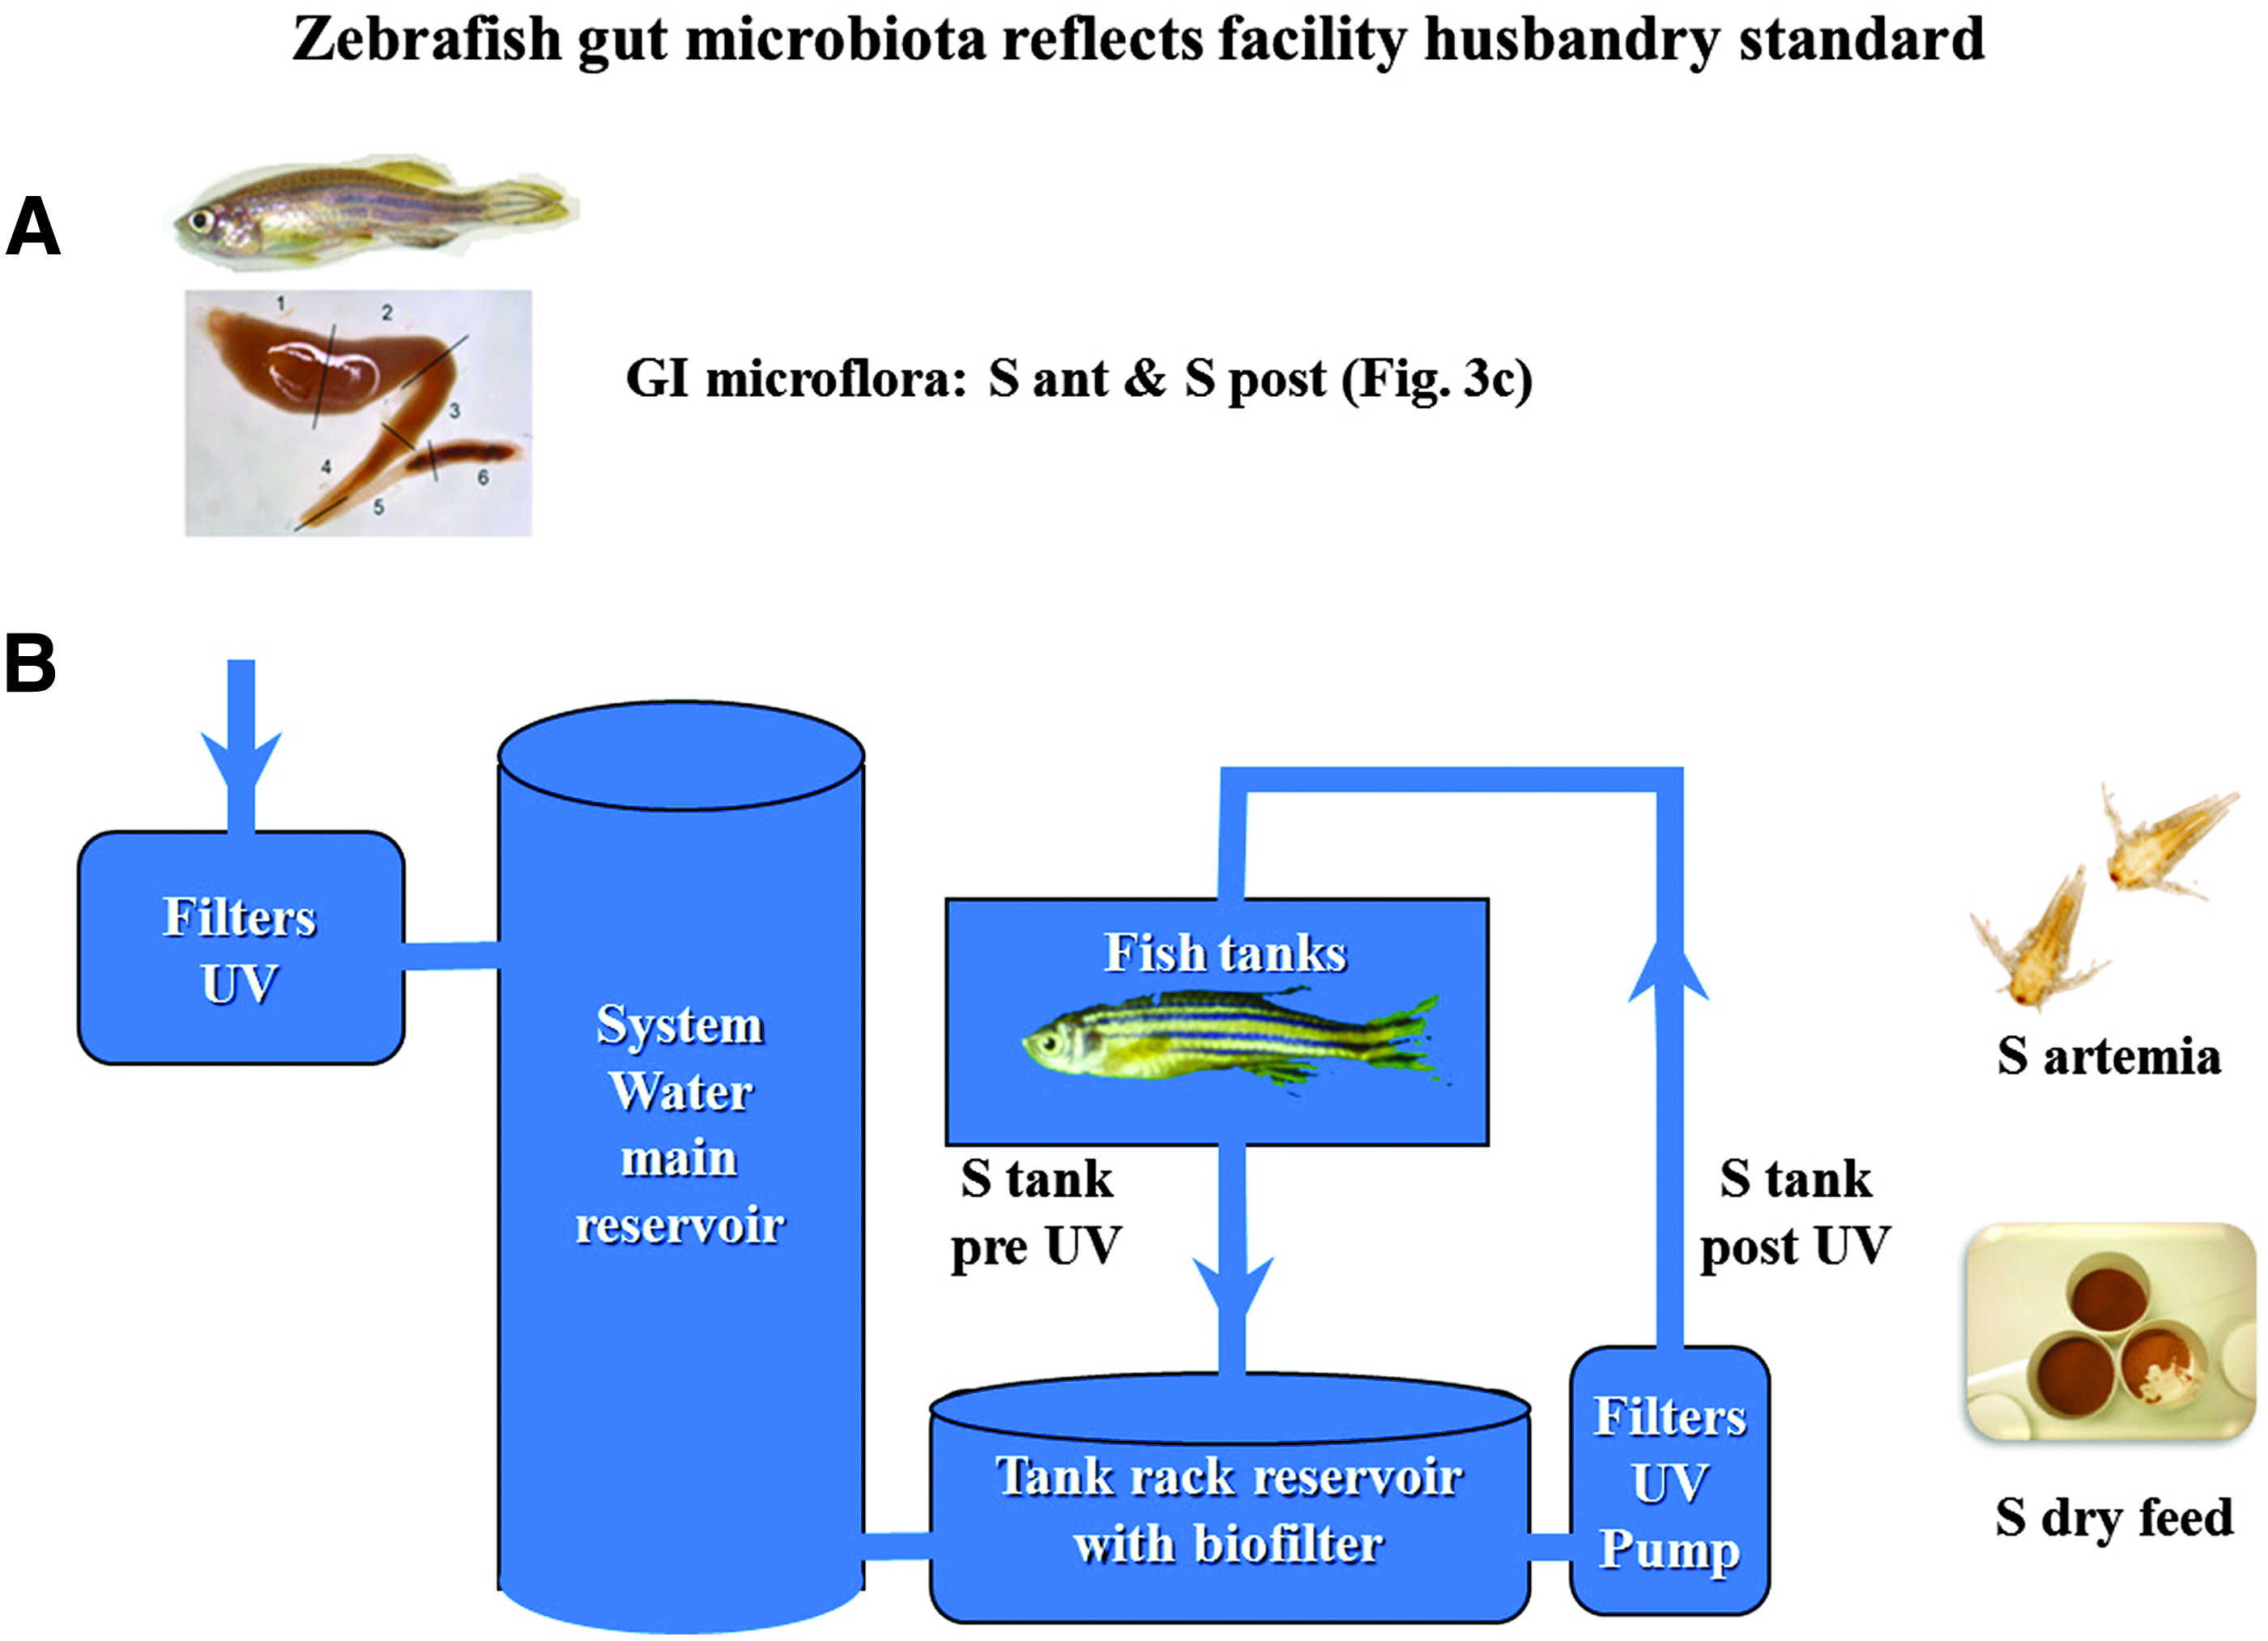
An overview over the microbiota sampling protocol design is shown in Figure 1. Sterile latex gloves or latex gloves wiped with 70% ethanol were used throughout the dissection, and the ventral side of the fish was sterilized using 70% ethanol. The fish were killed by decapitation. The ventral belly surface of the freshly euthanized fish was opened with sterilized micro surgical blade and forceps under a light source. The spleen, gall bladder, liver, and fat deposits surrounding the GI tract were gently removed to expose the peritoneal cavity without disturbing the intestine. Then according to Wallace et al. 24 and Oehlers et al.,24,25 the intestinal system was divided into an anterior (including mid) and a posterior segment. This division of sample origins was used throughout the study. At each sampling point the divided intestinal segments were transferred into separate microfuge tubes and squeezed using sterile 1 μL disposable plastic loops that also were used to streak the specimen on 5% bovine blood agar (Blood agar base no 2, Difco) and Brocalin agar (Merck, Darmstadt, Germany) bacteriological plates, with three serial dilutions (for each dilution line a new sterile disposable plastic loop was used). Dry feed samples were moisturized with sterile 0.9% NaCl, while artemia and water samples were directly used for spreading on to the plates. The plates were incubated at 28°C (±1) and followed by inspections every third day for up to 4 weeks.
Overview samples analyzed for microbiota bacteria profile.
Bacterial isolation and identification
After incubation, each morphologically distinct colony (form, size, surface, color, texture, elevation, margin, odor, and hemolysis) was encoded. From each sampling plate (age, gender, and part of the intestine) two representative colonies of each colony type were randomly selected and subcultured on a separate blood agar. Pure colonies were checked for motility under a light microscope (Leitz, 301–314.001, Germany) at 1000X magnification using a glass slide with suspended and Gram stained exponentially grown bacteria in physiological salt water. 26
Gram-positive cocci were tested for coagulase activity. Gram-negative bacteria were analyzed with the IMViC reactions; indol production, methyl red test (fermentation of glucose), Voges-Proskauer reaction (diacetyl-production), and the ability to use citrate as the sole carbon source (Simmons citrate medium) were tested. Catalase and oxidase activity, H2S production, urease and β-galactosidase (ONPG) production and ability to degrade glucose, trehalose, lactose, maltose, mannitol, and esculin were tested for most of the isolates and susceptibility to the vibriostatic agent (O129) were tested for isolates in the family Vibrionaceae (Table 1).27–29 Also the Staph-Zym System (ROSCO, Taastrup, Denmark) was applied for staphylocci isolates. Additionally, susceptibilities to the antibiotics novobiocin (5 μg) and polymyxins (Neo-Sensitabs, ROSCO) were determined on Mueller-Hinton agar by standard methods. Procedures were performed as directed by the manufacturer.
+=90% or more strains are positive; −=90% or more strains are negative; GN, Gram negative; GP, Gram positive; N, not done; ONPG, ortho-nitrophenyl-3-D-galactopyranoside; V, isolate variability (% not shown); Va, 63.8%; Vb, 16.6%; Vc, 11.1%.
The API 20 NE system was used for classification of Gram-negative bacilli and evaluated according to the instructions of the manufacturer (BioMérieux, Marcy l'Etoile, France). Strain identification at the species level was accepted for excellent species identification subgroup which gives minimum percent identification of >98.2% and maximum T value of 1.
All registered morphological and biochemical characteristics were compared with Bergey's Manual of Determinative Bacteriology, Ninth Edition (2000).
Semi-quantiative evaluation of bacterial density
The bacterial growth density of each bacterial species within the intestinal contents was estimated based on experience from bacterial diagnostic routine work to be scored semi-quantitatively by estimating the number of colonies detected on the plate as follows: no growth (0: Absent); <10 colonies (1: Very few); 10–50 colonies (2: Few); 50–100 colonies (3: Moderate); 100–200 colonies (4: Rich); >200 colonies (5: Very rich). 30
DNA isolation, 16S rDNA amplification
DNA was extracted from 40 different isolates of multi-drug resistant (>3 drugs) Gram-negative bacteria by transferring a loop-full of randomly picked colonies to the DNeasy Blood & Tissue Kit® (Qiagen S.A., France), according to the manufacturer's guidelines. Following nucleic acid purification, the 5’ portion of the 16S rRNA gene (corresponding to Escherichia coli positions 10 to 806) was amplified using primers V1 [5’-AGA GTT TGA TCA TGG CTC AGA-3’] and V3 [5’-GGT TAC CTT GTT ACG ACT TC-3’]. Cycling conditions: (i) denaturation 3 min at 94°C; (ii) 30 cycles of 30 s at 94°C, 30 s at 56°C, and 2 min at 72°C; (iii) 10 min extension at 72°C. Two μL of DNA extract was used for amplification in a total volume of 25 μL containing 2.5 μL 10X PCR Buffer, 1 μL 50 mM MgCl2, 1 μL 10 mM dNTP mix, 5 pmol each of forward and reverse primers, 1 U of Taq DNA polymerase (Fermentas, Vilnius, Lithuania) and 16.4 μL sterile nuclease-free PCR grade water. DNA amplifications were performed in a GeneAmp 9700 PCR system thermocycler (Applied Biosystems, Foster City, CA). Positive (Escherichia coli NVH 1067/03) and negative control (sterilized dH2O) samples were included in all amplifications. The PCR products were analyzed on 1% agarose gels and stained with SYBR Safe® DNA Gel Stain (Invitrogen). After electrophoresis at 100 V for 60 min, DNA bands were visualized by a Gel Doc™ XR+ Imaging System (Bio-Rad, Hercules, CA).
Sequence analysis and construction of phylogenetic trees
Amplicons were purified with QIAquick PCR Purification Kit® (Qiagen) and sequenced by GATC laboratories (Konstanz, Germany) with V1 and V3 primers. Afterwards, 16S rRNA gene sequences were compared with those available in the GenBank, EMBL, and DDBJ databases using a two-step procedure. A first search was performed with the FASTA algorithm of the Wisconsin GCG program package. 31 All positions showing differences to the best-scoring reference sequence were visually inspected in the electropherogram, and the sequence was corrected manually if necessary. Thereafter, a second search was done using BLASTN. Undetermined nucleotides (designated N) in either the determined sequence or the reference sequence were counted as matches. The mean length of the obtained 16S rRNA sequences was 1150 bp containing 14±9 undetermined (N) positions (range, 5–19 N). A phylogenetic tree was constructed as described by Roblero et al. 32 with 16S rRNA gene sequences of representative type strain sequences (Fig. 1).
Antibiotic susceptibility test
Two colonies of each of the identified Gram-negative isolates were randomly selected from each individual fish. Thus a total of 1008 Gram-negative isolates were tested for their phenotypical antibiotic susceptibility to 8 selected antimicrobial agents: Tetracycline (Tet 80 μg), sulphonamide (Sul 240 μg), trimethoprim (Trim 5.2 μg), trimethoprim-sulphonamide (Sul 240 μg+Trim 5.2 μg), streptomycin (ST 100 μg), gentamicin (Gen 240 μg), oxolinic acid (Oxoli 10 μg), and nalidixic acid (Nal 130 μg), using the disc-diffusion method (Neo-Sensitabs, Rosco, Taastrup, Denmark). Inhibition zones were measured and resistance categorization was carried out according to MIC break points of the Norwegian AFA group (2005, 2006), described in “User's guide Neo-sensitabs®” (http://www.rosco.dk). Intermediate zones were recorded as resistant.
Data analysis
The levels of growth of the bacterial clusters (total and Gram±) were associated with different sampling points. Sexual maturity, gender, and intestinal segment factors were encoded and together with the corresponding levels of the results from cultivable bacterial growth (absent=0, very few=1, few=2, moderate=3, rich=4, and very rich=5) entered into a Microsoft Excel® spreadsheet. From primary data analysis, a spider web was used to visualize how the facilities with correlation to the chosen factors varied on a ‘Median Counts of Selected Gut Bacteria Growth Degrees' (Fig. 2). Antibiotic sensitivity records for each isolate at the facility level were entered into Microsoft Excel® spreadsheet. The average distribution of antibiotic resistance frequencies at the facility level was summarized in a histogram (Fig. 3). For further statistical analysis, all data were transferred to Stata (Stata SE/10 for Windows, Stata Corp., College Station, TX). A survey-data-analysis procedure was used for estimating the distribution of the bacterial growth from different sampling points and its univariate association with individual exposure variables, considering each individual animal as primary sampling unit. For each factor, an Ordered linear logistic regression model analysis was built and Odds ratio (OR) with 95% Confidential interval (CI) detected.

Phylogenetic neighbor-joining tree of the randomly selected multi-resistant (>3 drug) strains, based on nucleotide sequence of the 16S rDNA genes. Neisseria canis ATCC 14687 type strain was used as an out-group. Nodes with > 95% bootstrap support for all analyses (•) and > 75% bootstrap support (◊). Values below 50% are not shown. Brackets define the gene accession numbers. Lab A–D, randomly picked bacteria 1–2.

Growth Degree Median Counts of Selected Gut Bacteria among four facilities.
Results
All examined fish appeared healthy with no gross deformities or lesions related to the gut at the macroscopic level after visual inspection. Furthermore, by naked eye inspection, there was no discernable difference in the amount of gut content within the guts of the individual fish.
GI microflora
From the intestinal samples taken, a total of 13 morphologically different bacterial species were isolated and characterized: Aeromonas hydrophila, Aeromonas sobria, Vibrio parahaemolyticus, Photobacterium damselae, Pseudomonas aeruginosa, Pseudomonas fluorescens, Pseudomonas luteola, Comamonas testosteroni, Ochrobactrum anthropi, Staphylococcus cohnii, Staphylococcus epidermidis, Staphylococcus capitis, and Staphylococcus warneri. The basic identification criteria employing cultural and biochemical test results are shown in Table 1. 16S rDNA sequences were obtained and analyzed by FASTA (see Methods section) to support the biochemical identifications and a more in depth classification of the drug resistant isolates to reveal potentially antibiotic selected subspecies or clones. A phylogenetic tree constructed with the resulting PCR amplified 16S rRNA gene sequences is presented in Figure 2.
Lab A was selected to represent the baseline, Lab B had slightly but significantly higher levels of total bacterial growth (OR=2.025; 95% CI=1.73–2.38), whereas Lab C (OR=1.008; 95% CI=0.86–1.18) and Lab D (OR=1.122; 95% CI=0.89–1.41) were found to have similar levels as for Lab A (Fig. 3a). The comparisons of adolescent and adult fish revealed that the younger individuals (up to 4 months of age) had a significantly higher level of detected culturable total bacterial growth than mature fish (OR=0.823; 95% CI=0.73–0.93; Fig. 3b). Of the two parts of the intestine, the posterior segment demonstrated a higher content of culturable bacteria than the anterior (OR=4.998; 95% CI=4.38–5.71; Fig. 3c). Comparison of gender revealed no statistically significant microbiota related differences between male and female fish (OR=1.005; 95% CI=0.89–1.13; Fig. 3d).
Fish rearing environment
The records provided from the Lab A–D facilities (Table 2) showed that selected parameters were within acceptable ranges for zebrafish. pH was kept 0.5 units lower in Lab D and the temperature in Lab B was 0.8°C higher, but all values were kept constant and are expected to have no important negative impact on fish health. All facilities stored their dry feed at 4°C except for Lab B in which it was kept at room temperature (20±2°C). Lab B was at the time of the samplings using an old UV lamp (close to exchange time-point) to sterilize the recycling water within the rearing system. Lab A and Lab C both had permanently employed fish nursing technicians, while Lab B and Lab D were running their facilities with the aid of different temporary employed technicians and students, a situation which may have an impact on keeping up with stable conditions of the fish rearing environment.
Facility established in 1995, but upgraded 2005 to AAALAC accreditation standards; 2Marine Biotech, Florida; 3Aquatic Habitats, Florida; 4AquaSchwarz, Göttingen; Germany. 5NA: not available; 6Special diet services, Essex, UK; 7AquaSchwarz, Göttingen, Germany. aDry feed/artemia kept at +4°C; bDry feed kept outside at facility room temperature.
The culturable GI bacteria profile was determined at four check points in the rearing system (Fig. 1). Cultures from tank water (Fig. 1, ‘S tank pre UV’) consisted of a mixture of intestinal and feed related bacterial floras. In general, very mixed bacterial growth was observed from all facilities regardless of fish age. Very high levels of A. hydrophila and high levels P. fluorescens were detected (data not shown) from all facilities. The level of total bacterial growth observed from tank water samples of Lab B (OR=2.576; 95% CI=1.26–5.25) was significantly higher, as compared to the levels of Labs C (OR=0.631; 95% CI=0.26–1.48), D (OR=0.694; 95% CI=0.29–1.64) and the baseline Lab A. Similar significantly higher levels of Gram-positive bacterial growth were measured from pre UV tank water at Lab B (OR=9.060; 95% CI=1.96–41.84) and Lab D (OR=11.043; 95% CI=2.30–52.95). Comparison of the adolescent with adult fish revealed higher levels of total bacterial growth from the tanks with sexually immature fish (OR=0.430; 95% CI=0.25–0.71) relative to the sexually mature fish at all facilities.
Different levels of bacterial species were observed from facility-related samples. A. hydrophila and P. fluorescens were common for all 4 facilities and were detected at relatively high levels from pre-UV light water samples. In addition, a moderate level of P. aeruginosa and low numbers of Staphylococcus spp. were observed at Lab B, C and D. As expected, after the UV light units (Fig. 1, ‘S tank post UV’) a clear decrease in the level of culturable bacteria was observed. In Lab A, very low numbers of A. hydrophila and P. fluorescens were detected, while low numbers of A. hydrophila, very low numbers of A. sobria, and moderate numbers of P. fluorescens and P. aeruginosa were detected at Lab B. In addition, low numbers of Staphylococcus spp. were detected in Lab D.
The culturable flora of dry feed samples (Fig. 1, ‘S feed’) examined mainly consisted of P. luteola, O. anthropi, C. testeroni, and Staphylococcus spp., and unidentified fungi (identification of fungi was out of scope of the study and fungi were detected only from feed samples). For total numbers of culturable bacteria, Lab A had the lowest level with Lab B having the highest and the Labs C and D in-between. On the other hand, Lab D had higher numbers of Gram-positive bacteria. The cultures from the Artemia live feed samples (Fig. 1, ‘S artemia’) consisted of variable levels of A. hydrophila, A. sobria, P. damselae, P. aeruginosa, and P. fluorescens. All facilities had low numbers of P. damselae in the Artemia samples. The D Lab had moderate numbers of Staphylococcus spp. while other facilities had low numbers of Staphylococcus spp. Likewise low numbers of Aeromonas spp. and Pseudomonas spp. were common among the A, C, and D Labs, but were detected at moderate levels at B Lab.
Antibacterial resistance
Of the screened isolates, 40.7% were found to be resistant to more than one antibiotic and 17% showed multiple antibiotic (>3) resistance (Fig. 4). Among the facilities, Lab B showed significantly higher resistance against tetracycline (OR=1.829; 95% CI=1.14–2.92) and sulfonamide (OR=1.514; 95% CI=1.05–2.16). Statistically no significant differences were observed for the sulfonamide-trimethoprim combination for the complete selected bacterial population, whereas Pseudomonas spp. disclosed a higher resistance score in Lab B (OR=1.830; 95% CI=1.07–3.11). All strains were susceptible to gentamicin and only low frequencies of strains were found to be resistant to the quinolone antibiotics.

The average frequency distributions of antibiotic resistant Gram-negative isolates (N=1008) among zebrafish facilities. There was a trend of increased antibacterial resistance from bacteria isolated from Lab B, this was statistically significant by logistic regression model analysis (p<0.05, indicated by an asterisk) for some antibiotics.
Discussion
A comparison of the culturable TAB strain zebrafish gut bacterial microflora revealed diversity with varying levels of 13 defined species among the four different zebrafish facilities examined. The phenotypical homology found between the randomly selected groups was illustrated in the 16S rDNA phylogenetic tree. The variation of the composition of the intestinal microbiota of zebrafish between the various Labs underlines the clear impact of the management on the gut microbiota. Significant differences between the observed facilities suggest a correlation to differences in husbandry management. The most frequent strains from the study can be grouped as nonpathogenic/potential pathogenic or commensal bacteria. In particular, three genera (Aeromonas, Vibrio, Photobacterium, and Pseudomonas) of the identified bacterial species in the intestinal micobiota isolates of zebrafish in this study are potential freshwater fish pathogens: A. hydrophila,33–36 A. sobria, 37 V. parahaemolyticus, 38 P. damselae, 39 P. fluorescens,40–42 P. luteola, 44 and P. aeruginosa.40,42,44 Many of the bacterial species are regular members of the normal microbiota. 20 However, these bacteria are also repeatedly reported as causative agents of infections in fish. Many bacterial infections, in particular known from mammals, are caused by bacteria normally inhabiting the various mucosal compartments of the animal. 45 Infections often develop secondary to factors as virus infections or stress among others.
Most bacteria causing diseases in fish are normal inhabitants of aquatic systems and normally do not cause disease symptoms. Even though pathogenicity and virulence screening were out of the scope of the study, through use of blood agar plates it was possible to observe variable hemolytic activities related to the primary growth of colonies. The GI tract microbiota composition is sensitive for physiological stress of the fish caused by poor system/tank water quality, including high levels of particulates, suboptimal photoperiod, conductivity, oxygen level, temperature, malnutrition, overstocking, recent transportation, handling, or other stress-causing conditions. Stress can affect the immune system of fish, 46 and change the ultrastructure of the intestinal mucosa. 47 The disturbance of the intestinal balance may cause establishment of several lethal infections by opportunistic pathogens. 48 Once an outbreak starts in a zebrafish facility, it often becomes difficult to control, since the rapid growth of bacteria may cause severe imbalance of the microbiota, leading to pathological and lethal effects.
The composition of bacteria isolated from the intestines thus potentially can contribute in describing the relation between the host intestinal immune system and the intestinal microbiota, and indirectly indicate the status of the overall health, growth, development, and performance. The GI microflora composition thus can serve as a measure for susceptibility of disease as an effect of weak secondary infections and/or triggered by environmental stress factors.
Within various groups of species, the microbiota changes more or less with the age of the host. 49 Humans have a relatively stable intestinal microbiota throughout adulthood,50,51 although higher numbers of enterobacteria and lower numbers of anaerobic bacteria, including bifidobacteria were reported in elderly people. 52 Comparing age-dependent effects revealed that sexually immature (juvenile) fish had a higher level of gut microbiota than elderly adult fish. Such an age-related difference in the composition of the intestinal microbiota has, to our knowledge, not previously been demonstrated in fish. The reason for this bias is not known. Lam et al. 53 demonstrated that zebrafish have a functionally developed immune system able to produce specific humoral and cellular immune responses from 4 to 6 weeks post fertilization. Zebrafish are considered sexually mature from 15 weeks post fertilization. The impact of age on the intestinal microbiota found in this study may hypothetically be explained by a higher level of sex hormones in adult zebrafish (>6 months) compared to juvenile zebrafish (<4 months). The immune system of the intestine may interact differently with the microbiota in juvenile and mature zebrafish.
The observed higher levels of total bacterial growth of samples from the posterior intestinal segment of zebrafish were in agreement with increased bacterial counts on tryptic soy agar (TSA) that has been seen from fore-gut to the hind-gut of farmed Atlantic salmon (Salmo salar L.). 54
Our experimental data show no gender differences in zebrafish intestinal microbiota. From a human fecal flora based study, higher levels of aerobic bacteria in males than in females was found. 55
The focus on gut microbiota diversity in zebrafish is based on the need for a better understanding of how the facility-specific water and diet influence the bacterial composition. The observed different levels of bacterial growth of tank water sample isolates might be related to either insufficient UV light exposure and/or by biofilm formation in aquarium pipes and filters. Lab B reported use of an old UV bulb during the period of samplings which may be related to the observed higher bacterial levels. Biofilms may supply an ideal bacterial community environment for transfer of different antibiotic resistance genes. 56 A similar tendency of a link between the zebrafish facility lineage and the microbiota composition was recently reported by Roeselers et al. 20
Relatively few P. damselae and Aeromonas spp. were found in the artemia feed samples, and the detection of C. testosteroni, O. anthropi, and P. luteola from dry feed underlines the importance of feed hygiene and a safety chain (from origin of the feed, via storage to feeding the fish). Moreover, all detected feed related isolates (except nonidentified fungi that did not grow from fish intestine) were closely linked with the microbiota of the zebrafish intestine. Our finding was in agreement with a report proposing animal feed as being one of the sources of microorganisms to animal gut floras. 57 Herein, storage and handling with long term and short term storage conditions of animal feeds should be of major concern.
Although no registered antibiotic usage among zebrafish facilities was reported, a variety of resistance patterns was observed in our study. Observed resistance to more than one class of antibiotics has been reported in a number of studies of fish pathogenic and aquaculture environmental bacteria.58–60 The lowest registered frequency of drug resistance in our study was against gentamicin which is not used among production animals in Norway. Transferable R-plasmids conferring resistance to various antimicrobials including tetracycline, sulfonamide, trimethoprim, and streptomycin associated with aquaculture were reported many years ago.61,62 Future zebrafish infection model studies should take into account the distribution of bacteria population and drug resistance profiles. In comparison with other aquatic environmental reports,63–65 sulfonamide/trimethoprim resistance was less frequent in our study. However, high resistance activity in Pseudomonas spp. might be linked with general activated efflux pump systems, 66 in particular observed in isolates from Lab B. Quinolone resistance (nalidixic acid and oxolinic acid) was low compared to other studies.59,65,67,68
The GI tract is a favorable ecologic niche for a large number of microorganisms, and as in other animal groups, a wide range of microbes colonize the GI tract of fish. 45 Information on the type of bacterial composition in the GI tract of fish is controversial 69 because of the methods applied. Here we present data from the zebrafish GI tract microbiota using conventional culture-based techniques, 6,8,40,70–73 although culture-independent methods are increasingly used for characterization of the GI microbiota of fish.19,54,74,75 The introduction of gnotobiotic zebrafish 18 offers an in vivo system for dissecting the interplay between the participating bacterial strains of the observed microbiotas and the host. The host factors seem to be similarly important when bacterial isolates establish in the gnotobiotic zebrafish intestine as in the gnotobiotic mouse intestine. By using conventional methods, we have managed to establish a first report on the diversity of culturable bacteria in the zebrafish intestinal microbiota among different research facilities. The observation of different levels of the various groups/species of bacteria and variation in drug resistance profiles between facilities makes a follow-up study based on culture independent methods interesting in order to determine the variations in nonculturable bacteria.
In conclusion, this study suggests that variations in facility management routines affect the numbers of bacteria and the composition of the GI tract microbiota and drug resistance profile. Based on this, we propose that a simplified culturable microbiota protocol could be introduced which would indicate fish health and facility standard in accordance to a sound management practice for zebrafish facilities. More research on the relation between the intestinal microbiota and the health/disease status in zebrafish facilities are necessary to further verify the usefulness of such a protocol.
Footnotes
Acknowledgments
The Norwegian Zebrafish Platform and ZNN have support from the RCN FUGE Program Grant 183344/S10. The authors thank Duncan Colquhoun for his assistance in reviewing the article. The authors also acknowledge the statistical assistance of Camilla Kielland.
LC contributed the ideas for the establishment of the collaborations, design, data collection, performed the sampling and all traditional bacterial culturing, molecular genetic studies, statistical data analysis, and drafting and writing of the manuscript. JR contributed to the establishment of the collaborations, design, data collection, drafting and writing the manuscript. PA contributed to funding, design, acquisition of the fish, and writing the manuscript. HS contributed to acquisition of funds, design, the supervision, drafting and writing the manuscript.
Disclosure Statement
No competing financial interests exist.