
Abstract
Abstract
Behavioral tests of hearing in fish are relatively rare and are generally based upon aversive conditioning, with little data available for the positive reinforcement methods common in other vertebrates. Despite its increasing importance as an auditory model, no behavioral hearing measures have been conducted on zebrafish (Danio rerio), with only physiological hearing estimates available. In the current study, a new behavioral testing paradigm is developed to assess sound detection abilities of zebrafish and the effect of training frequency on hearing sensitivity. Zebrafish were trained to respond to either a 400 Hz or a 1000 Hz tone, and behavioral thresholds were then measured to tones from 200 to 1000 Hz. Significant threshold differences existed between the behavioral audiograms, with fish from each set most sensitive to their conditioned frequency. Furthermore, fish acoustically conditioned to 1000 Hz were most sensitive to the upper range of test frequencies (600–1000 Hz). This appears to be the first study utilizing a positive reinforcement behavioral assay for testing hearing in zebrafish and provides further evidence of fine-scale auditory filtering in fish.
Introduction
In light of their increasing importance in biomedical research,16–18 and the increasing number of identified auditory mutants,19–21 zebrafish (Danio rerio) represent an ideal model for studying vertebrate hearing. Zebrafish belong to the Ostariophysi, a group of fish well studied for their sensitive hearing over a broad range of frequencies.1,2 Despite the enormous potential of zebrafish for auditory research, however, only two studies exist that quantify their physiological hearing thresholds,22,23 and none exist that investigate behavioral hearing thresholds, although there is one careful study demonstrating their behavioral startle thresholds. 24 Given the fact that physiological thresholds typically overestimate behavioral abilities,8,25, 26,27 it is critical to obtain a behavioral audiogram to develop a more accurate assessment of hearing in this species. Such an assay would allow comparative analyses for assessment of functional deficits in selected auditory mutants.
In the current study, we employed positive behavioral methods to elucidate the sound detection abilities of zebrafish. The specific aims of the current study were to 1) develop behavioral audiograms of zebrafish, 2) assess frequency specificity, and 3) determine the plasticity of behavioral responses of zebrafish in response to different acoustic training stimuli. By varying the training stimuli, we were able to assess the degree of auditory filtering/generalization in zebrafish and to determine the influence of training stimuli on auditory thresholds. Also, while protocols are common for training other vertebrates to respond to sound in a positive reward setting (see Refs. 28–30 for reviews), these experiments are rare for fish. Thus the current study is also a significant step forward in the assessment of behavioral hearing thresholds among fish in general, and zebrafish in particular, using a free-choice operant paradigm.
Methods
Fish maintenance
Zebrafish were supplied by a local commercial fish store. For each frequency tested (see below), 5 fish were used in a group and ranged in size from 28 to 36 mm. At this size the zebrafish auditory system is fully developed, in terms of both morphology and function. 23 Fish were housed in a 37.9 L tank within a sound-attenuating chamber and maintained at 28°C. Fish were subjected to a 12:12 light:dark cycle; the water filter was turned off for 8 h each day during training/testing to prevent ambient noises produced by the filter from masking the sound stimuli. All animal use was approved by University of Windsor Animal Care Committee following guidelines implemented by the Canadian Council for Animal Care (CCAC).
Behavioral conditioning: Experimental design
The perimeter of the housing tank was covered by black plastic to reduce visual stimuli. Fish were filmed during conditioning and testing trials using a diagonally-slanted mirror placed above the tank (Fig. 1). To quantify zebrafish distribution during trials, two lines were drawn underneath the tank, subdividing it into three equal sections (referred to hereafter as bins).

Schematic representation of the tank used during behavioral conditioning and auditory testing trials. A food slurry was introduced through the syringe labeled “food” in the diagram after the onset of an acoustic stimulus, which was delivered through a speaker positioned outside the tank in which fish were housed. A positive response to sound stimuli was assessed by movement of fish into, and aggregation in, Bin I. Most fish initiated trials in Bin III presumably due to the presence of a heater in this bin. Consequently, hydrophone measurements of sound took place in Bin III.
A 10 mL syringe was positioned at one end of the tank (Fig. 1) for introduction of a food slurry (5 mL dechlorinated water with small flakes [TetraMin®] mixed in). At the same end as the syringe, a computer speaker (Altec Lansing Technologies Inc, San Diego, CA) was positioned directly adjacent to the tank, through which the sound stimuli were played. The speaker was placed in the air, not in contact with the tank, in an attempt to reduce the particle motion of the sound delivered to the fish and to reduce the role of lateral line detection in the current experiment. 31 The speaker was attached to an attenuator (Model # EC6070, Reson Inc, Slangerup, Denmark) so that the sound intensity level of the stimuli could be reduced in defined amounts. The attenuator was in turn connected to a laptop computer with Adobe Audition 1.5 (Adobe Systems Incorporated), through which the sound stimuli were designed and played back to the fish.
Behavioral conditioning and auditory testing
The initial conditioning stimulus was a 400 Hz tone burst at a sound pressure level of 150 dB re 1 μPa, measured through a hydrophone (InterOcean Acoustics Model #902, San Diego CA) in Bin III of the test tank. This stimulus intensity corresponds to a particle acceleration of approximately 0.038 m s−2 as measured by a Brüel & Kjær triaxial accelerometer (type 4524 modified for use underwater). These parameters were chosen as they lie well within the physiologically determined auditory bandwidth of zebrafish. 22 All measurements of sound stimuli took place in Bin III of the tank, as it was determined through a series of pilot studies to be consistently occupied by fish at the time of sound initiation, presumably due to proximity to the heater. Measurements were taken in this manner in an attempt to calibrate precisely the sound stimulus detected by the fish, which is oftentimes problematic in behavioral studies of teleost audition due to the aberrant movement of fish in the tank.25,32 The purpose of the training regime was for zebrafish to associate the sound stimulus with a food reward. Training was accomplished by releasing the 5 mL food slurry contained in the feeding syringe exactly 15 sec following initiation of the tone burst.
Zebrafish were video-recorded for 5 min before and 5 min after the presentation of sound to quantify their behavior and distribution in the tank. At the end of each 10 min trial, the remaining food contents were siphoned from the tank to avoid satiation and to preserve motivation of fish for the upcoming trial. Another 5 mL of food slurry was added to the feeding syringe at this time in preparation for the next trial. Trials were performed three times daily, with inter-trial time ranging from 2–3 hours, for 3 consecutive weeks. Zebrafish were considered to be successfully trained when they aggregated beneath the feeding syringe for 15 sec following initiation of the training stimulus; this behavior was only ever observed when sound was present. If zebrafish did not display the appropriate response to the training stimulus, they received no food reward.
The hearing experiment began after training was complete with attenuation of the 400 Hz stimulus. Sound level was decreased in steps until reaching a level that did not elicit the appropriate response (i.e., aggregation in Bin I for 15 sec). This level was presented to the fish for three consecutive trials to confirm unresponsiveness. At this point, the last level of stimulus intensity to have demonstrated a clear conditioned response was presented to the fish for an additional three trials. If correct responses were observed during all of these trials, then hearing threshold was judged to have been detected. The same procedure was repeated at 200, 600, 800, and 1000 Hz to develop the behavioral audiogram.
Analysis of frequency discrimination
Upon completion of behavioral training and testing of the initial zebrafish set, a second behavioral audiogram was obtained from a novel group of zebrafish following the same training method described above. The second set of fish, however, was acoustically conditioned to a 1000 Hz tone burst at the same intensity level as the original 400 Hz conditioned stimulus. This stimulus intensity corresponds to a particle acceleration of approximately 0.027 m s−2. Again, these parameters were chosen as they were both previously determined to lie well within the hearing range of zebrafish. 22 Moreover, the frequency separation between 400 and 1000 Hz is great, so any difference in shape between the two behavioral audiograms resulting from frequency discrimination would be clearly definable. The audiogram obtained after 1000 Hz conditioning was therefore compared to the audiogram obtained after 400 Hz conditioning in terms of differences in sensitivity, particularly at the conditioned stimuli. The audiogram comparison was then used to assess whether zebrafish were capable of discriminating among frequencies.
Data analysis
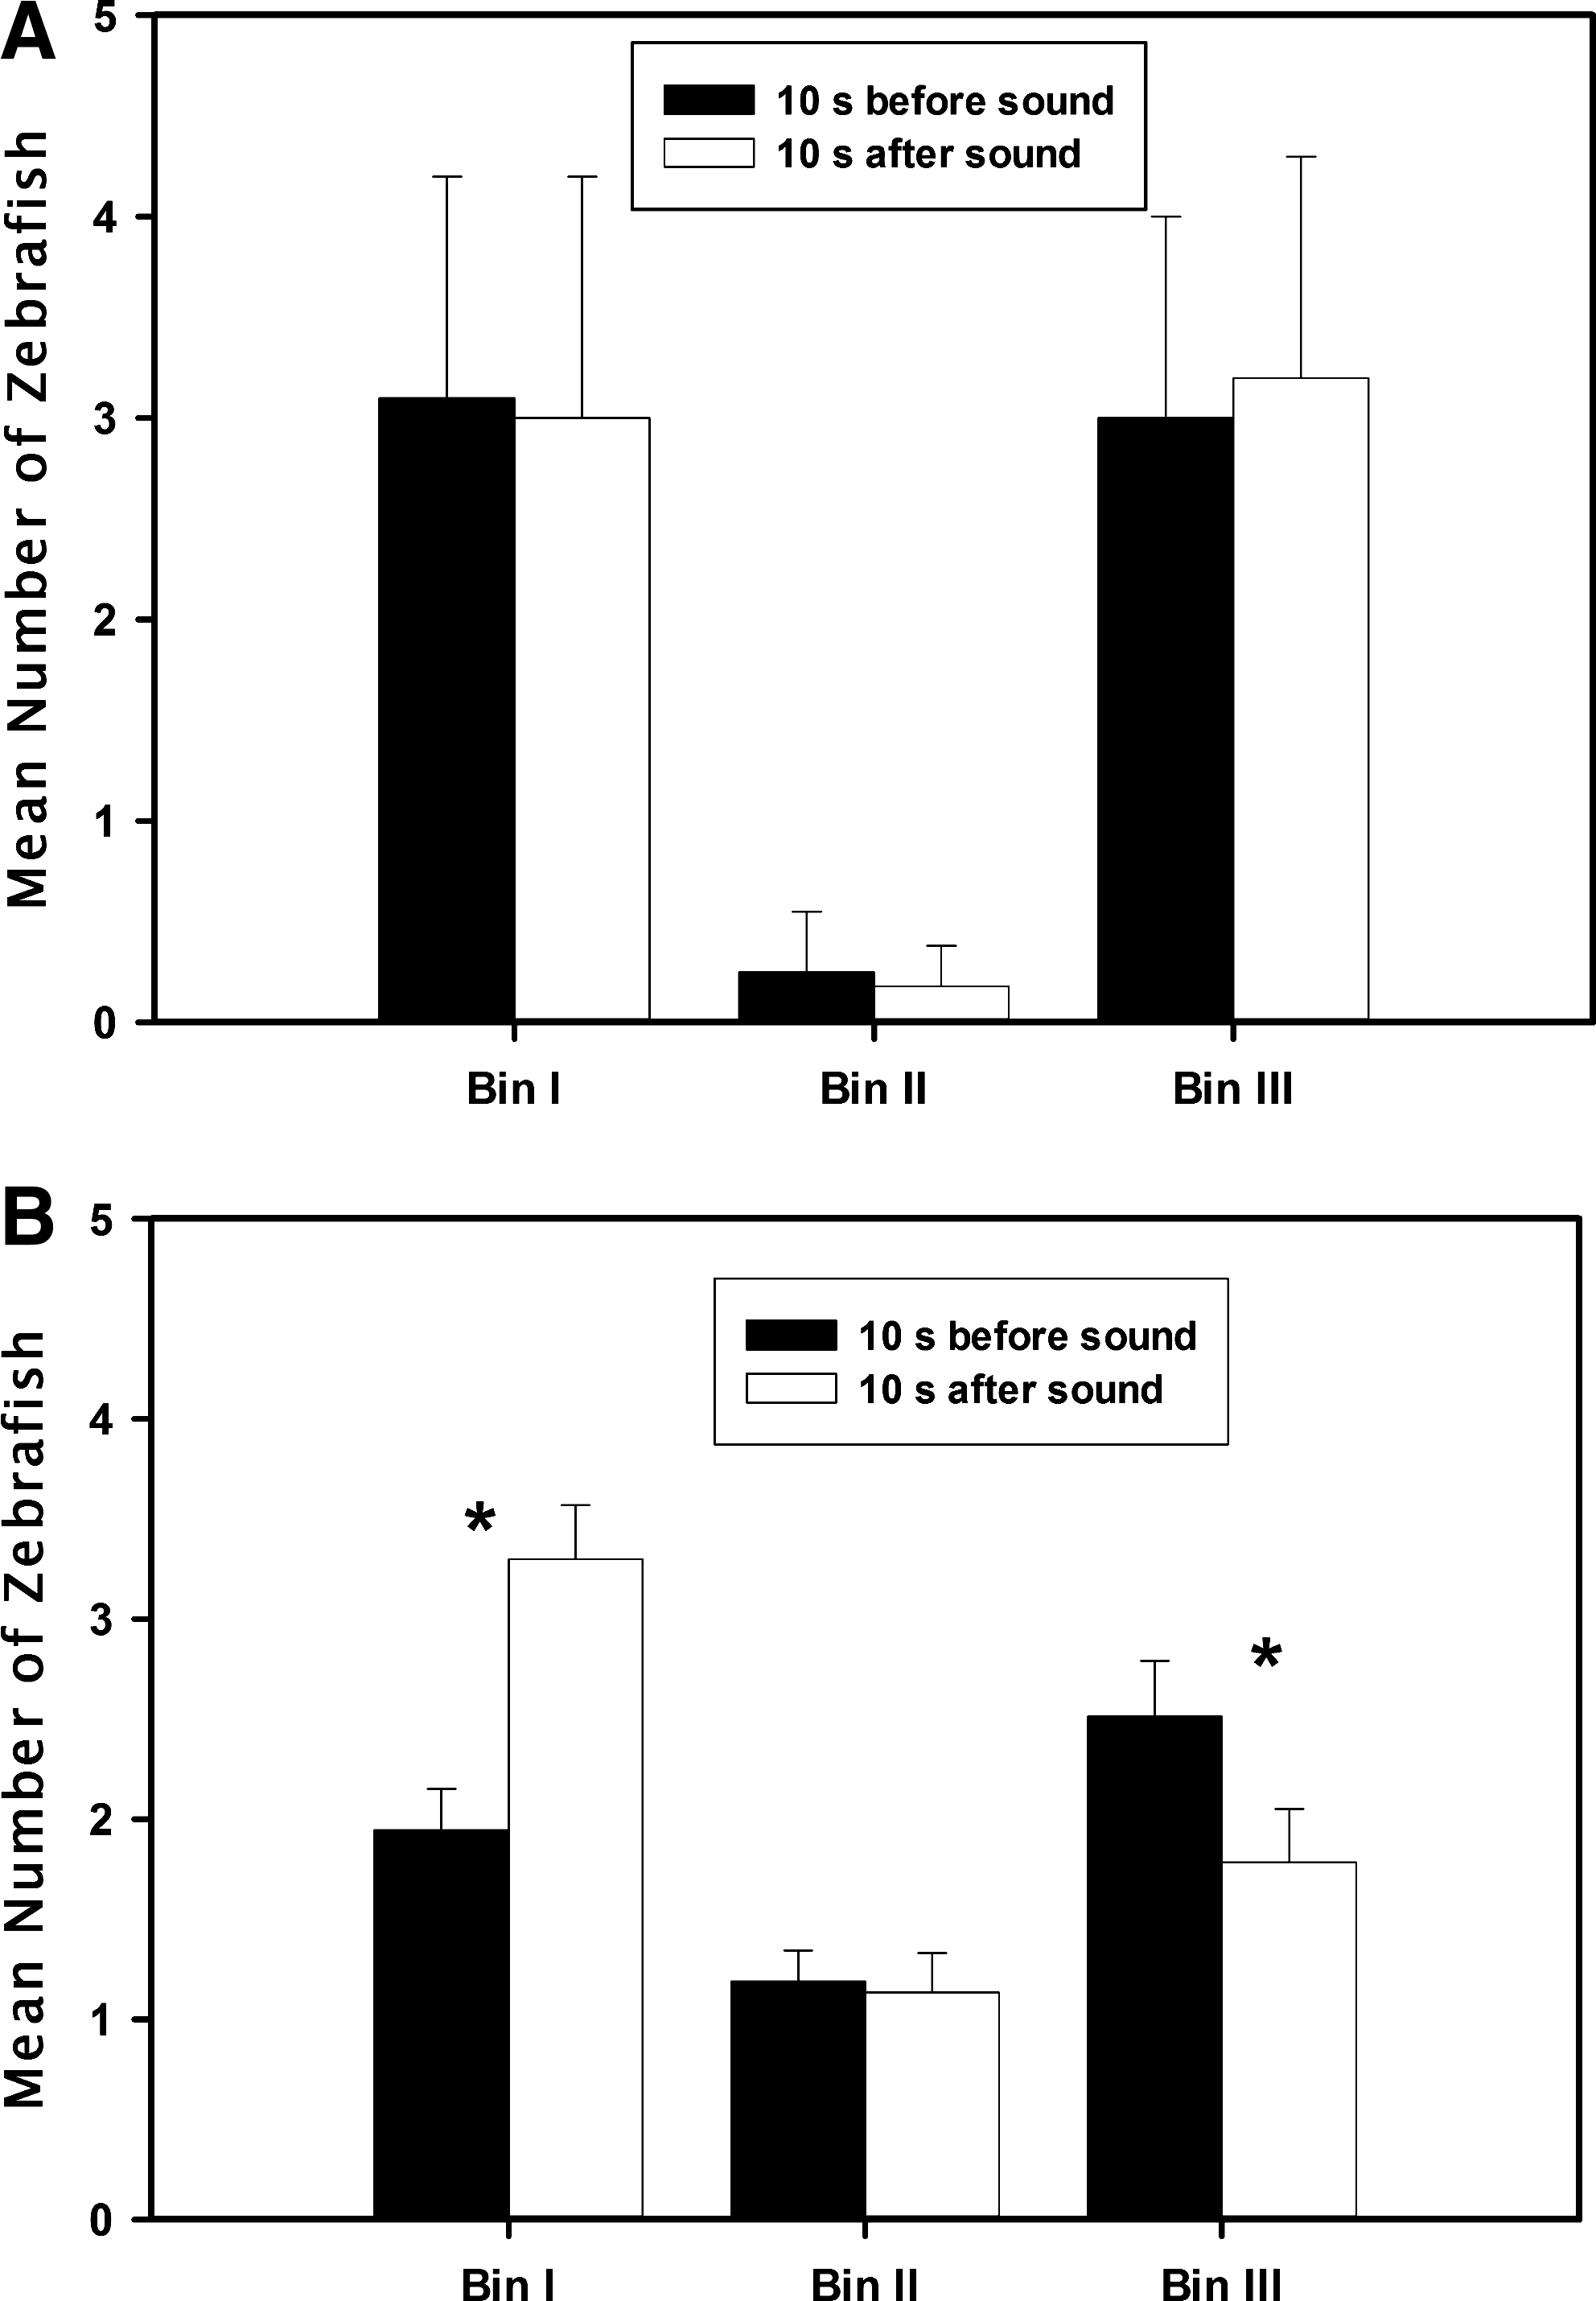
Statistical analyses were performed using Systat software (Point Richmond, CA). For all tests, the alpha level was set to 0.05, except for comparisons of thresholds between the two behavioral audiograms, in which a Bonferroni correction was used to determine significance values. Paired sample t-tests were used to assess differences in mean number of zebrafish in Bin I 10 sec before and after sound was played during both the initial and final weeks of training.
Behavioral hearing threshold values were derived from plots of responsiveness versus sound intensity for each frequency tested. Responsiveness was measured as the mean increase in number of zebrafish in Bin I 10 sec following sound initiation (i.e., a responsiveness score of one indicates that one fish, on average, came to Bin I 10 sec after sound presentation). For each frequency, several plots were generated, each one representing the sound intensities tested for a given week. The lowest intensity level to yield a responsiveness score of one or higher was accepted as threshold. Thresholds from each plot were then averaged to determine the mean quantitative threshold value for the frequency of interest. Comparison of behavioral audiograms was accomplished using a 2-way ANOVA with training frequency and test frequency as main effects, followed by a Bonferroni post hoc test when significant differences were found. Assessment of the effects of frequency on behavioral hearing thresholds was done using single factor ANOVAs for each behavioral audiogram. Paired sample t-tests were then used to compare threshold differences across similar frequencies between the behavioral audiograms. It was necessary to remove the effects of repeated statistical testing (paired sample t-tests for four separate frequencies) on the same subjects, which serve to increase the likelihood of Type I error. 33 Therefore, thresholds were considered to be statistically different when p<0.017 (alpha=0.05 divided by three [n-1] to account for the Bonferroni correction).
Results
In the initial week of training, there was no significant difference (p=0.942, t=0.074) in the distribution of zebrafish in Bin I before and after sound presentation (Fig. 2A). In the final week of training, however, significantly more fish (p<0.01, t=4.162) were found in Bin I 10 sec after sound than 10 sec before sound presentation, with a concomitant decrease in the number of fish in Bin III after sound onset (Fig. 2B) as the fish swam toward the feeding zone once they were trained.
Conditioning responses of zebrafish during
Zebrafish responsiveness to the series of frequencies tested followed a general pattern in which fish were highly responsive to high sound intensities, and this response level was maintained before declining abruptly at lower sound amplitudes (Fig. 3). In response to changing stimulus intensities, zebrafish exhibited discrete on/off patterns as opposed to graded losses of responsiveness (Fig. 3), at least over the 5 dB step size in the current experiments. Response measures overall were lower at low test frequencies (Fig. 3A) than high test frequencies (Fig. 3B), even at similar sound amplitudes.
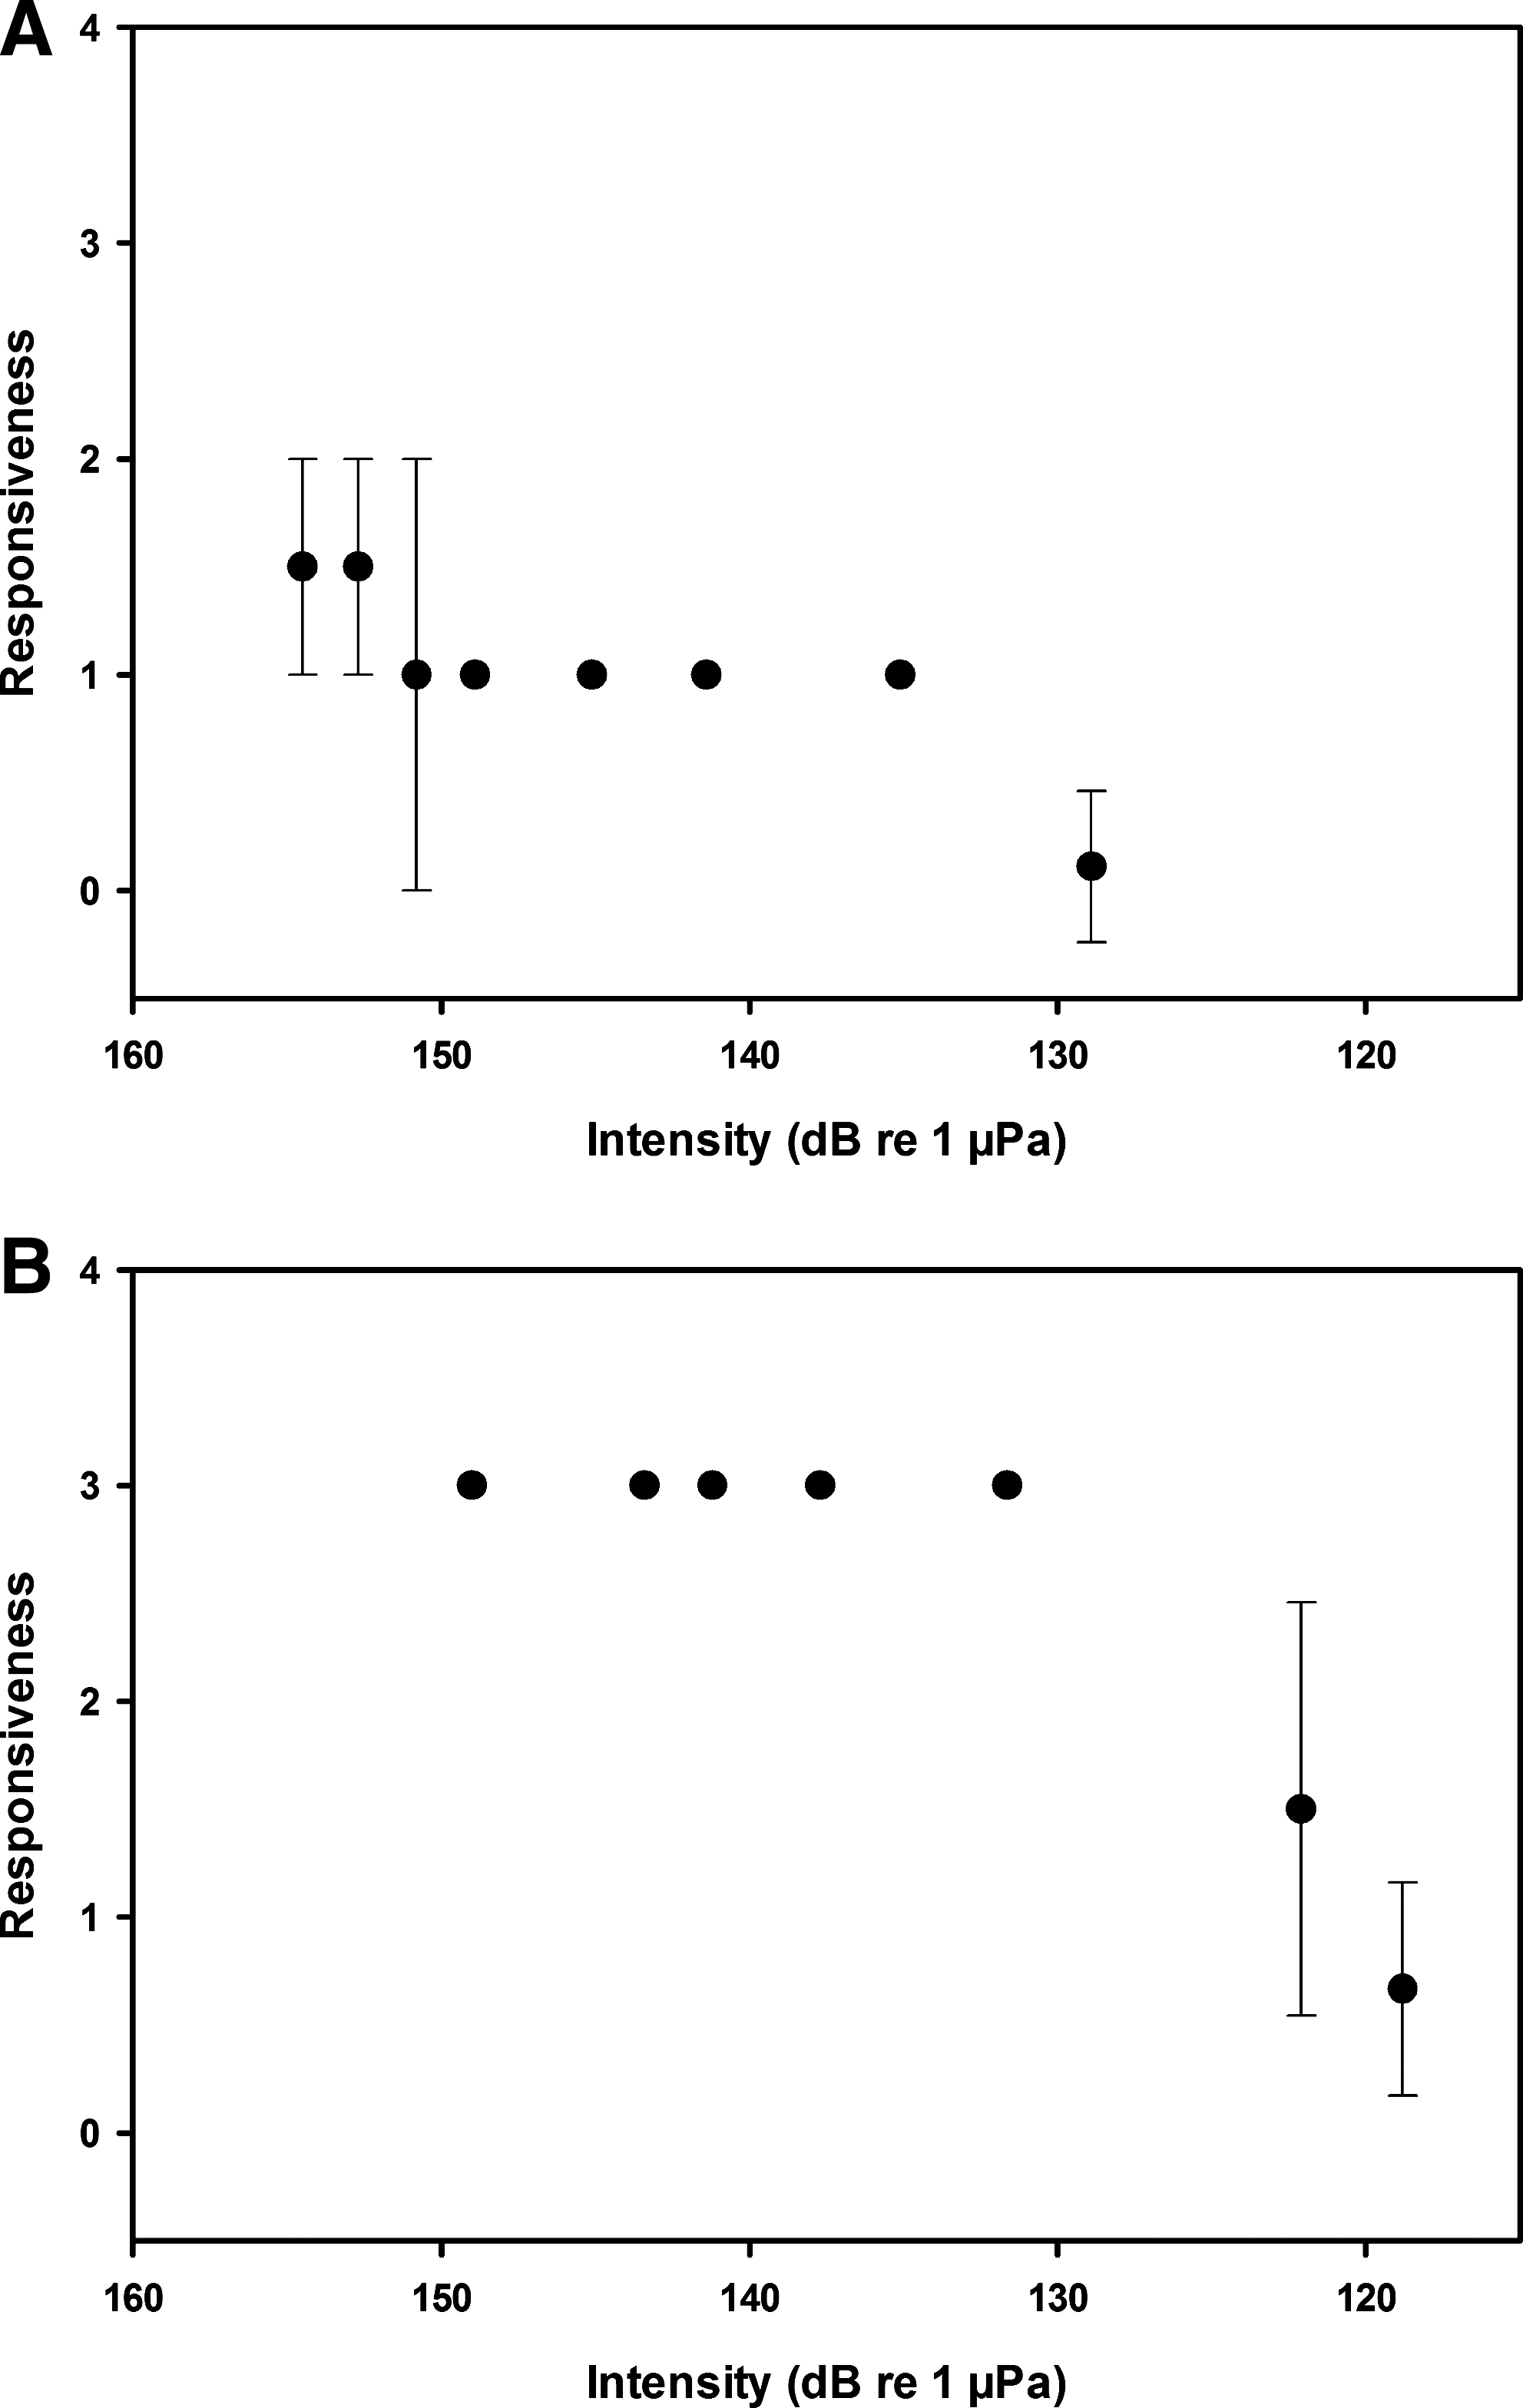
Mean responsiveness (±1 S.E.) of zebrafish to descending sound intensity levels at
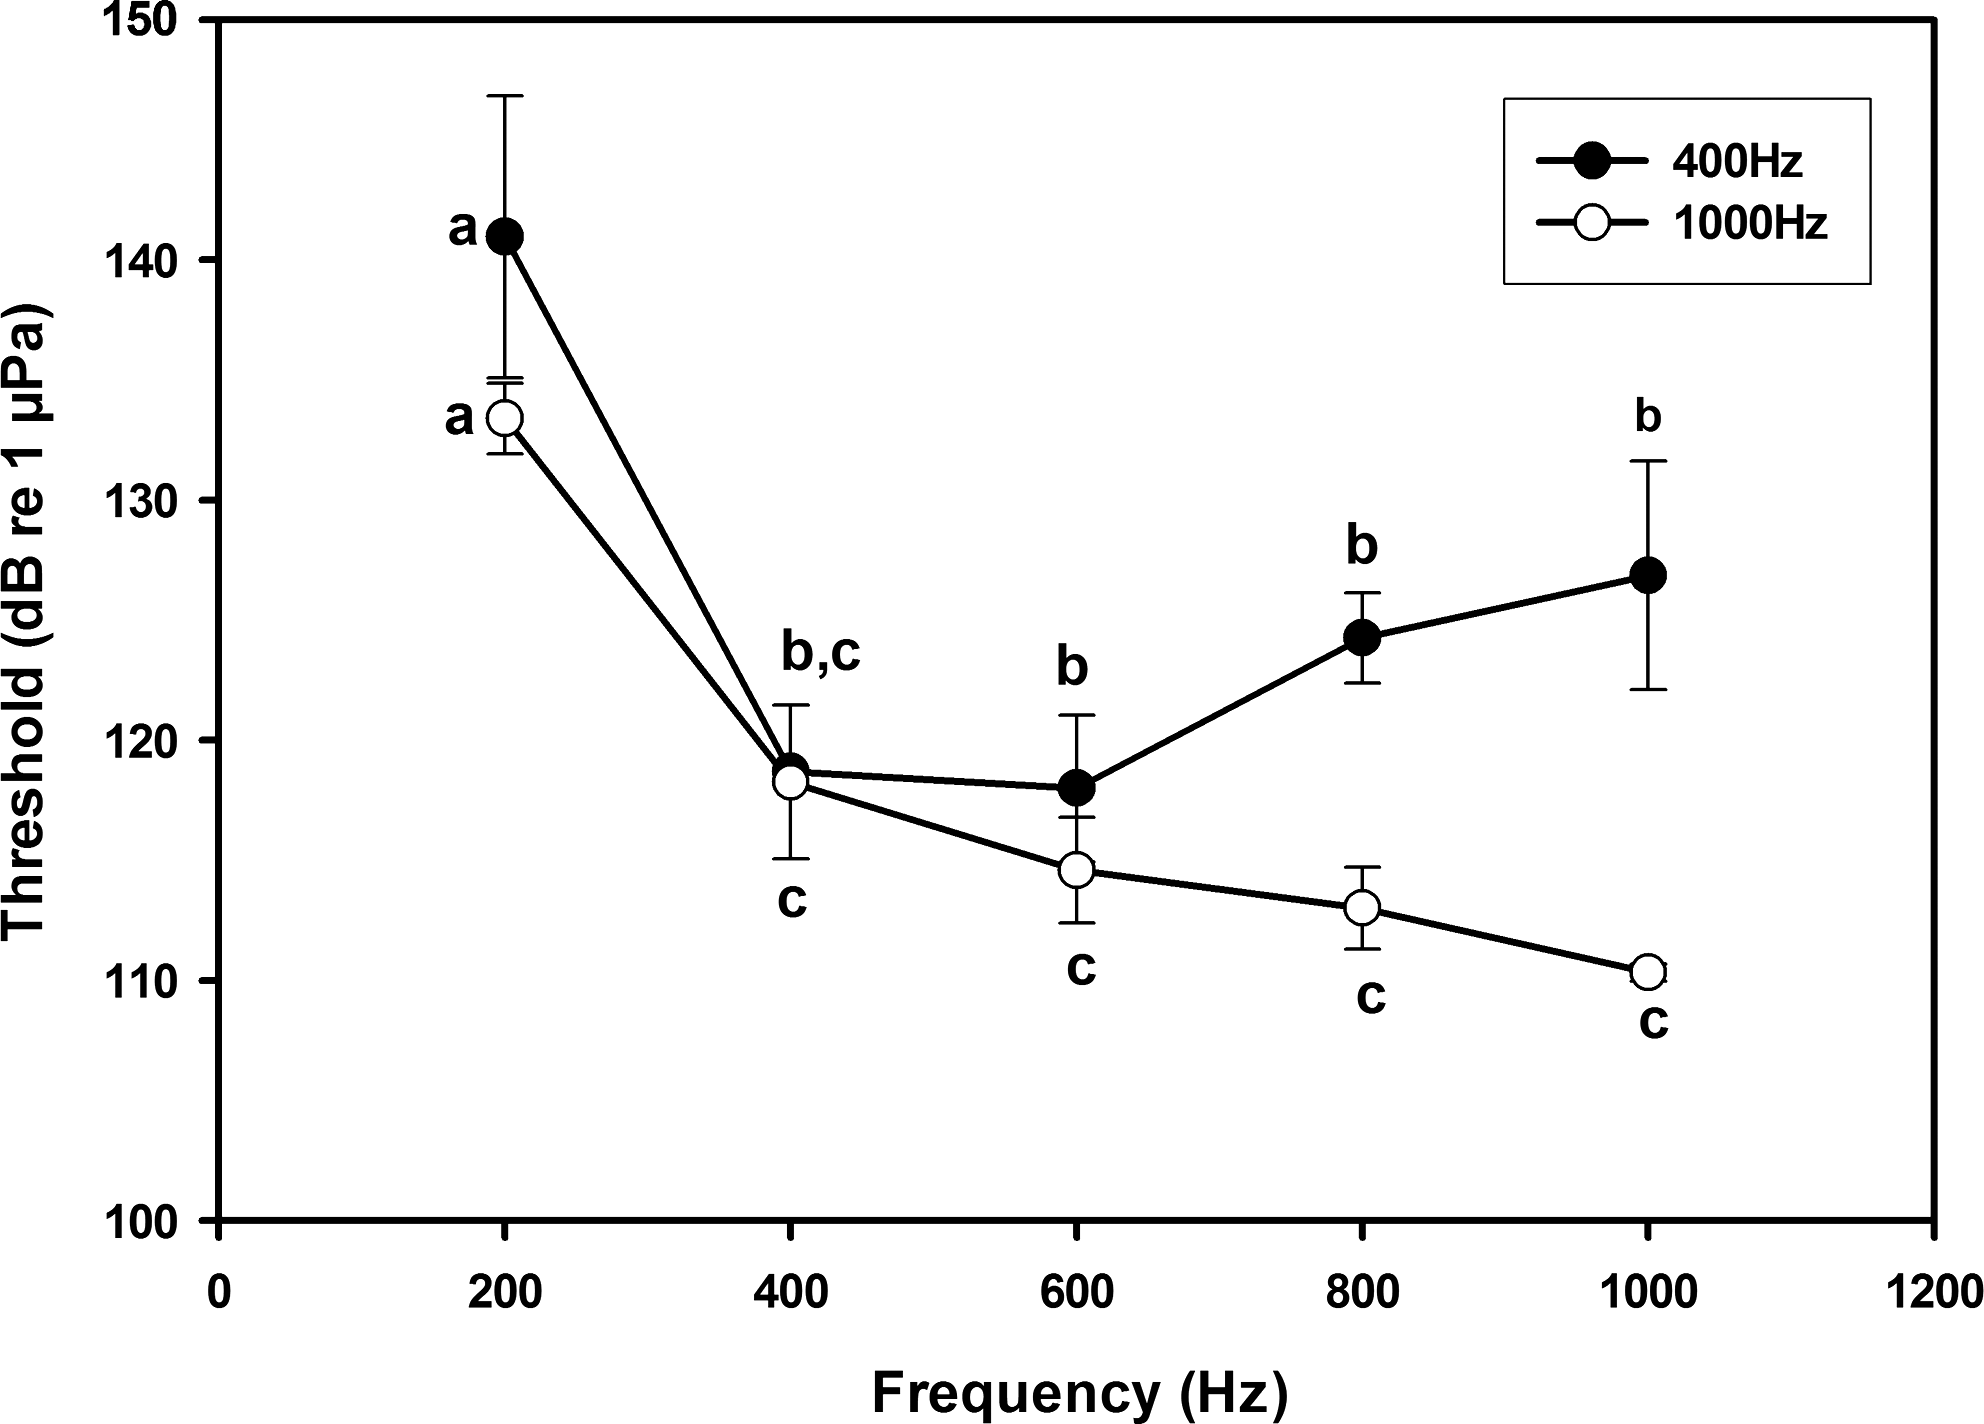
There was a significant effect of test frequency on hearing thresholds (p<0.01) for those fish trained to a 400 Hz stimulus (Fig. 4). Zebrafish were least sensitive to 200 Hz but sensitivity increased (threshold decreased) at higher test frequencies. There was no significant difference between the remaining frequencies after Bonferroni correction but thresholds for 400 and 600 Hz appeared to be lowest, with threshold increasing at higher frequencies. At 400 and 600 Hz, the mean threshold was approximately 118 dB re 1 μPa while at 800 and 1000 Hz mean threshold was around 123 dB re 1 μPa.

Behavioral audiograms (mean±1 S.E.) of zebrafish produced through acoustic conditioning to 400 Hz tone burst. There was a significant effect of frequency on hearing thresholds (p<0.01), with 400 and 600 Hz identified as the most sensitive frequencies.
Hearing thresholds differed statistically between behavioral audiograms of zebrafish conditioned with the different frequencies (Fig. 5; p<0.01). There was a significant effect of training frequency on hearing thresholds (p<0.01), as well as an interaction between test frequencies and training frequency in determining threshold values (p<0.01), indicating that training frequency affected frequency of best sensitivity. Specifically, when trained to 1000 Hz, the zebrafish behavioral audiogram was shifted towards enhanced high frequency sensitivity. When trained to a 1000 Hz tone, zebrafish were more sensitive at 600 Hz (p=0.009; t=3.659), 800 Hz (p<0.01; t=5.123), and 1000 Hz (p<0.01; t=6.915) than when trained to a 400 Hz tone (Fig. 5). Thresholds did not differ between the two behavioral audiograms at 200 Hz or 400 Hz (p=0.940; t=0.078).
Behavioral audiograms (mean±1 S.E.) of zebrafish produced through conditioning to 400 Hz (filled circles) and 1000 Hz (open circles) tone bursts. Overall, there was a significant effect of frequency (p<0.01) and training frequency (p<0.01) on hearing thresholds, as well as an interaction between test and training frequencies in determining thresholds (p<0.01). Hearing thresholds at 600 Hz (p=0.009), 800 Hz (p<0.01), and 1000 Hz (p<0.01) were lower in zebrafish conditioned using a 1000 Hz tone burst than those in fish conditioned using 400 Hz.
Discussion
The results here demonstrate that zebrafish formed an effective association between an acoustically conditioned stimulus and a food reward. Moreover, this study is the first to provide a behavioral description of zebrafish hearing abilities, as prior research has focused on a physiological characterization of their audition.22,23 Further, we show that behavioral audiograms are highly dependent upon the training frequency used, suggesting caution should be used when interpreting audiograms obtained through behavioral measures in any species. Finally, we also show some degree of frequency discrimination and learning-related plasticity in zebrafish, providing further evidence of sophisticated auditory processing in teleost fish.
The two behavioral audiograms generated in the current study exhibited best sensitivity at the conditioned frequencies, while the known physiological audiogram for zebrafish shows 800 Hz to be the best frequency. 22 The discrepancy in audiogram shape between behavioral and physiological approaches is likely the result of a sensory bias towards the conditioned stimulus in behavioral studies and may indicate that the zebrafish central nervous system is capable of undergoing learning-related changes in neural plasticity. 34 A similar phenomenon exists in goldfish, a fellow representative of the ostariophysine group of fish. Previous behavioral research (see, for example, Refs. 31 and 35) has shown a best sensitivity in goldfish of 500 Hz when trained to a 500 Hz stimulus; yet, several physiological investigations have repeatedly identified 800 Hz as the most sensitive point on the goldfish audiogram.22,36,37 This sensory biasing in behavioral studies likely arises from neural mechanisms that serve to integrate incoming sounds with stored acoustic memories that hold significance,38,39 such as those indicating food rewards. This phenomenon in which current auditory inputs interact with stored memories of preceding events involving the auditory stimulus is a fundamental component of acoustic processing,6,40 and is referred to as auditory sensory memory. 38 Auditory sensory memory may explain why fish behaviorally conditioned to single tone bursts show high behavioral sensitivity to the training stimulus but lack similar physiological responses. The downstream neural events triggering enhanced responsiveness to the integrated auditory information are not detected during physiological testing 40 and thus are not incorporated into physiological thresholds. This level of cognitive complexity has previously been thought to be restricted to higher vertebrates and has only recently been evaluated in fish.34,39,41,42 To avoid the training effects that can accompany behavioral measures of audition then, future positive reward studies might consider conditioning subjects to the series of tone bursts they wish to test, which would remove overexposure to a single stimulus.
It is possible that the responses obtained in the current experiment may be partially due to lateral line, as well as auditory, inputs due to the nature of sound travel in tanks. 43 By testing frequencies well above the best sensitivity of neuromasts 44 and using an airborne speaker to reduce particle motion, we feel we reduced lateral line inputs in the current study; but it is not possible to completely eliminate near-field particle stimulation in a tank setup. It is likely that any study of fish acoustic responses in a laboratory setting will involve some degree of near-field particle motion and, since both auditory and lateral line hair cells are motion detectors, both may potentially be stimulated by “acoustic” stimuli. 44 Future studies may consider testing acoustic responses with and without lateral line ablation but full ablation can be problematic in fish. 45
The difference in hearing thresholds between the behavioral audiograms also provides evidence for the ability of zebrafish to discriminate between different frequency components of acoustic signals. The separate sets of behaviorally conditioned fish in this study did not differ significantly in their sensitivity to 400 Hz, but did differ significantly in hearing thresholds at 1000 Hz. Furthermore, fish behaviorally conditioned to 400 Hz were most sensitive to this frequency. Our results showing the increased response magnitude of separate sets of zebrafish to their conditioned stimulus shows that zebrafish are able to perceive differences between training and test frequencies, similar to what has been demonstrated in goldfish using aversive conditioning paradigms.4,6,46 The ability of zebrafish to discriminate between tone bursts of different frequencies is further demonstrated by the significant interaction that was found between training frequency and test frequencies in determining thresholds. Fish trained to 1000 Hz showed greatest sensitivity at 1000 Hz but also demonstrated higher sensitivity to the upper range of frequencies tested, relative to fish conditioned to 400 Hz. This is probably due to increased stimulus generalization at higher frequencies in fish, with enhanced specificity to lower frequency tones.4,6,46 While it still remains unclear how fish perform frequency analysis,6,13,47 the current study contributes to the mounting evidence that fish can distinguish sinusoids of differing frequency and must have at least a broadly tuned acoustic filter, probably at the level of the CNS rather than the auditory epithelium. 46 This form of auditory processing is shared with other vertebrates,5,24,48 and may represent the basal condition from which vertebrate auditory processing has evolved.6,13,34
In summary, the current study is the first to provide behavioral hearing thresholds for the zebrafish, an important model system for various aspects of vertebrate biology, and presents a new method using positive reinforcement for testing thresholds across fish. Studies investigating vertebrate hearing deficits using zebrafish models can use these behaviorally-corrected auditory thresholds to perform fine-scale analyses by identifying selective, as opposed to absolute, hearing mutants. Last, the differential sensitivity seen among the two behavioral audiograms adds to the current evidence for frequency discrimination and generalization abilities in fish, shedding new light on an aspect of auditory processing in fish that presently remains elusive.
Footnotes
Acknowledgments
The authors gratefully acknowledge the contributions of two anonymous reviewers. The work was funded through a Natural Science and Engineering Research Council Discovery grant to DMH.
Disclosure Statement
No competing financial interests exist.