
Abstract
Abstract
ZeBase is an open-source relational database for zebrafish inventory. It is designed for the recording of genetic, breeding, and survival information of fish lines maintained in a single- or multi-laboratory environment. Users can easily access ZeBase through standard web-browsers anywhere on a network. Convenient search and reporting functions are available to facilitate routine inventory work; such functions can also be automated by simple scripting. Optional barcode generation and scanning are also built-in for easy access to the information related to any fish. Further information of the database and an example implementation can be found at http://zebase.bio.purdue.edu
Introduction
One solution to this problem is the use of a computer database. To date, there are a few available databases designed for zebrafish facilities. One such database is designed by the University of Oregon (https://azraelwiki.zfin.org/display/prot/Tracking+Zebrafish+with+a+Database).
This database is built on FileMaker Pro, which can operate on either Macintosh or Windows platforms. It is comprised of three tables that keep track of containers and information pertaining to strains and crosses. The program is also capable of printing labels and generating reports quarterly and annually. Two other companies, Aquatic Habitats and INTAVIS Bioanalytical Instruments, have designed proprietary turnkey solutions. The FinCensus (http://aquatichabitats.com/fincensus/), developed by Aquatic Habitats, runs on Windows XP. It provides the capability to keep track of tanks, mutations, and employee information. It also has a barcode system that offers access to several commonly used functions, such as creating stock records for fish, crosses, squeezes, tank exchanges, and reporting dead fish. INTAVIS Bioanalytical Instruments offers a database called Animal Management System (AMS) (http://www.intavis.com/en/News/2010/AMS.php). This software is designed to monitor and maintain one or more fish facilities and has the capability to keep track of the information pertaining to tanks, fish stocks, and users. There are two unique features of this software. First, it has an additional table that keeps track of the plasmid constructs that are used to generate transgenic fish. Second, there is a ‘Tasks' function, which is essentially a reminder of daily/monthly tasks such as evaluating water quality parameters. However, all these databases are built on commercial software and/or are completely proprietary which can be costly to implement in research laboratories running on a tight budget. For example, the database from the University of Oregon is built on FileMaker Pro, which is a commercial software. Even though a database created in FileMaker Pro can be built as a standalone version (runtime solution) that does not require FileMaker Pro to run, this is not the current implementation of the zebrafish database designed by the University of Oregon. One still has to have access to FileMaker Pro to create such runtime solution. Also, once packaged as a runtime solution, the structure of the database cannot be modified. For FinCensus and AMS, both are closed systems, so any modifications or new developments are highly dependent on the company.
In view of these limitations, our group has designed Zebrafish Database (ZeBase), a relational database based on open-source software including MySQL and PHP for single- or multi-laboratory environments. ZeBase is equipped with a variety of essential functions, which are implemented in a user-friendly cross-platform web interface, for zebrafish record keeping and searching. It has built-in reporting functions that can efficiently provide summaries of essential survival numbers to fulfil reporting requirements of the Institutional Animal Care and Use Committees (IACUC). The report generation can also be automated if necessary. A barcode system is built into the database as an option and barcodes can be printed on labels, which aids in inventory checking through the use of a hand-held barcode scanner. We have been developing and running ZeBase in our facility for more than 2 years, which has substantially streamlined our routine operations. The installer, source code, database tables, as well as an example implementation of the database, are available at http://zebase.bio.purdue.edu
Results and Discussion
Overview of ZeBase
The main window of ZeBase is shown in Figure 1. The major functions are grouped under five tabs at the top: Quick Stats, My Lab Fish, Search, Settings, and Scheduled Reports (Fig. 1, arrow 1), with the text for the currently selected tab highlighted in orange. All fields used in the database are defined in Supplementary File S1 (Supplementary Material is available online at www.libertonline.com/zeb), and some essential ones are discussed below.

The main window of ZeBase. Along the top of the screen are five tabs (arrow 1) that correspond to the five major functions of ZeBase with Quick Stats tab selected by default. The three sub-tabs on the left (arrow 2) can be used to show additional survival information (see Fig. 2 and descriptions in text for details).
Quick Stats Tab
Under the Quick Stats tab are three sub-tabs on the left column: Overall Stats, Track Survival, and Current Survival (Fig. 1, arrow 2). The Overall Stats sub-tab shows the total adult fish count (Current Fish Count) and larval fish count (Current Nursery Count) in a facility.
Track Survival
Batch number, a unique numerical identifier, is assigned to each new clutch of fish added to the system. The Track Survival sub-tab displays the survival information for all batches of fish at a given point in time, regardless of laboratory affiliation and whether the fish are currently alive or dead. The table can be sorted by any field in ascending or descending order by clicking on the field title. It is also possible to select survival information for a particular month/year by using the ‘Show by Month’ drop-down menu (Fig. 2A, arrow 1). In addition, the corresponding data can be exported to a comma-separated values (CSV) file or printed by clicking on the Excel or printer icon respectively (Fig. 2A, arrow 2).

The Track Survival and Current Survival sub-tabs under the Quick Stats tab.
Current Survival
The Current Survival sub-tab (Fig. 2B) displays survival information for all batches of fish that are currently alive, regardless of laboratory affiliation. This table can also be sorted by any field in ascending or descending order by clicking on the field title, and the corresponding data can be exported to a comma-separated values (CSV) file or printed as described above.
My Lab Fish Tab
The My Lab Fish tab shows all alive batches of fish that are possessed by the laboratory that the logged-in user belongs to (Fig. 3A). The ‘Add Batch’ icon (Fig. 3A, arrow 1), is used for adding all vital information pertaining to a new batch of fish in a new pop-up window (See the following paragraph for further discussion). Right next to it is the ‘All Fish’ icon (Fig. 3A, arrow 2), which is used to display all alive batches of fish in a facility regardless of laboratory affiliation in a new pop-up window. On the far right is the ‘Scan Mode’ icon (Fig. 3A, arrow 3), which can activate the optional scanner mode function for a quick retrieval of information for any batch by scanning the unique barcode. Barcodes are generated and printed on the labels that can be attached to the corresponding tank(s) (See the following paragraph for further discussion). To the left of each entry of the table are three icons (Fig. 3A, arrow 4) for deleting (red X), editing (pencil; also see next paragraph), and showing additional genotype information (magnifying glass).
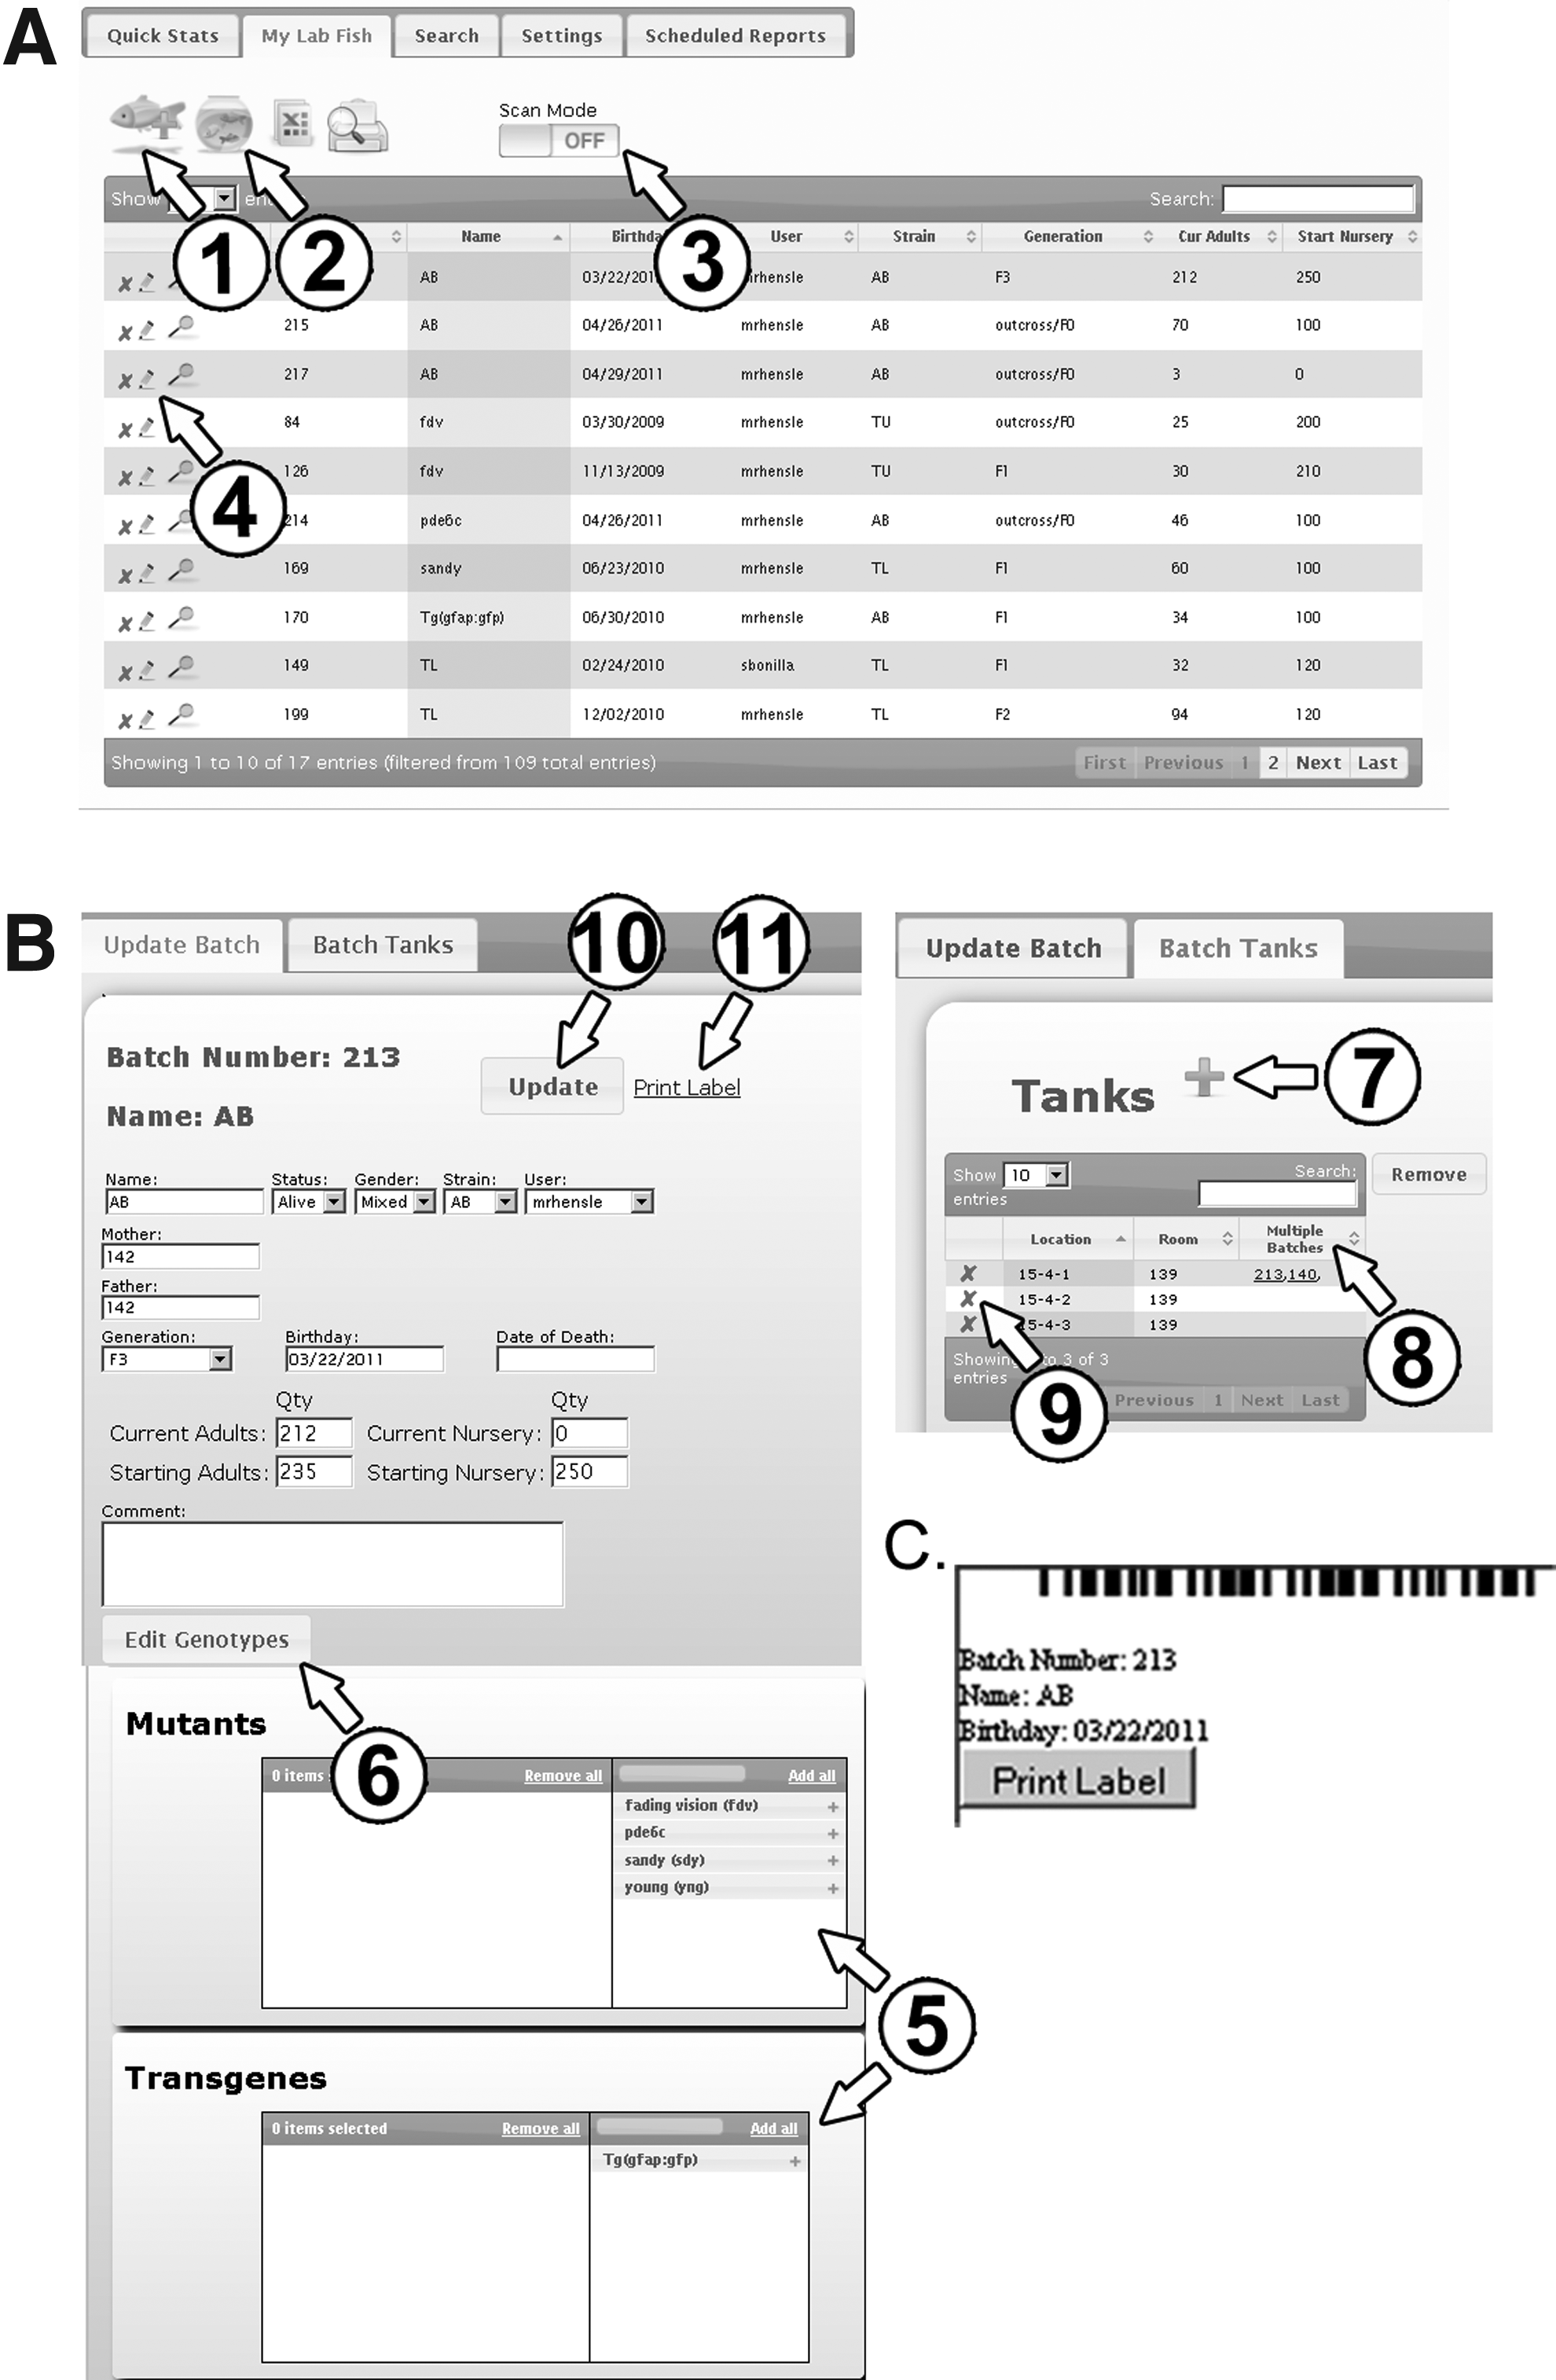
My Lab Fish window.
When the ‘Add Batch’ icon (Fig. 3A, arrow 1) is selected, a pop-up window will appear and allow for entering all vital information for the new batch (not shown; but the basic arrangement is essentially Fig. 3B, see below). By clicking the ‘Insert’ icon in the pop-up window, a new batch number will automatically be assigned to this new batch of fish. After creating a new batch number, the mutant and/or transgene information can be added. First, search for the new batch number and open the corresponding record through clicking on the ‘pencil’ icon in the My Lab Fish table (Fig. 3A, arrow 4). The information of that batch will be displayed in a new pop-up window (Fig. 3B) for updating, with new options for adding existing mutant and/or transgene information. This can be done by either moving the available entries from the right column to the left individually using the ‘blue plus' icon or the ‘Add all’ option located at the top (Fig. 3B, arrows 5). Zygosity information can be added for each mutant or transgene through clicking the ‘Edit Genotypes' icon (Fig. 3B, arrow 6).
Tank location(s) can be added by clicking the ‘green plus' icon under the Batch Tanks sub-tab (Fig. 3B, arrow 7). To select the desired tank locations from a list of all possible locations in a facility, first type the location and/or room number in the search box, or select the information directly from the list; then, choose all applicable entries by clicking the ‘green plus' icon in front of them. After all tanks have been chosen, click ‘Insert’ to add these tank locations to the batch. If more than one batch number has been assigned to the specific location, these will be displayed under the ‘Multiple Batches' column (Fig. 3B, arrow 8). For example, to remove batch number 213 from an incorrect tank location, click the ‘red X’ icon (Fig. 3B, arrow 9) in front of that entry to add that to the remove list. After adding all incorrect tank locations, click ‘Remove’ to delete them from the batch record. Alternatively, the incorrect batch number assigned to the desired location can be selected from the ‘Multiple Batches' column, which will bring up the information of that batch of fish in a new pop-up window. Then, modification of this batch can be done as described above. In addition, this same procedure can also be used to delete tank locations when retiring a batch of fish from the database. Note all updates made to a batch record have to be finalized by clicking the ‘Update’ icon (Fig. 3B, arrow 10). To print a label for the optional barcode scanning, select the ‘print label’ icon (Fig. 3B, arrow 11). The image of the label will be generated in a pop-up window (Fig. 3C). The information that is shown in the label can also be customized.
Search Tab
The Search tab provides custom search functions (Fig. 4A). All different fields of the fish record can be used to do a search. The search results can be saved by entering a name in the Save Searches sub-tab (Fig. 4A, arrow 1). Next to the Save Searches sub-tab are two other sub-tabs, Quantity and Batch (Fig. 4A, arrows 2 and 3, respectively).
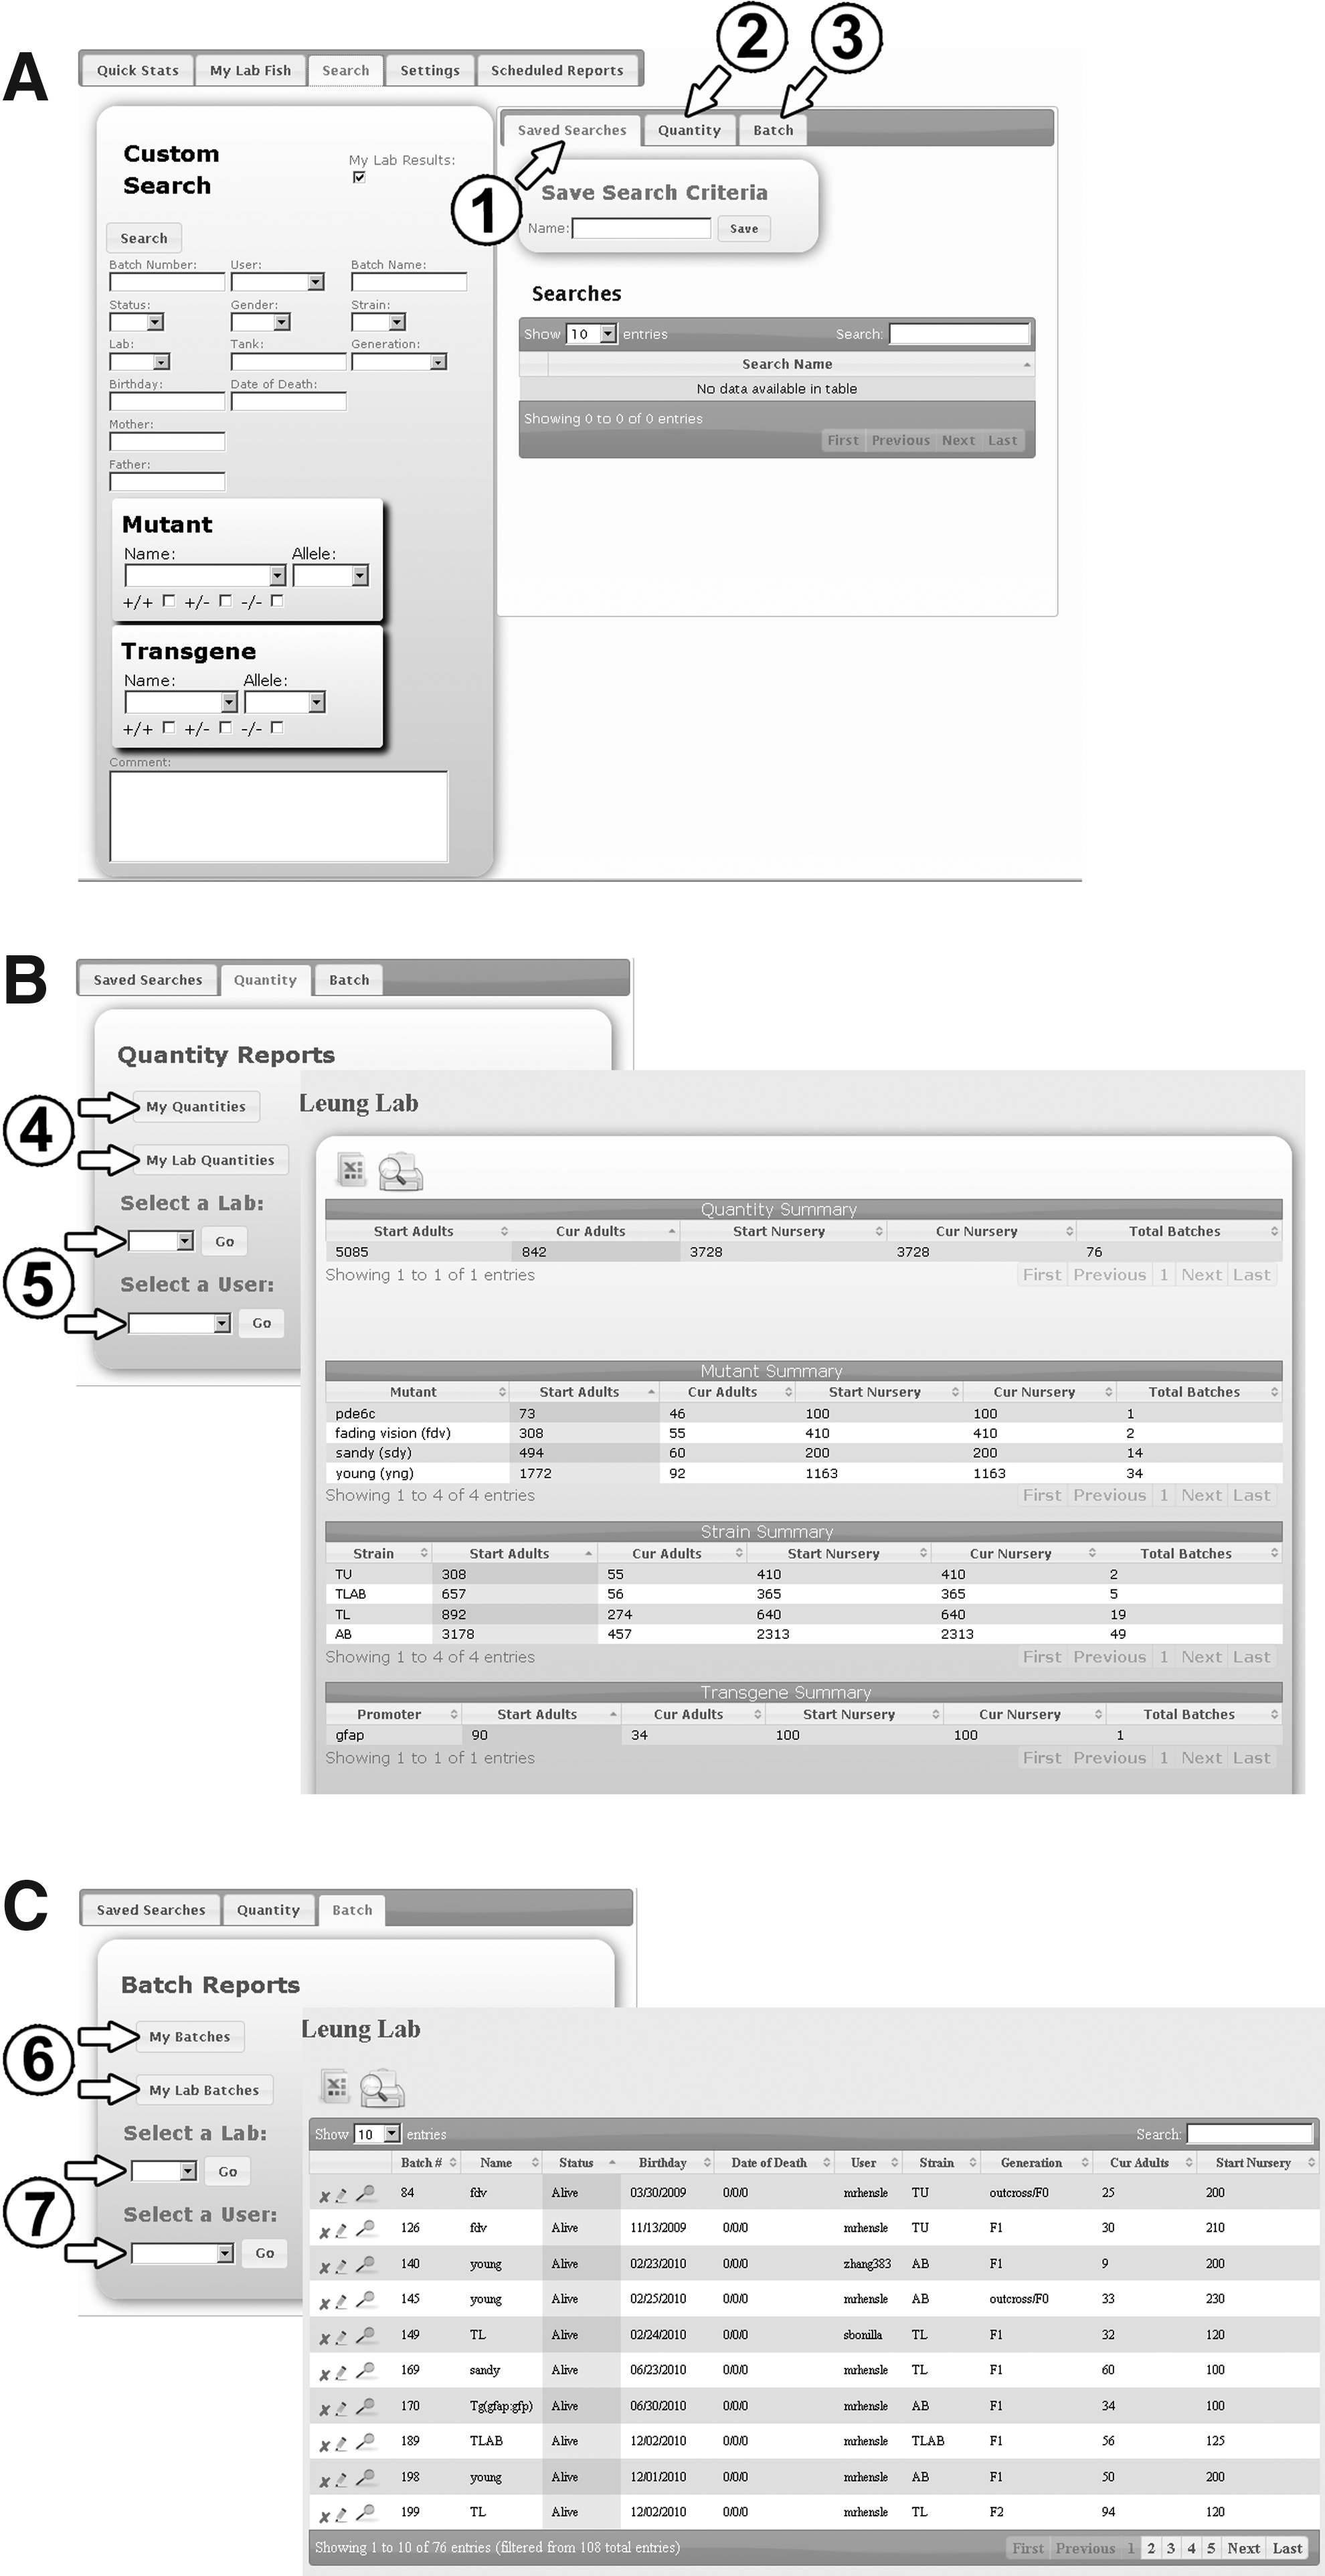
Search window.
The Quantity sub-tab (Fig. 4B) provides quantity reports from which one can quickly retrieve information related to the quantity of fish associated with the logged-in user or his hosting laboratory by selecting either ‘My Quantities' or ‘My Lab Quantities' respectively (Fig. 4B, arrows 4). The search results will appear in a new pop-up window, as shown on the right. There are additional options for searching quantity information associated with a specific laboratory or a specific user by using the drop-down menus (Fig. 4B, arrows 5).
The Batch sub-tab (Fig. 4C) provides batch reports similar to those in the Quantity search. To retrieve batch information associated with the logged-in user or his hosting laboratory select either ‘My Batches' or ‘My Lab Batches' respectively (Fig. 4C, arrows 6). Again, the search results will appear in a new pop-up window, as shown on the right. Additional options are also available for searching batch information associated with a specific laboratory or a specific user by using the drop-down menus (Fig. 4C, arrows 7).
Settings Tab
Under the Settings tab, there are three sub-tabs: Users, Tanks, and Other Attributes. Under the Users sub-tab, the full names, lab affiliations, contact information and administrative rights of all users are listed (Fig. 5A). The ‘green plus' icon in this tab (arrow 1), as well as in the two other tabs in Figures 5B and 5C, is used for adding a new entry. After entering the new required information, click ‘Insert’ to save the entry.

Settings window. The Settings window provides information of all Users
Under the Tanks sub-tab (Fig. 5B), all relevant information of each individual tank housed in a facility such as tank size, tank location, room number, and comments are saved. The size of each tank is recorded in liters, the tank location is a three-number code that is read as “rack-shelf-water spout” and indicates the exact location of a specific tank, and room number indicates which room the rack is located. This is the same room number that is shown in the add tanks window (Fig. 3B).
The Other Attributes sub-tab (Fig. 5C) consists of four additional sub-windows Mutants, Strains, Transgenes, and Labs. The Mutants sub-window displays all mutants that are housed in a facility, as well as the mutant allele, mutant gene, and strain associated with each mutant. The Strains sub-window shows all different strains housed in a facility and the source from which they are obtained. The Transgenes sub-window shows all transgenic fish that are housed in a facility as well as their promoter, transgene gene, transgene allele, and strain information. Lastly, the Labs sub-window shows all the laboratories that are using a facility.
Scheduled Reports Tab
To automate the process of report generation, a UNIX/Linux administrator can create a scheduled task on the server known as a cron job. A Windows administrator can use the Task Scheduler. A user can select a report to be emailed to him through toggling the user name selection on the left window (Fig. 6). The scheduled reports can also be run manually at any time by clicking the icon next to each report script in the list (Fig. 6, arrow 1). A standard report is included in the default install which includes quantity summaries for each user as well as the whole laboratory.

Scheduled Reports window. A user can select to receive a scheduled report by email and/or run the report manually at any time by clicking the icon as indicated by arrow 1.
Implementation
ZeBase is implemented on MySQL 5.1.41, PHP 5.3.2, and an Apache web server, which can be installed in a UNIX/Linux or Windows environment. ZeBase is released under the Apache License, Version 2.0. Users only need to access the database through a web browser which can be run on PC, Mac, or UNIX/Linux. This can be a traditional server configuration or a workstation that is configured with Appserv (http://www.appservnetwork.com/), a simple installer that will install all server-side packages including Apache, PHP, MySQL, and phpMyAdmin. While all users can create and update new batch records, obtain statistics and reports, and control barcode scanner and label printer, only an administrator can delete and modify user accounts, Mutants, Transgenes, Strains, and Tanks. This avoids accidental modification of the critical information and ensures the consistency of the records. Codeigniter is used as the framework to organize and streamline the code and JQuery is used to create a full-featured graphical user interface. Advanced users will find phpMyAdmin helpful to directly access individual records and modify attributes of the database with a graphical user interface. An installer has been created to facilitate the setup of ZeBase, but it would be beneficial to have an IT administrator to help with scripting and implementation of the web interface. The most current installer and specifications of the database can be found at http://zebase.bio.purdue.edu
Availability and requirements
• Project name: ZeBase
• Project home page: http://zebase.bio.purdue.edu/
• Developer site: http://code.google.com/p/zebase/
• Operating system(s): Platform independent
• Programming language: MySQL 5.1.41, PHP 5.3.2, and Apache
• Other programming requirements (optional): phpMyAdmin, Appserv
• Barcode Scanner (optional): WASP Bluetooth wireless handheld scanner—WWS500 or equivalent
• Label Printer (optional): Brother QL-570 Label Printer or equivalent
• License: Apache License, Version 2.0
Cost estimation and management workload
The optional scanner and printer are the only costs associated with ZeBase if it is installed in a workstation. Current pricing is at $280 for a similar barcode scanner and $98 for a simple label printer as of January 2012. After the initial setup (estimated to be 2 hours of the IT service time), the database can be run with minimal routine maintenance, except for the implementation of new functions and updating of the current fish number. In our facility, all users are requested to keep track of and update the current number of their fish monthly to fulfil our institutional reporting requirement.
Footnotes
Disclosure Statement
No competing financial interests exist.
Acknowledgments
We thank members from Donna Fekete's laboratory, in particular, Deborah Biesemeier, for inputs and discussions during the developmental phase of the project; and the IT team from the Department of Biological Sciences for their technical support on establishing the infrastructure for the database.
References
Supplementary Material
Please find the following supplemental material available below.
For Open Access articles published under a Creative Commons License, all supplemental material carries the same license as the article it is associated with.
For non-Open Access articles published, all supplemental material carries a non-exclusive license, and permission requests for re-use of supplemental material or any part of supplemental material shall be sent directly to the copyright owner as specified in the copyright notice associated with the article.