
Abstract
Abstract
The effect of common husbandry conditions (crowding, social environment, water quality, handling, and background color) on the cortisol stress response in adult zebrafish, Danio rerio, was investigated to check the usefulness of zebrafish as a model organism in aquaculture research. In addition, a noninvasive methodology for assessing stress was evaluated. Zebrafish showed a fast cortisol response with high values at 30 min that returned to basal levels within 2 h of poststress. There was a significant positive correlation between trunk cortisol concentrations and the free water cortisol rate (r2=0.829–0.850, p<0.001), indicating that measurement of the water-borne cortisol release rate may serve as a noninvasive and reliable stress indicator at the population level. Crowding resulted in 13- to 21-fold greater mean trunk cortisol concentrations compared with controls. However, even at low stocking density (2–5 fish/L), the maintenance cost was higher than the one at higher densities (10 fish/L) due to the formation of dominance hierarchies. The background color affected trunk cortisol concentrations, with fish exposed to brighter backgrounds (green and white) showing 3- to 8-fold greater mean trunk cortisol concentrations than fish exposed to a black background or transparent aquaria. Fish exposed to high stocking densities for 2 h or 5 days had similar high mean trunk cortisol levels, indicating that exposure of fish for the period of 2 h to a specific stressor may represent a chronic situation in zebrafish. It is concluded that adult laboratory zebrafish had a preference for a transparent or black background aquarium, at a number of 10 individuals per 2 L of available water volume, to express their normal behavior and avoid increased cortisol stress reaction.
Introduction
Fish reared under intensive conditions are exposed to different environmental (background color, light intensity, lighting spectrum, and water quality) and husbandry (stocking density and social environment) factors, which may cause an integrated stress response and physiological impairment in the course of their life. Stocking density is, perhaps, the most well-studied parameter in fish species of importance for aquaculture. Inappropriate stocking densities exert adverse impacts on fish performance, health, and welfare.11–13 and, therefore, defining the optimum density is of prime importance. Surprisingly, published data for zebrafish tend to vary considerably. 14 According to Spence et al. 15 a high density was set at 0.25 fish/L (tank volume: 60 L), while in another study, 40 fish/L (tank volume: 4 and 76 L) were considered to be a stressful density. 8 More importantly, there has been no attempt to define which component of stocking density (water quality, social hierarchies, or crowding itself) ultimately evokes the stress response.
The aim of this study was to investigate the effect of common husbandry conditions on the cortisol stress response to check the usefulness of the zebrafish as a model organism in aquaculture research. Specific objectives were to (1) identify the merit of specific components of the overall effect of stocking density, such as water quality, social behavior, and available water volume on zebrafish welfare, (2) develop a noninvasive methodology for assessing stress, and (3) to define optimum stocking density conditions for adult zebrafish.
Materials and Methods
Experimental fish
Wild-type zebrafish (D. rerio) were obtained from Singapore through a Greek wholesaler and maintained in 2×250-L aquaria (holding tanks) at the installations of the Fish Physiology Laboratory, University of Crete. Aquaria were equipped with a biological filter (Eheim external canister filter; EHEIM GmbH & Co. KG) and facilities for temperature and photoperiod control as well as for aeration and oxygen supply. The water temperature was set at 26°C and the photoperiod at 12L:12D. Water chemical parameters were monitored on a daily (dissolved oxygen, pH) or weekly base (ammonia, nitrite and nitrate). Fish were fed daily with industrial aliment (Ocean Nutrition formula one, Spirulina flakes).
Experiment 1: time course of the acute stress response and water-borne cortisol
To evaluate the measurement of cortisol concentrations released into the water of the holding aquarium as a noninvasive stress indicator in zebrafish, 30 adults (mean body weight [b.w.]±standard error of the mean [SEM]: 0.31±0.04 g) were chased for 4 min, netted, and exposed to air for 1 min, and then placed in 10×1.5-L beakers (three fish per tank, water volume 1.1 L) and sampled at regular intervals (0.5, 1, 4, 8, and 24 h) over a 24-h period. Before the application of the stressor, 10 fish were taken and served as controls (0 h). Water samples (0.5 L) were taken from two beakers per respective time point and stored at −20°C until assayed. Gloves were worn at all times to prevent contamination with skin-derived cortisol. Fish were dropped in a net and immediately killed by immersion in ice-cold water. Then, the head and caudal fin were cut and trunks were weighed, frozen in 1.5-ml eppendorfs on dry ice, and stored at −80°C for cortisol determination.
Experiment 2: crowding and stocking density
To investigate the effect of stocking density, two sets of experiments were performed in cubic 2-L glass aquaria (available volume). In the first set of experiments, different numbers of fish (2, 5, 10, and 20 individuals, mean b.w.: 0.57±0.08 g) were placed in a certain water volume (0.5 L), forming four groups of different stocking densities (D4, D10, D20, and D40 individuals per liter). In the second set of experiments, the same number of fish (n=10) was placed in different water volumes (0.25, 0.5, 1, 2 L) forming, thus, four groups of different stocking densities (D40, D20, D10, and D5 individuals per liter). All experiments were performed in duplicate with the exception of the Group 4 individuals per liter in the first set of experiments, where five replicates were used. Fish were exposed to the different stocking densities for 2 h, and at the end of the experimental period, 2–5 fish per aquarium (i.e., 10 fish per group) were sacrificed for the determination of trunk cortisol content. Ten fish were also taken from the holding tank and served as controls. In addition, water samples (0.5 L) were taken at the beginning (0 h, blank values) and at the end of the experiments for the determination of water-borne cortisol and water quality parameters (dissolved oxygen ammonia, nitrite and nitrate, Table 1).
Different stocking densities were achieved by placing either different numbers of fish (n=2, 5, 10, or 20) in the same available water volume (V) or same number of individuals (n=10) at different available water volumes. Control fish were held in a 250-L aquarium, at a density of 0.2 fish per liter. Values are given as mean±SD.
ind, individuals; SD, standard deviation.
Experiment 3: water quality, short- and long-term crowding stress
To compare the effect of short and long exposure to crowding and to disassociate the effect of crowding stress from water quality, zebrafish (n=120; mean b.w.: 0.56±0.08 g) were divided in specially constructed, 4×2-L cube-shaped acrylic boxes, which were placed into a 250-L glass aquarium. The wall of the boxes had numerous 3-mm holes to allow water to flow through, to ensure water quality conditions similar to that of the control group. 8 To achieve an available water volume of 0.5 L, only one quarter of the cubic 2-L boxes was drawn into the acclimation tank, forming two experimental groups (D20 and D40 individuals per liter). Ten fish per group were sampled at 2 h (short exposure) and 5 days (long exposure) after the start of the experiment for the determination of trunk cortisol concentrations. Since experiments 2 and 3 were conducted simultaneously, they shared the same controls.
Experiment 4: defining the minimum available water volume requirements for zebrafish to be in a low cortisol stress environment
Based on the results obtained in experiments 2–3 and to define the minimum tank or free space size requirements for zebrafish, fish (n=160; mean b.w.: 0.51±0.01 mg) were placed in specially constructed 2-L cube-shaped acrylic boxes (same as in Experiment 3) within a 250-L glass aquarium for 2 h or 5 days, forming four different groups (2, 5, 10, and 20 individuals in 2 L of water). The experiment was conducted in duplicate aquaria, except for the two fish groups, where five replicates per time point ware used. Five fish per group (10 for the 2 fish group) were sampled at 2 h (short exposure) and 5 days (long exposure) after the start of the experiment for the determination of trunk cortisol concentrations.
Experiment 5: social environment, aggression, and schooling behavior
To investigate how social factors (number of fish in a certain available water volume) affect the expression of aggression or the establishment of schooling behavior, two sets of experiments were performed. In the first, different numbers of male zebrafish (2, 3, 4, 5, and 10 individuals, mean b.w.: 0.36±0.08 g) were placed in cubic 1-L glass aquaria (triplicates per group) and their behavior was recorded using a digital video camera (Sony HDR-PJ10) for 5 min, at 2 h from the start of the experiment.
To determine possible differences in cortisol concentrations between dominant and subordinate fish, pairs of male zebrafish (mean b.w.: 0.85±0.23 mg; mean fork length: 4.85±0.05 cm) were placed in 15 cubic 2-L glass aquaria. Fish were anesthetized in MS222, a tiny part of the upper or lower caudal fin lobe was cut for identification, and then matched with a counterpart that did not differ in length by more than 1 mm. Fish were killed at 2 h from the start of the experiment for cortisol determinations.
Experiment 6: background color
To investigate the effect of the background color on the cortisol stress response, fish (n=120; mean b.w.: 0.38±0.01 mg) were placed in 12×5-L plastic novel aquaria and exposed to different background colors (black, blue, green, red, and white) for 2 h, while fish transferred to transparent tanks served as controls. Chromaticity parameters of the different backgrounds are presented in Table 2. Water samples (0.5 L) were taken from each tank at 0, 0.5, and 2 h from the start of the experiment for the determination of cortisol concentrations released into the water of the experimental aquaria. At the half an hour sampling point, an equal volume (0.5 L) of fresh water was added to all aquaria. Three fish per tank were killed at the end of the experiment for the determination of trunk cortisol.
L*, lightness attribute; hue, the name of a color as found in its pure state in the spectrum (it is represented by the hue-angle in the a*–b* plane, which increases by a counter clockwise rotation around the a*, b* axis with 0° being red, 90° being yellow, 180° being green, and 270° being blue); chroma, the saturation of a color (how much gray and white light is mixed in with the pure focal color).
All protocols were approved by the Departmental Animal Care Committee, in accordance to Greek (N. 2015/1992) and EU (Directive 63/2010) legislation on the care and use of experimental animals.
Behavioral analysis
Behavioral videos were analyzed by a VideoLAN—VLC media player using slow-motion analysis when needed. The incidence of dominant behavior was quantified by measuring the duration (relative to session) for chasing and the number of attacks. Subordinate behavior was quantified by measuring the duration relative to a session of freezing. Chasing was defined according to Paull et al. 2 as “direct/aggressive swim toward another fish in the aquarium causing it to increase its speed and possibly change direction.” Freezing was defined, according to Blaser and Gerlai, 16 as “a motionless state during which only the gills and, occasionally the eyes may move” which occurred mostly, while the fish was in the bottom and in a corner, and in a few cases right below the water surface. Attack was defined as the dominant fish attacking the subordinate without or associated with biting trials.
Cortisol determination
Cortisol extraction was performed according to de Jesus et al. 17 and Pavlidis et al. 4 Briefly, trunk samples were partially thawed on ice and homogenized in 5×(w/v), ice-cold, phosphate-buffered saline (pH 7.4) with a rotor homogenizer. Cortisol was extracted from 2×250 μL of homogenate with 3 mL of diethyl ether. The water phase of the extract was allowed to freeze by placing tubes in −80°C and the combined diethyl ether layer was transferred into a new tube. The ether was evaporated by placement of tubes in a 45°C water bath for 1 h and in room temperature for an additional 3 h. Samples were then reconstituted in 250 μL of an enzyme immunoassay buffer.
Water samples for cortisol determination were pumped through a prefilter (0.45 μm pore size: AcroCapTM; GelmanSciences), and then through an activated solid-phase extraction cartridge (Sep-pak® Plus C18; Waters Ltd.). The actual volumes were determined gravimetrically and the extraction cartridges were then stored at−20°C until assayed. For measuring cortisol, free (i.e., unconjugated) corticosteroids were subsequently eluted from the extraction cartridges with ethyl acetate. Ethyl acetate was evaporated at 45°C under nitrogen gas and the residue was redissolved in 1 mL of the enzyme immunoassay buffer.
Cortisol was quantified by the use of a commercial enzyme immunoassay kit (Cayman Chemical) previously evaluated. 4 All samples were tested in duplicate. The amount of hormones (H) in nanogram released over a given time interval (t) in h, because of the static conditions, was calculated using a simple method. The amount of cortisol within each aquarium was calculated at each sampling point using the determined water cortisol concentration and taking into account, in the case of Experiment 6, the amount of cortisol removed by sampling (0.5 L) and added by fresh water supplementation (0.5 L). The hormone release rate (ng/g/h) was subsequently calculated from the differences in the amount of cortisol between sampling points, fish biomass, and time.
Statistical analyses
All data are presented as mean±SEM. One- or two-way analysis of variance or Kruskal–Wallis nonparametric tests were used to determine significant differences in trunk cortisol concentrations. If significant (p<0.05), the Holm-Sidak's or Dunn's multiple comparison test was applied to identify groups that were significantly different. Data analysis was performed by SigmaStat v3.1 software (Jandel Scientific Software).
Results
Time course of the acute stress response and water-borne cortisol
The time course of changes in trunk and water-borne cortisol are presented in Figure 1. Trunk cortisol reached the highest concentration at 30 min (11.87±2.46 ng/g trunk weight [t.w.]) after exposure to acute stressors (Fig. 1). High values were also obtained at 1 h (7.61±1.17 ng/g t.w.) after stress application, and then declined sharply to reach values similar to those of control fish (1.05±0.13 ng/g b.w.). The water-borne cortisol release rate showed a similar pattern of changes. The water cortisol rate showed a maximum at 0.5 h (10.67±0.59 ng/g/h), and then declined sharply to reach baseline values at 4 h of poststress (Fig. 1). There was a significant positive correlation between trunk cortisol concentrations and the free water cortisol release rate (r2=0.850, p<0.001). The regression equation was y=0.803x+3.573, where y=water release rate (ng/g/h) and x=trunk cortisol concentration (ng/g).

Trunk cortisol (F) concentrations (mean±standard error of the mean [SEM], n=6 per sampling point, except of 0 h, where 10 fish were sampled) and cortisol release rate into the water in zebrafish during a 24-h time course after application of stressors (water samples were also taken at 2 h post-stress). Means with different letters are significantly different (Kruskal–Wallis test, p<0.05). Values of the cortisol release rate are plotted at the midpoint of the time interval that release rates were measured over. t.w., trunk weight.
Stocking density, water quality, short- and long-term crowding stress
The effect of crowding on the cortisol stress response is presented in Figure 2. There was no statistically significant difference in trunk cortisol concentrations in zebrafish held in different numbers (n=2, 5, 10 or 20) under the same available water volume (0.5 L). However, all groups showed 13- to 21-fold higher cortisol concentrations than control fish held in the holding tank (a 250-L aquarium), at a density of 0.2 fish/L (p<0.001, Fig. 2a). There was a significant positive correlation between trunk cortisol concentrations and the free water cortisol release rate (y=3.197x+4.483, r2=0.829, p<0.001).
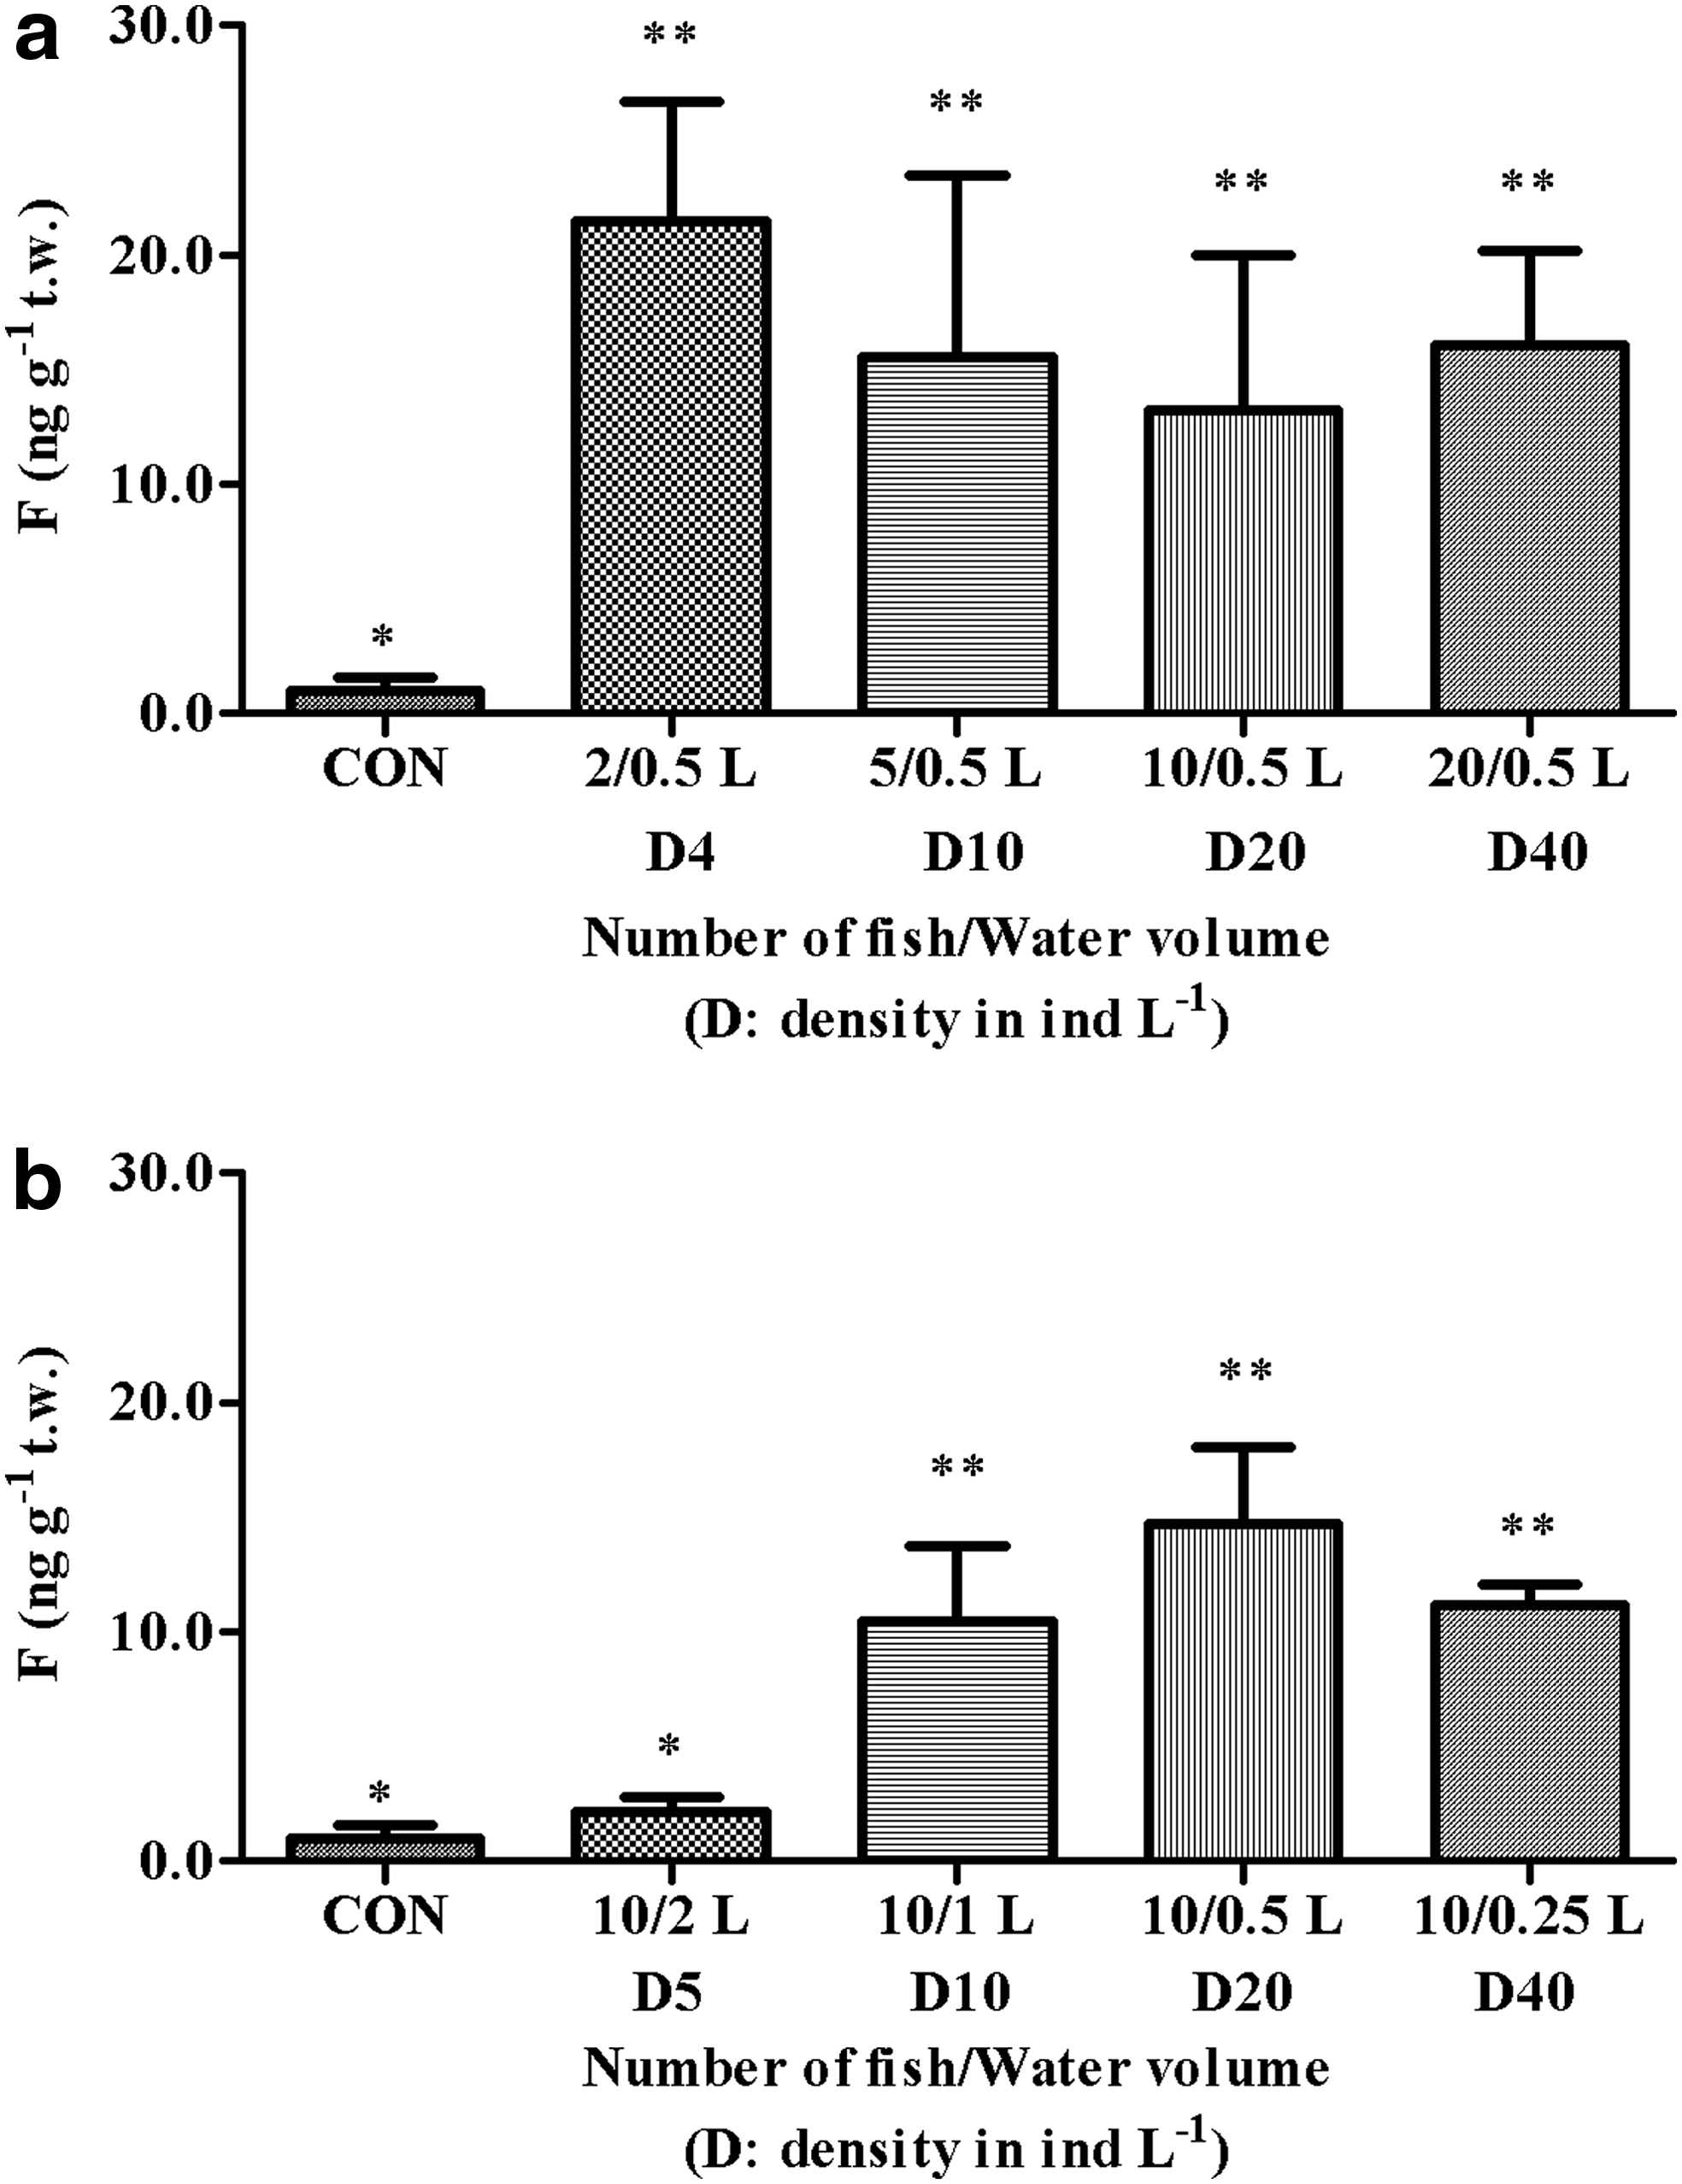
Effect of crowding on trunk cortisol concentrations (mean±SEM, n=10) in adult zebrafish. Different stocking densities (D) were achieved by placing either different numbers of fish (n=2, 5, 10, or 20) in an available water volume of 0.5 L
Zebrafish (n=10) held in same sized aquaria, but at different available water volumes (0.25, 0.5, and 1 L), showed also statistically significant higher trunk cortisol concentrations than controls (Fig. 2b). Only zebrafish held in 2-L tanks showed no statistically significant difference from controls (Fig. 2b). Fish exposed to the same stocking density (D20: 20 fish/L or D40: 40 fish/L) under different water quality parameters (S: static vs. R: recirculation) for 2 h showed similar cortisol concentrations (D20-S: 13.3±6.7 ng/g t.w. and D20-WR: 18.2±4.7 ng/g t.w.; D40-S: 16.1±6.7 ng/g t.w. and D40-WR: 17.7±4.7 ng/g t.w.). There was also no statistically significant difference in trunk cortisol concentrations between fish exposed to the same stocking density (D20 or D40) for short (2 h) or long (5 days) time periods (D20-2 h 18.2±4.7 ng/g t.w. and D20-5 d: 24.7±2.9 ng/g t.w.; D40-2 h: 17.7±4.7 ng/g t.w. and D40-5 d: 23.5±3.1 ng/g t.w., Fig. 3).
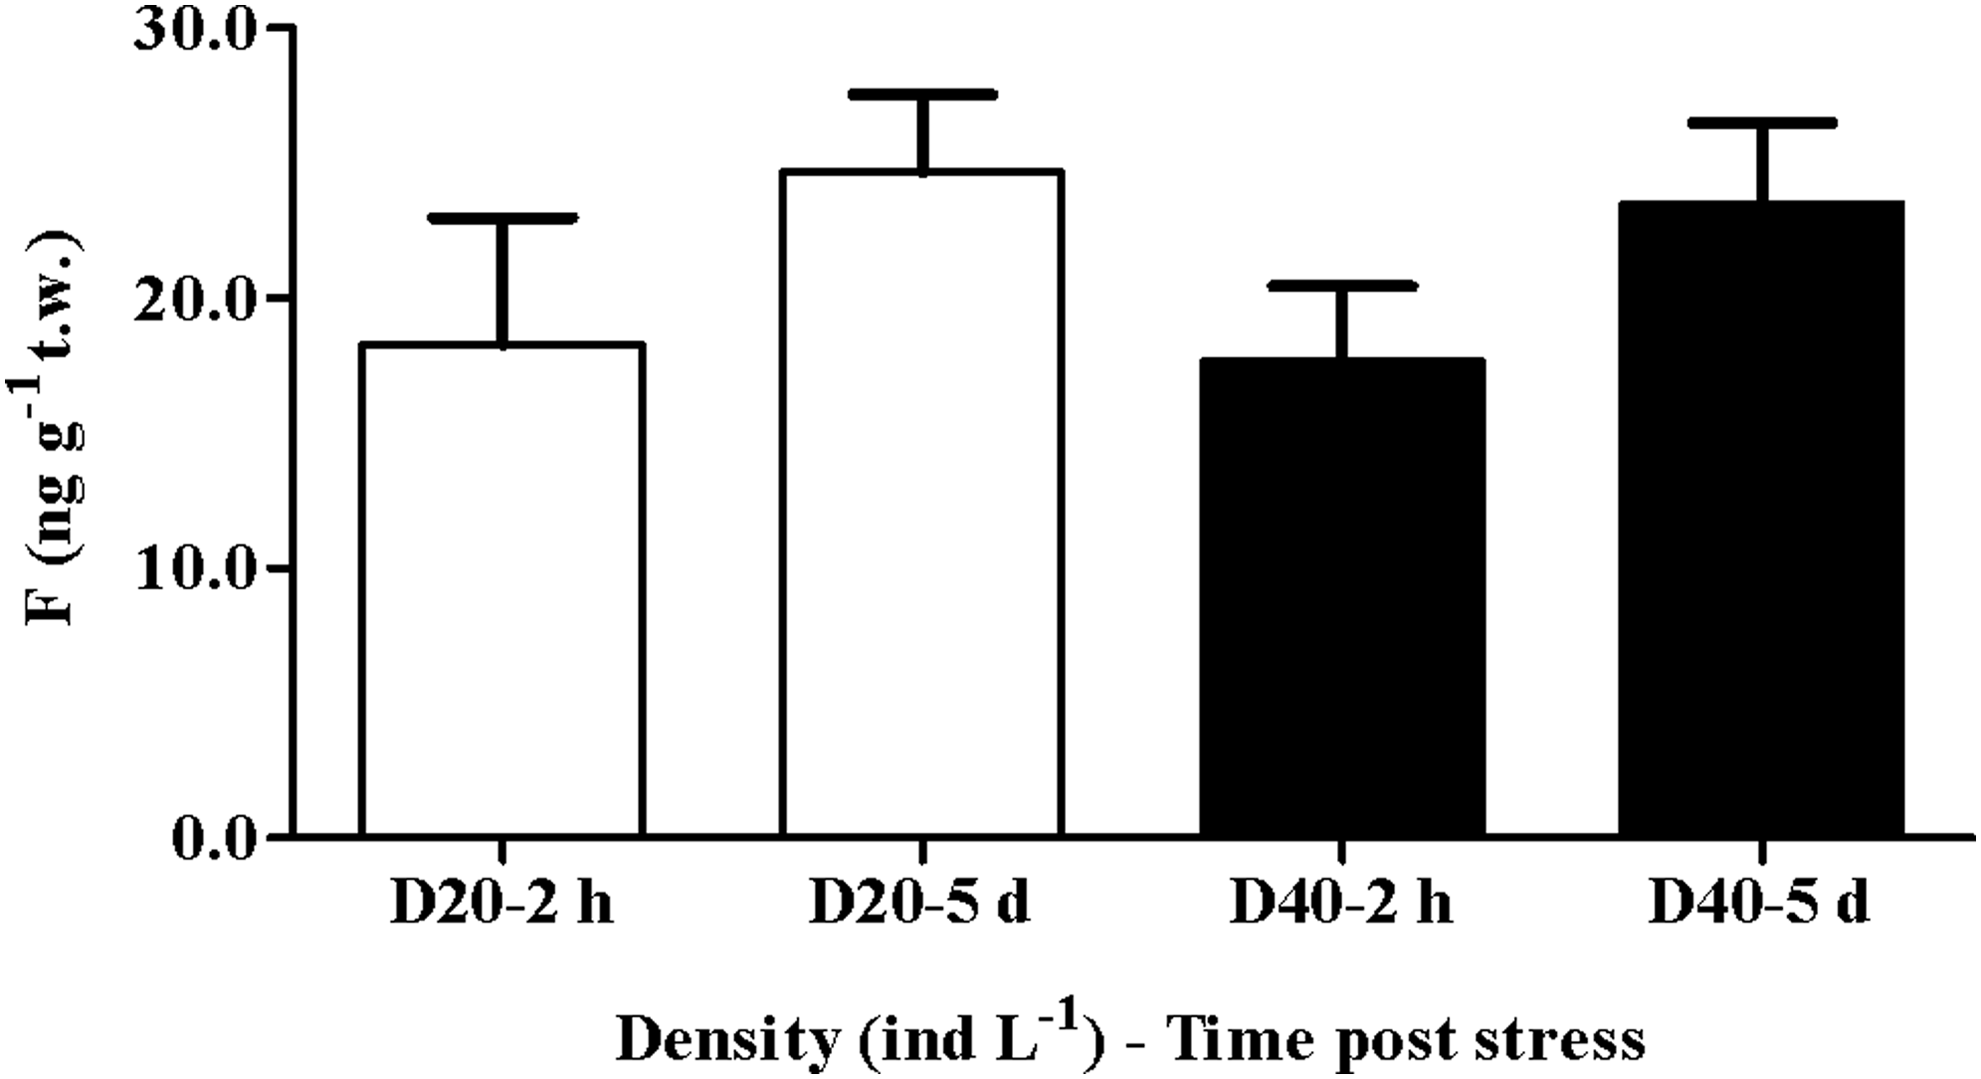
Effect of short (2 h) and long (5d) crowding (D20: 20 individuals per liter; D40: 40 individuals per liter) on trunk cortisol concentrations (mean±SEM, n=10) (two-way ANOVA).
Minimum available water volume requirements
There was a statistically significant difference in cortisol concentrations among the different time points in all groups with the exception of the 10 per 2-L group (Fig. 4). In particular, 2 h after the start of the experiment, the lower whole-trunk cortisol concentration (4.2±0.3 ng/g t.w.) was observed in the 10 per 2-L group (10 individuals in 2 L of water) compared to the rest of the groups (average 12.3–19.8 ng/g t.w.). At 5 days, there was no significant difference in cortisol concentrations among the different groups (average values 2.4–4.0 ng/g t.w.).
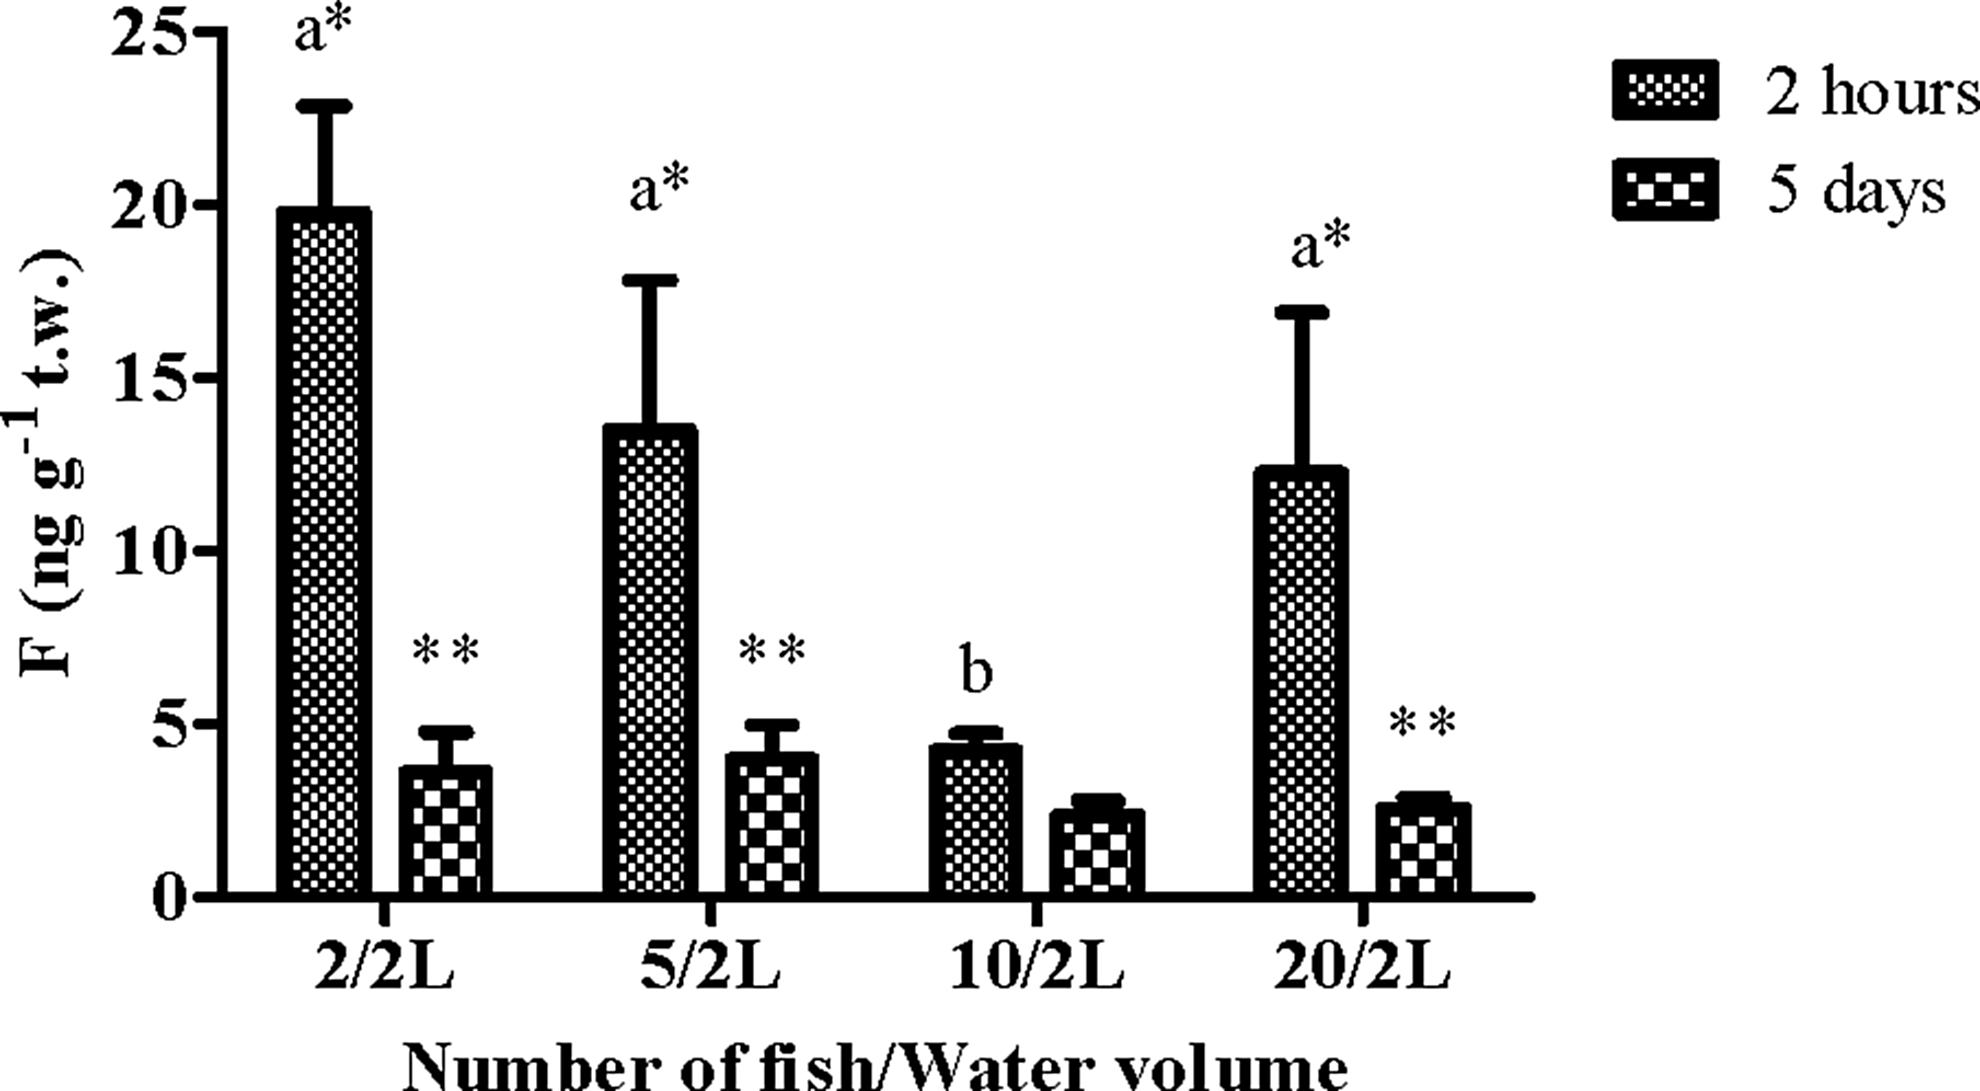
Effect of short (2 h) and long (5 days) exposure of fish on trunk cortisol concentrations (mean±SEM, n=10). Zebrafish (n=2, 5, 10, or 20 individuals) were held in 2-L (available water volume) cube-shaped acrylic boxes placed within a 250-L glass aquaria. The wall of the boxes had numerous 3-mm holes to allow water to flow through, to ensure water quality conditions similar to that of the control group. Means with different letters show significant differences among the different groups within the same time point and asterisks indicate differences between the different time points within the same group (two-way ANOVA, p<0.05).
Social environment, aggression, and schooling behavior
Aggressive behavior was observed in all male zebrafish within 2 h from the formation of pairs (i.e., start of the experiment). Dominant males spent on average 26.7% (range 1–55%) of their time on chasing and performed on average 68.9 of attacks (range 3–135) per 5 min on the subordinate individual (Fig. 5a). The subordinate males displayed a fear behavior by showing a strong freezing response (average 59.9%; range: 41–89%) soon after the start of the experiment. In 40% of the pairs, dominant fish showed higher trunk cortisol concentrations (DOM: 35.1±5.9 ng/g t.w.) than subordinate fish (SUB: 13.8±3.9 ng/g t.w., p=0.013); 40% of pairs showed lower concentrations (DOM: 16.3±4.8 ng/g t.w.; SUB: 30.7±3.6 ng/g t.w., p=0.062); and there was no difference in 20% of the pairs (DOM: 21.7±7.7 ng/g t.w.; SUB: 22.0±6.1 ng/g t.w., p=0.980). However, in total, there was no statistically significant difference between dominant (25.5±3.9 ng/g t.w.) and subordinate (21.6±3.0 ng/g t.w.) fish, while both differed significantly from control fish (Fig. 5b).
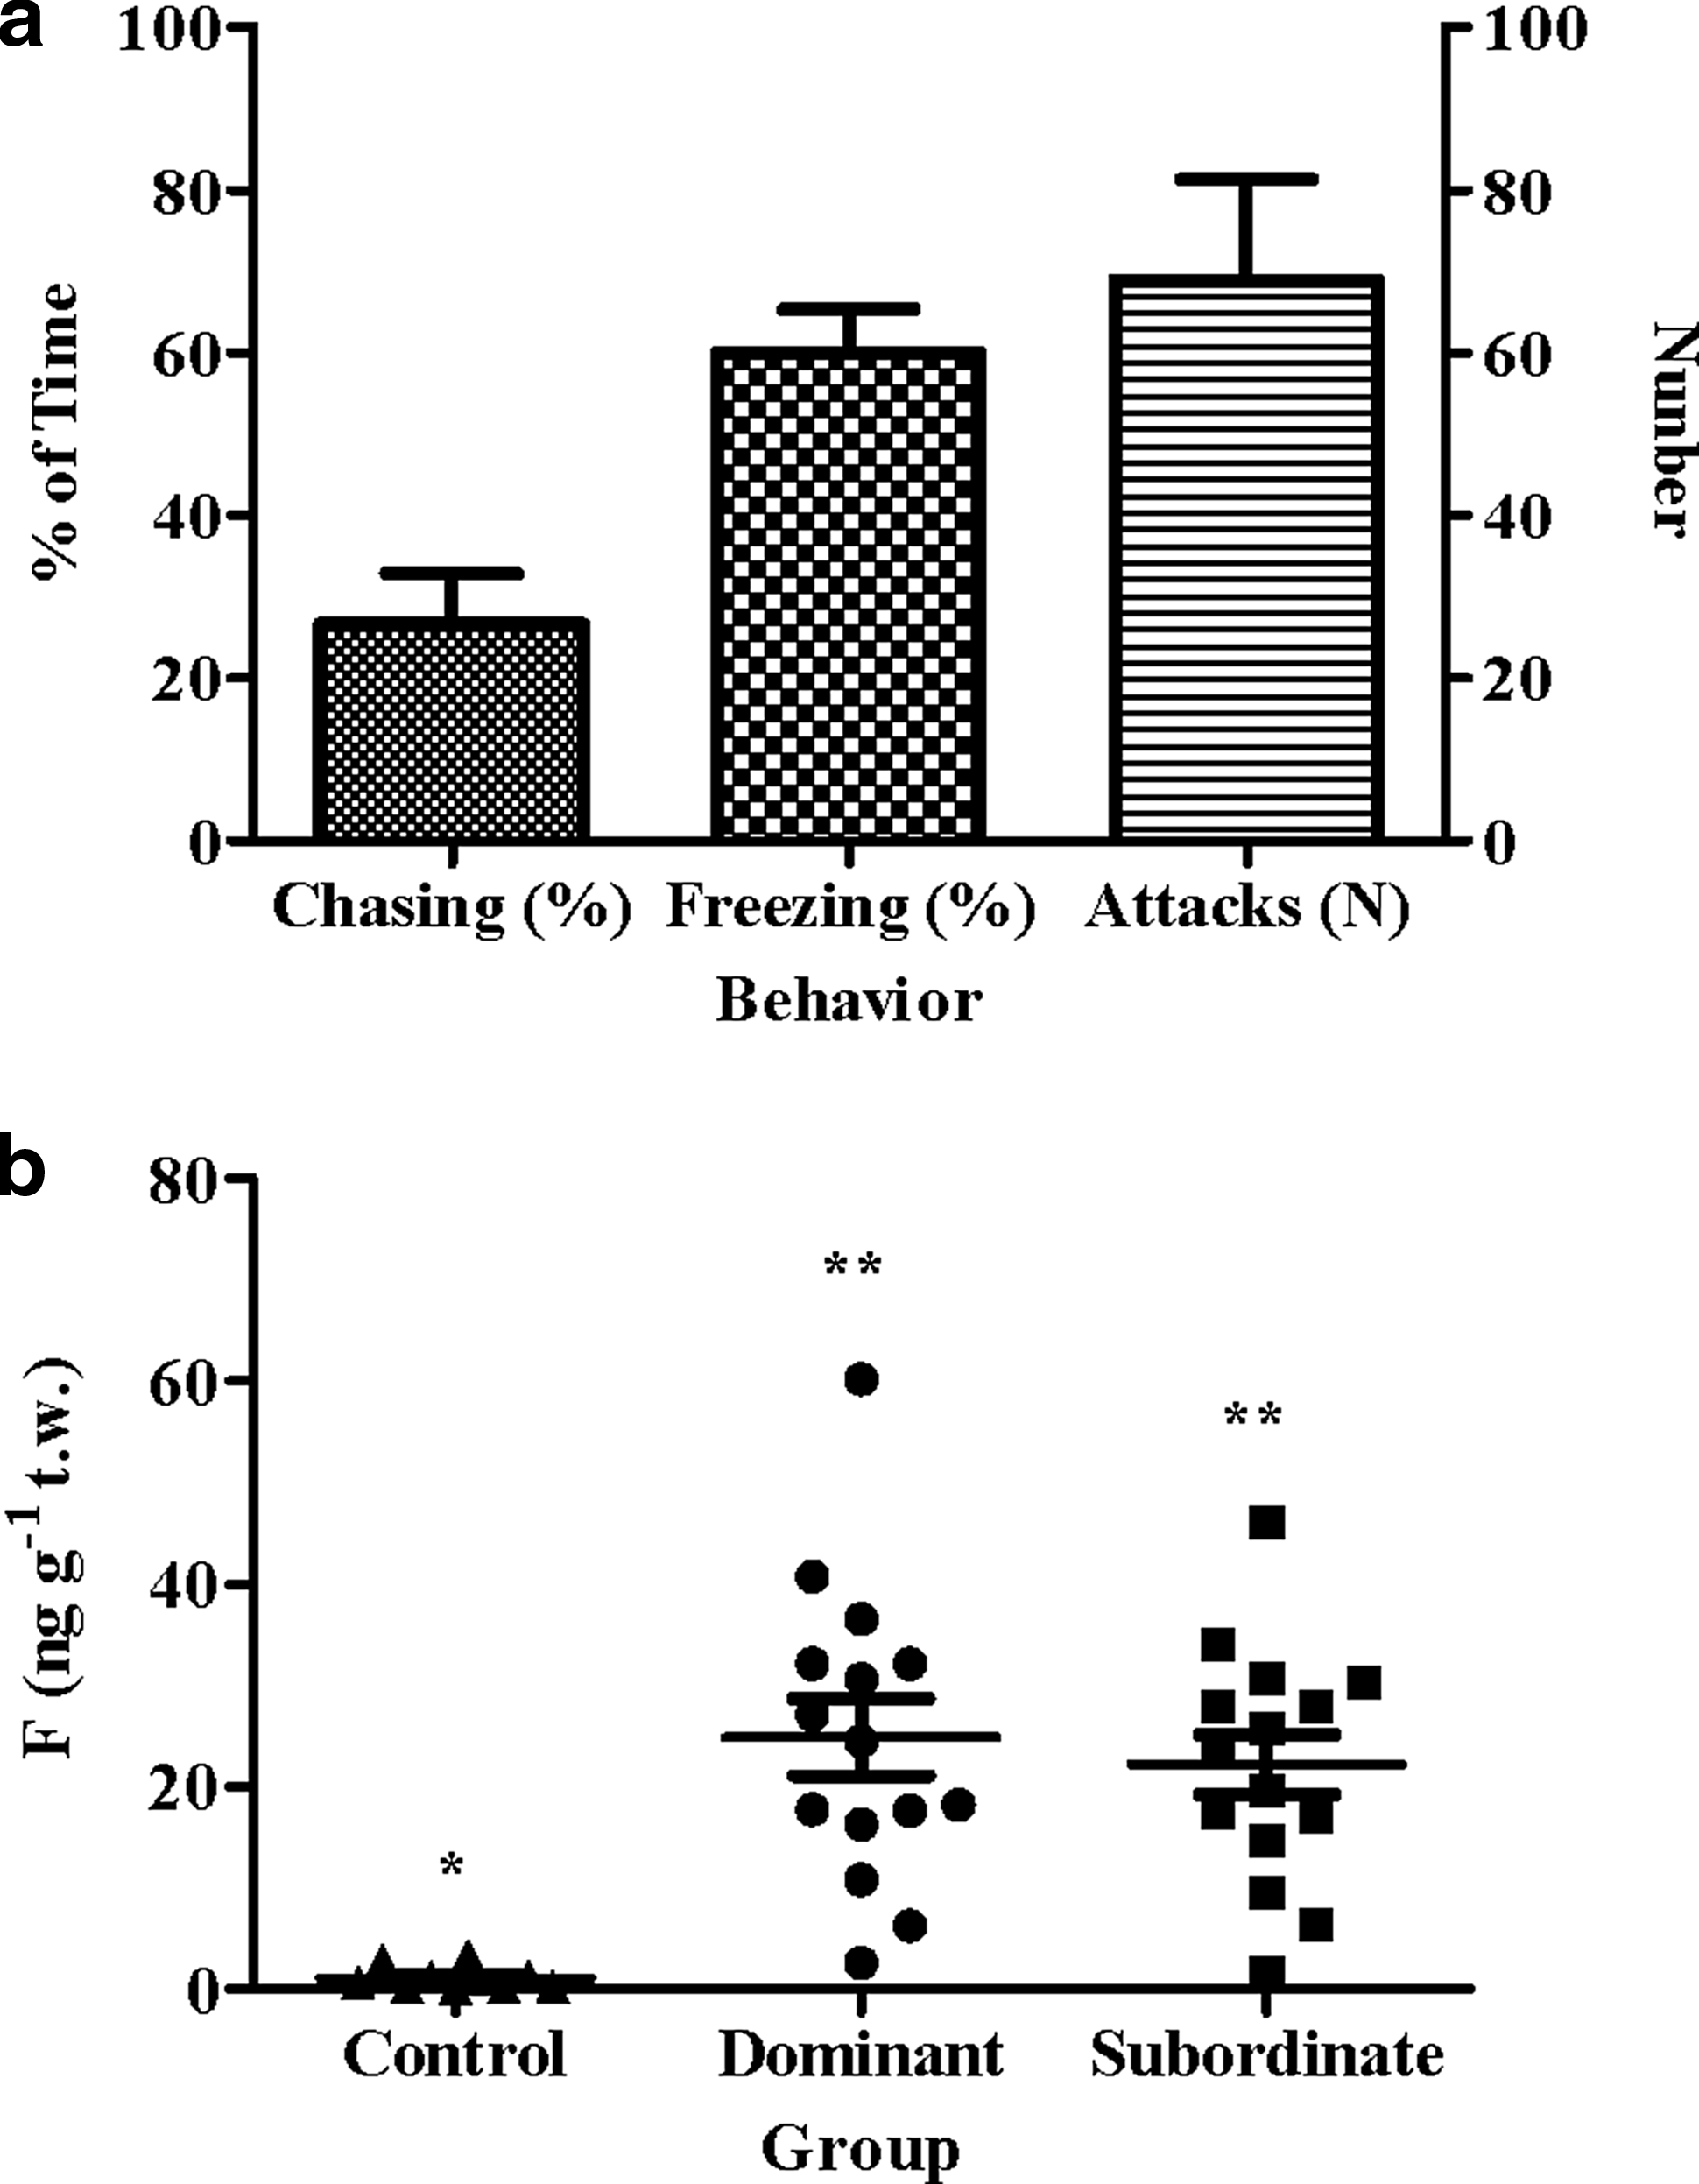
Quantification of aggressive behavior [mean time±SEM, n=15;
As in the case of males held in pairs, strong dominant–subordinate relationships were observed in two out of the three replicates, when three males were placed in 1 L of water (Table 3). In particular, the dominant fish spent 21% and 61% of its time on chasing and performed 39 and 116 attacks per 5 min in the first and the second replicate, respectively. Subordinate individuals displayed a strong freezing behavior (18–89%). Chasing behavior (24–41%), a high number of attacks (35–85), and low freezing behavior (17–19%) were observed in one out of the three replicates consisting of four and five fish in 1 L of water (Table 3). Fish held at a number of six individuals per liter, displayed a weak chasing behavior (2–14%), low number of attacks (6–35), and no freezing behavior in the three replicates tested, while no incidence of aggressive behavior and expression of schooling behavior was observed in fish held at a number of 10 individuals per liter.
Behavior was recorded for 5 min at 2 h after the placement of the fish in the respective aquaria.
R, replicate; ind, number of individuals; n, number.
Effect of background color
The background color affected significantly trunk cortisol concentrations in a positive way with increased brightness (Fig. 6a). Specifically, the highest cortisol concentrations were observed in fish exposed to the white (37.8±6.7 ng/g t.w.) and green (30.8±6.4 ng/g t.w.) backgrounds and lowest in zebrafish held under the black background (10.9±3.5 ng/g t.w.) or in transparent aquaria (4.8±1.1 ng/g t.w.). A high positive correlation was observed between trunk and water-borne cortisol concentrations (y=2.882x+5.018, r2=0.983, p<0.001), with higher water-borne cortisol release rates in fish held under the white and green backgrounds, at both 0.5 and 2 h following exposure to the specific background (Fig. 6b).

Effect of background color on whole-trunk cortisol concentrations [mean±SEM, n=6,
Discussion
The cortisol stress response was characterized in zebrafish exposed to validated acute stress protocol (chasing for 4 min, netting and exposure to air for 1 min). 18 Results obtained are in accordance with the view that most fish species follow a generalized motif of stress response, but with species-specific differences in the magnitude, timing, and duration of the peak poststress blood or whole-body cortisol concentrations. Mean maximum trunk cortisol values in our study were 12 ng/g in accordance with the maximum values reported by Pottinger and Calder, 19 which ranged from 4 to 9 ng/g, but much lower than those reported by Ramsay et al. 7 which ranged from 28 to 30 ng/g. High trunk cortisol concentrations were found at 30 min and 1 h poststress and recovered at baseline values at 2 h after the application of the stressors, which is in accordance with previously published data in other species. 18 Ramsay et al. 7 reported an even faster response in the peak (15 min) and recovery rate (60 min) of whole-body cortisol values in zebrafish exposed to net handling and air exposure. The differences in the magnitude and timing of the stress response between our and previous studies on zebrafish may be explained by differences in the intensity of the stressor, in water temperature (26°C in our study; 23°C in the study of Pottinger and Calder 19 ; and 28.5°C in Ramsay et al. 7 ), in differences in strain and individual responsiveness to stress, or/and in the analytical methods used for the determination of cortisol.
The pattern of changes in trunk cortisol of stressed zebrafish was also reflected in the water cortisol release rate pattern in all experiments, showing that the cortisol released into the fish's holding tanks can be used as a reliable and noninvasive stress indicator in zebrafish. The maximum water cortisol release rate (10.67±0.59 ng/g/h) observed in our study is one of the highest values presented in the literature. Previous studies report maximum water cortisol release rates of 0.17–0.46 ng/g/h for common dentex (Dentex dentex), common pandora (Pagellus erythrinus), sharpsnout sea bream (Diplodus puntazzo), meagre (Argyrosomus regius), and common carp (Cyprinus carpio); 1–3 ng/g/h for rainbow trout, 2.10 ng/g/h for common roach (Rutilus rutilus), and 2.80 ng/g/h for Atlantic salmon.18,20–22 However, it has to be mentioned that a direct comparison among the different studies is not easy mainly due to differences in the body size (fish mass) and water temperature, factors affecting the general metabolic rate, cortisol clearance rate, and/or ventilation rate. 18 Therefore, the present data showed for the first time that zebrafish has a similar pattern of changes—but of higher magnitude—in water cortisol release rates than that previously reported in other fish species.
Stocking density is a well-studied husbandry factor in intensively reared aquaculture species. It is widely accepted that crowding fish at high stocking densities can cause chronic stress, resulting in changes in the growth rate, feeding and social behavior, immune function, and health. Nowadays, it is also recognized that the effects of stocking density on fish welfare are complex, species-specific, and comprising numerous interacting specific factors (like water quality, social interactions, and carrying capacity of the holding environment as well as the spatial and behavioral needs of the particular species).11–13,23
In our study, we tried to identify the merit of specific components of the overall effect of stocking density such as water quality, social behavior (establishment of dominant–subordinate relationships), and available water volume on zebrafish welfare. Our results clearly indicated that the expression of the actual density as number of fish per liter or, in the case of commercially important aquaculture fish species, as kg/m3 is not an appropriate term to describe and compare the physiological and behavioral status of fish under intensive culture conditions. Results showed that when the group and tank size is reduced, even at low stocking density (2–5 fish/L), the maintenance cost is higher than the one at higher densities (10 fish/L ), due to the establishment of territoriality and the formation of dominance hierarchies. In all experiments when male fish were kept at low numbers (<6 individuals) in water volumes of 0.5–2 L, strong dominant–subordinate relationships were established. This is in accordance with studies on other species showing that dominant–subordinate relationships are stronger established at low densities, where territories are easier to defend. 14 In addition, our results showed that when group sizes increased (≥10 fish), social hierarchies were reduced and the group displayed a schooling behavior and lower cortisol concentrations. However, schools of fish need space to express their physiological and behavioral needs and their exposure to inappropriate water volume (<2 L), even at good water chemistry quality, resulted in increased stress. Therefore, it is not poor water quality or crowding per se, but rather a certain number of fish in certain available water volume to fulfill the needs of the particular fish species, eliciting the effects of stocking density on fish welfare.
We also studied the effect of background color on cortisol stress response in zebrafish, as background color experiments are useful tools to study the regulation of physiological color change in ectotherms and to define optimum rearing conditions. Our results showed that zebrafish exposed to light background (green and white) had the highest trunk cortisol concentration, supporting previous behavioral data showing a natural zebrafish preference for a dark environment. 24 The high trunk cortisol concentration indicates that in a white background, short-term (2 h) adapted fish were more stressed than their counterparts exposed to the other backgrounds. Melanophore Stimulating Hormone (α-MSH) is a hormone classically related to skin darkening by causing dispersion of the dendritic melanosomes,25–27 but can also act as a corticotropic hormone involved in the stress response in several fish species.26,28,29 Therefore, it may be that white background stressed zebrafish to release high amounts of α-MSH, overcoming the opposite action of melanocyte concentrating hormones, and keeping melanosomes within the scale and/or hypodermal melanophores in an aggregation state.
In conclusion, zebrafish have a fast cortisol stress response following exposure to acute stressors and return to basal levels within 2 h of poststress. The measurement of water-borne cortisol release rate may serve as a noninvasive and reliable population stress indicator. Adult zebrafish held under experimental laboratory conditions have a preference for a transparent or black background aquarium at a number of 10 individuals per 2 L of available water volume, to express their normal behavior and avoid increased cortisol stress reaction.
Footnotes
Ackowledgments
The study has been carried out partially with financial support by a research grant from the European Community under the seventh Framework Programme (Theme KBBE.2010.1.2-07), “A new integrative framework for the study of fish welfare based on the concepts of allostasis, appraisal and coping styles” (Copewell, 265957). It does not reflect its views and in no way anticipates the Commission's future policy in this area.
Disclosure Statement
No competing financial interests exist.