
Abstract
Abstract
The main objective of this study was to examine the effects of a plant protein- vs. fishmeal-based diet on growth response in a population of 24 families, as well as expression of growth-related genes in the muscle of adult zebrafish (Danio rerio). Each family was split to create two fish populations with similar genetic backgrounds, and the fish were fed either fishmeal (FM diet) or plant protein (PP diet) as the unique protein source in their diets from 35 to 98 days postfertilization (dpf). To understand the effect of the PP diet on gene expression, individuals from three families, representative of the mean weight in both populations, were selected. To understand the effect of familiar variation on gene expression, the same families were evaluated separately. At 98 dpf, growth-related genes Igf1a, Igf2a, mTOR, Pld1a, Mrf4, Myod, Myogenin, and Myostatin1b were evaluated. In males, Myogenin, Mrf4, and Igf2a showed changes attributable to the PP diet. In females, the effect of the PP diet did not modulate the expression in any of the eight genes studied. The effect of familiar variation on gene expression was observed among families. This study shows that PP diet and family variation have effects on gene expression in fish muscle.
Introduction
These changes in fish nutrition affect multiple physiological functions in farmed fish, which are reflected in important production traits such as growth.6–9 Some studies in seabream (Sparus aurata), Atlantic salmon (Salmo salar), and rainbow trout (Oncorhynchus mykiss) reported decreased growth when 50%, 75%, or 100% of the FM in the feed was replaced with PP.6,7,9 However, other studies in rainbow trout showed that FM may be replaced partially by soybean without affecting growth.10,11 One of the greatest challenges is formulating a more herbivorous feed appropriate for a carnivorous fish (such as the salmonids). In recent years, new faces of nutrition have allowed for integration of nutrition and genomics analysis through nutrigenomics approach, which have added to the understanding of the effect of diet on gene expression. 12 Nutrigenomics studies in farmed fish have addressed the replacement of different percentages of FM with PP in the diet. These studies provide interesting insights into the effects of formulated diets on gene expression, especially in the intestine and liver.13–17 However, gene expression in fish muscle has been scarcely documented, despite the fact that this tissue is greatly affected by nutrition and represents about 60% of total fish body weight.6,18 Considering that aquaculture is seriously limited by the reduction in fish meal supply for aquafeed, and that in the coming years the aquaculture could depend strongly on plant protein sources, it is very important to clarify the effect of a plant protein–based diet on gene expression associated with muscle growth. It is also important to consider familiar variability effects on gene expression, because growth is also influenced by genetic components underlying family differences. In nutrigenomics studies, the effect of a plant protein–based diet and familiar variation on gene expression in fish muscle has been scarcely documented. 19 Knowledge of genes associated with growth and modulated by PP diet in fish muscle could help link the gene expression pattern with the growth phenotype.
Several genes associated with growth are conserved among fish, which have been mapped and sequenced in the more important commercial fish. These genes are candidates for studies on gene expression in response to different diets. Among the possible pathways that regulate fish growth is the somatotropic axis, which includes genes such as those for insulin-like growth factor 1 and 2 (Igf1 and Igf2), and target genes that participate in the signal transduction network (mTOR, Pld1a). Furthermore, myogenic regulatory factors (MRFs) (including genes such as Myod, Myogenin, Mrf4, Myf5) also positively influence fish growth.20–22 In contrast, Myostatin (Mstn) acts as a transforming growth factor and negatively influences fish growth. 20 These pathways generate a dynamic balance of positive and negative signals that determine muscular development. 23 Igf1 is involved in the cell cycle process, cell division, mitosis, and protein transport; 22 Igf2 controls skeletal myogenesis and is involved in the AKT/mTOR pathway (the mammalian target of rapamycin). 24 mTOR contributes to the regulation of protein synthesis in hypertrophy and leads to the production of Igf2; 25 Pld1 (phospholipase D1) participates in cell growth regulation and the activation of mTOR through a nutrient-sensing pathway. 26 MRFs are involved in satellite cell activity (the cells that provide the new nuclei required for skeletal muscle during hypertrophic and hyperplasia);27,28 Mstn is a key negative regulator of growth and muscle development.29,30 Identifying genes modulated by plant nutrients in zebrafish contributes to the understanding of physiological and molecular interactions in fish growth, which could shed light on similar processes in aquacultured fish.
We have proposed zebrafish as a model organism for nutritional genomics studies. 31 The advantages of using zebrafish in this area include: 1) Their short generation interval, allowing for performance of growth studies in a shorter time; 2) the ability to control the mating design, as in a fish-farm breeding program; 3) studies can be conducted with a greater number of fish, ideal for a powerful data analysis to evaluate quantitative traits; 4) laboratory rearing conditions are more homogeneous and reproducible than farm-rearing conditions; 5) zebrafish are omnivores and can eat a great variety of foods, including FM- and PP-based diets; and 6) this species has ample genomics information available for application in nutritional genomics studies.
The main objective of this study was to examine the effects of a plant vs. fishmeal protein–based diet on growth response in a population of 24 families and the expression of growth-related genes (Igf1a, Igf2a, mTOR, Pld1a, Mrf4, Myod, Myogenin and Mstn1b) in the muscle of adult zebrafish (Danio rerio).
Materials and Methods
Experimental design
A zebrafish population of 24 experimental families (single pair mating from no related wild-type strains) was generated in order to examine growth response in a population with wide genetic variability. Embryonated eggs were incubated at 28°±1°C for 7 days until hatching in 9 cm diameter Petri dishes (∼100 eggs per Petri dish), according to Brand et al. 32 From 7 to 28 dpf (first step, larval rearing), each family was reared separately in an aerated 4-L container with a density of 25 cm3·fish−1. Larvae were reared under optimum physical and chemical water parameters (25 ≤T°C ≤28.5, 7 ≤pH ≤8; hardness >100 mg CaCO3·L−1) and with a photoperiod of 14 h light:10 h dark 32 (Supplementary Table S1; Supplementary Data available online at www.liebertpub.com/zeb). Larvae were fed ad libitum three times daily (at 9:30, 13:30, and 17:30 h) with a commercial diet: fine powder feed Sera Micron® (50.2% crude protein, 8.1% crude fat, 4.2% crude fiber, and 11.9% ash) and Gold Protein® Micro (49% crude protein, 8% crude fat, 3% crude fiber, and 10.5% ash).
At 30 dpf each family was split to generate two replicates (40 fish per family replicate), and create two populations of fish with similar genetic backgrounds. Forty-eight fish groups were randomly distributed into 48 tanks with 14 L capacity (13×22×48.5 cm). The fish were kept at a density of 350 cm3·fish−1, 33 with recirculated water under optimum physical and chemical water parameters (Supplementary Table S1). The fish were acclimatized to the new system for 5 days and fed the same commercial diet. Starting on 35 dpf, the first replicate of 24 families was fed a diet containing 100% animal protein as the unique protein source (FM control diet), and the second replicate a diet containing 100% plant protein as the unique protein source (PP experimental diet). The fish were fed ad libitum three times daily, six days per week, from larval transition (35 dpf) to sexual maturity (98 dpf) (Fig. 1).

Experimental design:
Experimental diets
Two experimental diets were formulated (Table 1). The control diet was formulated to contain fish meal as the primary protein source, and the experimental diet was formulated to contain soy protein concentrate as the primary protein source. Fish oil was included in both diets. Total lipid level varied between diets (11.5% vs. 7.1%) due to differences in lipid content of the two protein sources. However, both diets contained similar proportions of crude protein (56–57% dry matter [DM]) and similar energy (391–398 cal·kg−1 DM) values, fulfilling the nutritional requirements of zebrafish.34,35
FM, fish meal; PP, plant protein; Ca(H2PO4)2, monocalcium phosphate; IAA, sum of indispensable amino acids; DAA, sum of dispensable amino acids.
As recommended by the NRC (1993). 55
The diets were manufactured by a twin screw extruder at 130°C (Clextral BC 21), produced as 2 mm diameter pellets and vacuum packed in fish oil by a Dinnissen 10VC machine. The pellets were subsequently crumbled and screened to appropriate particle size (350–500 μm). Proximal chemical analysis of the diet was performed according to the following procedures: dry matter was obtained in an oven at 105°C for 24 h, ash by combustion at 450°C for 16 h, protein (N×6.25) by the Kjeldahl method, fat after dicholoromethane extraction by the Soxhlet method, and gross energy by caloric factor (4, 9, and 4 for protein, lipid, and carbohydrate, respectively). Amino acid profiles in diets were determined by liquid chromatography using UV detection, ID-103/AA method. 36
Growth traits measurement
Growth measurements (weight and length) were recorded before the onset of the experimental diet (at 28 dpf) and after experimental feeding (at 70 and 98 dpf). At 28 dpf, a sample of about 20% of the fish (n∼25 fish per family) was used to record initial weight (mg) and length (mm), and these values were used to calculate condition factor (K=W/L−3/100) (total n=607). At 70 dpf (15 fish per family, total n=720), weight gain (ΔW, mg), length gain (ΔL, mm), condition factor (K), and specific growth rate (SGR) were measured. Weight gain and length gain were calculated as the difference between the two recording stages (ΔW [mg]=weight at 70 dpf – initial weight at 28 dpf; ΔL [mm]=length at 70 dpf – initial length at 28 dpf). At the end of the experimental period, 98 dpf growth measurements were taken for all fish (total n=1650). Condition factor was represented as an average at each measured point (28, 70, and 98 dpf). SGR was calculated at 70 and 98 dpf using the following equation: 100%×(ln weight2−ln weight1)/t, where t is the number of experimental days. The fish were fasted for 24 h prior to every sampling event. Each fish was weighed (mg) using a scale with a precision of 0.001 g (Acculab VI-3 mg), and length (mm) was measured from mouth to caudal peduncle using digital photography and image analysis software (TPSdig2 v2. 12). 37
Muscle samples
At 98 dpf, when the fish reached sexual maturity, all fish were sacrificed and sexed. Gender was determined by examination of external secondary sexual characteristics, including anal fin and ventral body surface coloration (yellow in males) and body shape (rounded belly in females). 33 Gender was confirmed by observation of the gonads using a stereoscopic microscope, Nikon model SMZ-10. A muscle sample was stored in an RNAlater® at −80°C until RNA extraction for gene expression analysis. All animal-handling procedures were approved by the Committee of Animal Bioethics at INTA (Instituto de Nutrición y Tecnología de los Alimentos) at the University of Chile.
Selection of individuals for gene expression analysis
Gene expression analysis was performed at the end of the experimental period (∼98 dpf) in order to link it with growth phenotype in response to PP diet. In order to evaluate more clearly the PP diet effect on gene expression, the families were selected according three criteria: 1) Family with a mean weight representative of the mean weight gain in each population; 2) family with an approximately 1:1 male-to-female ratio; and 3) family meeting the criteria 1 and 2 present in both populations (FM vs. PP diet). These considerations allowed us to avoid the potential confounding effects of diet on gene expression with body weight variation and genetic family variation. For gene expression analysis, three males and three females of each family were used.
RNA extraction
Total RNA was extracted from the muscle of each individual fish. The muscle tissue was homogenized in Trizol® (Invitrogen) following the manufacturer's protocol and using a homogenizer (BioSpec Model 9853G XL). Samples were subjected to electrophoresis on 2% agarose gels to confirm the integrity of the 28S and 18S rRNA bands. RNA quality was measured by a spectrophotometer (UV 1601, Shimadzu) through an absorbance ratio of 260 nm (A260)/280 nm (A280); values between 1.8 and 2.1 were accepted. 38 RNA concentration was determined by absorbance using the equation (μg·mL−1): A260×40 μg·mL−1×dilution factor (total volume/RNA volume). All samples were treated with DNAse I (Fermentas®) following the manufacturer's protocol to remove possible genomic DNA contamination.
First strand cDNA synthesis
cDNA was generated from 2 μg of total RNA using the Maxima™ First Strand cDNA Synthesis Kit for reverse transcriptase polymerase chain reaction (RT-PCR) (Fermentas®) following the manufacturer's protocol. In all cases, a reverse transcriptase minus (RT−) negative control was used to test for genomic DNA contamination. The product of the first strand cDNA synthesis was stored at −80°C until the quantitative RT-PCR (qRT-PCR) runs.
Primers design
Published primers were used to quantify Myod, Myogenin, Mrf4, Mstn1b, and Igf1a,39,40 and new primers for Igf2a, mTOR, Pld1a were designed using AmplifX 1.4.0.Three reference genes, β-actin, eukaryotic elongation factor 1α (Ef1-α), and ribosomal protein L13α (Rpl13-α) were used (Supplementary Table S2). 41 Primer sequence qualities were evaluated for possible secondary structures using Integrated DNA Technologies (IDT) tools (www.idtdna.com/analyzer/Applications/OligoAnalyzer), and similar melting temperatures between 58–60°C were used. The gene transcript sequences were retrieved from the Ensembl databases, and the exons for each zebrafish gene were identified. The sequences from other fish and from mRNA of zebrafish reference genes were aligned using CLUSTALW to confirm the reading frame of each exon. Amplicon lengths used ranges between 50 and 151 base pairs for each gene. The specificity of the primers was checked using the Basic Local Alignment Search Tool (BLAST) and confirmed by conventional PCR from cDNA.
Real-time RT-PCR
Real-time PCR was performed with an ABI 7300 Real-Time PCR system using Maxima® SYBR Green/ROX qPCR Master Mix (2X) (Fermentas®) following the manufacturer's protocol. PCR reactions were set up using 160 nmol of each primer for Mstn1b; 300 nmol for Mrf4 and mTOR; 400 nmol for Myod, Myogenin, Igf1a, Igf2a, Pld1a, and Ef1α. β-actin and Rpl13α were set up using 200 nmol of primer. Two μl of 10-fold diluted cDNA in a reaction volume of 25 μL were used. PCR was run with a 10-min activation and denaturation step at 95°C, followed by 40 cycles of 15 s at 95°C, 30 s at 60°C, and 30 s at 72°C. Specificity of the reactions was verified using melting curve analysis and absence of primer dimmer. Standard curves were obtained for each cDNA template by plotting Ct values against the log10 of five different dilutions of a cDNA mix solution of all samples analyzed. Real-time PCR efficiency (E) was calculated from a standard curve according to the equation E=10(−1/slope). 42 All amplifications had a PCR efficiency value of approximately 1.9. The relative expression levels of data from the three potential housekeeping genes in muscle tissue of males and females subjected to the two experimental diets were entered into the GeNorm program to calculate gene expression stability values. 43 Two reference genes, Ef1α and Rpl13α, were more stable for males, and β-actin and Rpl13α were more stable for females. These genes were selected as endogenous control genes in each sex, and zebrafish fed with FM diet were used as calibrators.
Statistical analysis
At 28 dpf, initial weight, length, and condition factor were analyzed by one-way analysis of variance (ANOVA) with Student–Newman–Keuls's multiple comparison test (SNK) to compare growth variability among families fries (significance level α=0.05). At 70 and 98 dpf, the data were analyzed by two-way analysis of variance (ANOVA) with SNK to evaluate fixed effects (diet, family, and gender) using the SPSS V8.0 GML procedure (SPSS, 1998). 44 For gene expression analysis, a Mann–Whitney test was used to determine significant differences between treatments (FM diet vs. PP diet) and among families, using a significance level of 0.05.
Results
Growth traits in populations of zebrafish fed with FM and PP diet
Fish had an initial weight, length, and condition factor of 1.62±0.03 mg, 5.27±0.03 mm, and 1.10±0.02, respectively (n=607). At 70 dpf, fish fed with the FM diet (n=349) had significantly greater ΔW (66.61±1.69 mg vs. 42.11±1.10 mg), ΔL (9.95±0.12 mm vs. 8.66±0.12 mm), K (1.78±0.01 vs. 1.51±0.01), and SGR (8.65±0.07 vs. 7.59±0.07) than fish fed with the PP diet (n=342) (p<0.01). At 98 dpf, growth in males fed with the FM diet reached greater ΔW (159.84±2.0 mg vs. 126.32±2.0 mg) than males fed with PP diet (p<0.01). Females fed with the FM diet reached greater ΔW (198.71±2.7 mg. vs. 149.88±3.23 mg) than females fed with the PP diet (p<0.01). The same trend of higher values for ΔL, K, and SGR was observed in fish fed the FM diet compared to PP diet when fish were classified according to sex, as shown in Table 2. At 98 dpf, males fed with the FM diet had 27% higher weight gain (+34 mg) than males fed the PP diet, and females fed the FM diet had a 33% higher weight gain (+48.8 mg) compared with those fed the PP diet.
Indicates significant differences between treatments (p<0.01)
Variability of growth among 24 experimental families
Family variations in body weight at different stages are plotted in Figure 2. Figure 2A shows the median weight in each family at 28 dpf, 25–75% quartile, and maximum and minimum values ordered from lowest to highest values. Figure 2B shows the median weight gain in each family at 70 dpf. Figures 2C and D show the median weight gain, separately by sex, in each family at 98 dpf. In all cases, the families were ordered from lowest to highest body-weight values on the FM diet; as shown, there were important changes in family rankings. Additionally, statistical differences among families at 28 dpf (p<0.01) for mean initial weight are presented in Supplementary Table S3. At 70 dpf the statistical analysis showed significant differences in mean weight gain by diet and family (p<0.01) (Supplementary Table S4). The statistical analysis also showed significant differences in mean weight gain by diet, family, and sex (p<0.01) and are presented for males and females in Supplementary Tables 5 and 6, respectively. In general, Figure 2B–D shows that to 70 and 98 dpf, the families fed FM or PP diet did not maintain their initial weight rankings from 28 dpf (Fig. 2A). This clearly indicates that each family showed an individual growth response according to the diet provided.
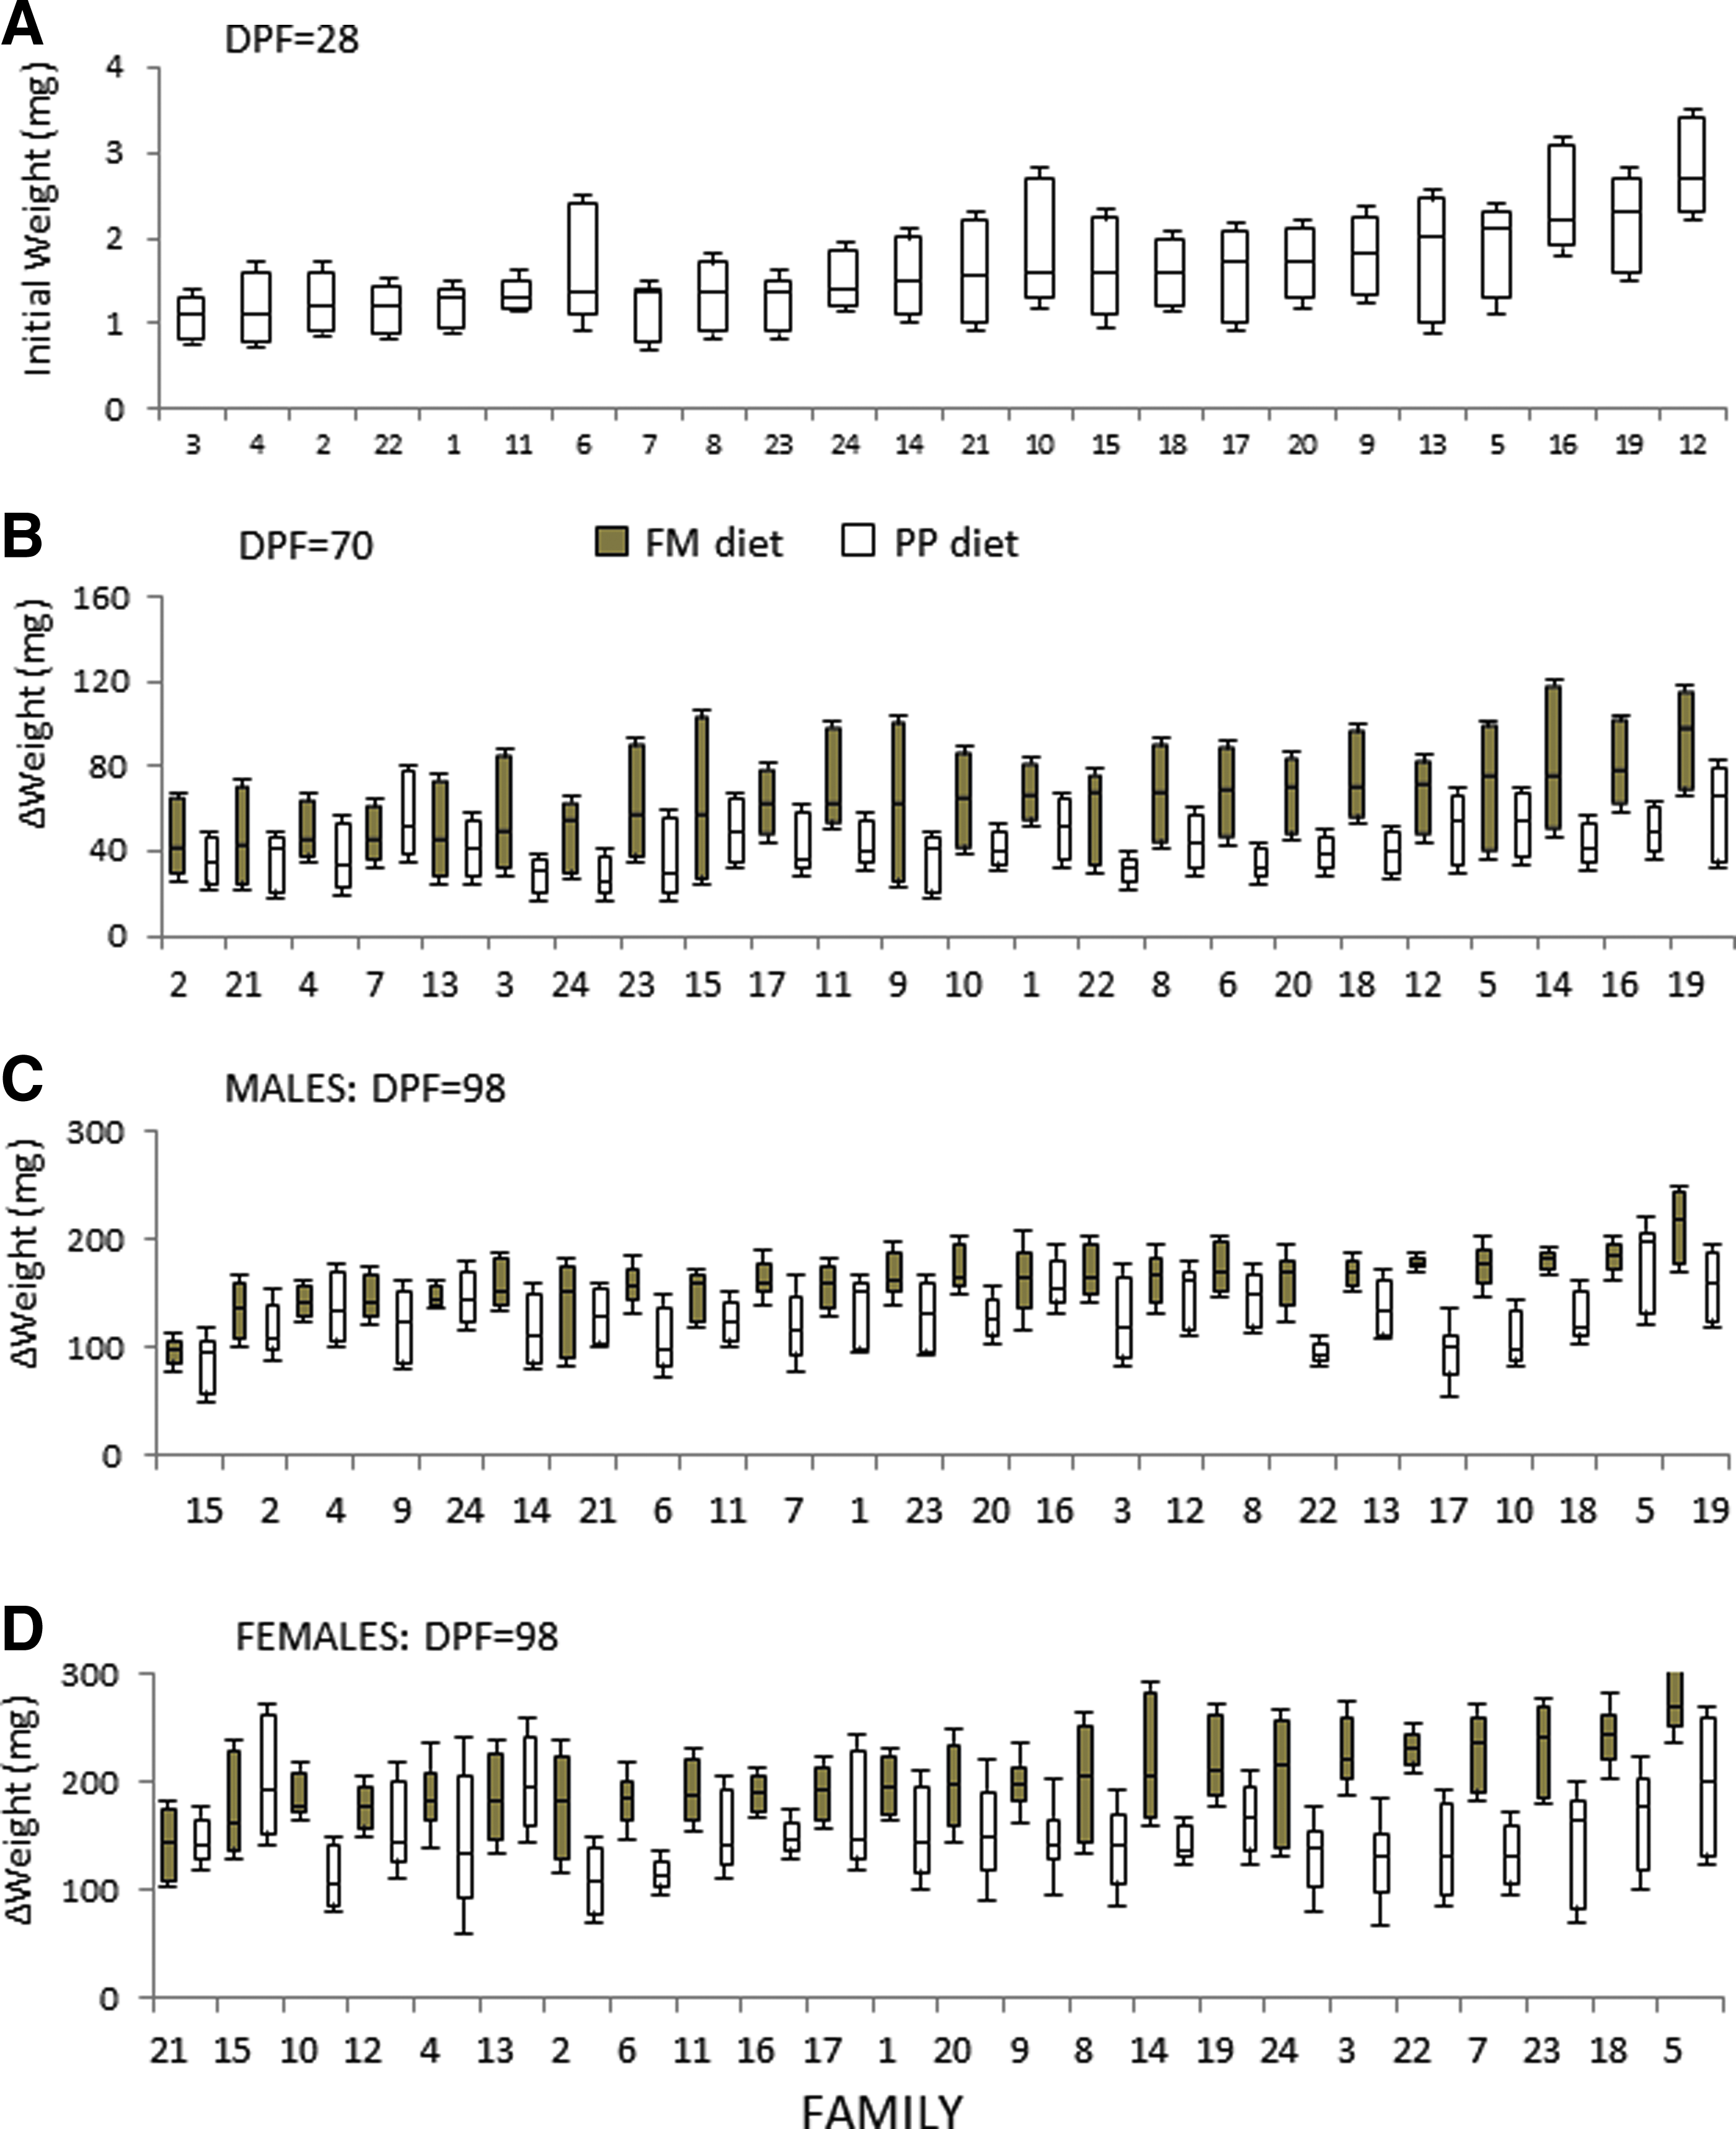
Growth variability among 24 families at 28, 70, and 98 dpf. Box and whisker plots are shown (median, 25–75% quartile, maximum, and minimum value).
Selection of families for gene expression analysis
From 24 families, only three families (4, 7, and 23) met the three criteria in both populations (see Materials and Methods section). The other families failed to meet at least one of the three criteria and therefore were not considered for gene expression analysis.
Table 3 shows the mean weight in each family selected for gene expression analysis as well as the values in males and females selected within each family (mean±SE). In total, nine males and nine females were selected in each population (3 males and 3 females per family).
Gene expression in muscle of zebrafish fed FM and PP diets
In order to evaluate the effects of PP diet on gene expression, data analysis was performed for all individuals from three selected families separately by sex. Males fed the PP diet showed a significant overexpression (p<0.05) in Myogenin (X5.0±0.67) and Mrf4 (X3.42±0.56) as compared with gene expression of males fed the FM diet, whereas Igf2a was underexpressed (X0.71±0.09) (Fig. 3A). The other genes studied (Igf1a, Mstn1b, mTOR, Pld1a, Myod) did not show significant differences in gene expression by diet in males (Fig. 3A). In females, there were no statistical differences in gene expression by diet for any of the eight genes studied (Fig. 3B).
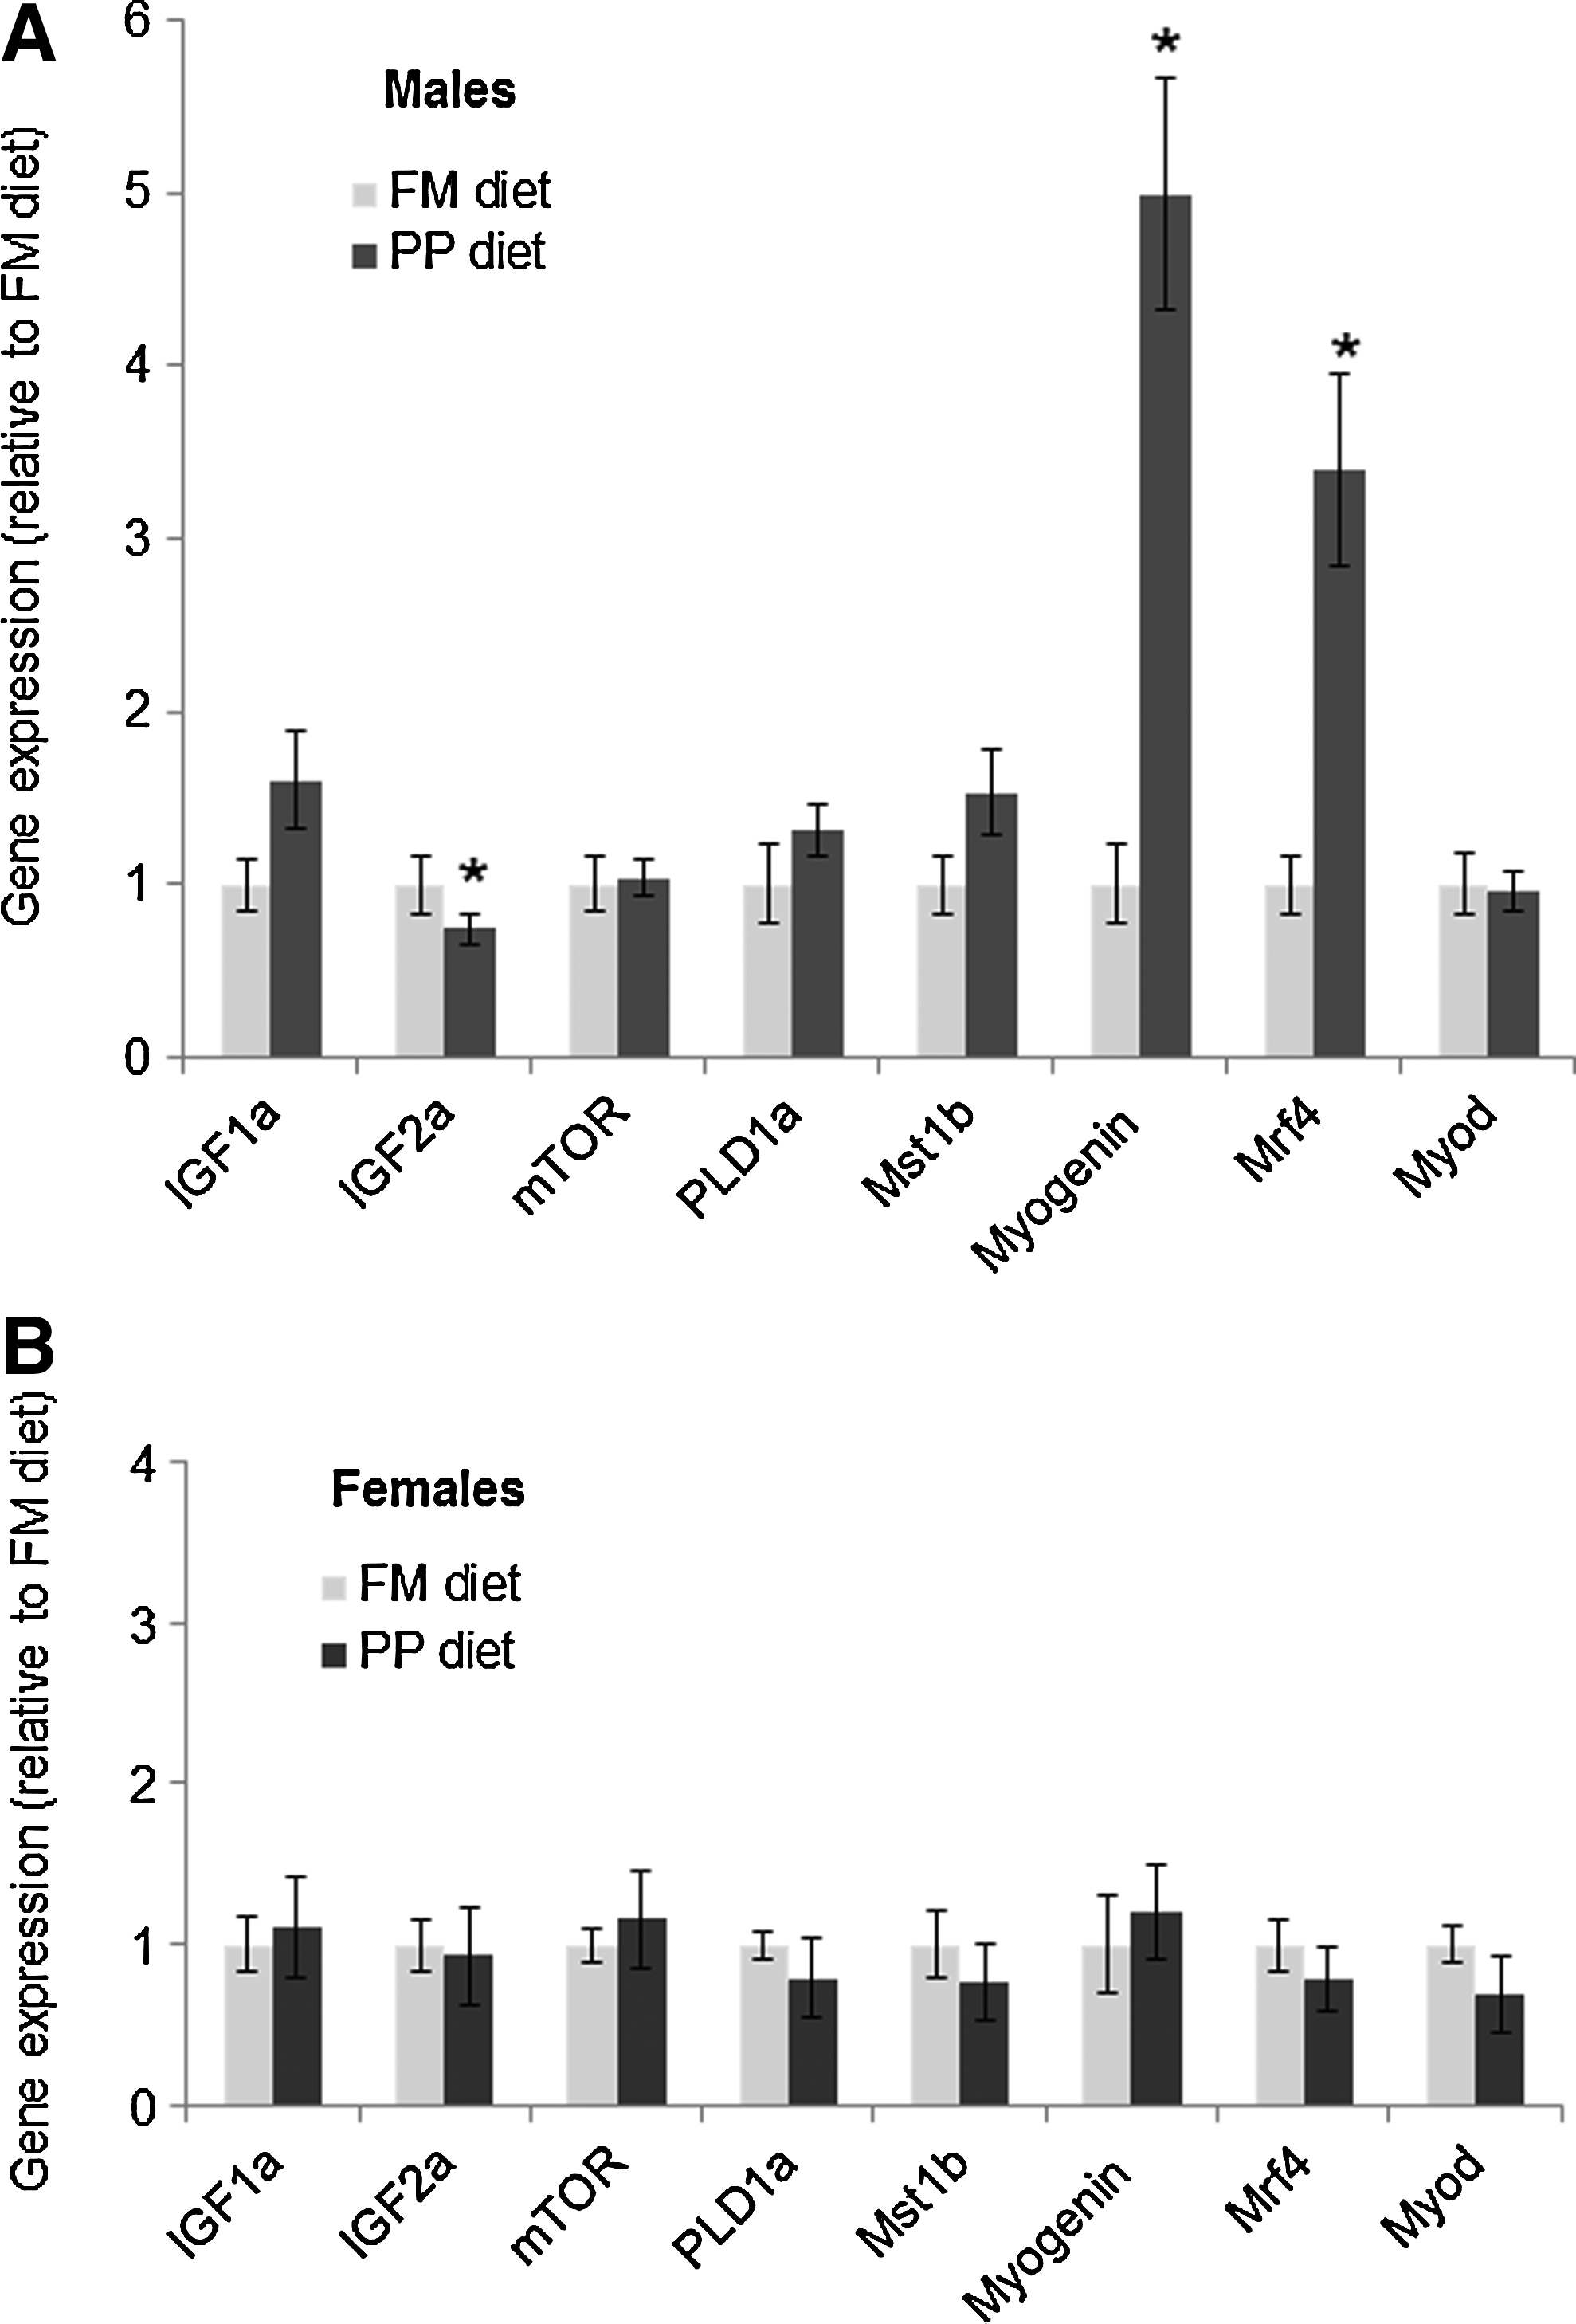
Gene expression in muscle of males and females fed the FM and PP diets.
Gene expression between families of zebrafish fed FM and PP diet
In order to evaluate the effect of family variation on gene expression, the three families were evaluated separately between treatments (FM diet vs PP diet). In males, mRNA levels of Myogenin and Mrf4 were significantly higher in all three selected families (number 4, 7, and 23) fed with PP diet as compared with FM diet (Fig. 4A and B). Igf2a expression was decreased in all families fed with PP diet, but only one family (23) showed a significant difference by diet (Fig. 4C). Igf1a and Pld1a expression was significantly increased in family 4 in response to PP diet (Fig. 4D and E), and Mstn1b was significantly increased in families 4 and 23 (Fig. 4F). In females, Igf1a, Myogenin, mTOR, and Myod expression was significantly increased in family 23 in response to PP diet (Fig. 5A–D), whereas Pld1a expression showed was significantly decreased in family 4 in response to PP diet (Fig. 5E).

Gene expression in muscle of males among three families. Real-time PCR quantification of Myogenin, Mrf4, Myod Igf2a, Igf1a, Pld1a, Mstn1b, Myod, and mTOR in the muscle of males. Bars indicate the mean and standard error of nine data points (three biological samples per family×3 replicate). Significant differences indicated with (*) were determined using the Mann-Whitney test (p<0.05).
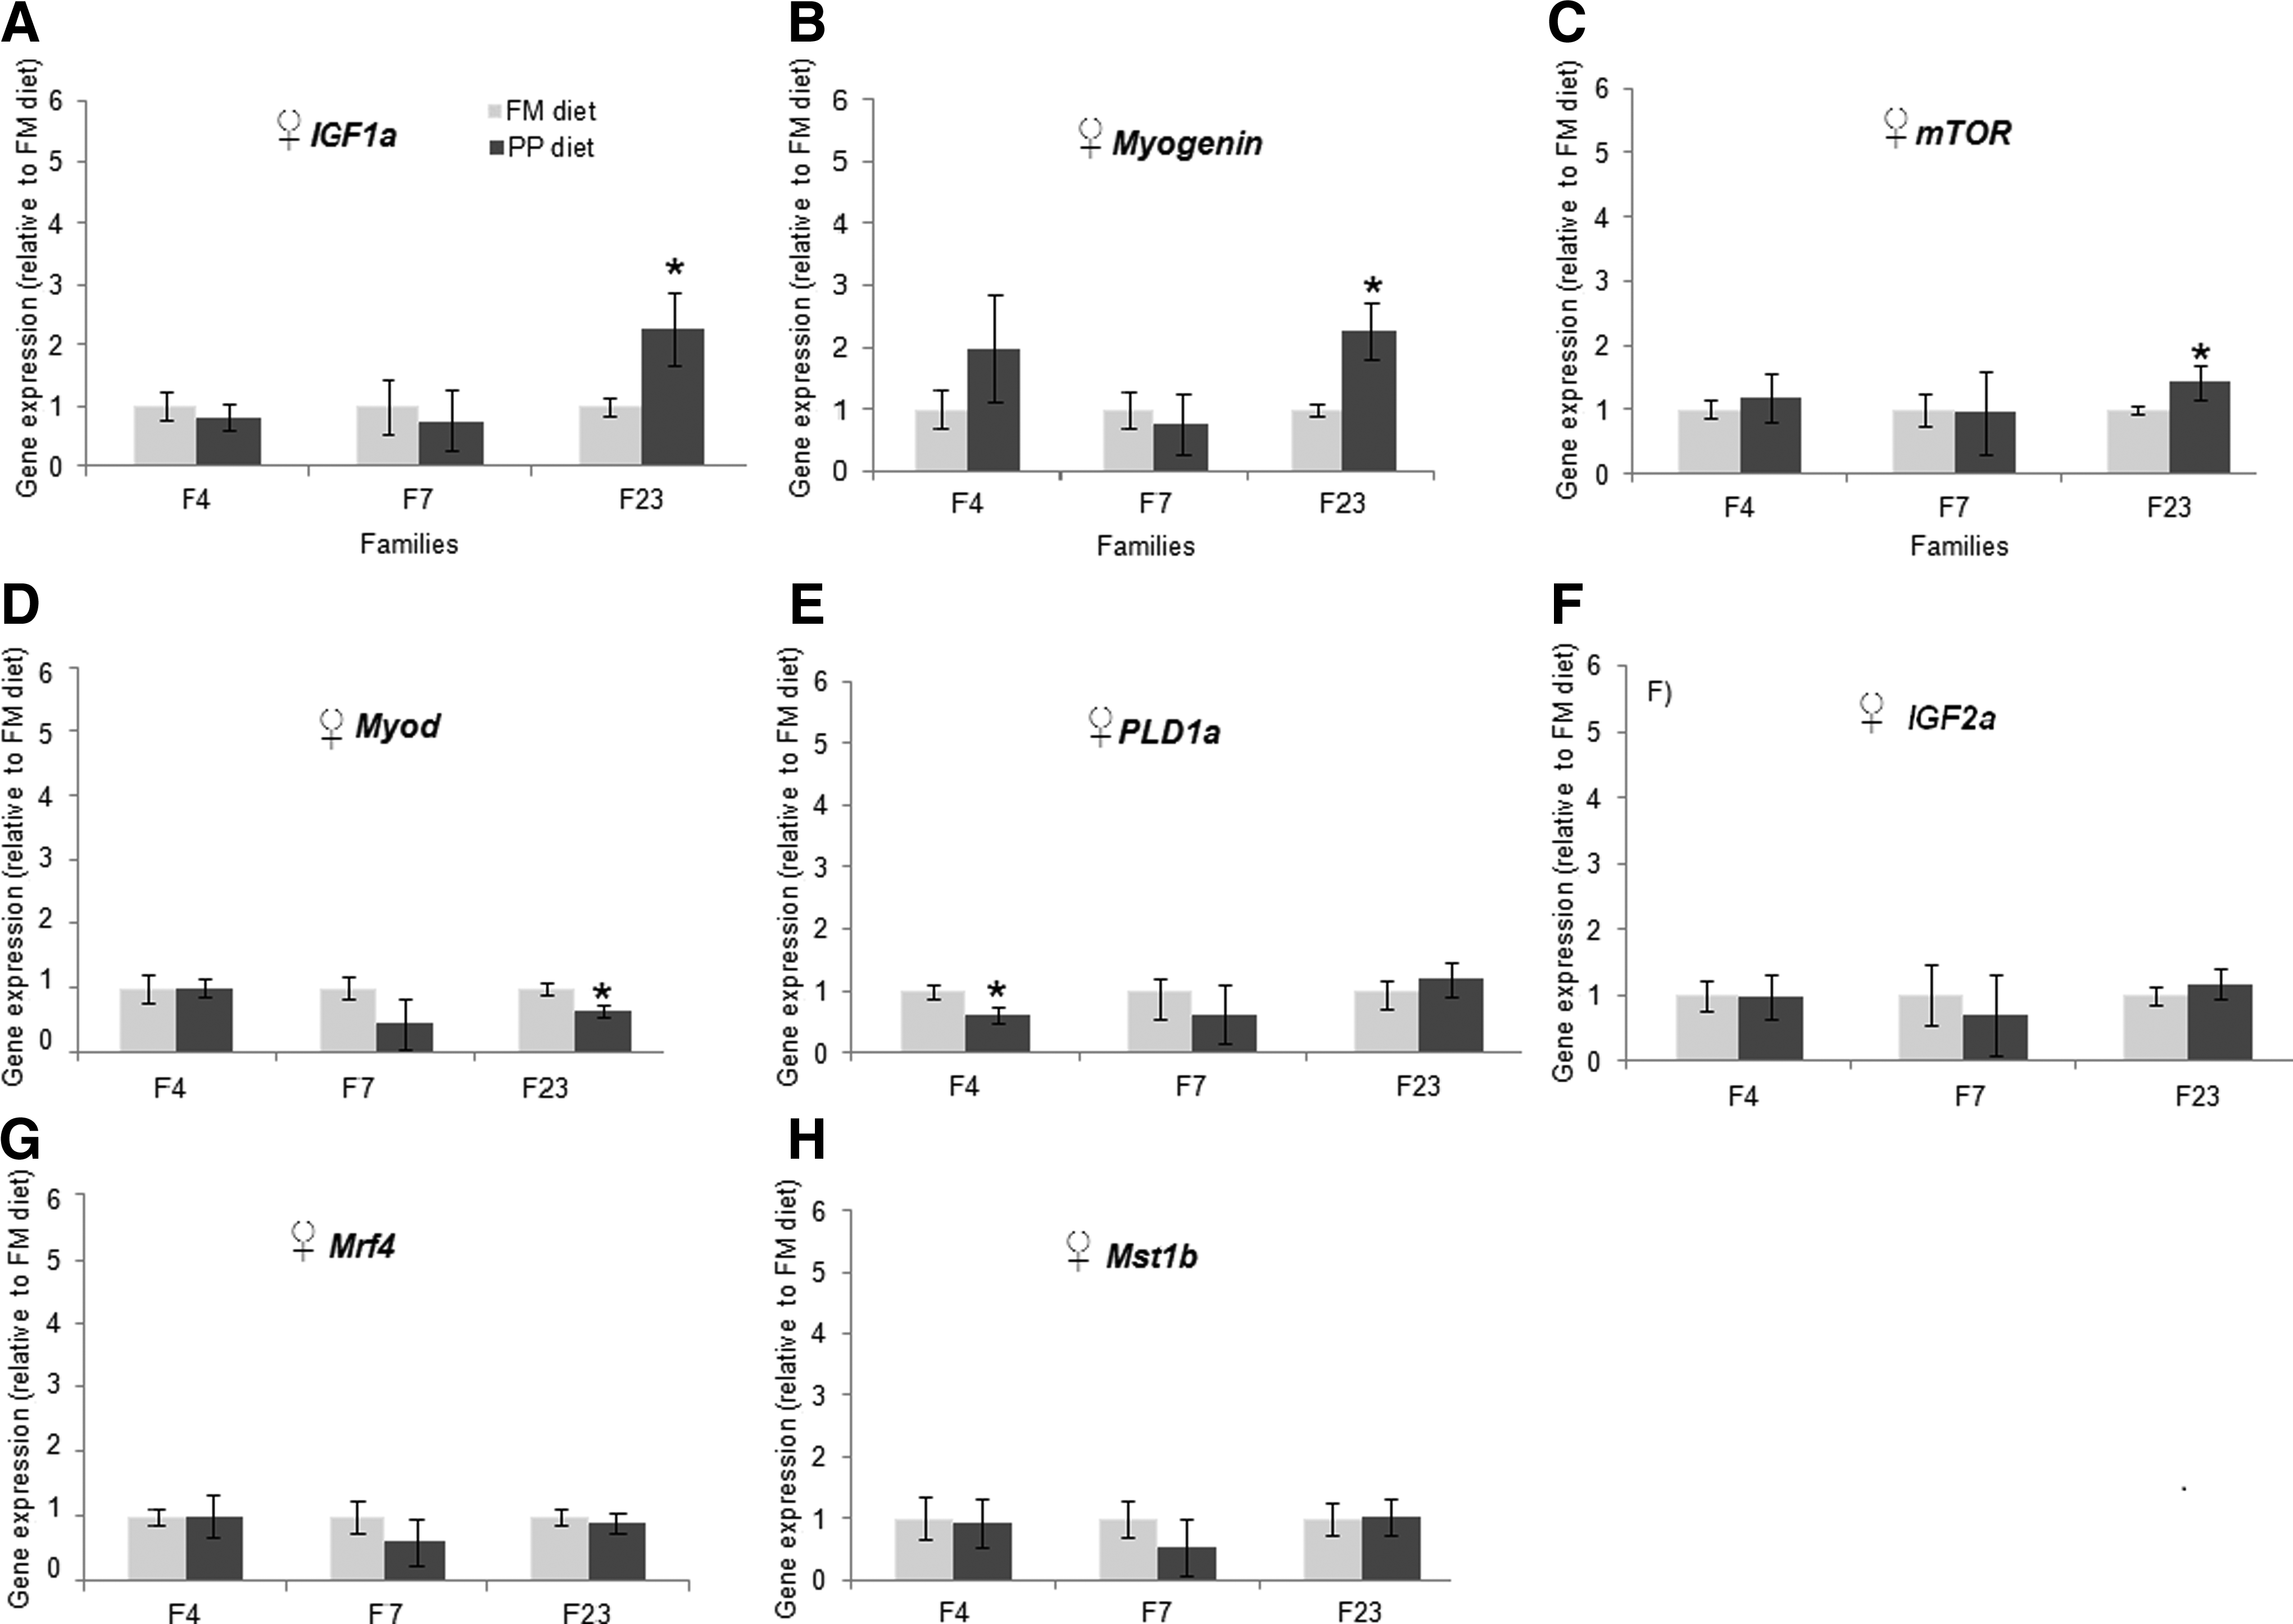
Gene expression in the muscle of females among three families. Real-time PCR quantification of Igf1a, Myogenin, mTOR, Myod, Pld1a, Igf2a, Mrf4, and Mstn1b in the muscle of females. Bars indicate the mean and standard error of nine data points (three biological samples per family×3 replicate). Significant differences indicated with (*) were determined using Mann-Whitney test (p<0.05).
Discussion
Growth in zebrafish fed FM and PP diets
This study demonstrated that a PP diet reduces zebrafish growth as compared with an FM diet. At 70 and 98 dpf, growth measurements (weight gain, length gain, condition factor, and SGR) were significantly higher for fish fed with FM compared to those fed with PP. These results could be compared with findings in other studies in zebrafish fed with different formulated diets. For example, Robison et al. 33 demonstrated that manipulation of dietary carbohydrate levels (0, 15, 25, and 35%) had a significant effect on body weight and condition factor. In another study, zebrafish were fed different sources of plant protein (soy bean+corn genetically modified [GM] and non-GM). Fish fed with GM corn exhibited significantly better growth as compared to fish fed with non-GM corn. 45 Our results can also be compared to studies in farmed fish fed with different percentages PP replacement of FM. Our results are consistent with findings in common carp (Cyprinus carpio), Nile tilapia (Oreochromis niloticus), and rainbow trout, which showed a marked reduction in growth when 6–19 g alevins were fed a diet of 75–100% FM replacement.6,46–49 In this study, growth traits were evaluated in zebrafish from fry to adult stages (28 to 98 dpf) in both populations with similar genetic backgrounds and optimum environmental parameters for rearing zebrafish (Supplementary Table S1). Therefore, the results reveal that the differences may be attributed principally to different protein sources in the diets (FM diet vs. PP diet). The decreased growth in zebrafish fed a PP diet could be related to antinutritional factors in the plant protein diet (wheat, corn, and soy concentrate), as well as limited availability of essential amino acids such as arginine (2.9%), lysine (2.5%), and methionine (0.7%). Farmed fish in general have shown a marked reduction in growth when fed a diet high in plant protein (75–100% of the diet) during the first growth stage (initial weight of 6–19 g).6,46–49 However, juvenile rainbow trout (70–83 g) showed similar growth when they were fed high replacement of FM (66–100%) with soy protein concentrate.10,11 In the present study, the growth traits in zebrafish were evaluated during a long period (9 weeks, considering the zebrafish life cycle). It is possible that larval zebrafish were not able to utilize plant protein diets, as occurred in rainbow trout during the first growth period.
Familiar variation in zebrafish growth
Differences at 28 dpf in initial weight among offspring of different families were likely the product of family genetic differences within the population (Fig. 2A). However, at 70 and 98 dpf, there were considerable weight differences in fish between diets. Although individuals in each family were full sibs sharing similar genetic components in both treatments, the weight differences among fish fed the FM diet was much broader than fish fed the PP diet (Fig. 2B). This clearly indicates that each family showed a particular growth in response to diet at 70 and 98 dpf. These observed differences among families within a treatment can be attributed to genetic components underlying each family. Von Hertell and colleagues studied the genetic variability of growth in 118 full-sib families of four zebrafish populations from different origins (Europe and Asia). 50 Within populations, significant differences among families were observed for weight, and heritability ranged from 0.17 to 0.41. Heritability estimates of growth in the main aquacultured fish species (salmon, trout, tilapia, and carp) are in the same range (from 0.2 to 0.41). 51 Considering that growth traits have high heritability, this study suggests that both the genetic component and diet should be considered when performing gene expression analysis in nutritional genomics studies associated with growth.
Plant protein-based diet modulates the expression of Igf2a, Myogenin, and Mrf4 in the muscle of zebrafish males
These results show that Igf2a, Myogenin, and Mrf4 were regulated by plant nutrients in the muscle of zebrafish males. The somatotropic pathways, including genes such as those for endocrine growth hormone and Igf1 and Igf2, positively influence fish growth and are known to play a key role in the regulation of metabolism and physiological processes. 22 A 29% difference in Igf2a mRNA levels in the muscle of males fed the PP diet was shown, as compared to fish fed the FM diet (Fig. 3A). This Igf2a expression pattern could be explained by lower lysine levels in the PP diet as compared to the FM diet (2.5 vs. 4.2 respectively), as has been shown in Atlantic salmon when fish fed low lysine (2.9 g/16 g N) showed a 2.6-fold decrease in Igf2 mRNA levels compared to those fed with medium lysine levels (4.9 g/16 g N). 52 Myogenin (X5.0±0.67) and Mrf4 (X3.42±0.56) were overexpressed in fish fed a PP diet as compared to the FM diet (Fig. 3A). The nutritional regulation of these kinds of genes in muscle is poorly documented in fish. A single report in rainbow trout showed that substitution of FM with graded levels of PP (50%, 75%, 100% replacement) in diets did not modify the expression of Myogenin in fish muscle. 6 However, a comparison with our results might not be appropriate because the experimental designs were different in these two species. In this study, the fish were homogeneous in genetic background between treatments and homogeneous in growth, close to the mean in each population, which allows a clear evaluation of the PP diet's effect on gene expression. On the other hand, the over-expression of Myogenin and Mrf4 in fish fed PP diet could be due to different processes involved in muscle growth (hypertrophy and hyperplasia) in fish21,53. Although fish were chosen from the average growth in each population, mean weight was different between diets (Table 3). These differences in body weight between treatments could also contribute to modulating the gene expression of Myogenin, Mrf4, and Ifg2. In order to clarify this point, an additional analysis of gene expression was performed in our experiment. At 98 dpf, from males within the population fed the PP diet (n=440), 5% of fish from both extremes of the growth curve distribution were selected (thereafter, “low growth” and “high growth”). Gene expression comparisons among eight fish with low growth (52±8 mg ♂) and high growth (228±25 mg ♂) showed that Myogenin was over-expressed (X3.22±0.21) in males with low growth as compared to high growth (p<0.05), whereas Mrf4 and Igf2a did not show differential expression by growth (figures not shown). The increased mRNA levels of Myogenin could be explained by the participation in proliferation and fusion of satellite cell (cells that provide the new nuclei required for skeletal muscle hypertrophy), which may be more active due to possible regeneration of muscle in low-growth fish compared to high-growth fish. Therefore, our results suggest that the higher gene expression of Myogenin could be also in response to decreased growth in fish fed the PP diet. In contrast, transcription levels of Mrf4, as well as the decreased expression of Igf2 in fish muscle, could be induced principally by nutrition.
The other genes studied—Myod, Igf1a, mTOR, and Pld1a—did not show significant differences in gene expression between diets in zebrafish (Fig. 3A). In relation to the last two genes, there is evidence in the mouse that mTOR is regulated by Pld1 through a nutrient-sensing pathway including the leucine amino acid.25, 26 In our study, the similar leucine level in both diets (4.1% in the FM diet vs. 4.9% in the PP diet) could explain the absence of significant difference in Pld1 mRNA levels, suggesting that mTOR expression was not modified. However, the potential role of Pld1 as an upstream regulator of mTOR has not been examined in fish. In females, there were no significant differences in mRNA level expression in any of the eight genes studied (Igf1a, Igf2a, mTOR, Pld1a, Mstn1b, Myogenin, Mrf4, Myod) by diet (Fig. 3B). The presence of sexual dimorphism in gene expression has been also described in zebrafish liver and brain.33,54 However, our results show that even when all eight genes were expressed in the muscle of males and females, differential expression of Myogenin, Mrf4, and Igf2a in response to the PP diet was remarkable only in males.
Familiar effect on gene expression in muscle of zebrafish fed a PP diet vs. FM diet
In order to evaluate the familiar effect on gene expression, the data were analyzed for each family separately. In males, Myogenin and Mrf4 were overexpressed in response to PP diet in all three families selected (Fig. 4A and B). This suggests that the PP diet affected the modulation of Myogenin in the three families irrespective of the differences in genetic background among families. On the other hand, some genes (Igf2a, Igf1a, Pld1a, and Mstn1b) were differentially expressed in families 4 and 23 (Fig. 4C–F). Additionally, in females, the same families (4 and 23) showed differential expression in other genes (Igf1a, Myogenin, Myod, mTOR, and Pld1a) between treatments (Fig. 5A–E). These results suggest that differences in gene expression may be influenced not only by nutritional components but also by genetic differences underlying each family. These results could indicate that the gene expression of individuals from families 4 and 23 (both males and females) were more affected by PP diet. Therefore, it is important to consider different sources of variation to explain modulation of gene expression in nutrigenomics studies. Along the same lines, a recent study evaluated separately the effect of diet and familiar variation on liver transcriptome in Atlantic salmon that were fed a vegetable oil–based diet. Diet modulated the expression of genes regulating metabolism, especially those for lipid and carbohydrate, as well as immune response. 19 Genetic differences among families modulated signaling pathways and had a lower impact on metabolism-related genes. 19 Our study of zebrafish also showed that the PP diet and family variation produced separate effects on the modulation of gene expression related to growth in fish muscle. This approach using zebrafish as a model could be useful to evaluating the whole transcriptome in zebrafish and identifying metabolic pathways affected by plant nutrients in muscle and compare this result with other commercial fish by comparative genomics.
Authors' Contributions
P.E.U. was responsible for project development; conceived the experimental design; performed all experimental procedures, primer design, and quantitative RT-PCR; integrated the data; and drafted the manuscript. A.A.P. contributed to analysis of the gene expression data. C.D.L. reared the fish and contributed to tissue collection. C.A. contributed to the experimental design and participated in the statistical analysis and writing of the manuscript. P.I. contributed to the experimental design and supervised the study. R.N. contributed to the experimental design and supervised the study. J.F.M. contributed to data interpretation, critical revisions of the intellectual content, and various revisions of the manuscript. All authors read and approved the final manuscript.
Footnotes
Acknowledgments
We acknowledge Stephen Gunther for the formulated diets, Alex Cabrera for manufacturing the diets, and Claudio Perez for valuable technical assistance in RT-PCR procedures. We also want to thank Natalia Lam, Jurij Wacyk, and Andrea Bravo for valuable assistance in data and tissue collection. The first author received a doctoral fellowship from the Consorcio Empresarial de Genética y Desarrollo Biotecnológico para la Industria Salmonera (Aquainnovo S.A). This work was supported by a fellowship of Apoyo a la Realización de Tesis Doctoral, from Conicyt AT-24091052 and Aquainnovo S.A. P.E.U. wishes to thank the research group of the Laboratory in Genetic and Biotechnology in Aquaculture at the Universidad de Chile where the fish were reared and the Research Group of the Animal Genomic Laboratory at the University of California Davis.
Disclosure Statement
No competing financial interests exist.
References
Supplementary Material
Please find the following supplemental material available below.
For Open Access articles published under a Creative Commons License, all supplemental material carries the same license as the article it is associated with.
For non-Open Access articles published, all supplemental material carries a non-exclusive license, and permission requests for re-use of supplemental material or any part of supplemental material shall be sent directly to the copyright owner as specified in the copyright notice associated with the article.