
Abstract
Abstract
The zebrafish, a model organism for which a plethora of molecular and genetic techniques exists, has a lifelong replacing dentition of 22 pharyngeal teeth. This is in contrast to the mouse, which is the key organism in dental research but whose teeth are never replaced. Employing the zebrafish as the main organism to elucidate the mechanisms of continuous tooth replacement, however, poses at least one major problem, related to the fact that all teeth are located deep inside the body. Investigating tooth replacement thus relies on conventional histological methods, which are often laborious, time-consuming and can cause tissue deformations. In this review, we investigate the advantages and limitations of adapting current visualization techniques to dental research in zebrafish. We discuss techniques for fast sectioning, such as vibratome sectioning and high-resolution episcopic microscopy, and methods for in toto visualization, such as Alizarin red staining, micro-computed tomography, and optical projection tomography. Techniques for in vivo imaging, such as two-photon excitation fluorescence and second harmonic generation microscopy, are also covered. Finally, the possibilities of light sheet microscopy are addressed.
Introduction
C
The zebrafish is a polyphyodont organism, meaning that the dentition is replaced continuously throughout life. Similar to other cyprinid fishes, 5 the dentition in zebrafish is characterized by lifelong replacing teeth that are positioned on the fifth ceratobranchials, also termed pharyngeal jaws. It consists of three tooth rows: a row with five ventral teeth, a row with four mediodorsal teeth, and a row with two dorsal teeth, symmetrically arranged on each side of the body. 6
The first tooth develops at the fourth position in the ventral tooth row and is visible as an early morphogenesis stage germ at 48 hours postfertilization (hpf). The first replacement tooth forms at the same position at around 80 hpf, that is, long before the ventral tooth row is completed at around 16 days postfertilization (dpf). Teeth constantly renew, forming from an epithelial outgrowth called the successional lamina that is attached to the epithelial crypt of the predecessor tooth. 7 The successional lamina thickens in the early morphogenesis stage, re-invaginates, and forms a bi-layered bell-shaped structure, consisting of an outer and an inner epithelial layer, during the late morphogenesis stage. The differentiation of preameloblasts and preodontoblasts marks the stage of early cytodifferentiation. Once the stage of late cytodifferentiation is reached, the deposition of the enameloid and dentin matrix at the tooth tip begins. Eventually, the tooth will ankylose to the underlying pharyngeal jaw. 8
A functional tooth is formed by orthodentine surrounding a pulp cavity, covered by a hypermineralized cap of enameloid. The pulp cavity of the teeth of adult zebrafish is rich in nerves and blood vessels. At the age of around 26 days, the dentition is fully established and every tooth is replaced every 8–12 days, at least in juveniles. 6
To examine the mechanisms of replacement tooth formation in zebrafish, and to take full advantage of the set of 22 cycling teeth (11 on each body side), it is thus advisable to work with animals older than 26 days. Still, at this age, the fish have a standard length that can vary greatly, with a maximum of around 10 mm. Tooth sizes vary according to body size. 9 For example, in a 26-day-old fish with a standard length of 6.1 mm, the tooth is around 100 μm tall, while the tooth base has a diameter of approximately 20 μm. In such a specimen, the fifth ceratobranchials are positioned relative to the surface of the operculum at a distance of around 450 μm, which is reduced by one half to 220 μm when measured between the surface of the gills and the fifth ceratobranchials.
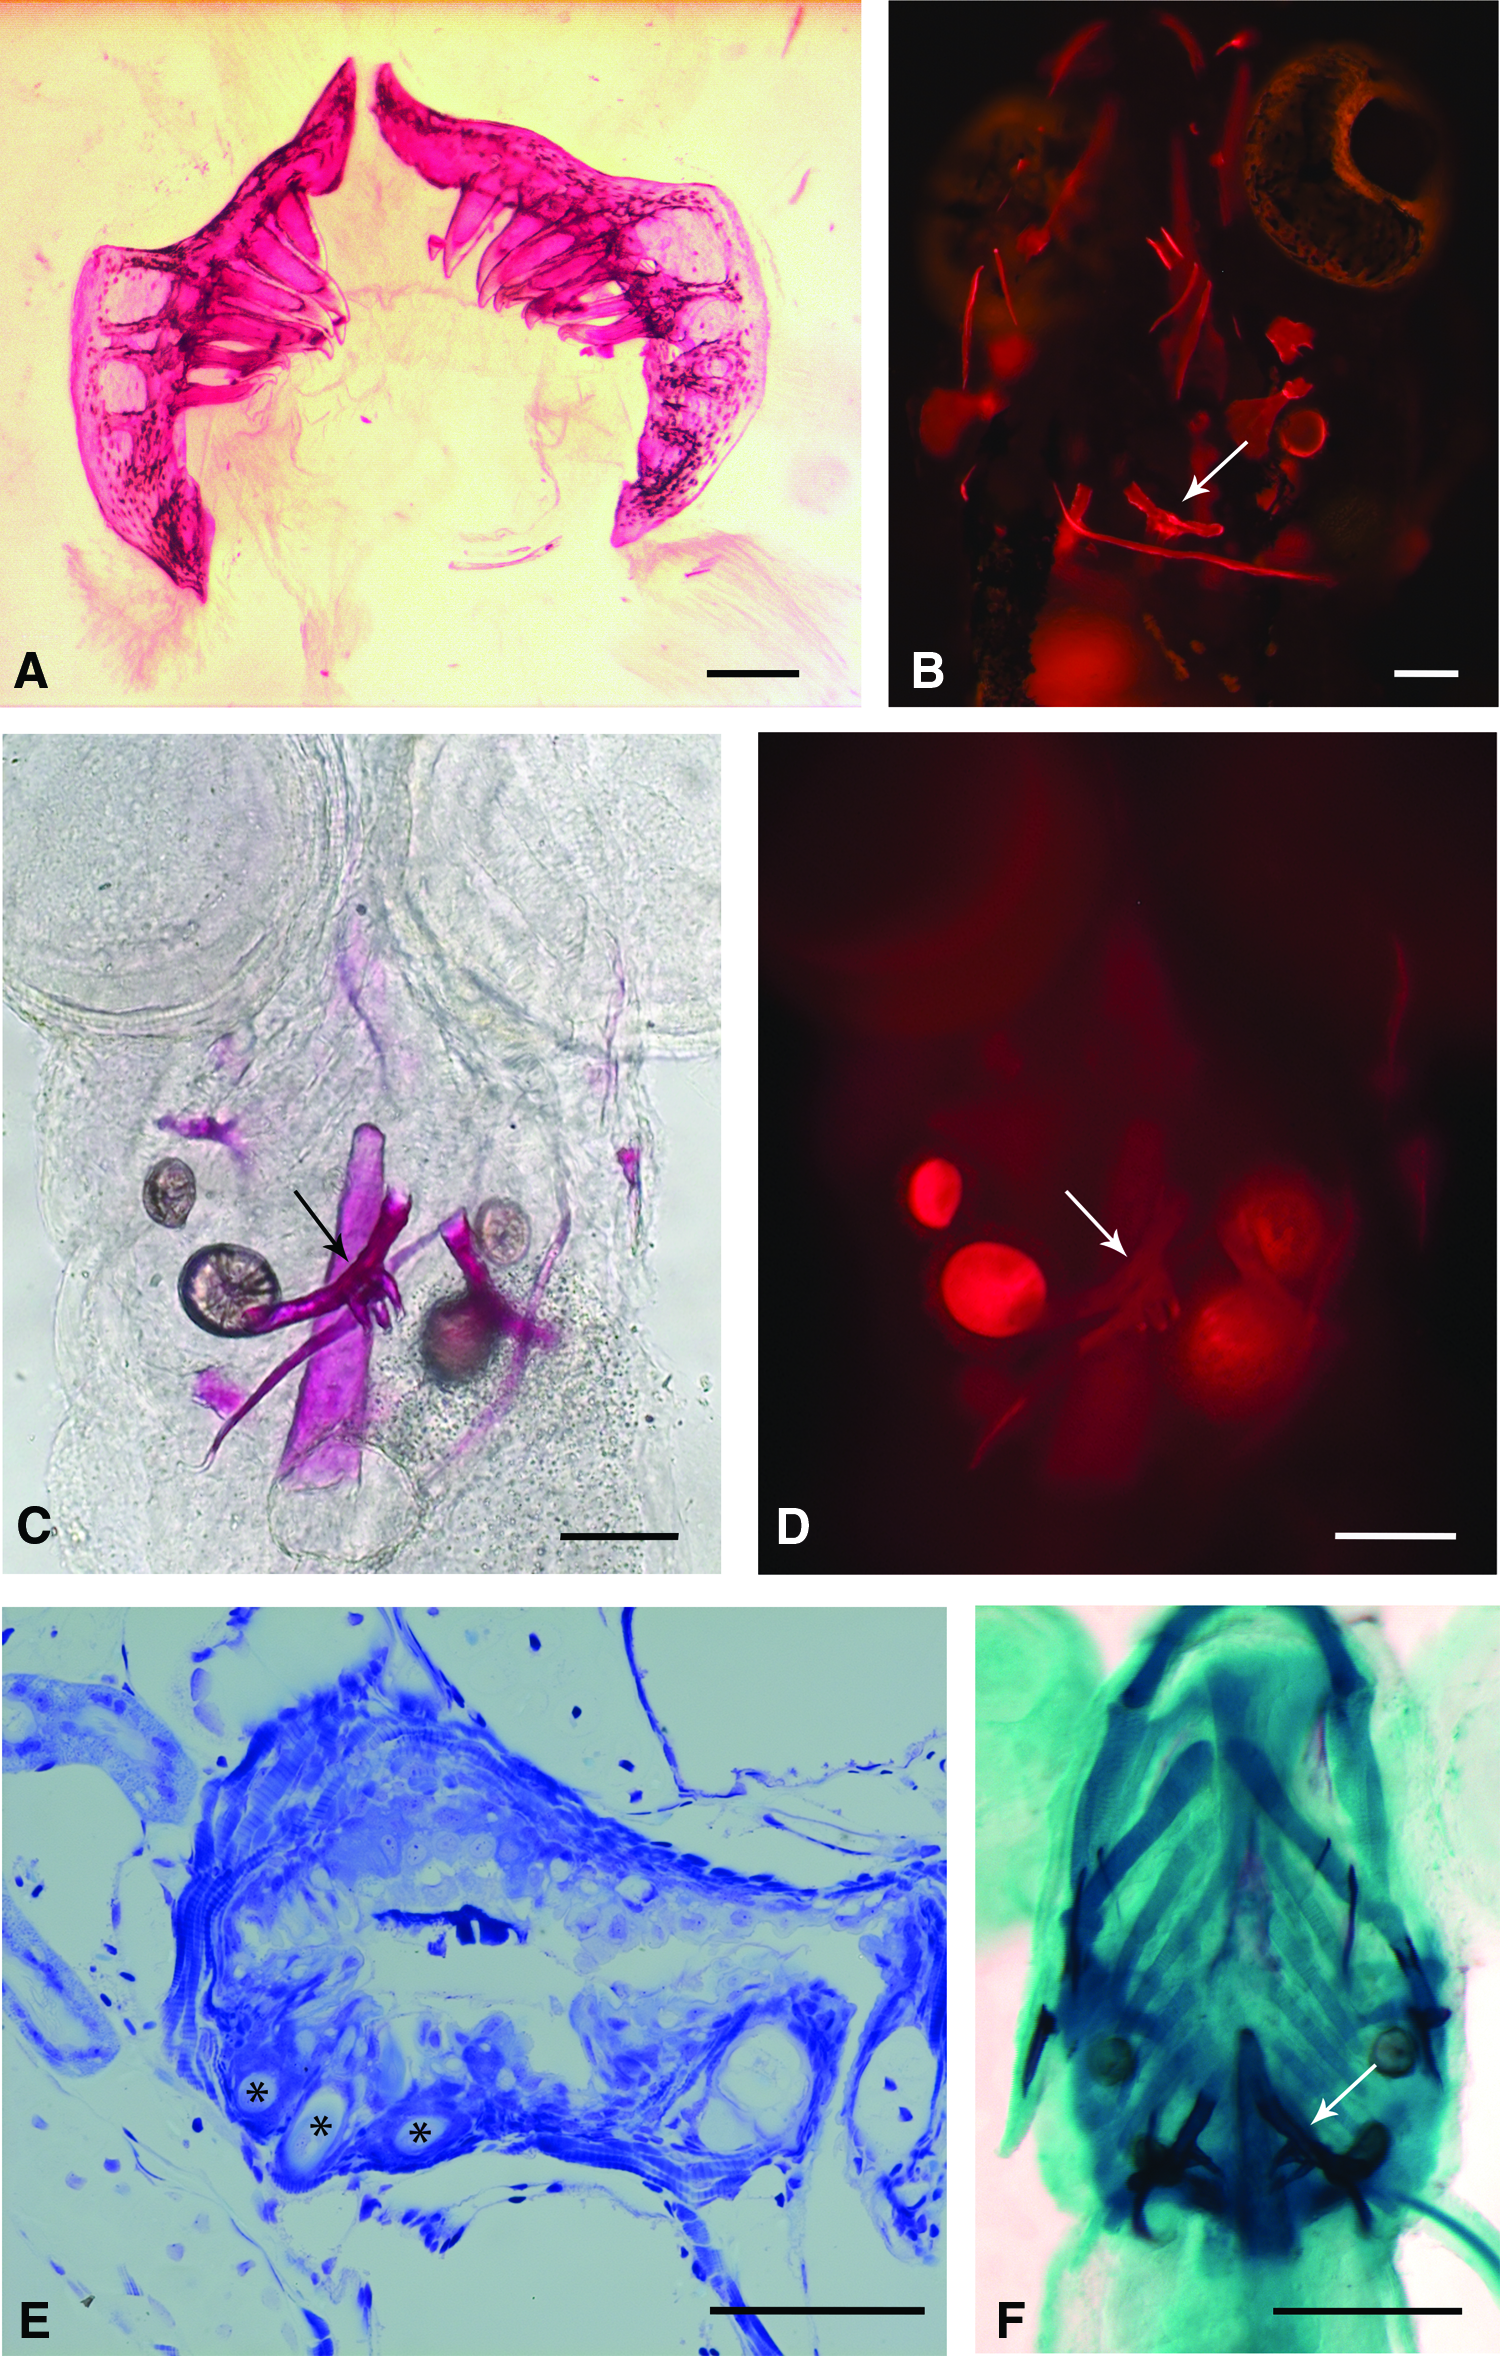
Visualizing the dentition of 1-month-old zebrafish at a resolution spanning from tissues to cellular details, thus, inevitably poses problems, related first and foremost to the size of the tissue sample, which imposes limitations onto the choice of visualization technique. Second, preparation time needs to be taken into account. Conventional histological methods allow us to study tooth replacement to the detail of subcellular structures (Fig. 1A), but are time-consuming. Between the fixation of 1-month-old zebrafish and the eventual visualization with conventional light microscopy, it takes on average 2–3 weeks for decalcification, postfixation, embedding, sectioning, staining, and mounting. Techniques that can circumvent this time- and labor-consuming routine by visualizing the dentition in vivo or at least in toto thus offer great advantages. A third and last factor that is decisive in the choice of an appropriate visualization method is the possibility to also distinguish soft tissue details. There are many straightforward ways to image hard tissues (dentine and enamel or enameloid) in the dentition but visualizing changes in soft tissue architecture, such as the formation of the successional lamina or the bi-layered bell-shaped structure, without relying on conventional histological methods, is much more difficult.

In this article, we discuss advantages and drawbacks of different methods to visualize tooth replacement in zebrafish (and, by extension, in other small teleost fish models such as medaka). We first focus on more traditional methods that use sections but avoid laborious preparation steps. We next discuss techniques that visualize the dentition in toto, many of which, nevertheless, have the disadvantage of relying mostly on imaging hard (i.e., mineralized) tissues only. We finally discuss methods based on technological developments that allow us to visualize tooth replacement in vivo, and, to some extent, enable observations on soft tissues as well.
Visualizing Zebrafish Teeth on Sections
A way to greatly reduce the amount of time needed to prepare the samples for sectioning, as well as the sectioning itself, is the use of a vibratome rather than a conventional microtome. With a vibratome, thick slices of approximately 150 μm of agarose-embedded samples can be made. These slices can then be optically sectioned using confocal laser scanning microscopy (CLSM). The use of this method is thus intrinsically linked with the choice of a fluorescent marker. Zebrafish green fluorescent protein (GFP)-lines, such as dlx2b:GFP, 10 could be used to detect certain stages of tooth development. Zebrafish lines that express GFP under the control of the promoter of a gene that is functional in the process of tooth formation may have the disadvantage that they cannot be used in combination with certain treatments. For example, the fibroblast growth factor-inhibitor SU5402 ablates dlx2b expression in the pharyngeal epithelium. 11 Investigating the precise effect of SU5402 on the process of tooth replacement using the dlx2b:GFP line, combined with vibratome sections and CLSM, can therefore not be done.
Another option is to use immunofluorescent staining of a protein that has no apparent function in tooth replacement. One example is to use an antibody against basal lamina proteins such as laminin, or the alpha3(IV) chain of type IV collagen. Indeed, the shape of the interface between pharyngeal epithelium and neural-crest-derived mesenchyme is a clear indication of the developmental stage of the tooth germ in early steps of odontogenesis. A DAPI stain for nuclei, a phalloidin stain for F-actine, 4 or a general vital stain, such as bodipy ceramide, can be utilized to provide the necessary counterstain (Fig. 1B). Alternatively, it is possible to stain the basal lamina by a conventional periodic acid-Schiff (PAS) staining. A PAS staining is fluorescent and can thus be used to trace the basal lamina (Fig. 1C, C’). 12
Vibratome sections of Corn Snakes have been cultured to follow tooth replacement in detail in vitro. 4 While this method is not easily adaptable to zebrafish because of the bony structures of the zebrafish head, necessitating decalcification before sectioning, culture of whole zebrafish heads or dissected jaws show that tooth formation can take place in vitro. 13
High-resolution episcopic microscopy (HREM) is a visualization technique that combines conventional sectioning with direct imaging. In this method, samples are embedded in standard resin with autofluorescent eosin. The blocks are mounted on a microtome attached to a fluorescent microscope. The top part of the block is then imaged before each section is cut, resulting in successive two-dimensional images along the longitudinal axis of the block. Tissue architecture can be distinguished by the varying ability of the different cell types to hinder the fluorescence of the embedding medium (Fig. 1D). By linking the movement of the microtome with the capturing of the image, whole blocks can be automatically cut and imaged. 14
Three-dimensional (3D) reconstruction is simplified, because the microtome provides readily aligned sections (Fig. 1E, F). HREM can easily be preceded by other imaging methods because of its relative indifference to other staining procedures such as a Gd-DPTA staining for contrast enhancement in MRI 15 and can be combined with, for example, NBT/BCIP staining to detect mRNA patterns. 14 Furthermore, the resolution of the images obtained is only limited by the magnification used. Smaller magnifications can be combined with better cameras to obtain high-resolution images. In this way, HREM imposes no constraints on the size of the tissue sample. 16 All these advantages make HREM a fast and easy method to visualize samples on a cellular level. Steyer et al. 17 took the HREM method one step further and developed an automatic cryo-imaging system from which fluorescence data can be obtained.
In toto Visualization of the Dentition
The most straightforward and easiest method for the imaging of hard tissues in the dentition is the use of Alizarin red S, an anthraquinone utilized to demonstrate calcium ions and thus mineralized tissues. It stains not only calcified cartilage and mineralized bone matrix but also mineralized dentine (Fig. 2A). However, hypermineralized tissues such as enamel or enameloid do not take up the stain. In the Alizarin complexone form, Alizarin red can also be used for in vivo staining (Fig. 2B). 18 The autofluorescence of Alizarin red S can be used to image the ceratobranchials and the teeth under a fluorescent stereomicroscope (Fig. 2C, D). 19 While this method allows identification of developing replacement teeth, the replacement teeth must already possess some mineralized matrix to be visible. Replacement teeth that have not reached the cytodifferentiation stage are, thus, not detected. In addition, adult zebrafish need first to be gutted to obtain a clear view of the pharyngeal apparatus, which possibly disrupts tissue structure. Unknown to most researchers is that Alizarin-stained whole mounts can be embedded and sectioned with reasonable preservation of histological detail (personal observation, Fig. 2E). Alcian blue, a stain often combined with Alizarin red S to visualize cartilage, enables visualization of teeth in early developmental stages by staining carbohydrates in the predentine matrix (Fig. 2F).
A first clear view of the organization of the dentition is often achieved by the use of X-rays and its modern-day 3D equivalent, micro-computed tomography (micro-CT, also known under the name high-resolution X-ray microtomography or industrial CT scanning). In micro-CT, high-powered X-rays from a single emitter are scattered in the sample and detected by gamma cameras, enabling the 3D reconstruction of the sample. 20 Because of the size of the X-ray waves, the resolution of the resulting image is only limited by the capacity of the detectors. This enables micro-CT to produce scans with a voxel size of less than 10 μm. 21 This method has been employed to visualize teeth in animals as diverse as the Leopard Gecko, American Alligator, and Corn Snake.3,4,22 X-raying and micro-CT scanning have also already been used in studying dentition and the skeleton in adult zebrafish (see e.g., Yelick and Schilling 23 and Pasco-Viel et al. 24 ) (Fig. 3A).
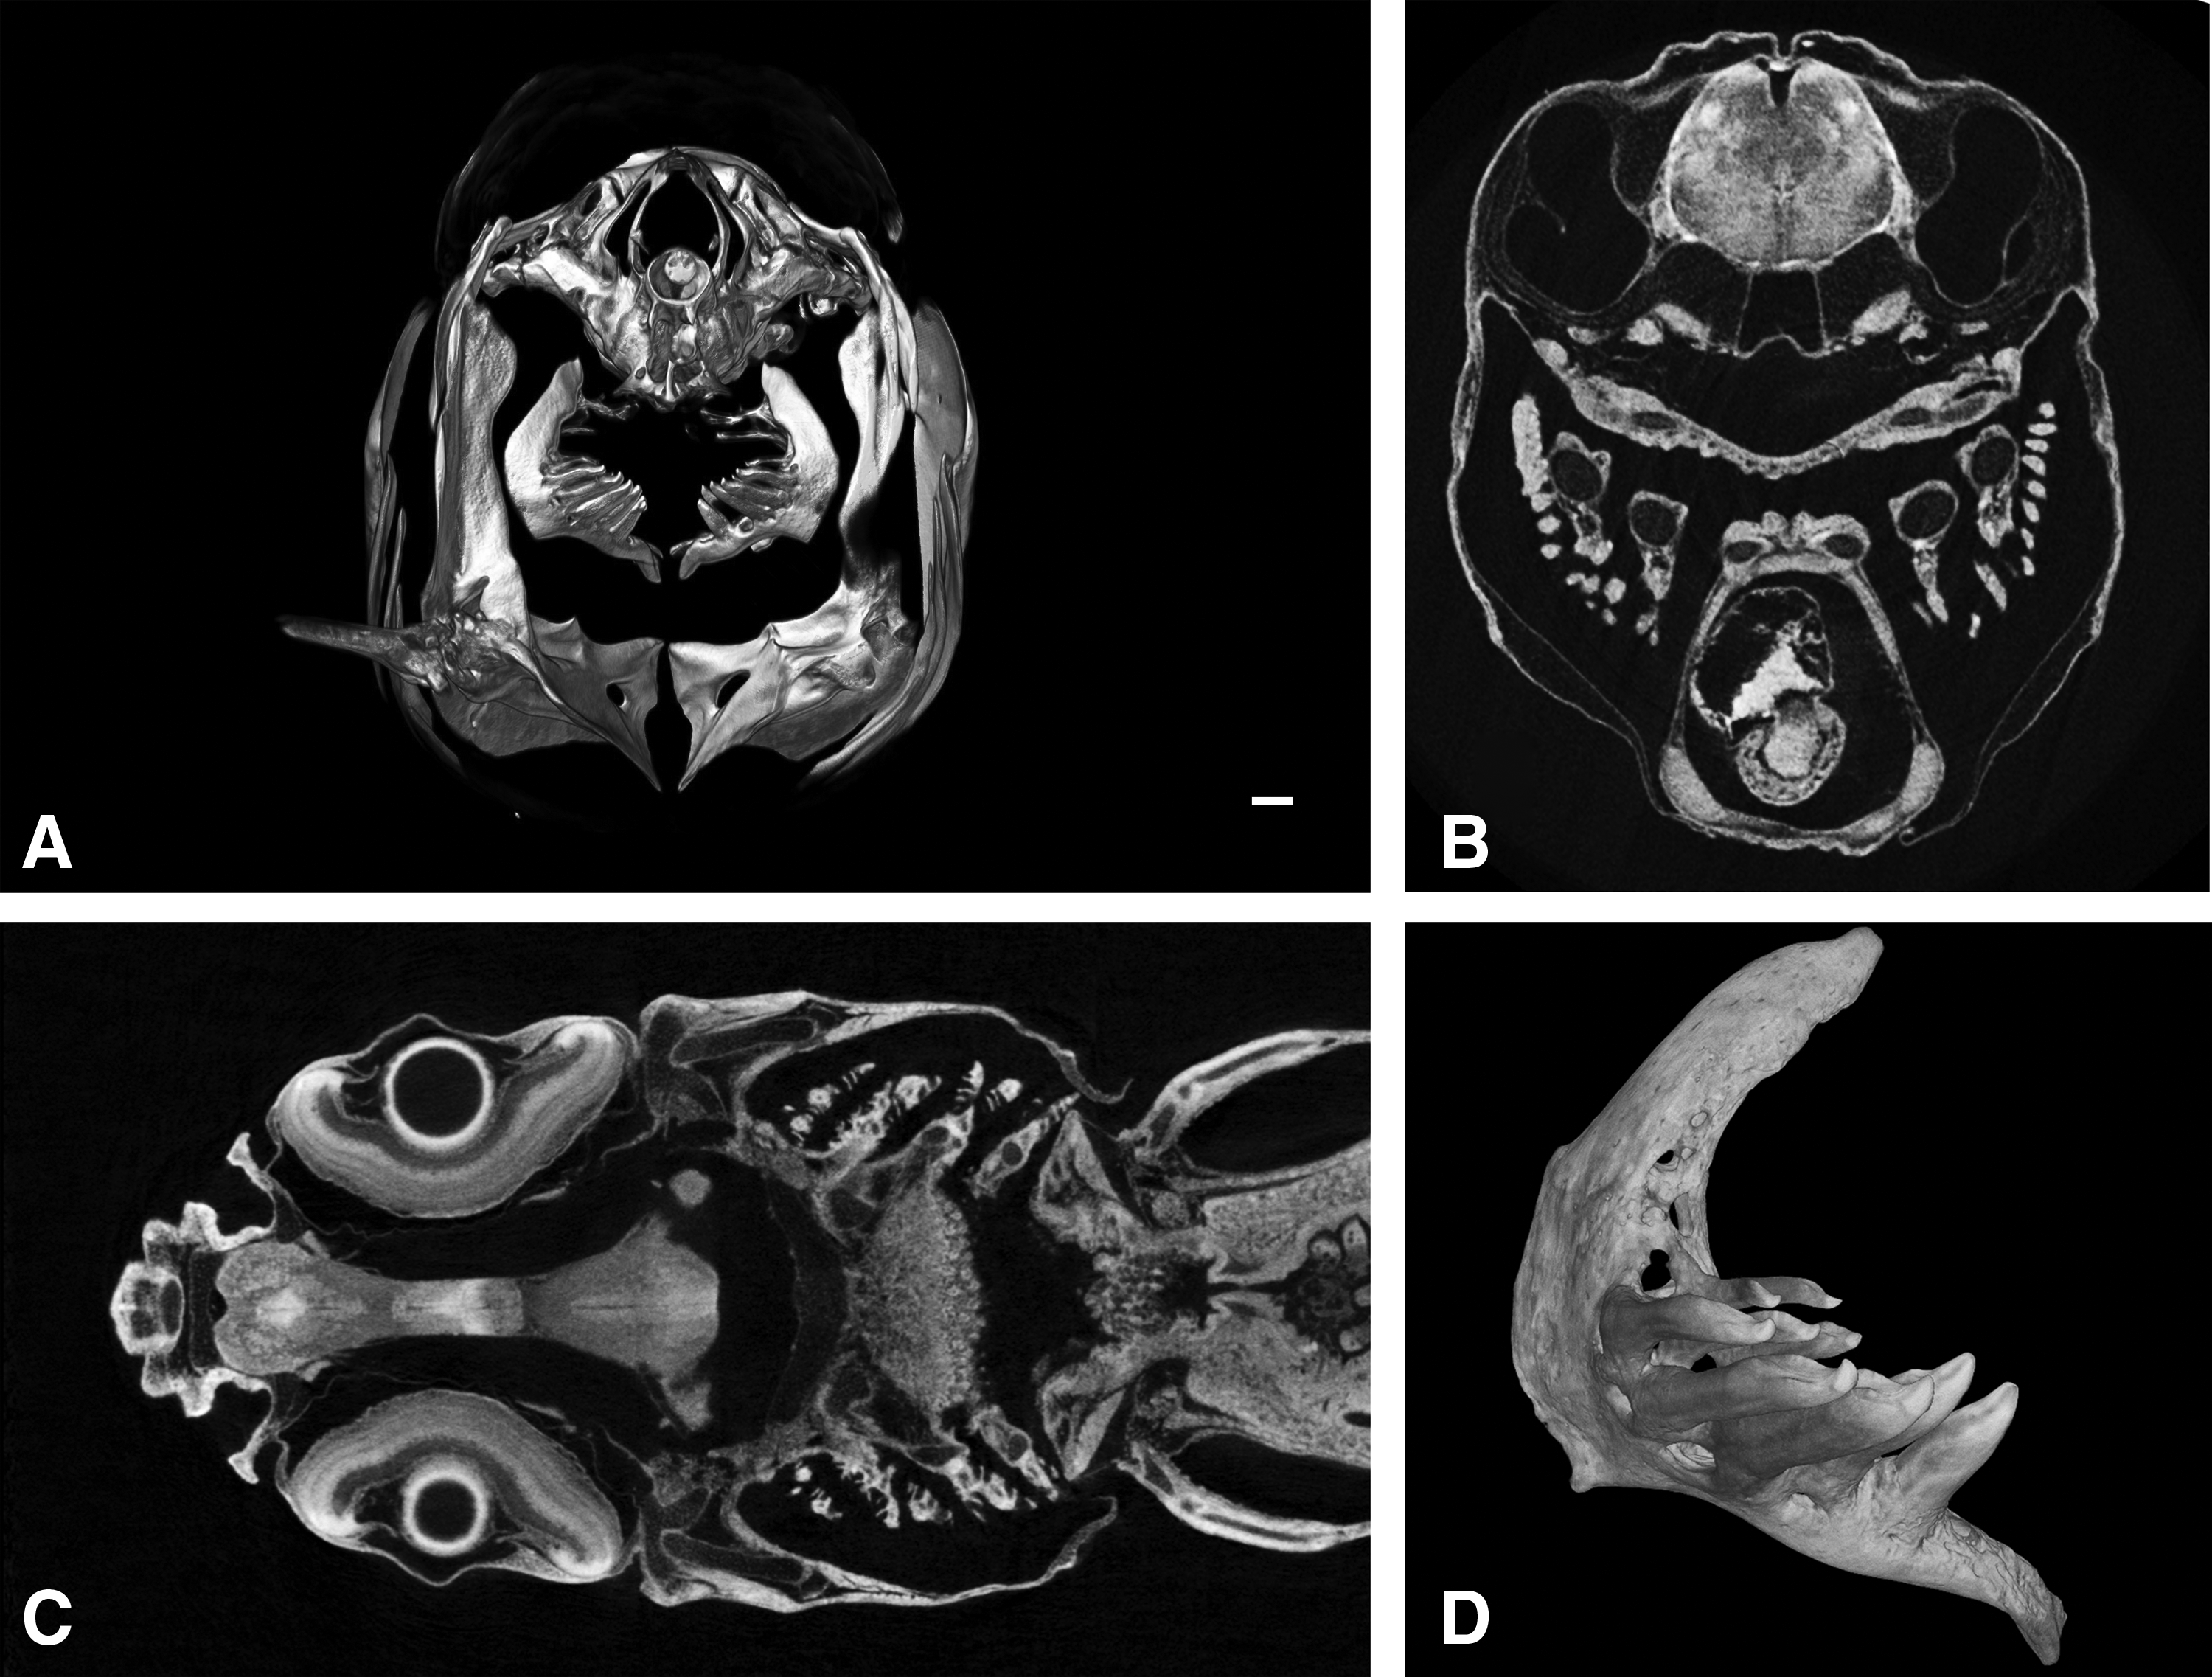
Micro-CT scanning, however, possesses the same limitation as the Alizarin red S method, as it visualizes mineralized tissues only. However, advances in tissue contrast enhancement have made it possible to image soft tissue boundaries. For example, using the properties of 10% potassium triiodide or Lugol solution and optimizing the staining technique to avoid tissue shrinkage, the developing cardiovascular system could be tracked in mouse embryos from E10.5 to E17.5. 25 The use of lugol and other soft tissue contrast enhancing agents has also been described in great detail for other species. For example, iodine potassium iodide after formalin fixation gave good soft tissue contrast in fry of Esox lucius (Fig. 3B). A solution of phosphotungstic acid in ethanol after Bouin's fixation gives good contrast in muscles, nervous tissues, and collagen-rich tissues (Fig. 3C). 26 Gallocyanin, a histological stain for nuclei, also gives good micro-CT contrast. 27 The latter stain could potentially be used to detect epithelial thickenings and mesenchymal condensations. Micro-CT imaging has even been proved to work in vivo, with the application of the contrast agents OmnipaqueTM (iohexol-OP) and Visipaque™ (iodixanol-VP) in chick embryos. 28 While these contrast enhancement agents have not yet been used in zebrafish, they represent a promising avenue to be explored.
The use of synchrotron radiation micro computer tomography can be a valuable addition to the data obtained from micro-CT scanning. In a synchrotron light source, electrons are accelerated close to the speed of light and kept inside the circular setup. Due to the radial acceleration electromagnetic radiation is produced, from which X-rays with a very high energy can be filtered. These X-rays can then be used for imaging deep tissues, as has been done for the zebrafish dentition 29 (Fig. 3D). However, synchrotron light sources are scarce and have high maintenance costs, making this method not easily accessible. Although micro-CT has its limitations, the further development of existing and new staining procedures, combined with the relative simplicity of the lugol staining procedures and the availability and ease of use of benchtop micro-CT setups offers exciting possibilities. 16
Optical projection tomography (OPT) is, in essence, the optical equivalent of micro-CT scanning. First established in 2002, OPT circumvents the limitations imposed by the thickness of the sample in conventional optical microscopy by rotating the sample embedded in a cilinder of agarose while held in position for imaging by a microscope. 30 In this way, high-resolution 3D images can be produced of fluorescent and non-fluorescent samples with a thickness of approximately 15 mm. Tissue samples used for OPT imaging must, however, be made optically transparent. This is done by the use of BABB (1:2 benzyl alcohol:benzyl benzoate mixture). BABB cannot be used in combination with some fluorescent markers. Techniques such as Scale 31 and Clarity 32 have been shown to alleviate this problem, at least in large brain tissue samples. OPT produces high-resolution images (down to 6 μm) that can be improved twofold by postprocessing 33 and can even be used in vitro in living tissue. 34
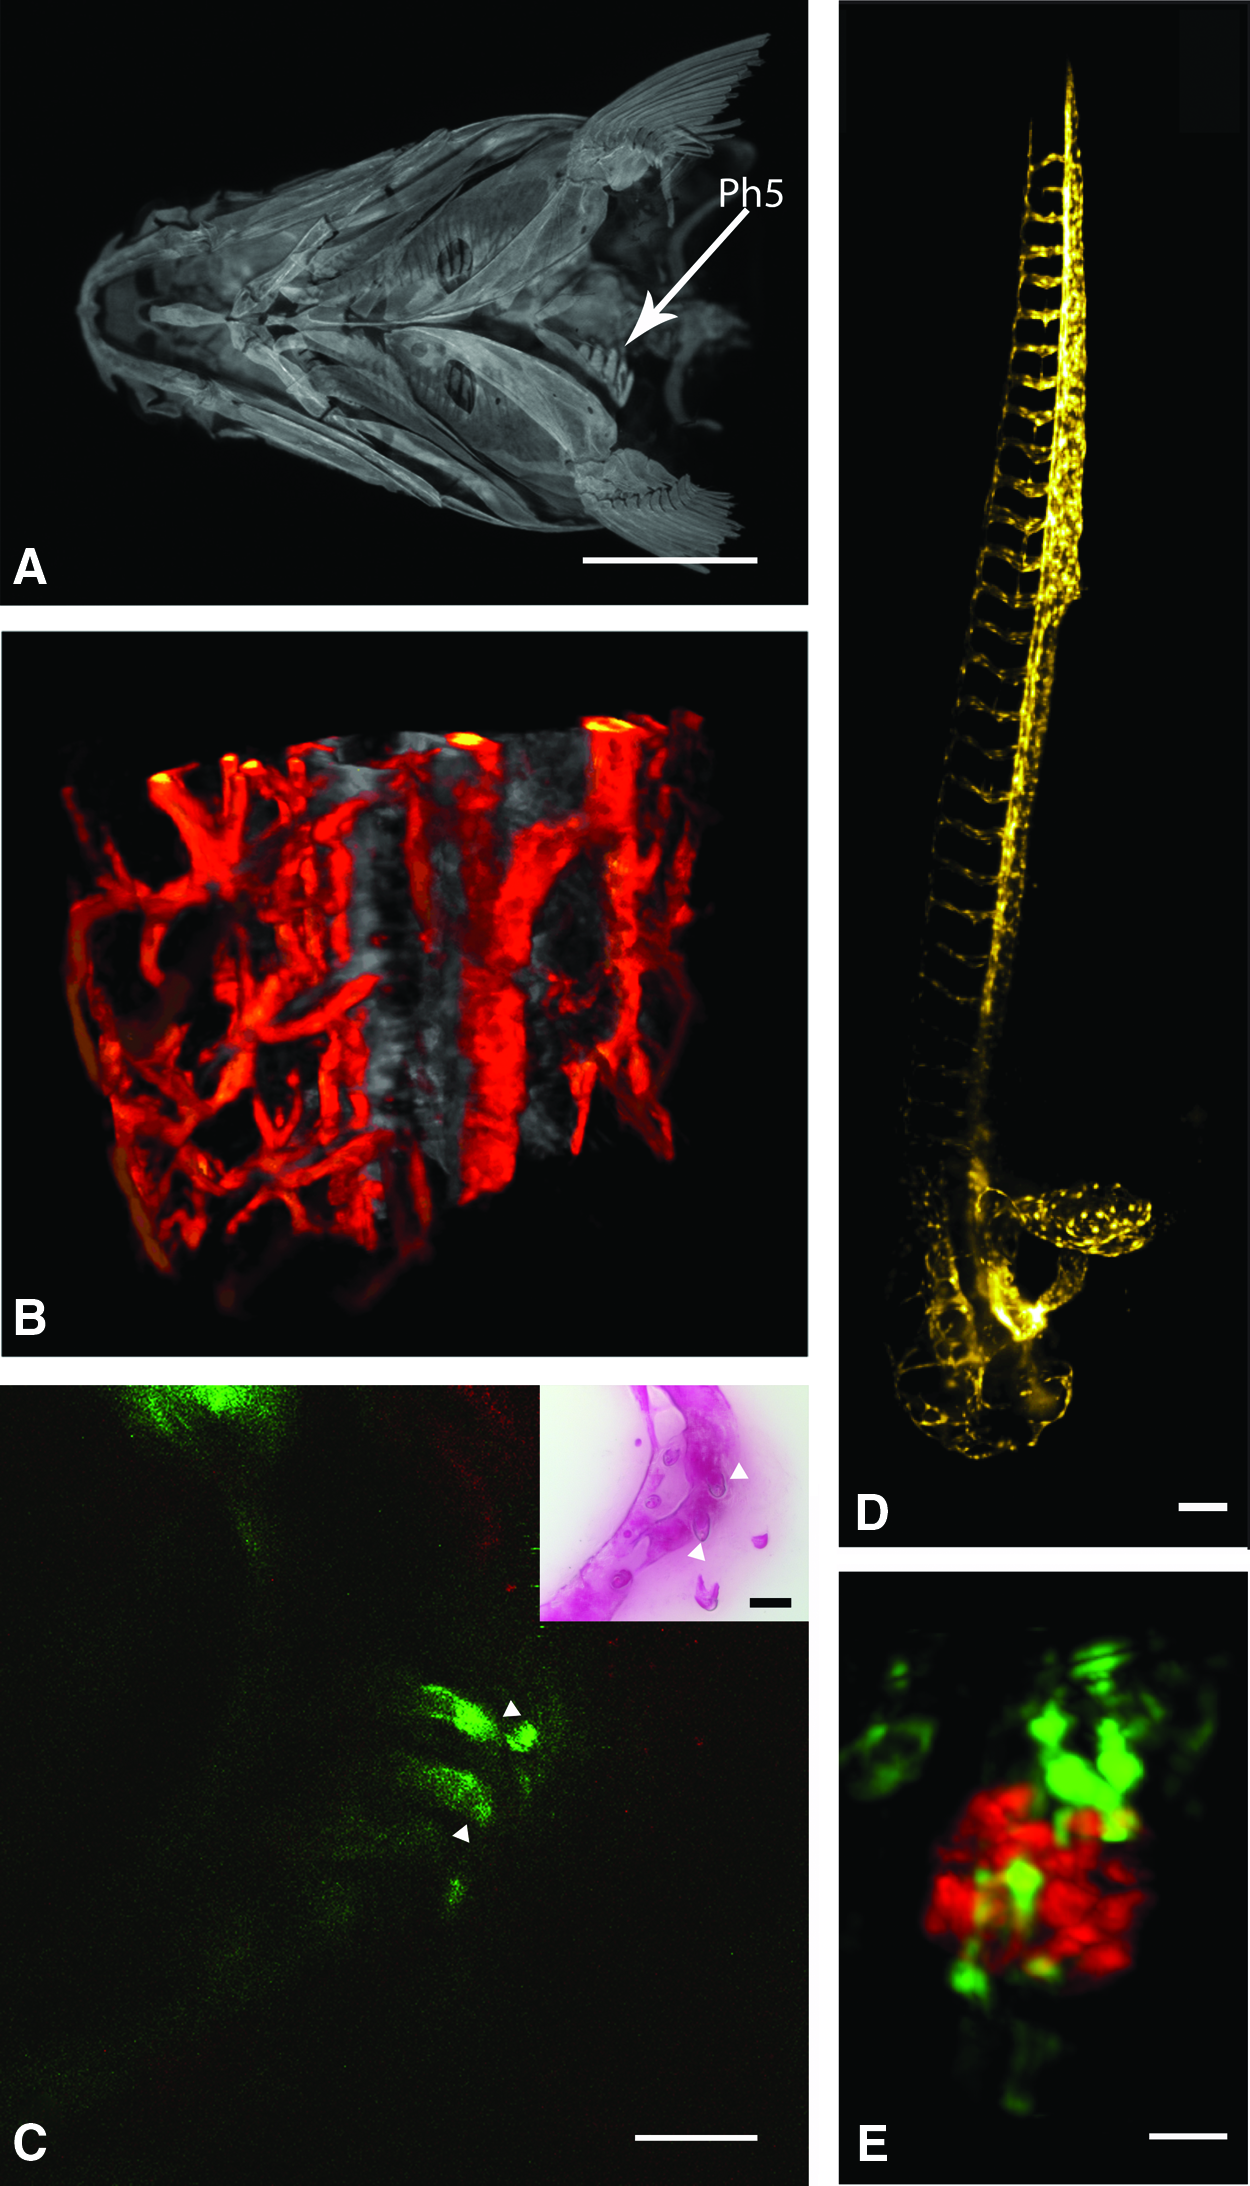
The use of OPT for investigating anatomical structures in mouse embryos has been continuously improved and has led to astonishing results, such as the visualization of the whole vascular system of a developing mouse embryo after whole mount immunostaining with a PECAM1 antibody. 35 Whole mount immunohistochemistry to label certain subsets of cells can be done in embryonic to larval stages in zebrafish 36 but to use these methods to study the mechanism of tooth replacement in 1-month-old zebrafish, the protocols need to be adjusted, taking, for example, those established for mouse embryos as a starting point. 37 While OPT has been utilized to make an anatomical atlas of zebrafish development, 38 OPT is only a sporadic tool in zebrafish research (Fig. 4A). In recent years, OPT has been employed to visualize the circulatory system in zebrafish by detecting the movement of cells in the bloodstream and creating flow maps using motion-analysis procedure in a process called flow-OPT (Fig. 4B). 39 On the other hand, the difference in fluorescence lifetime in OPT can be used to distinguish between autofluorescence (which is especially strong in the yolk sac of developing zebrafish) and the fluorescence of GFP in a lysC:GFP zebrafish line. 40
Combining two imaging modalities can, of course, greatly increase the information obtainable from the images. For example, the use of a hybrid fluorescence molecular tomography/micro-CT system to combine micro-CT data on anatomical structures with functional fluorescent reporter gene expression patterns in mice has been reported. 41
Technologies to Visualize Zebrafish Teeth In Vivo
In vivo imaging of teeth offers two major advantages: (1) It allows the process of tooth replacement to be monitored over time within a single individual, and (2) it reduces the number of fish that have to be sacrificed, which is largely preferred from an ethical perspective.
For in vivo imaging of the developing replacement teeth, a fluorescence-based imaging protocol should enable the visualization of deep structures. Two-photon excitation fluorescence (TPEF) imaging is a method that can image in maximum depths ranging from 500 μm 42 to 1 mm, 43 depending on the properties of the imaged medium. TPEF microscopy is based on the notion that the excitation of a fluorescent molecule can be caused by simultaneous striking of this molecule by two photons. Since the probability that two photons are interacting with the same molecule at the same time is very small, high-power, pulsed lasers must be used as the source of excitation. The combination of such a pulsed laser with an objective with a high numerical aperture forces a large number of photons to the region of interest. The process scales with the square of the intensity of the excitation light, so the intensity of the emitted light will quickly drop when moving away from the focal point. This eliminates the need for a confocal pinhole configuration, and non-descanned detection can be used. Furthermore, the use of longer wavelengths reduces but does not eliminate photoxicity and light scattering 44 and makes deep-tissue, in vivo imaging possible. TPEF microscopy, however, has its drawbacks. If the focus of the laserbeam is not spread out in either time or focal volume, high nonlinear photodamage is induced. 45
TPEF microscopy relies equally well on the properties of the microscope and on the fluorescent properties of the tissues. Human dental tissues, for example, show strong two-photon autofluorescence in enamel and mineralized dentine as well as in the cells of the periodontal ligament. 46 In general, fluorophores excited by a pulsed two-photon laser will have the same emission spectrum as by one-photon excitation. The two-photon excitation peak of a fluorophore will be shifted toward the infrared end of the light spectrum. 47
Several dyes can be excited with the same excitation light and emit light in a different part of the spectrum. When choosing a genetically encoded fluorophore, criteria that have to be kept in mind are the molecular brightness of the fluorophore, the expression and folding of the protein in vivo, the photostability, the risk of oligomerization and toxicity of the fluorophore, and the sensitivity of the fluorophore to environmental factors, such as the pH of the cell. 48 While TPEF microscopy has been used to a great extent in, for example, neuronal research (e.g. Renninger and Orger 49 ), the use in dental research in zebrafish is non-existent. Combining the already existing fluorescent tools for multicolor imaging in zebrafish (see e.g. Weber and Koester 50 ) with emerging techniques for genome modification such as transcription activator-like effector nucleases (TALEN) 51 and clusterd regularly interspaced short palindromic repeats/CRISPR associated protein 9 (CRISPR/CAS9) 52 will give exciting possibilities.
Second-generation microscopy is a visualization technique that has many, although not yet fully explored, advantages compared with fluorescence-based microscopy methods. Second harmonic generation (SHG) has, in fact, much in common with TPEF microscopy, because each method is based on two photons striking the same site at the same time. However, there are fundamental differences. In TPEF microscopy, the incident energy is absorbed so that a real excited state can be reached from which the fluorescence signal can emerge. The SHG signal is essentially due to a scattering process, and the two impinging photons will be annihilated in the production of a new photon with twice the frequency and half the original wavelength. SHG is produced by non-centrosymmetric media (materials that lack a generalized mirror symmetry), 53 such as collagens and muscle fibers. 54
SHG as well as TPEF microscopy provides optical sectioning without the need for a confocal aperture and uses lasers in the infrared range, which permits deeper optical penetration. 53 SHG has, however, several major advantages compared with TPEF microscopy, nearly all of which are related to the fact that no excited molecules have to be formed in SHG, making it a true noninvasive method. 55 SHG is, therefore, not subject to problems related to the use of fluorescent dyes. First, dye saturation, which poses a limitation in the maximum number of photons that can be emitted in a given time, is non-existent. Intensifying the exciting light will only result in an intensification of the emitted SHG waves. Second, photobleaching and dye-induced phototoxicity cannot occur, because no excited state is formed that can either alter the fluorescent molecule or produce free radicals. Third, so-called blinking, a fluctuation in fluorescence, is absent. 53
SHG microscopy has been used to image mitotic spindles inside a developing zebrafish embryo at a depth of 400 μm. 55 Inside free swimming larvae, SHG could reveal the distribution of dorsal muscle fibers. To ameliorate in vivo SHG microscopy, BaTiO3 nanocrystals can be used as a contrast enhancer. 53 These BaTiO3 nanoprobes do not suffer from the aforementioned problems of fluorescent molecules. Furthermore, they have a narrow scatter spectrum, making them distinguishable from autofluorescence, and they have an SHG signal that is 10 times stronger than the signal of endogenous material such as muscle fibers. The nanoprobes could also be fused to antibodies, resulting in SHG-based visualization of immunostains. With regard to the dentition, the SHG signal is particularly strong in the collagen composition of the unmineralized dentinal tubules and in the fiber structures of the periodontal ligament in human teeth. 46 Figure 4C presents a preliminary attempt to obtain an in vivo view of the ventral tooth row of a 29-day-old zebrafish at a depth of 500 μm using SHG microscopy. Fish were sedated with 0.016% MS-222 and recovered completely after 20 min of measurements.
Emerging Technologies for Deep or In Vivo Fluorescent Imaging
In vivo imaging in thick specimens requires a fast method with low phototoxicity and great resolution in every direction. Recently, the development of light sheet microscopy (Fig. 4D) and related techniques have opened up a new direction in in vivo imaging. In light sheet microscopy, the sample is illuminated side-on by a thin sheet of laser light from an illumination objective. The axis of the detection objective is placed orthogonal to this light sheet, and the illuminated plane coincides with the focal plane of the detection objective. By using wide-field lenses with great resolving power, combined with fast CCD or sCMOS cameras, the whole illuminated sheet of the sample can be imaged at once, which makes rapid visualization with high resolution possible. Moreover, since only the material contained in the light sheet is exposed, no photodamage occurs in the rest of the tissue. The axial resolution in light sheet microscopy is determined by the thickness of the light sheet and is theoretically better than in TPEF microscopy. 56
Currently, a lot of research has elaborated on the possibilities of light sheet microscopy. Using a total of four lenses, the basic selective plane illumination microscopy (SPIM) setup can be extended to include two light sheets from two illumination lenses.57,58 The fluorescence generated by these light sheets is registered by two orthogonally placed detection lenses. This SIMview setup obliterates the need for time-consuming sample rotation. The setup was used to record 80% of the neurons in the brain of a 5-day-old GCaMP5G zebrafish line at single cell resolution. 59 The entire larval zebrafish brain, covering a volume of 800×600×200 μm, was imaged in approximately 1.3 s. In addition, light sheet microscopy has been combined with two-photon fluorescence (2P-SPIM) to extend the imaging depth of one-photon light sheet microscopy by a factor of two.58,60 Furthermore, the axial resolution of 2P-SPIM achieved at higher imaging depth is superior to both one-photon light sheet and two photon laser scanning microscopy (2P-LSM) but at greater imaging depth the lateral resolution of 2P-LSM is better than that of 2P-SPIM. Finally, by using 2P-SPIM over 2P-LSM, photodamage is decreased, which enables an increase in excitation power and thus an increase in signal-to-noise ratio and acquisition speed. Using this setup, the heart of a 5.4-day-old zebrafish was imaged at a cellular resolution and a speed of 70 frames/s. 60
Another way to enable better resolution at greater imaging depth is the use of Bessel beam illumination. In contrast to laser beams with Gaussian intensity curves, the intensity of a Bessel beam follows a concentric circle pattern. Bessel beams have two characteristics that make them suitable for deep imaging. First, a perfect Bessel beam does not diffract, which means a light sheet formed by a Bessel beam will only spread out minimally and retain its initial thickness. Second, Bessel beams posses the ability to “self-heal,” which means that they can be partially obstructed at one point, but will reform after that point. 61 The properties of Bessel beam illumination and widefield 3D super-resolution structured illumination microscopy 62 have been used to image with a resolution under the diffraction limit in thickly fluorescent specimens. 63 This Bessel-plane SR-SIM setup enabled high-speed, high 3D-resolution imaging with low-phototoxicity and an improvement in resolution of about 1.5× in the lateral resolution and 2× axially compared with confocal microscopy. 64 Combining the Bessel-plane SR-SIM with two photon excitation resulted in high 3D-resolution images of the brain of a Drosophila melanogaster fly and a fixed Caenorhabditis elegans L1-stage larva. The images were created by combining four sub-volumes of 85×85×30 to 40 μm. In addition, a nonlinear structured-illumination microscopy algorithm can be used to reject tissue-scattered photons and out-of-focal plane photons that produce a diffused background. In this way, the kidney vasculature in 4 dpf zebrafish could be imaged at cellular resolution at a depth of 200 μm (Fig. 4E). 65
While light sheet microscopy has so far not been implemented in dental research, the various techniques under this banner are included here because they provide the current apex for deep and in vivo imaging. With regard to zebrafish dental research, they could be used to research cell dynamics in tooth replacement either in larval stages or in culture slices.
Conclusion
As has been shown, a plethora of imaging methods could be used to visualize replacement tooth formation in the zebrafish. So far, many of these possibilities either have been explored only in the most basic way or have not even been touched upon. Adjustment of these techniques to the material at hand will provide us with an even more expanded toolbox to study tooth replacement in the zebrafish and other teleost model species.
Footnotes
Acknowledgments
B.B. is supported by FWO-grant FWO12/ASP/031. The Center for X-ray Tomography of Ghent University and Prof. Dr. D. Adriaens are kindly thanked for their permission to use the micro-CT figure. Charlotte Gistelinck is kindly thanked for her permission to use the in vivo Alizarin red figure. M.A. acknowledges the Province of Limburg (Belgium) for the financial support within the tUL IMPULS FASE II program allowing for upgrading the laser source used in the SHG setup. M.M. would like to thank Lukas Reissig for his helpful comments.
Disclosure Statement
No competing financial interests exist.
References
Supplementary Material
Please find the following supplemental material available below.
For Open Access articles published under a Creative Commons License, all supplemental material carries the same license as the article it is associated with.
For non-Open Access articles published, all supplemental material carries a non-exclusive license, and permission requests for re-use of supplemental material or any part of supplemental material shall be sent directly to the copyright owner as specified in the copyright notice associated with the article.