
Abstract
Abstract
In recent years, there has been increasing interest in the welfare of ornamental fish. Diet can significantly impact the welfare of fish, which can manifest as changes in the fish's physical health and behavior. The zebrafish, Danio rerio, is a popular ornamental species; however, little is known about their nutritional requirements with possible implications for their welfare. Here, we investigated the effect of diets with increasing crude protein (iso-caloric diets) and lipid (iso-nitrogenous diets) on the growth performance, oxygen consumption, and behavior of zebrafish. We found no significant effects of crude protein (32%–75%) or lipid (8%–16%) on the specific growth rate or oxygen consumption of fish fed 5% of their body mass (BM)/day, although the highest crude protein and lipid diet resulted in an increase in condition factor. Furthermore, the crude protein diets did not affect zebrafish behavior when fed a 2% BM ration, once a day. This study has shown that a diet with 32% crude protein and a diet with 8% crude lipid, when fed at a 5% BM ration, were sufficient to meet the growth requirements of our zebrafish. These diets supported the fish's physical health and thus benefited their welfare.
Introduction
O
This study focused on the impact of nutrition on the welfare of the zebrafish (Danio rerio), a temperate ornamental cyprinid fish species that is popular with hobbyists. Given their additional popularity in scientific research as a model organism, it is surprising that little is known about their nutritional requirements. 4 Review of various zebrafish guidelines and laboratory handbooks highlights a diversity of diets recommended for zebrafish. For example, the most recent edition of the Organization for Economic Co-operation and Development guidelines for testing chemicals 5 recommends that zebrafish should be fed dry flake food, plus frozen adult brine shrimp (Artemia spp.), nauplii, or small daphnids 3 days before spawning. The zebrafish book by Westerfield 6 suggests feeding a variety of foods, including dry or moist trout pellets, flaked food, and brine shrimp. The “Laboratory Zebrafish” (2010) book describes the use of Artemia as the commonly fed live feed, with the addition of other zooplankton species, such as Paramecium spp. and rotifers (Brachionus spp.) for first-feeding zebrafish. 7 It goes on to describe the attributes of different diet types and refers to the National Research Council (NRC) for guidance on the general composition of fish diets: 45%–55% crude protein, 10%–15% crude fats, less than 5% carbohydrates, and trace amounts of necessary vitamins and minerals. 8
These NRC recommended diets tend to be designed for cultured carnivorous species destined for the human food chain. To obtain the fast growth rates required for the food industry, high protein (up to 50%) and lipid levels (up to 20%) are fed to fish. 8 However, practices used for food aquaculture systems are not necessarily suitable for ornamental fish kept in home or public aquaria. 9 In their natural environment, zebrafish are euryphagous omnivores, consuming a wide variety of benthic and planktonic crustaceans, phytoplankton, worms, and insect larvae.10,11 McClure et al. 12 analyzed the gut contents of zebrafish sampled from three different sites in India, and found that insects, mostly of terrestrial origin, were the predominant prey item. On a dry matter basis, the crude protein content of insects can range from 6.25% to 29.62% 13 , which is lower than the typical protein content (32%–60%; dry matter basis) of commercial diets targeted at zebrafish. The consequence of feeding diets with protein levels above the growth requirement of fish is an increase in ammonia production, which will have a direct impact on the physical health of the fish. 14 Dietary treatments have also been shown to affect the oxygen consumption of fish15,16 with one research group finding increased oxygen consumption of Oreochromis niloticus with increasing dietary protein content. 17 The physiological reaction of stress can cause an alternative allocation of energy in an organism that could be manifested as an increase in oxygen consumption, a reduction in growth, or both. 18 Therefore, feeding a high protein diet to O. niloticus could have been causing chronic stress to the fish.
The energy level of diets is another important consideration in fish nutrition, since fish eat to meet their energy requirements. Caloric content of the diet is mostly derived from lipids, the favored source of metabolic energy for growth and reproduction. 19 Feeding high calorie diets can lead to decreased feed consumption, reduced intake of other nutrients, reduced growth,20–23 and development of fatty liver pathology. 23
Studies investigating growth of zebrafish in relation to different diets have focused on comparing commercially available diets. Markovich et al. 24 fed zebrafish (AB strain) one of four experimental feeds: a live feed (Artemia; 43% protein, 32% lipids), a flake feed (45% protein, 9% lipids), trout pellets (55% protein, 15% lipids), and a mixture of Artemia, flake feed, and liver paste. Despite producing significantly fewer eggs, zebrafish fed the flake feed produced the most larvae out of the diets tested due to their significantly greater hatch rates. Consequently, the authors recommended the use of flake feed, which had the mid-range level of protein and the lowest lipid level out of the diets tested. 24 A study by Siccardi III et al. 25 fed five commercial diets and two laboratory prepared diets to zebrafish (Wild-Type), using growth, survival, and condition indices to determine the best performing diet. The researchers found that one of their laboratory prepared diets outperformed all of the other diets. The 45% dietary protein level in their best performing diet was similar to the protein levels in four of the other diets tested (±4%); however, the growth performance differed significantly. The authors suggest that the varied source and quality of the ingredients used to produce the diets may be responsible for the observed differences in growth rates. Therefore, nutritional studies going forward should use experimental diets made from the same pool of ingredients, with only the proportion of the target nutrient changing throughout the diets.
Most studies linking behavioral responses to diets and fish welfare have been concerned with different feeding regimes26–28 and orosensory properties of diets (taste, smell, and texture 29 ). Studies investigating nutritional composition of diets and its effect on behavior are scarce. Nevertheless, Yilmaz et al. 23 observed increased swimming, foraging, and grouping activity of juvenile common carp (Cyprinus carpio) fed a low calorie diet (10.85 mega joules [MJ] digestible energy [DE] kg−1) compared with carp fed higher calorie diets (11.82–15.06 MJ DE kg−1). Therefore, calorie content of a diet can impact fish behavior and, is an important area of fish nutrition to be investigated.
This study investigated the growth, oxygen consumption, and behavioral responses of zebrafish (D. rerio), fed on laboratory-prepared diets with increasing crude protein (32%–75%; iso-caloric) and lipid contents (8%–16%; iso-nitrogenous). The study focused on the time at which these fish were transitioning from juvenile to adult, rather than sexually mature fish that would be diverting energy toward reproduction. Therefore, at the start of the experiment, zebrafish were of a suitable size (average mass: 250 mg) to readily consume the experimental diets while still having potential for growth. 30 Reproductive maturity of zebrafish tends to be related to size rather than age, as this may vary markedly with environmental conditions. 31 A standard length of approximately 23 mm corresponds with attainment of reproductive maturity in this species31,32 and the average length of our zebrafish at the end of the experiment was 28 mm, confirming that they had reached reproductive maturity.
Materials and Methods
Fish
Wild Indian Karyotype zebrafish were obtained from brood stock at the University of Plymouth, Drake Circus, Devon, United Kingdom. All stock fish were housed in re-circulating systems consisting of glass aquaria (24 L) held at 28°C (±1°C; biological, mechanical, carbon, and UV filtration). A light:dark photoperiod of 12:12 h was provided by indirect fluorescent lighting. Fish were raised from fertilization at an approximate density of 300 fish per 24 L tank and fed to satiation with a combined diet of Artemia and AQUARIAN® Tropical Flake. At 101 days post fertilization, fish (∼0.1 g) were graded and divided into their treatment groups consisting of 15 fish per 24 L tank (0.63 fish per liter). Fish were graded based on their mass so that there was no more than 5% difference in overall tank mass between treatment groups. These fish were then fed a laboratory prepared diet consisting of 46% crude protein (Table 1) for 3 weeks to allow them to acclimate to the pelleted feed.
Scottish Fishmeal 70, United Fish Products Ltd, UK.
Epanoil, Sevenseas Ltd, United Kingdom.
Premier nutrition vitamin/mineral premix (121 g/kg calcium, vitamin A 1.0 μg/kg, vitamin D3 0.1 μg/kg, vitamin E (as alpha tocopherol acetate) 7.0 g/kg, copper (as cupric sulfate) 250 mg/kg, magnesium 15.6 g/kg, phosphorous 5.2 g/kg).
Sigma-Aldrich Ltd, United Kingdom.
Diet formulation, production, and analysis
All experimental diets were formulated and produced at the University of Plymouth. Dietary protein feeds were formulated to have similar calorific values (iso-caloric; 18.2±1MJ/kg; Table 1). This was achieved by reducing the amount of fish oil (energy source) added to the recipe when increasing the amount of fish meal—fish meal typically contains 10%–12% oil. Diets for the lipid trial were formulated to have identical dietary protein levels (iso-nitrogenous; 46.5%±0.5% protein) achieved through a 60% inclusion of fishmeal across all lipid diets (Table 1). The different dietary lipid levels were altered by substituting starch with fish oil (lipid source). Diets were extruded using a MasterChef® food processor and fan-dried at 40°C in a cupboard for 12 h before being ground in a coffee grinder to ∼1 mm diameter as used by Siccardi III et al. 25 Diets were analyzed for proximate composition 33 (Table 1). Samples were finely ground using a coffee grinder and analyzed for crude protein (Kjeldahl, Gerhardt Vapodest), crude lipid (Gerhardt Soxtherm), ash content by incineration in a muffle furnace, and moisture (dried in a convection oven for 12 h at 40°C). The total energy content was determined by bomb calorimetry (PARR 1356 Bomb Calorimeter).
Experimental setup
Three feeding trials using 15 week-old zebrafish were conducted. The first (F1) lasted 5 weeks and tested five iso-caloric diets with different dietary protein levels (38%, 43%, 46%, 52%, and 58% as fed). The second feeding trial (F2) lasted 5 weeks and tested three iso-caloric diets with a greater range of dietary protein levels (32%, 46%, and 75%). The third trial (F3) lasted 8 weeks and tested three iso-nitrogenous diets with increasing dietary lipid levels (8%, 12%, and 16%). All fish were fed 5% of their body mass (BM) a day in four equal rations (at 1000, 1200, 1600, and 1800 h) delivered via an automatic fish feeder (Fish Mate F14). Rations were dispensed over an hour, ensuring that the fish were not overwhelmed by food, which resulted in the full ration being consumed. All dietary treatments were fed to three tanks of fish (i.e., n=3). During the behavior experiments (see Behavioral observations section), fish were fed 2% of their BM once daily (at 1320), with six tanks per dietary treatment (n=6).
Oxygen consumption
After each feeding trial (F1, F2, F3; 5–8 weeks), oxygen consumption measurements of individual zebrafish (n=8 per treatment) were taken to give an indication of metabolic rate. Fish were randomly selected and housed individually in one of six 50 mL chambers that were connected to a flow-through system. Air-saturated water was gravity fed from a header tank through tubing to the chambers at a flow rate of 20 mL min−1. These chambers contained a magnetic flea and were situated inside a water bath (28°C±1°C) on top of a magnetic stirring plate to ensure thorough mixing of water and stable temperatures. Oxygen consumption was calculated by taking samples of outflow water (n=3 with 10 min between readings) from the chambers with a hypodermic syringe and injecting them into an oxygen electrode system for analysis (Strathkelvin instruments 782 oxygen meter, 1302 oxygen electrode, MC100 housing). Calibration of the oxygen electrode was achieved using air-saturated water from the header tank (100% saturation) and a 0.01 M sodium tetraborate solution saturated with sodium sulfite (0% saturation).
Zebrafish were fasted for 16 h and placed within the chambers 6 h before taking measurements to minimize the effect of food digestion or handling stress as variables34,35 and they were also kept in the dark to minimize disturbances. Oxygen tension of chambers without fish was measured to account for bacterial consumption. At the time of measurements, water temperature and atmospheric pressure were recorded to determine oxygen concentration (mg/L) of water at 100% O2 saturation (7.9 mg L−1 O2 at 1 bar and 28°C 36 ). Oxygen consumption (VO2 in μmol O2 g−1 h−1) was determined using the amount of O2 in the measured water sample (μmol O2 L−1) according to the following equation:
VO2 (μmol O2 g−1 h−1)=(VO2 (μmol O2 L−1) * flow rate (1 h−1))/mass of fish (g).
Growth parameters
Tank biomass was measured weekly from the start of each feeding trial. Zebrafish from a tank were removed and weighed as a group by blotting excess water with tissue paper before placing them into a beaker of aquarium water on a tared balance. For the behavior trials, tank biomass was measured at the start and end of the behavioral observations, 12 days later.
Using the biomass and feed consumption data, the following indices were calculated:
Mean mass gain (%)=[(g mean final mass−g mean initial mass)/g mean initial mass]×100
Specific growth rate (SGR, %/d)=[((ln mean final mass)−(ln mean initial mass))/number of days]×100
Feed conversion ratio (FCR)=(g feed consumed)/(g final mass−g initial mass)
At the end of feeding trials, individual zebrafish were placed in zebrafish breeding traps (2.5 L) with a ruler underneath the tank as a reference. The breeding traps contained aquarium water at a depth of 2 cm. Photos of zebrafish were taken 5 cm above the breeding traps using a Sony HDR XR520E camera before they were weighed individually as described earlier. Length of zebrafish was measured from the snout to the caudal peduncle from the photos using ImageJ 1.42q with the ruler acting as a known length in the photo. The individual length and mass of a zebrafish was then used to calculate the condition index (K-index 37 ) using the following formula: K-index=(mass×100)/length 3 .
Behavioral observations
After the F2 feeding trial, a behavior experiment was conducted. Subsamples of five fish per tank, within their F2 treatments, were moved into 10 L experimental tanks (n=6 tanks per treatment) for 12 days. For behavioral research purposes, experimental tanks were equipped with new plastic plants and shelters, which were situated at the back of the tank (as described by Saxby et al. 38 ) to create an environmentally enriched area. These fish were fed F2 diets once a day (32%, 46%, and 75% protein) at a reduced ration of 2% BM to induce some competition over resources. After 1 week of acclimation, experimental tanks were video recorded for 3 consecutive days, three times a day (at 930, 1300, and 1500), using a digital video camera (Panasonic SDR-S7). After 10 min of recording, a novel object (a flat metal ring [diameter=3 cm] lowered on a piece of thin thread into the water by 6.5 cm) was added to the tank and the fish were recorded for another 10 min. Food was added to the tank after the 1300 observations so that latency to feed could be calculated. Aggression of the group, shoal cohesion, time spent in environmental enrichment, and latency to feed were scored from the video footage of the behavioral observation periods (see Table 2).
Ethical note
The study was approved by the WALTHAM® Centre for Pet Nutrition and the University of Plymouth ethics committee. Fish were not subjected to invasive techniques, and no fish were euthanized as a result of this study. The weighing was carried out rapidly, and fish were exposed to air for no more than 60 s. Fish were observed in their tanks daily to ensure all fish were in good health and not showing signs of stress (clamping of fins, flashing, gulping at surface, etc.). All fish were maintained under appropriate water quality conditions (28°C; no visible detection of ammonia or nitrite and <40 mg/L nitrate using API® Liquid Test Kits).
Statistical analysis
Growth parameter data were analyzed by General Linear Models (GLM) to investigate the effect of diet, in StatsGraphics Centurion XVI (Version 16.0.07). Behavioral data were tested for normality (Kolmogorov-Smirnov) and homogeneity of variance (Levenes test) before statistical analysis using SPSS17.0. Repeated-measures ANOVAs (RM ANOVA) were performed to determine the effect of diet, day, and time of day on shoal cohesion, aggression, and time spent in the environmental enrichment. Data for aggression and environmental enrichment were square root transformed to meet the assumptions of parametric analysis. Latency to feed was tested using the same model with only diet and day as factors, since fish were just fed once a day. There were no significant interactions within any of the models (p>0.05). In addition, paired t-tests were used to test whether there was an effect of addition of a novel object. Effects were tested against a 5% significance level. Growth parameter data are presented as mean±Tukey's Honestly Significantly Different (HSD) intervals. Behavioral data are presented as mean±standard error (SE).
Results
Dietary trial F1
Zebrafish fed diets with crude protein levels ranging from 38% to 58% showed an average increase in biomass (±SE) of 154±10.63 mg over the 5 week trial, with final mean lengths (±SE) of 3.15±0.102 cm. The (SGR; GLM: p=0.156), mass gain (MG; GLM: p=0.167), condition index (K-index; GLM: p=0.597), feed conversion ratio (FCR; GLM: p=0.15), and oxygen consumption (GLM: p=0.344) of zebrafish were not affected by dietary treatments (Table 3).
SGR (n=3), MG (n=3), FCR (n=3), condition index (K-index; F1: n=44, F2: n=42) and oxygen consumption of zebrafish (n=8) (±Tukey HSD intervals) fed F1 and F2 diets over the 5 week feeding trials.
Different superscript letters denote a significant difference (p<0.05).
FCR, feed conversion ratio; HSD, honestly significantly different; MG, mass gain; SGR, specific growth rate.
Dietary trial F2
Zebrafish fed 32%, 46%, or 75% crude protein diets showed an average increase in biomass of 126±11.24 mg over the 5 week trial, with final mean lengths of 2.71±0.08 cm. The SGR (GLM: p=0.058), MG (GLM: p=0.053), FCR (GLM: p=0.132), and oxygen consumption of zebrafish (GLM: p=0.916) were not affected by dietary treatment (Table 3). However, condition index was affected by dietary treatment (GLM: p=0.013) with zebrafish fed the 75% protein diet having significantly greater condition indices than those fed the 32% protein diet (Table 3; multiple comparisons; p<0.05). This suggests that fish fed the 75% protein diet had greater energy reserves than fish fed the lower protein diets. During behavioral observations at the end of this feeding trial, where fish were fed 2% of their BM once daily to create competition over resources, zebrafish lost mass in all three F2 diet groups. Zebrafish fed the 32% protein diet lost on average 8% in biomass while fish fed the 46% and 75% protein diets lost on average 4.5%, yet these differences were found not to be significant (GLM: p=0.1554). However, analysis of the data revealed that an outlying observation within the 75% protein diet treatment was increasing the variability fourfold. Once this observation was removed, the analysis showed that zebrafish fed the 32% protein diet lost significantly more biomass compared with fish fed the 45% and 75% protein diet (GLM: p=0.0006).
Dietary trial F3
Zebrafish fed 8%, 12%, or 16% crude lipid diets showed an average increase in biomass of 137.67±11.72 mg over the 8 week trial, with final mean lengths of 2.53±0.04 cm. (GLM: p=0.266), mass gain (GLM: p=0.236), FCR (GLM: p=0.125), and oxygen consumption of zebrafish (GLM: p=0.375) were not affected by dietary treatment (Table 4). However, the condition index was affected by diet (GLM: p=0.012) with zebrafish fed the 16% crude lipid diet having significantly higher condition indices compared with diets with lower crude lipid (Table 4; multiple comparisons; p<0.05). This suggests that fish fed the highest lipid, and therefore the most calorific diet, had greater energy reserves than those fed lower lipid diets.
SGR (n=3), MG (n=3), FCR (n=3), condition index (K-index; n=41), and oxygen consumption of zebrafish (n=8) (±Tukeys HSD intervals) fed f3 diets over an 8 week feeding trial.
Different superscript letters denote a significant difference (p<0.05).
Behavioral results F2
Aggression
There was no significant effect of day (RM ANOVA: p=0.505) or diet (p=0.770) on levels of aggression. However, fish were significantly more aggressive in the morning (RM ANOVA: p<0.001) with decreasing aggression through the day (Fig. 1A). The addition of a novel object had a significant effect on aggression (Paired t-test: p<0.001, Fig. 1B), where fish showed lower levels of aggression after the addition of a novel object.
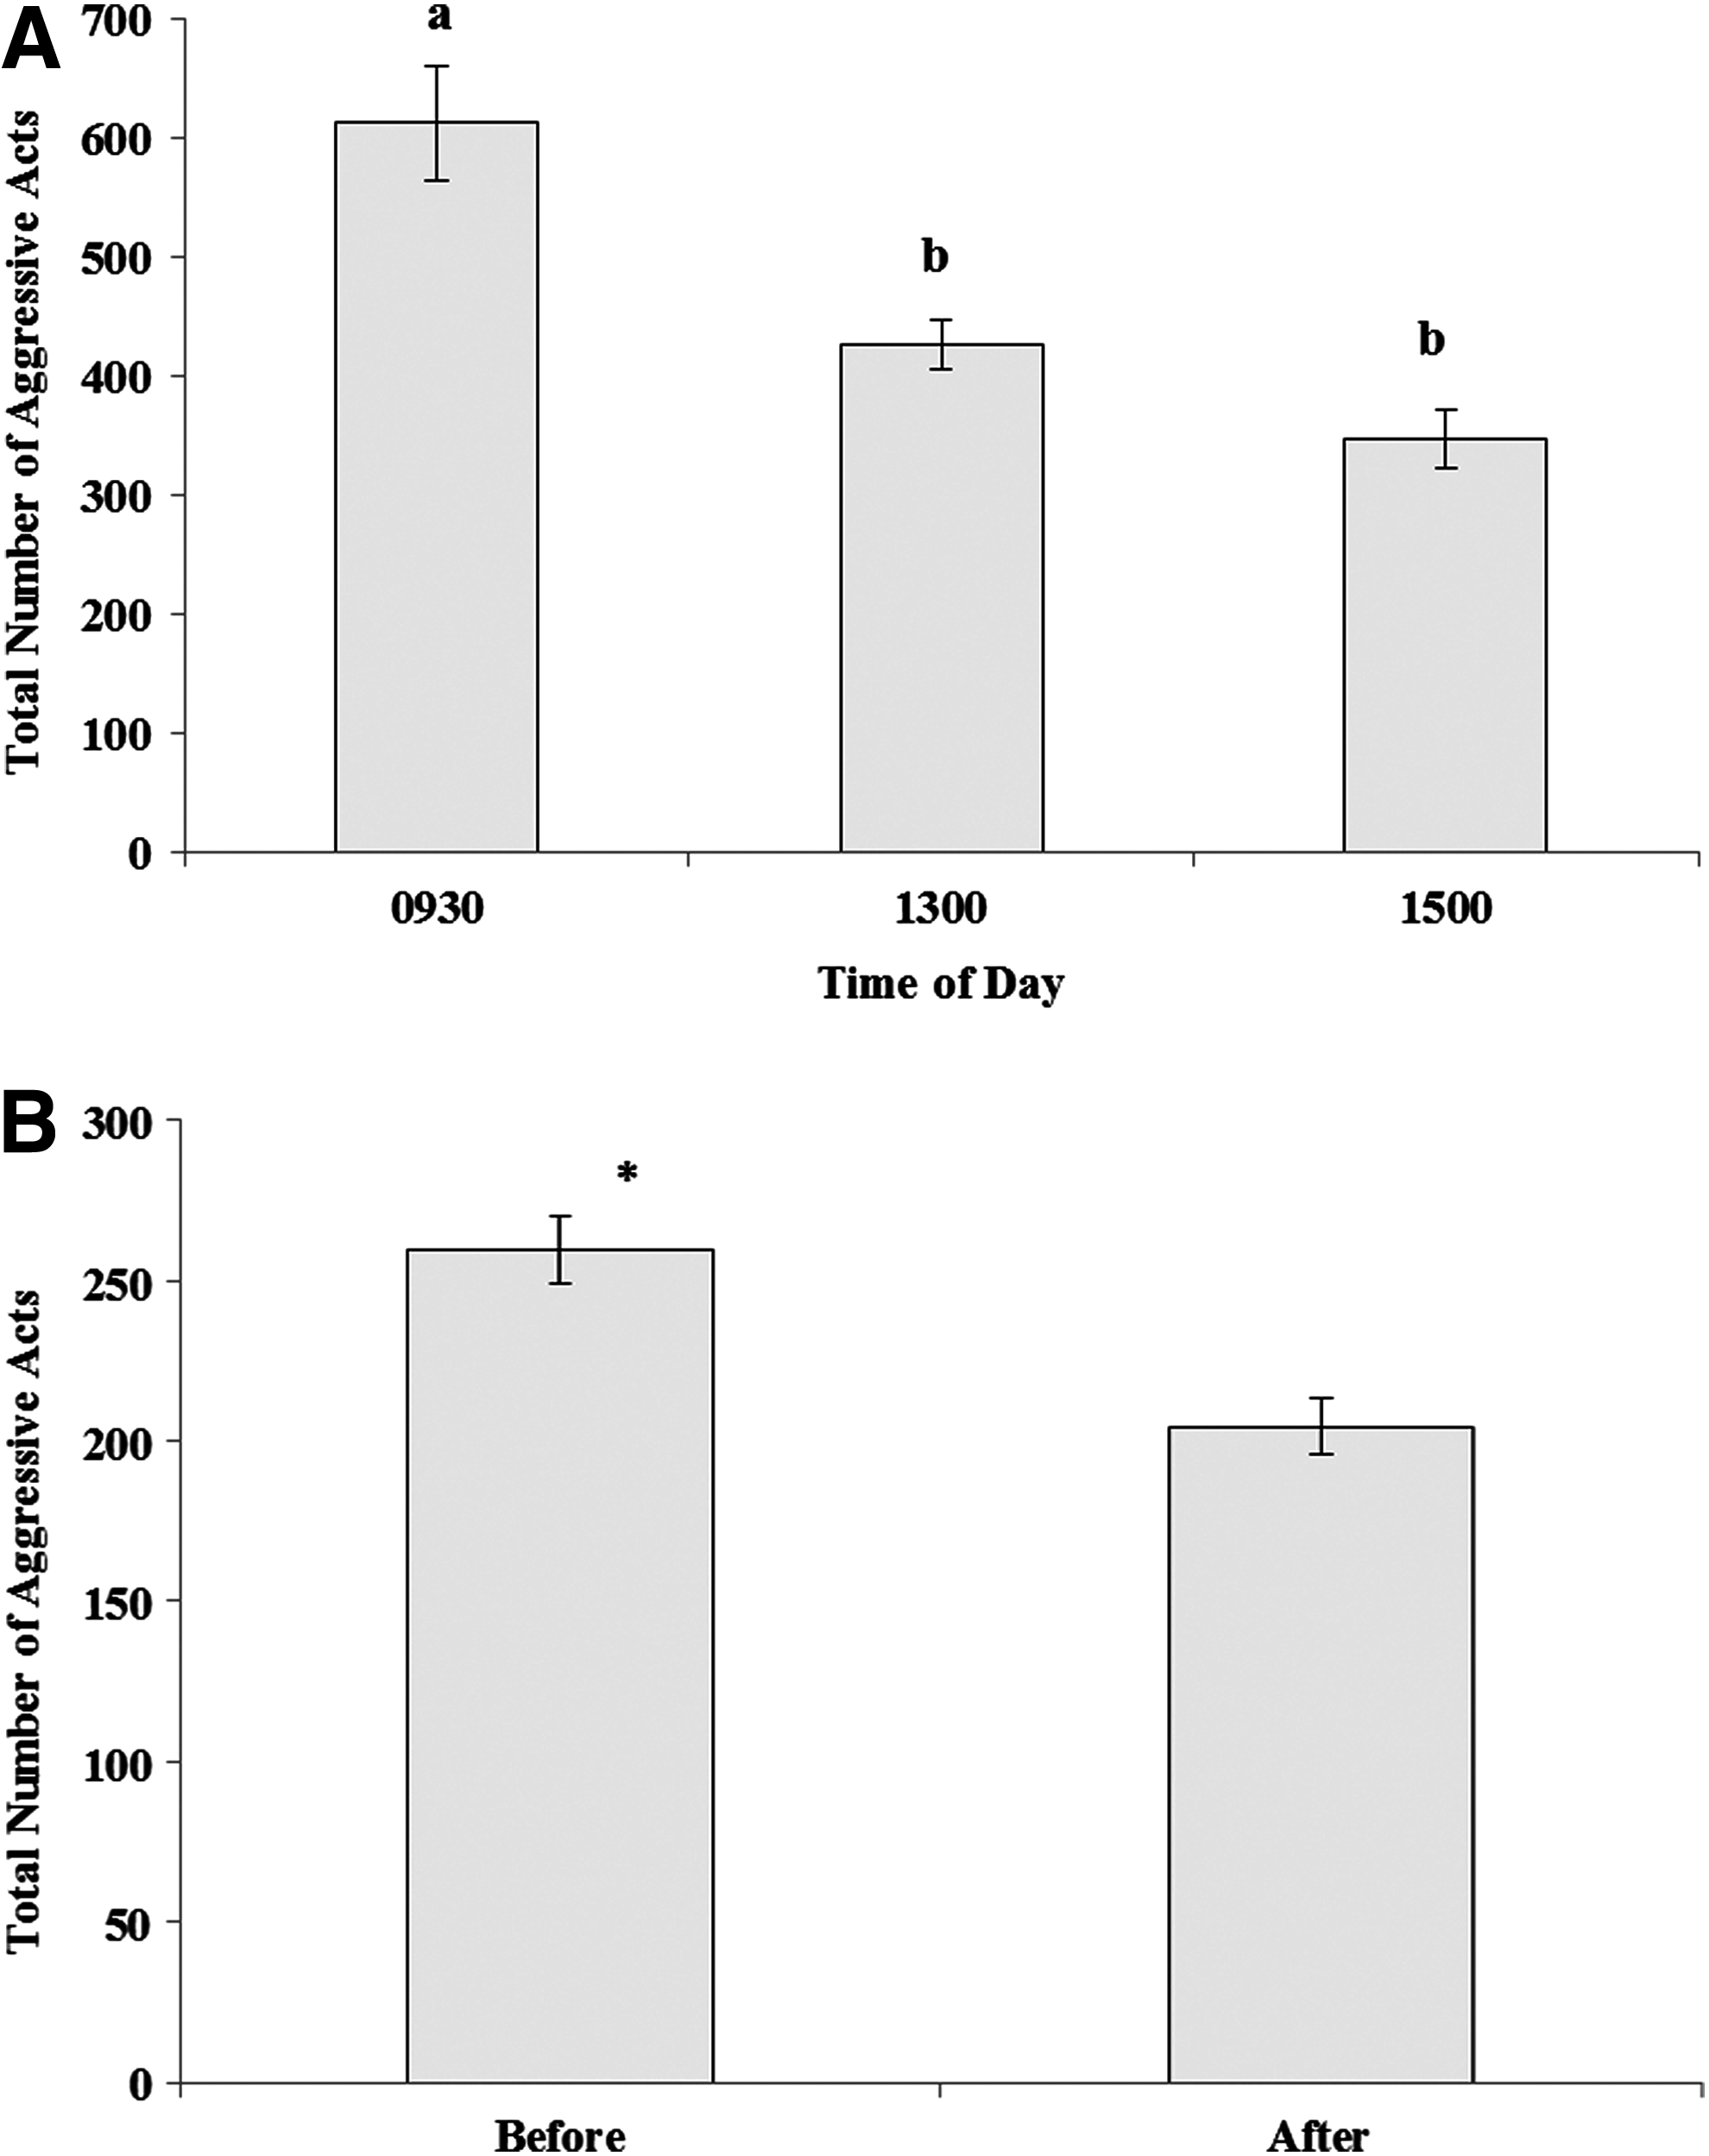
Total number of aggressive acts (±standard error [SE]) for groups of five zebrafish recorded at three different times of day
Environmental enrichment
There was no significant effect of day (RM ANOVA: p=0.360) or diet (RM ANOVA: p=0.350) on the proportion of time spent in the environmental enrichment. Time spent in the environmental enrichment did not vary throughout the day (RM ANOVA: p=0.167). Addition of a novel object did not have a significant effect on the proportion of time spent in the environmental enrichment (Paired t-test: p=0.255).
Shoal cohesion
Shoaling behaviors were consistent across the 3 days that they were recorded (RM ANOVA: p=0.668). Shoal cohesion was not affected by diet (RM ANOVA: p=0.897) but fish formed more cohesive shoals in the afternoon compared with the morning or midday (RM ANOVA: p<0.0001; Fig. 2A). In addition, placing of a novel object in the tank significantly reduced shoal cohesion (Paired t-test: p<0.001; Fig. 2B).
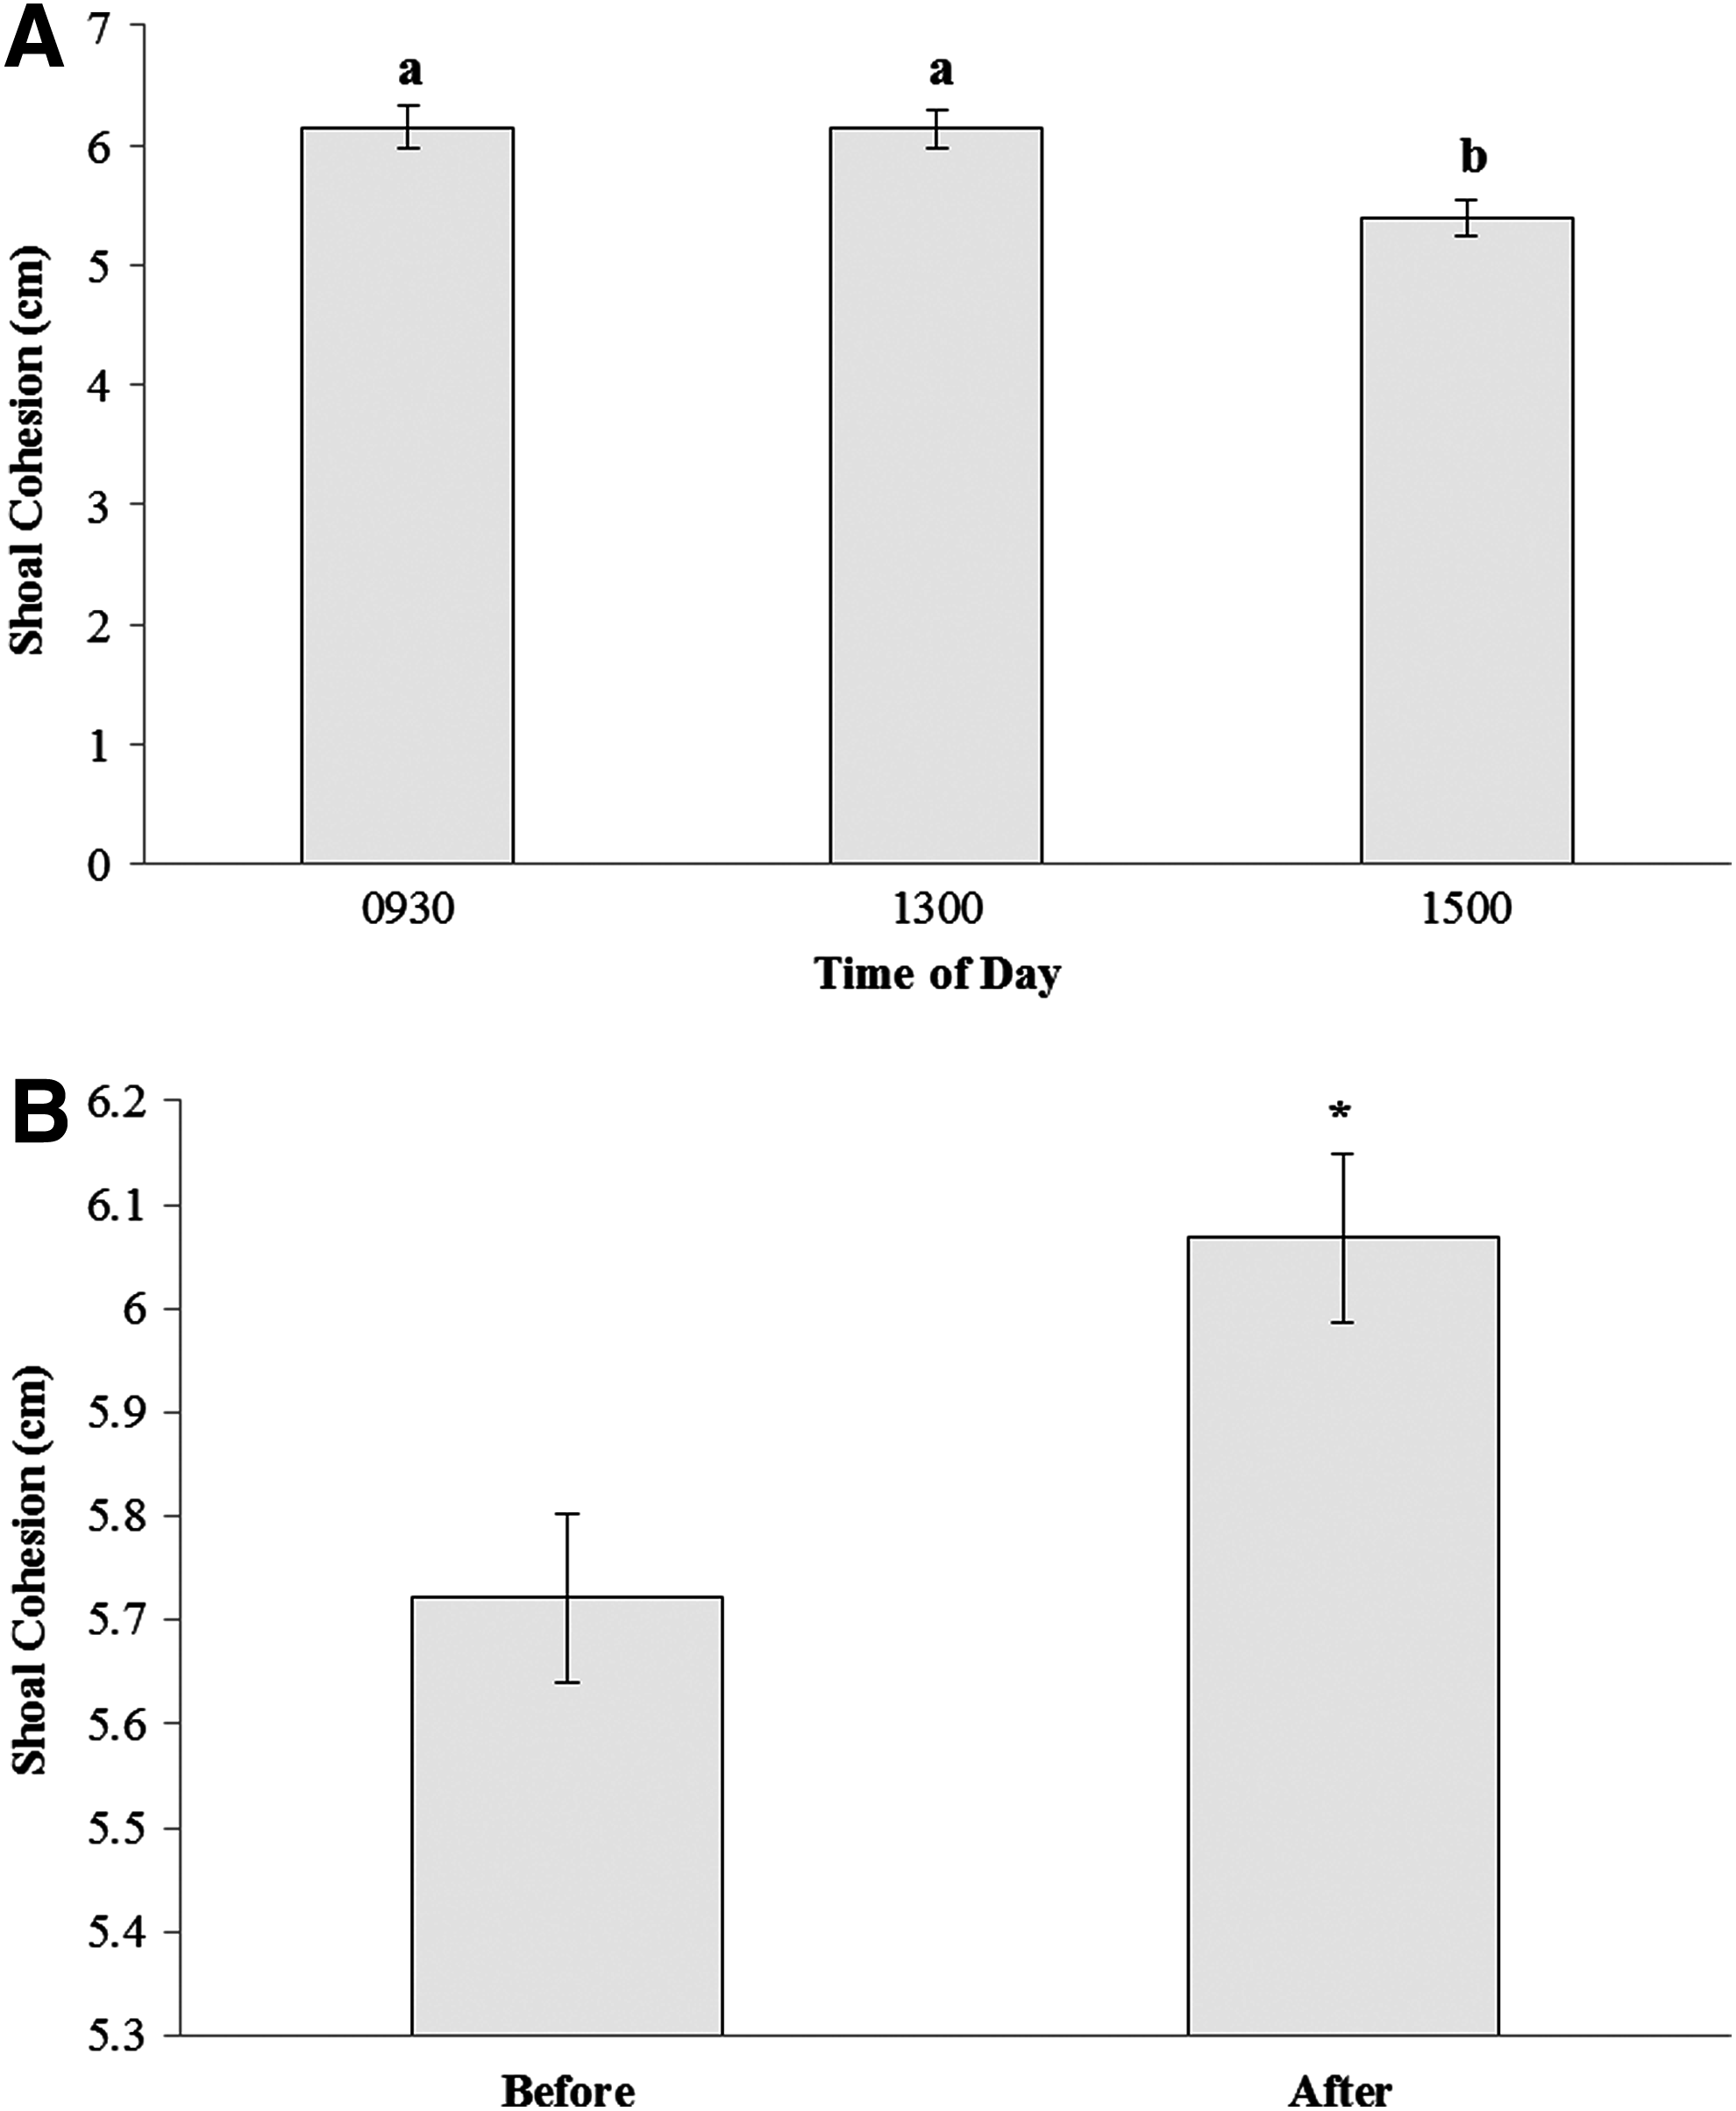
Mean shoal cohesion (±SE) for groups of five zebrafish at three different times of day
Latency to feed
Latency to feed for the first fish (RM ANOVA: p=0.221) as well as the majority of fish (RM ANOVA: p=0.732) did not change with time. However, diet had a significant effect on the time taken for the first fish to start feeding (RM ANOVA: p=0.047) although post hoc analyses did not reveal specific differences between treatments (Fig. 3). No significant effect of diet was found for the majority of fish (RM ANOVA: p=0.420).
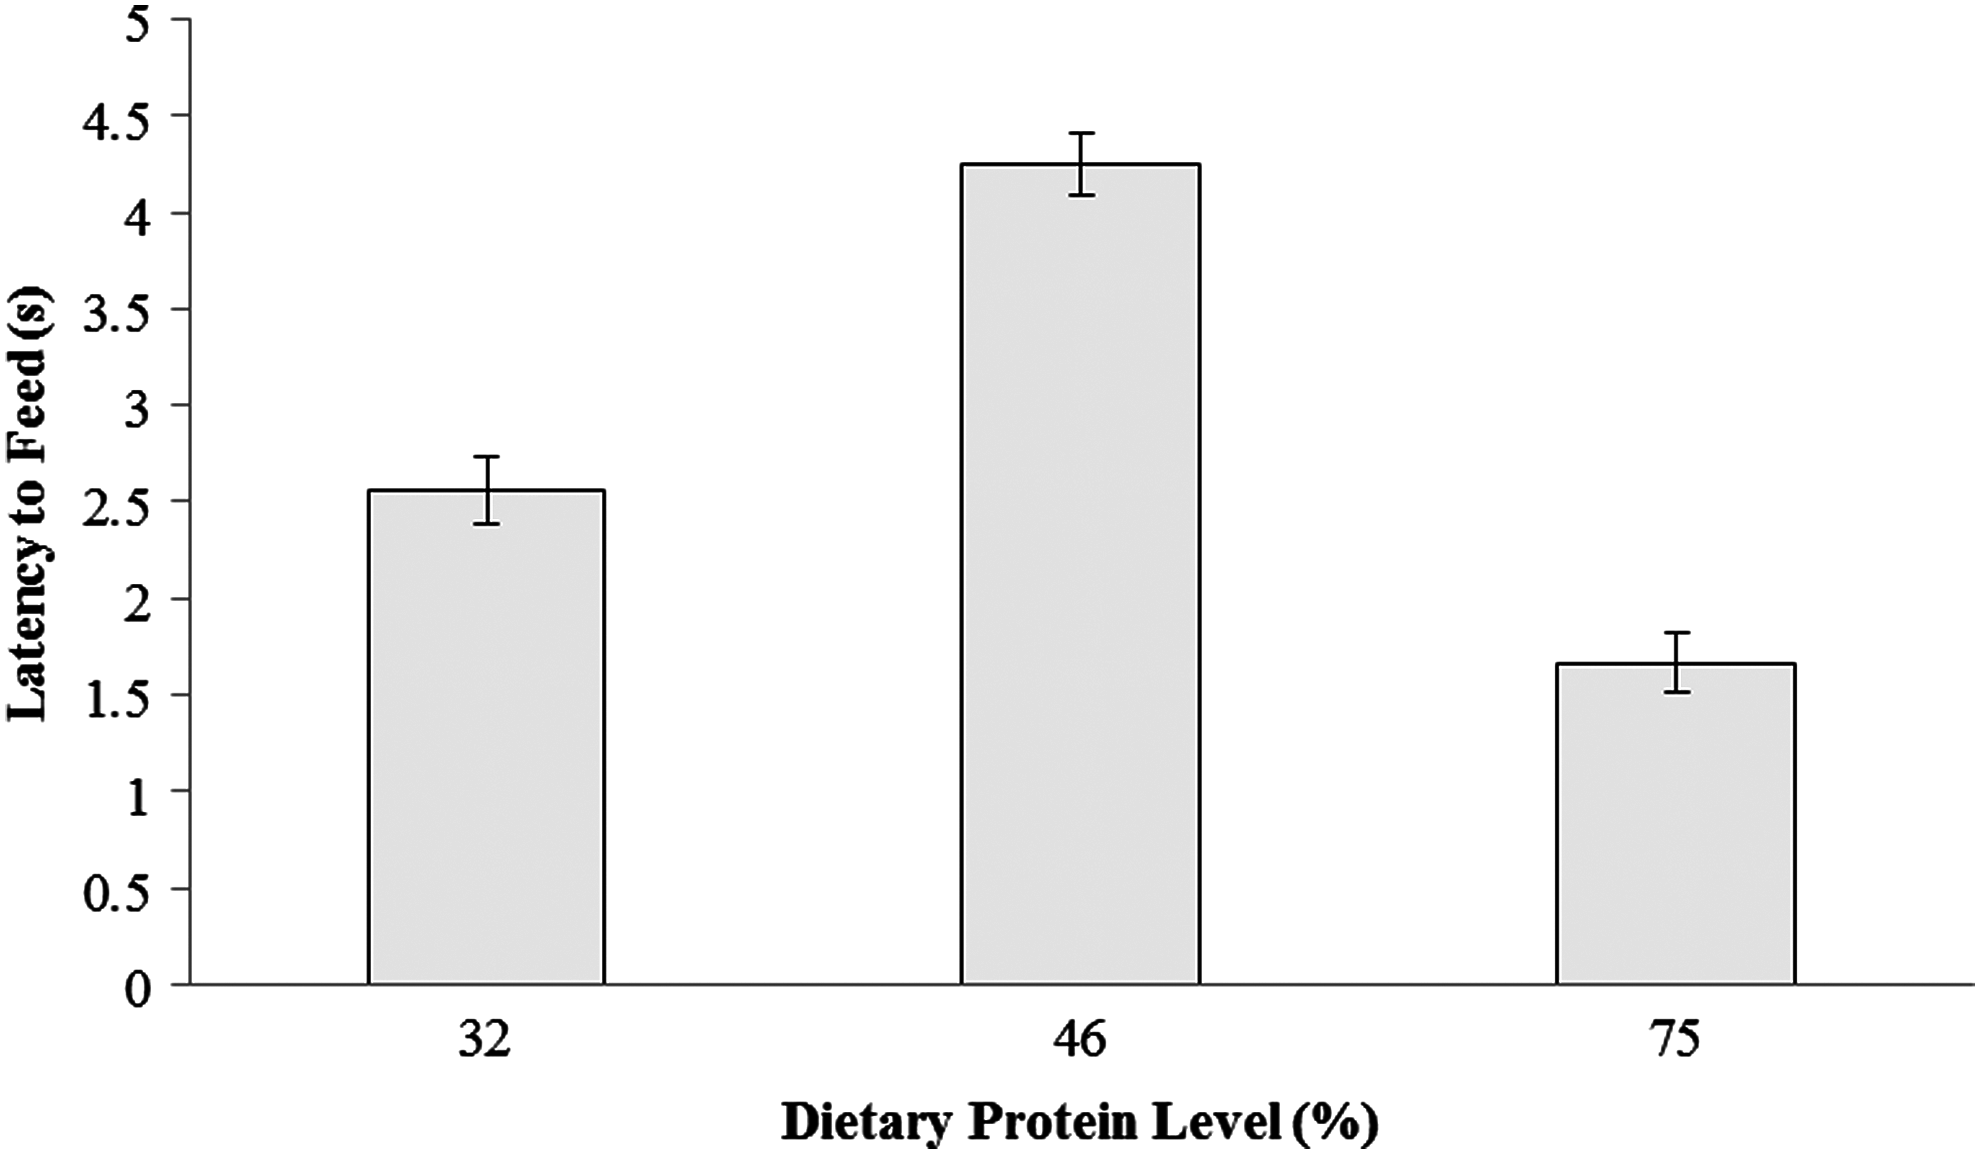
Mean latency to feed for the first fish (±SE) fed a 32%, 46%, and 75% protein diet (n=6).
Discussion
This study investigated the dietary protein and lipid requirements of zebrafish (D. rerio) using growth, oxygen consumption, and behavior measures. Our data demonstrate that zebrafish fed a 32% protein diet with 8% lipid produced from the specific raw materials used in this study was sufficient to meet their demands for growth when fed at 5% of their biomass. Caution should be used when feeding diets beyond a fish's protein requirement, as ammonia excretion will increase with dietary protein content.39–42 Unnecessarily high protein diets can therefore have a negative impact on water quality, increasing the required maintenance of fish tanks to sustain a healthy environment. Future studies should focus on the use of commercially extruded trial diets measuring additional parameters such as reproductive output, water quality, and stress responses.
Growth, metabolic rate, and behavior of our zebrafish were not affected by feeding diets (5% of their BM a day; BM/day) with protein levels above 32% or by increasing the lipid level above 8% (in a 46% protein diet). Fish biomass data gained from behavioral observations showed a clear outlier—this increased variability fourfold. After statistical consultation, this outlier was removed from the data set. Overall though, fish fed the 2% ration showed lower growth than fish fed the 5% ration, as might be expected; indeed, all fish fed the 2% ration lost mass. It is likely that the 5% ration, fed over four feeds a day, provided a sufficient amount of protein to the fish, even when the actual protein content was low (32%). However, when food was limited, protein content of the diet became far more important. Despite growth being a secondary measure from these behavior trials, the findings highlight the impact of feeding regimes on the fish's physical health and thus their welfare.4,43
On comparing the data between feeding trials one and two, similar growth parameters (SGR, MG, and FCR) would have been expected for fish fed 45% protein; however, F1 fish generally had more favorable growth parameters than F2 fed fish. As fish were group spawned, this could be a result of different parents, spawning date, and individual variations of the fish for trials, which cumulatively could lead to different growth rates between batches of fish. Zebrafish fed the 75% protein diet in the second feeding trial, and the 16% crude lipid diet in the third feeding trial had significantly greater condition indices compared with fish fed lower protein and lipid diets within those feeding trials. Condition index is a predictor of energy reserves (lipid, protein, glycogen, and total energy) in fish. 44 So, our results suggest that zebrafish fed the 75% protein diet and the 16% lipid diet had increased energy reserves compared with zebrafish fed the lower protein and lipid diets. Caloric content of the diet is mostly derived from lipids, fuelling protein catabolism, 45 with the use of dietary protein increasing until a plateau is reached.19,22 Given that growth of zebrafish was unaffected by dietary protein or lipid inclusion, this suggests that fish fed the lower nutrient inclusions (protein/lipid) obtained sufficient energy from their diet to utilize protein to the same level as fish fed the higher nutrient inclusions. Therefore, the most likely cause of the high condition index is deposition of spare nutrients as lipids in tissues of the fish. 44 Although behavior was not examined for these treatments, Yilmaz et al. 23 showed that common carp fed a high calorie diet had reduced swimming, foraging, and grouping activity compared with carp fed lower calorie diets, which might be a behavioral indicator of lower welfare. However, the reproductive output and fecundity of zebrafish fed high lipid diets should be investigated, as the increased condition index of zebrafish on high protein and high lipid diets may be beneficial for the production and maternal provisioning of fish eggs. 45
Oxygen consumption was measured to see whether the diets caused any change in metabolic rate. The physiological reaction of stress can cause an alternative allocation of energy in an organism that could be manifested as an increase in oxygen consumption, a reduction in growth, or both. 18 Given that neither outcomes were observed, this suggests that the treatments did not cause a stress response; thus, welfare was not negatively impacted. Future metabolic studies should establish the specific oxycaloric coefficient for zebrafish. This would provide the metabolizable energy requirements for maintenance and growth of zebrafish 18 while providing data for the specific dynamic action associated with dietary energy utilization in these fish. Understanding these energy requirements would allow diets to be tailored directly to the bioenergetics needs of the zebrafish, benefiting their welfare.
Latency to feed was the only behavior, out of the four measured, to be affected by diet. However, this significant effect was observed only for the latency to feed of the first fish; diet did not affect the time it took the majority of fish to start feeding. Excluding diet as a factor, other observations of zebrafish behavior were noted. Aggression levels and shoal cohesion clearly changed as the day progressed. Fish were more aggressive in the 0930 observations compared with the 1300 and 1500 observations. A similar relationship was identified in Atlantic salmon, Salmo salar, where individuals showed the highest aggression in the morning with aggression progressively decreasing with light intensity.46,47 It was suggested that a breakdown of social order during the night, when fish did not have visible contact, could be the cause of greater aggression in the morning.46,47 As zebrafish use visual displays to establish social status, 31 this may also be true here. Increased aggression in the mornings could also be related to hunger, because fish were fed only once a day at 1320.27,48 However, aggression was significantly lower at 1300 (Fig. 2) just before the addition of food, when hunger levels of the fish should have been the highest. Other studies have found that groups of fish with more pronounced aggressive behaviors show reduced levels of schooling.38,49 During chases, fish can break away from the group and increase the average shoaling distance. Therefore, when aggression is high, the uniformity of a shoal is disrupted. Both the level of aggression and shoal cohesion were affected by the addition of novel object. Avoidance of a novel object is a known determinant of a fear response. 50 Thus when presented with a possible threat, zebrafish reduced their aggression and formed less cohesive shoals. Saxby et al. 38 found that the addition of a novel object increased darting behavior of neon tetras. Here, the fish responded to the novel object by reducing shoal cohesion.
Zebrafish researchers have begun to understand the impact of nutrition on the health and welfare of their fish routinely being used as biological model organisms, and the potential impact that poor nutrition may have on research findings. In contrast, standard, open formulation diets are available for other commonly used model organisms such as rodents—a need that was addressed many years ago. However, the equivalent is not available for zebrafish, largely due to the very limited amount of information available regarding the nutritional requirements for this important cyprinid species.
Refining the husbandry of this fish, which includes nutrition, may reduce the numbers of fish utilized to accomplish specific research needs. To meet this goal, additional studies are required to further investigate the nutrient requirements of zebrafish by using commercially extruded diets with additional parameters to measure welfare, such as reproductive output, stress responses, water quality, and swimming performance of zebrafish fed the diets under different feeding regimes. The findings from such studies should then be used to produce standardized open formulations and feeding regimes for zebrafish, meeting the welfare needs of the zebrafish and enabling studies to be comparable between research facilities worldwide.
Footnotes
Acknowledgments
The authors thank S. McMahon, A. Atfield, B. Eynon, and L. Preston for technical assistance, and the WALTHAM® Foundation for a grant to KAS that funded this research.
Disclosure Statement
No competing financial interests exist.