
Abstract
Abstract
Immediate early genes (IEGs) are transcription factors whose own transcription is initiated rapidly, for example, in the brain in response to environmental stimuli. c-fos is an IEG often used as a marker of neuronal activation. c-fos mRNA expression has started to be quantified and localized in the zebrafish brain following environmental manipulations but analysis of the expression of c-fos protein in the zebrafish brain has rarely been attempted. Here, we describe an immunofluorescence staining method for quantifying c-fos protein expression in different regions of the zebrafish brain. In addition, we expose zebrafish to caffeine, a positive control for c-fos activation in the brain. To confirm cell nucleus specific binding of the c-fos antibody, we counterstained brain sections with the nuclear fluorescent stain DAPI. Furthermore, we describe a method for reducing background autofluorescence often observed in zebrafish brain tissue. Our analysis showed that exposure to caffeine increased the number of c-fos protein-positive cells in specific zebrafish brain regions detected by the immunofluorescence method. Our results demonstrate the feasibility of immunofluorescence-based methods in the analysis of neuronal activation in the zebrafish brain, and reinforce the utility of the zebrafish in behavioral neuroscience research.
Introduction
T
A common approach to investigating the neural correlates of behavioral responses among vertebrates is to examine markers of neuronal activation. In vertebrates including zebrafish, induction of expression of the immediate early gene (IEG) c-fos has been used as a measure of neuronal activity.17–20 IEGs represent a group of genes that are rapidly transcribed following neuronal activation. 21 Quantification and localization of c-fos mRNA in the zebrafish brain in response to pharmacological and/or environmental stimulation has been used to examine neuronal activation.19,20,22,23 Quantification of c-fos gene expression at the mRNA level has been used as an index of neural activation. However, the quantified mRNA levels do not always correlate with translated protein levels due to a number of post-transcriptional, translational, and post-translational modifications. Unfortunately, quantification of c-fos protein expression in the zebrafish brain has been limited due to a number of technical problems. In this study we describe a simple immunofluorescence staining protocol for quantifying c-fos protein expression in different regions of the adult zebrafish brain. We compare the expression of c-fos protein in zebrafish exposed to system water or caffeine, a stimulant known to induce c-fos expression in rodents.24,25 In addition, we address common methodological concerns including nuclear counter staining and background autofluorescence commonly observed in sections of the brain of adult zebrafish.
Materials and Methods
Reagents and materials
We employed the following reagents and materials: 4% paraformaldehyde solution (50 mM sodium phosphate, pH 7.4), 10%, 20%, and 30% sucrose solution (Cat. No. S0389; Sigma Aldrich), Fisherbrand Superfrost Plus Microscope slides (Cat. No. 12–550-15; Fisher Scientific), cover slips (12-548-5P; Fisher Scientific), Stockholm's phosphate-buffered saline (sPBS: 10 mM sodium phosphate, 2.7 mM KCl, and 137 mM NaCl, pH 7.4), normal donkey serum (Cat. No. D9663; Sigma Aldrich), anti c-fos polyclonal antibody produced in rabbit (Cat. No. C2813; Santa Cruz Biotechnology), anti-rabbit IgG coupled to FITC produced in goat (Cat. No. F9887; Sigma Aldrich), Shandon PermaFluor Mountant (Cat. No. 434990; Thermo Scientific), caffeine (Cat. No. C0750; Sigma Aldrich), sodium borohydride (Cat. No. 7420–1; Caledon Laboratories Ltd), DAPI (Cat. No. D9542; Sigma Aldrich), 4 × Laemmli sample buffer (Cat. No. 1610747; Bio-Rad), and anti-rabbit antibody coupled to horseradish peroxidase (HRP) developed in goat (Cat. No. A-6154; Sigma Aldrich).
Animals and housing
Adult 12-month-old zebrafish of the AB strain were obtained from the University of Toronto Mississauga Vivarium. The progenitors of this population were originally obtained from the ZFIN Center (Eugene, OR). Zebrafish were housed in 37 L tanks (∼20 per tank) in with system water (supplemented with 100 mg/L Instant Ocean Sea Salt) and mechanical/biological filtration. Zebrafish were kept on a 14–10 light–dark cycle with lights turning on at 8:00 and turning off at 22:00.
Caffeine exposure
Zebrafish were exposed to either 100 mg/L caffeine or system water for 1 h in a 2.7-L Plexiglas tank (n = 5 per group). The dose of caffeine chosen for this study was previously shown to significantly alter anxiety-like behavioral responses in adult zebrafish. 26
Tissue fixation and cyroprotection
Immediately following the 1 h exposure to caffeine or system water, zebrafish were netted from the exposure tank and placed on a paper towel. The head was quickly decapitated just posterior of the gills and immediately placed in 4% paraformaldehyde (in PBS) for 24 h at 4°C. Heads were then sequentially placed in 10% (2 h), 20% (4 h), and 30% (24 h) sucrose at 4°C to cryoprotect the tissue before freezing.
Cryosectioning
The entire zebrafish head was sectioned at 20 μm using a Microm HM 520 Cryostat after mounting with HistoPrep frozen tissue embedding media (Cat. No. SH75-125D; Fisher Scientific) at −25°C. Tissue sections were transferred onto Fisherbrand Superfrost Plus Microscope slides and were dried for an additional hour. Slides were subsequently stored at −80°C until immunohistochemistry was performed.
Immunohistochemistry
Slides were dried at 45°C on a slide warmed for 1 h before staining. Background autofluorescence was reduced using a previously described protocol with modifications for zebrafish tissue and according to the intensity of the observed autofluorescence.27,28 Sections were incubated with 1 mg/mL sodium borohydride in ice-cold sPBS for 15 min four times and rinsed with sPBS three times in between incubations. All steps for autofluorescence reduction were performed on ice. Following sodium borohydride treatment, sections were incubated in 5% normal donkey serum in sPBS containing 0.3% Triton X-100 for 10 min to block non-specific binding. Sections were then incubated in the primary anti-c-fos polyclonal antibody developed in rabbit (1:200 dilution using 5% normal donkey serum in sPBS) overnight at 4°C. The slides were then washed with sPBS four times (5 min each) and incubated with the secondary anti-rabbit antibody coupled to FITC (1:200 dilution using 5% donkey serum in sPBS) for 2 h at room temperature in the dark. The sections were then washed four times (5 min each) with sPBS and counterstained with 0.5 μg/mL DAPI in sPBS for 10 min in the dark and subsequently washed with sPBS four times. Slides were then mounted using Shandon PermaFluor Mountant with FisherBrand coverslips. Sections were dried overnight in the dark, and subsequently stored at 4°C. For our negative control experiment to examine the specificity of the secondary antibody, we substituted the primary antibody with 5% normal donkey serum in sPBS.
Image analysis
Immunoreactive cells were imaged using an immunofluorescence microscope (Olympus BX60) and quantified using Image-Pro Plus (Media Cybernetics, Inc.). Appropriate excitation filters for FITC and DAPI were used to obtain images at 20× or 40× magnification. Different brain regions were identified on the basis of surrounding landmarks and pictures were taken from identical sites. Figure 1 shows a schematic diagram of the sites where photomicrographs were taken. For analysis, four pictures were taken of a particular brain area from each section (two from the left side and two from the right side of the brain). Pictures were taken at 20× magnification for counting using a fixed exposure period for each type of stain (100 ms for DAPI and 6 s for c-fos). The exposure time chosen was based on the most optimal signal to noise ratio. c-fos and DAPI immunoreactive cells were quantified using Image-Pro Plus (Media Cybernetics, Inc.) using an automated count with a minimum cutoff value of 50. Background parameters for all pictures were set to identical settings using the digital control of the Image-Pro Plus software (Media Cybernetics, Inc.).
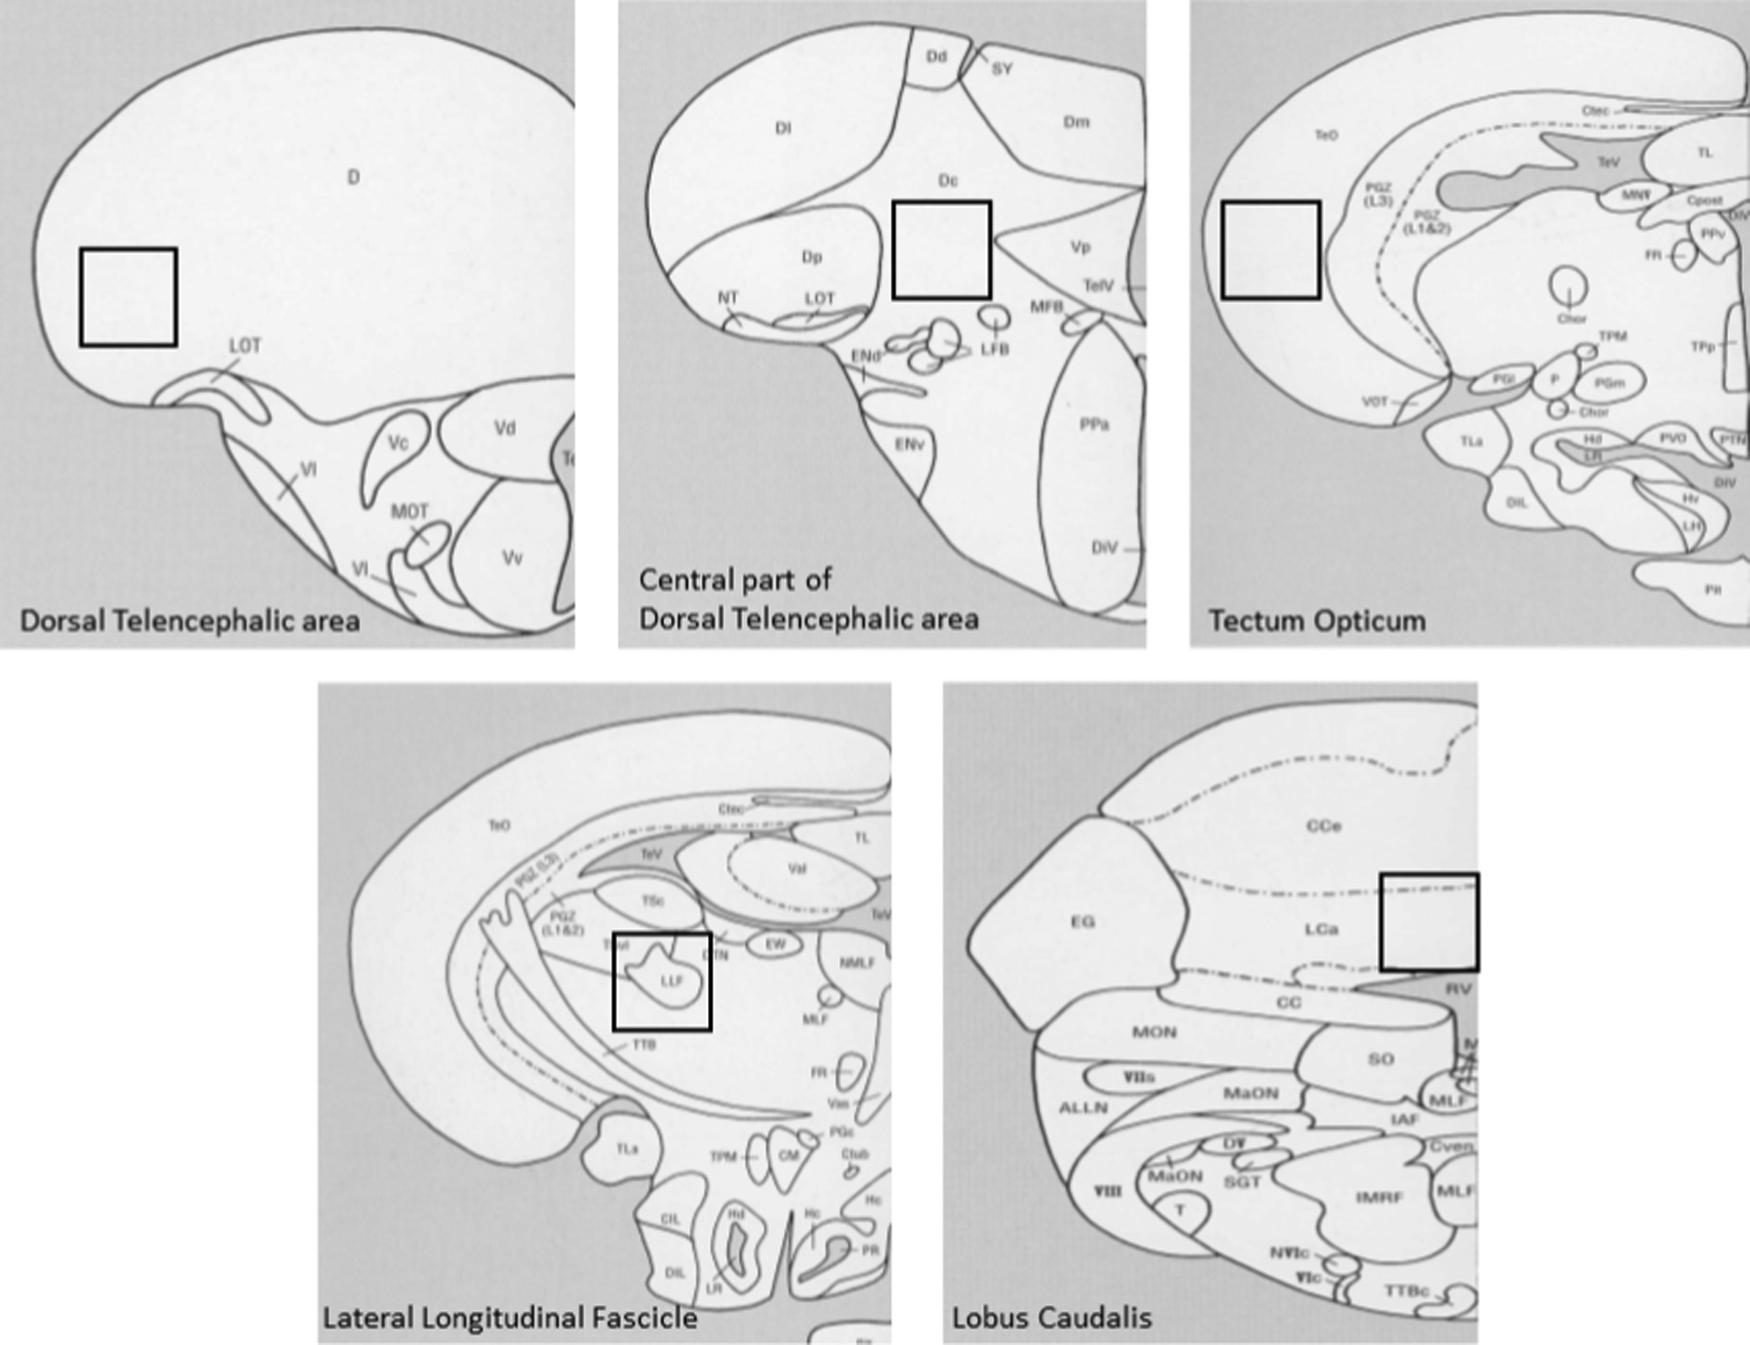
Coronal sections of the zebrafish brain are shown with a black box indicating the specific area that was examined. Figure adapted and modified from Wullimann et al. 33
Western blot analysis
Zebrafish brains were dissected and stored at −80°C. Brains were sonicated in 30 μL of Tris-buffered saline (TBS). Protein concentration was determined using Bio-Rad protein assay dye reagent (Bio-Rad). 4× laemmli buffer was added to each sample (1 volume sample lysis +3 volume sample buffer) and boiled for 2 min. Twenty micrograms of protein from each sample were loaded onto each lane of a 7.5% polyacrylamide gel (Bio-Rad) and separated by electrophoresis. Separated proteins were transferred to a nitrocellulose membrane using a Bio-Rad mini transblot apparatus. Membranes were incubated with 5% non-fat dry milk in TBS containing 0.1% Tween-20 for 2 h at room temperature to block nonspecific binding. The membrane was then incubated in the primary anti-c-fos polyclonal antibody (1:600 dilution) overnight at 4°C. The membrane was subsequently washed with TBS containing 0.1% Tween-20 four times (5 min each). The membrane was then incubated in a secondary anti-rabbit antibody coupled to HRP (1:5000 dilution) for 1 h at room temperature and subsequently washed with TBS containing 0.1% Tween-20. Immunoreactivity was visualized using the enhanced chemiluminescence method according to the manufacturer's instructions (GE Healthcare Bio-Sciences Corp.) and imaged using a phospho-imager.
Statistical analysis
To examine whether caffeine exposure increased c-fos protein expression in brain specific areas we conducted a two-way ANOVA with “caffeine treatment” and “brain region” as the between subject factors. In the case of significant (p ≤ 0.05) main effects or interactions, we conducted 5 one-tailed independent sample t-tests with Holm-Bonferroni correction to compare the number of immunoreactive c-fos-positive cells in five different brain regions between system water and caffeine-treated zebrafish with significance threshold at p ≤ 0.05.
Results
Specificity of the c-fos antibody
Western blot analysis revealed that the anti c-fos antibody used in this study detected a single band at ∼62 kDa, which corresponds to the molecular weight of c-fos protein in rats/mice, suggesting this antibody specifically reacts with the c-fos protein in zebrafish brain homogenate (Fig. 2).
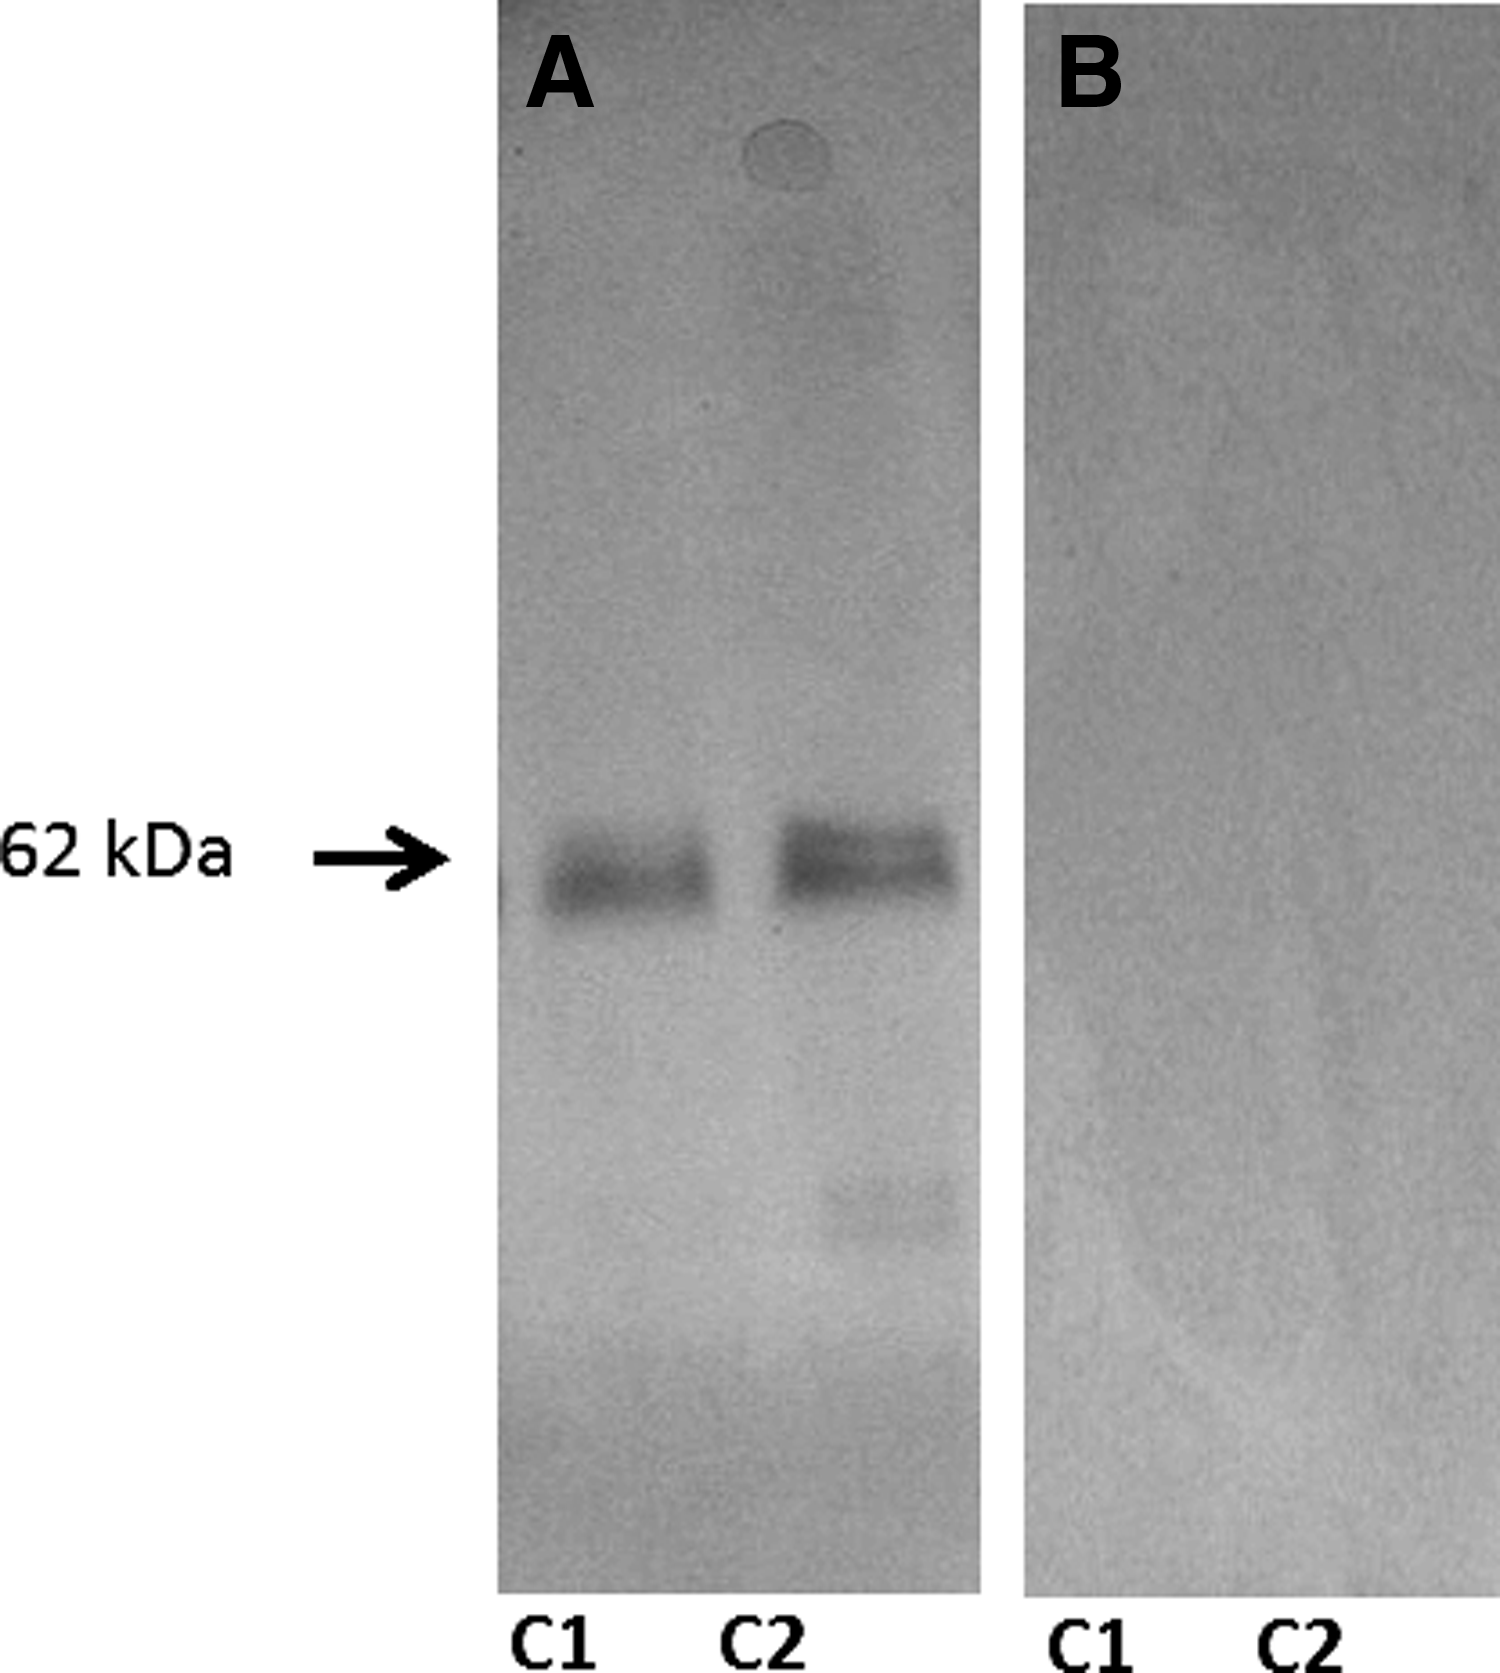
Western blot analysis of zebrafish brain homogenate identified a single band at ∼62 kDa using the primary anti c-fos antibody
Reduction of autofluorescence
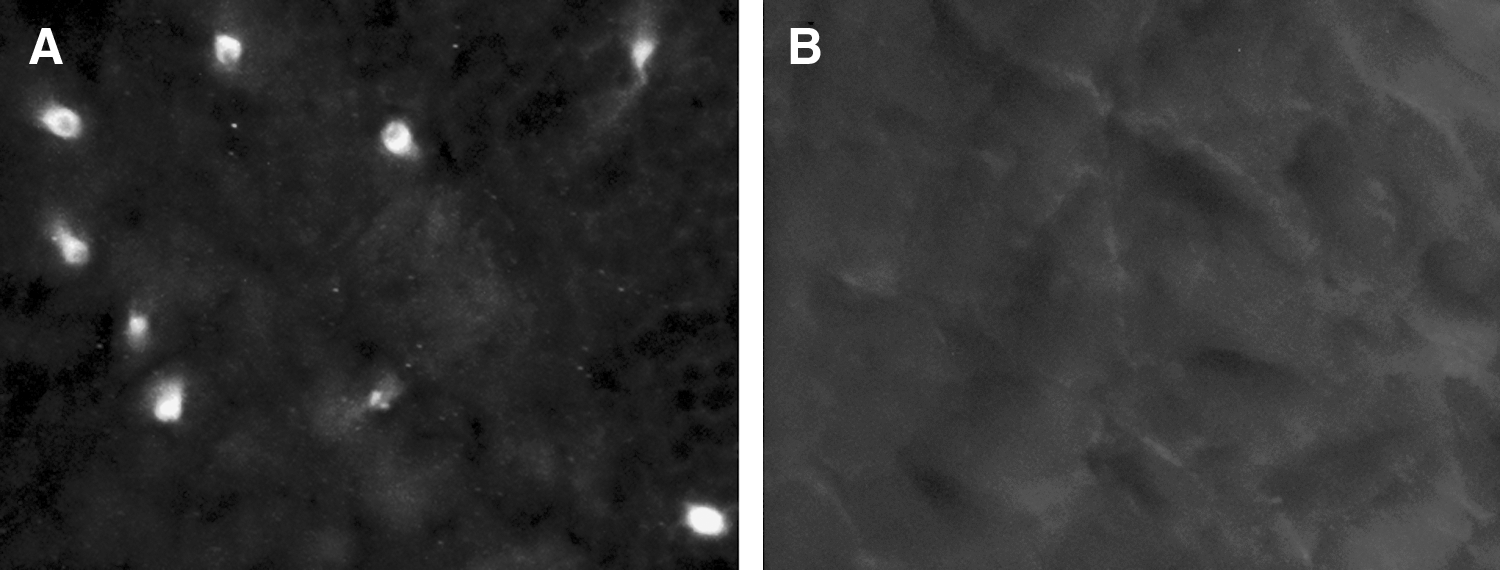
Initial preparation of zebrafish brain sections following fixation with paraformaldehyde and cryoprotection showed excessive background autofluorescence (Fig. 3A). Treatment with sodium borohydride (four incubations, 15 min each on ice) before c-fos immunostaining dramatically reduced background autofluorescence (Fig. 3B).
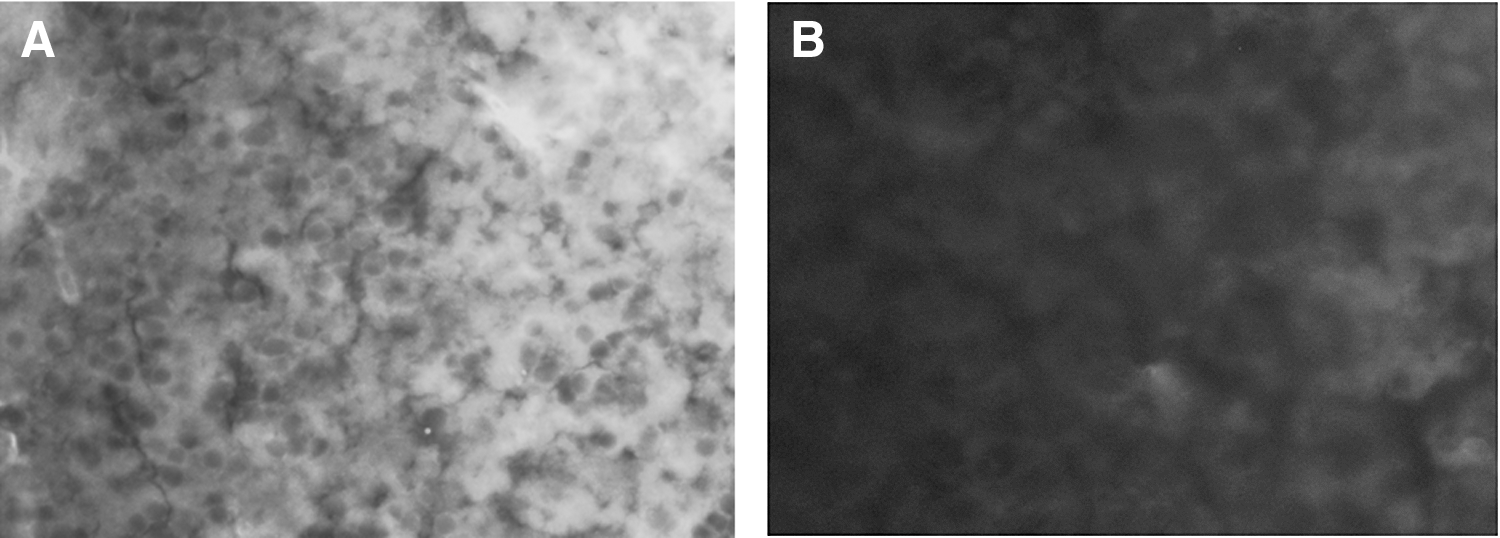
Background autofluorescence examined at 20× magnification in the dorsal telencephalic area of control zebrafish before
DAPI concentration for counterstaining
To determine the optimal concentration of DAPI, we tested four different concentrations (1, 0.5, 0.25, and 0.125 μg/mL) to use as a nuclear counter stain for zebrafish brain sections. Figure 4 shows the result of different concentrations of DAPI following 10 min of incubation in the dark. Based on the images obtained, we decided that 0.5 μg/mL of DAPI produced the greatest signal to noise ratio for zebrafish brain sections, and this concentration was used as a counter stain for c-fos labeling.
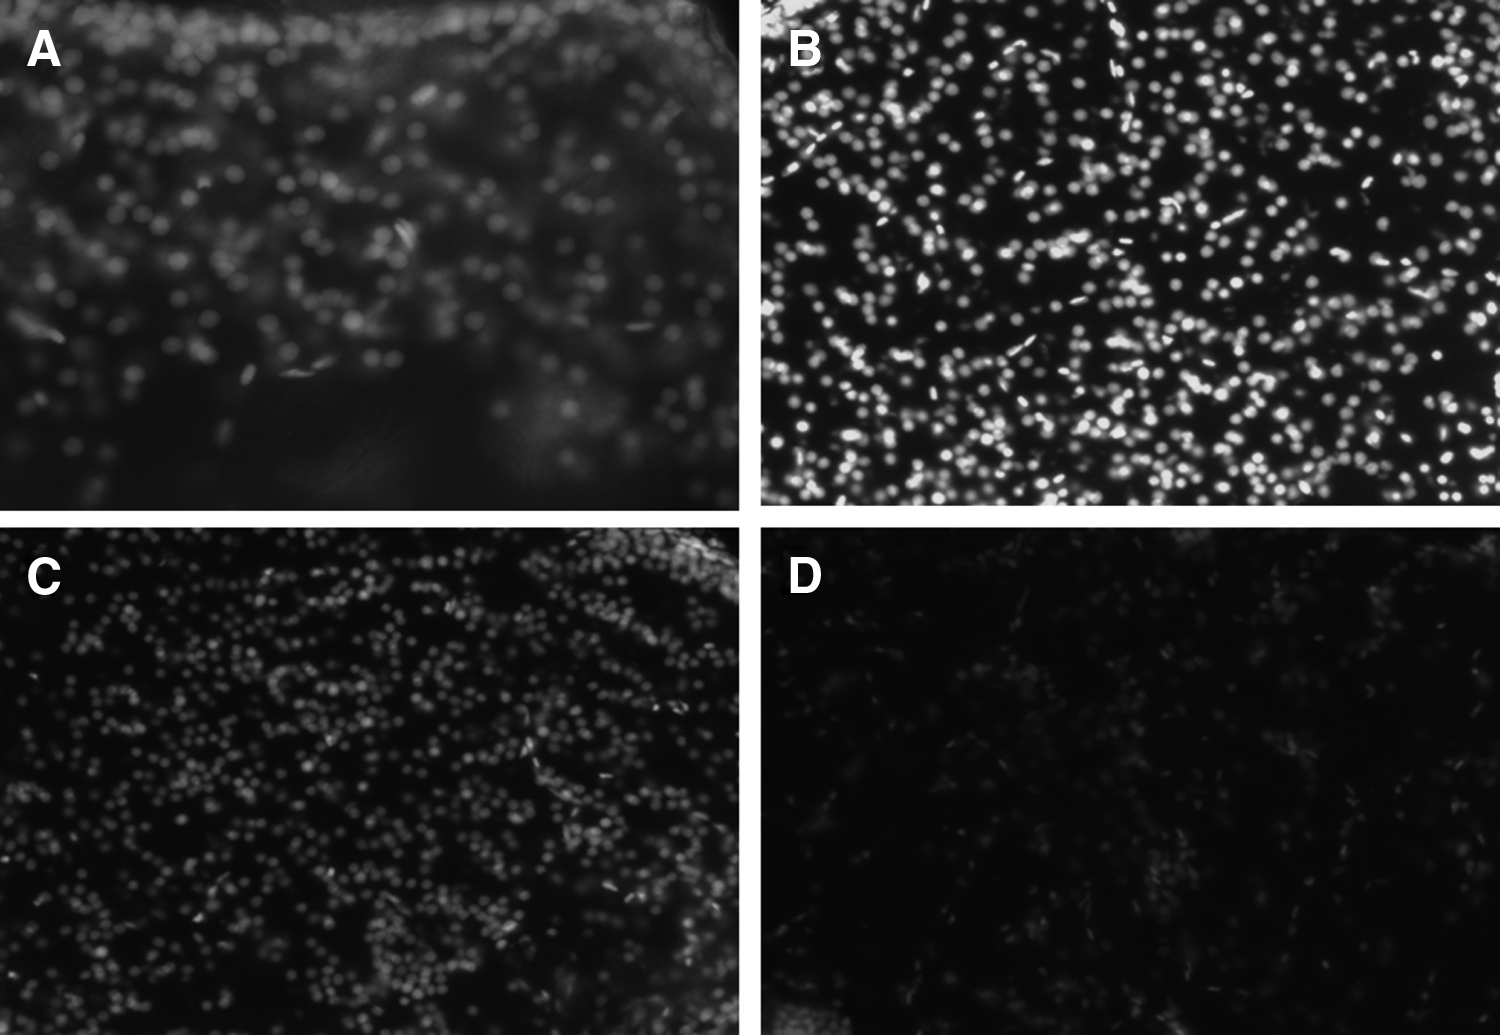
DAPI immunoreactive-positive cells in the central part of the dorsal telencephalic area stained with 1 μg/mL
Specificity of the FITC-conjugated secondary antibody
To determine the specificity of the secondary antibody, we examined the effect of incubating the secondary antibody with and without the primary antibody. Our results showed that the secondary antibody anti-rabbit IgG-FITC used in this study did not show nonspecific binding to zebrafish brain sections when the primary antibody was absent (Fig. 5).
c-fos immunoreactive-positive cells are observed at 40× magnification in the tectum opticum in zebrafish pretreated with caffeine when the section was incubated with the primary and secondary antibody
c-fos specific immunoreactivity
c-fos immunoreactivity was found to be region and cell nucleus specific in the zebrafish brain. For example, Figure 6A shows a larger number of c-fos immunoreactive cells in the Lobus Caudalis, which is only a fraction of all the cells present (DAPI counter stained) in that particular area (Fig. 6B). In contrast, Figure 6C showed very few immunoreactive cells in the Lateral Longitudinal Fascicle compared with all the cells present (DAPI counter stained) in the same area (Fig. 6D).
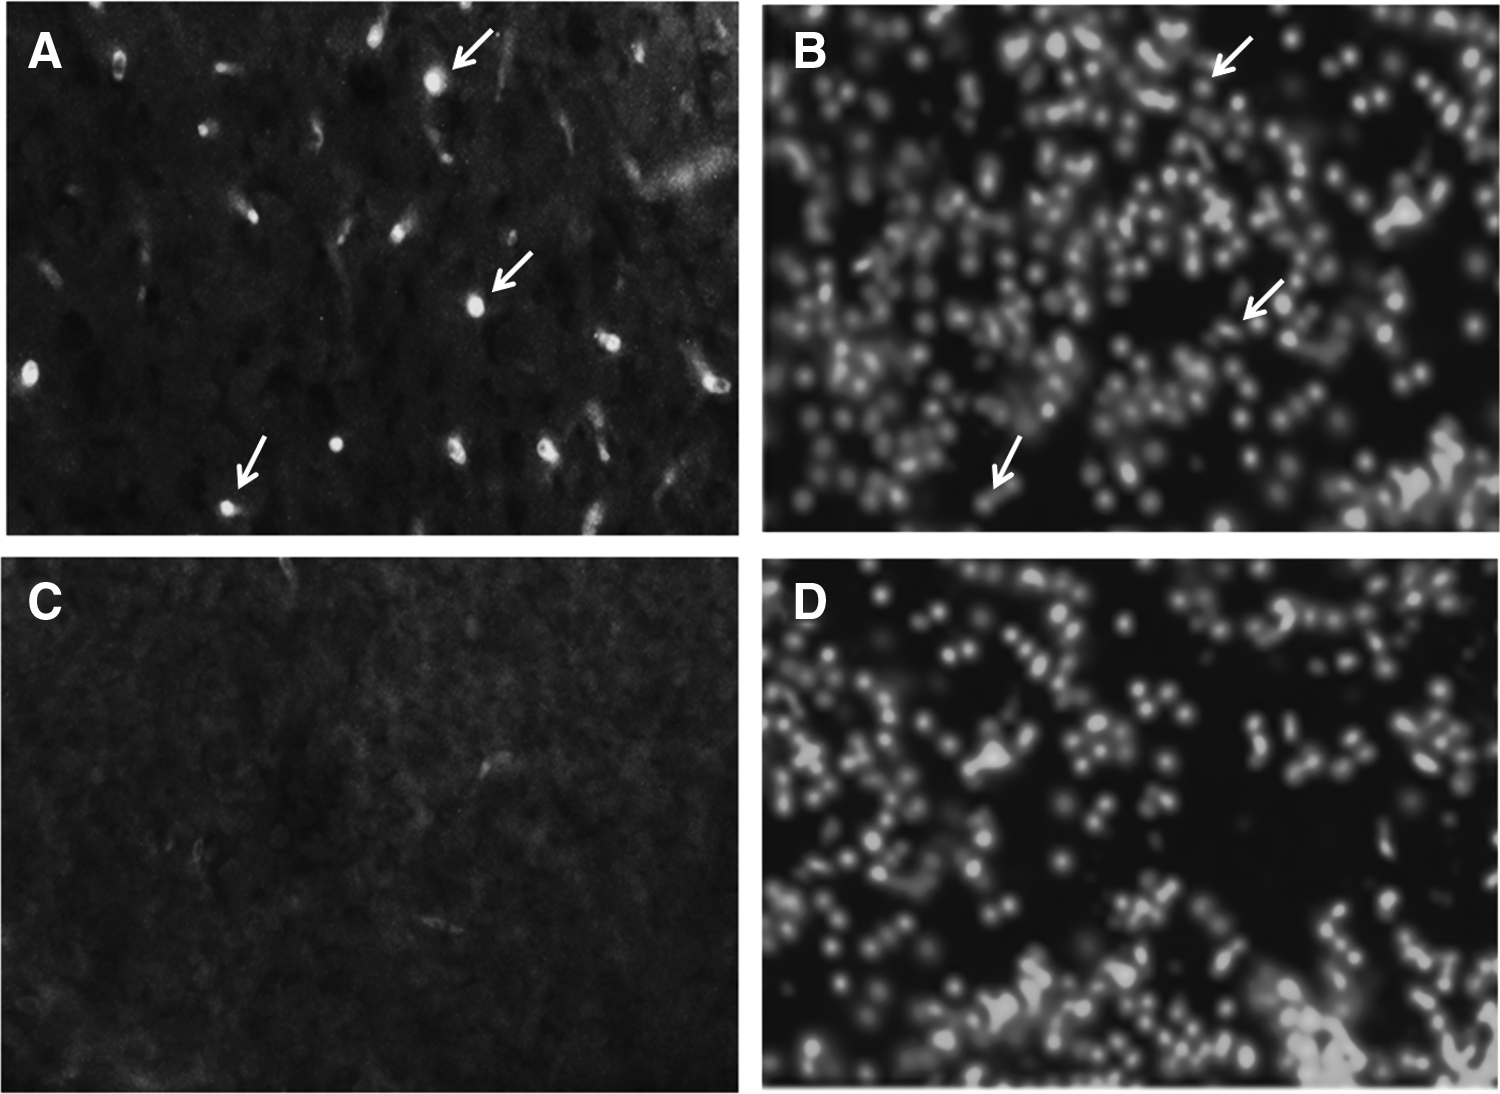
c-fos immunoreactive positive cells are observed at 20× magnification in the Lobus Caudalis of control zebraifsh
Activation of c-fos in brain-specific areas following caffeine treatment
We compared c-fos activation in different areas of the zebrafish brain in control and caffeine-treated zebrafish. ANOVA detected a significant main effect of caffeine treatment [F(1, 40) = 30.357, p < 0.001] but there was no main effect of brain region [F(4, 40) = 1.638, p = 0.184]. However, caffeine treatment was found to differentially increase c-fos protein expression in different regions of the zebrafish brain [F(4, 40) = 2.878, p = 0.035]. For example, Figure 7 shows the induction of c-fos protein in the Tectum Opticum following a 60 min exposure to either system water (Fig. 7A) or caffeine (Fig. 7B). One-tailed independent samples t-tests with Holm-Bonferroni correction determined that caffeine significantly increased c-fos protein expression in the central part of the dorsal telencephalic area, tectum opticum, and lateral longitudinal fascicle (p ≤ 0.024), but not in the dorsal telencephalic area, or the lobus caudalis (p > 0.05) (Fig. 8).
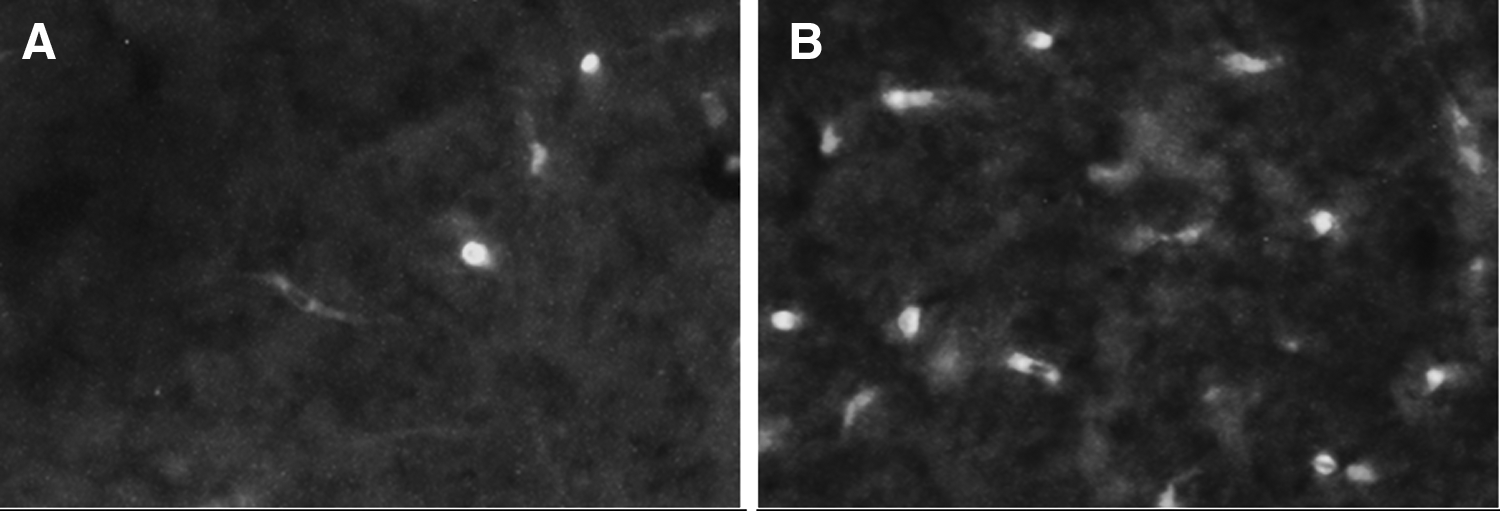
A larger number of c-fos immunoreactive positive cells are observed at 20× magnification in the tectum opticum of zebrafish exposed to system water
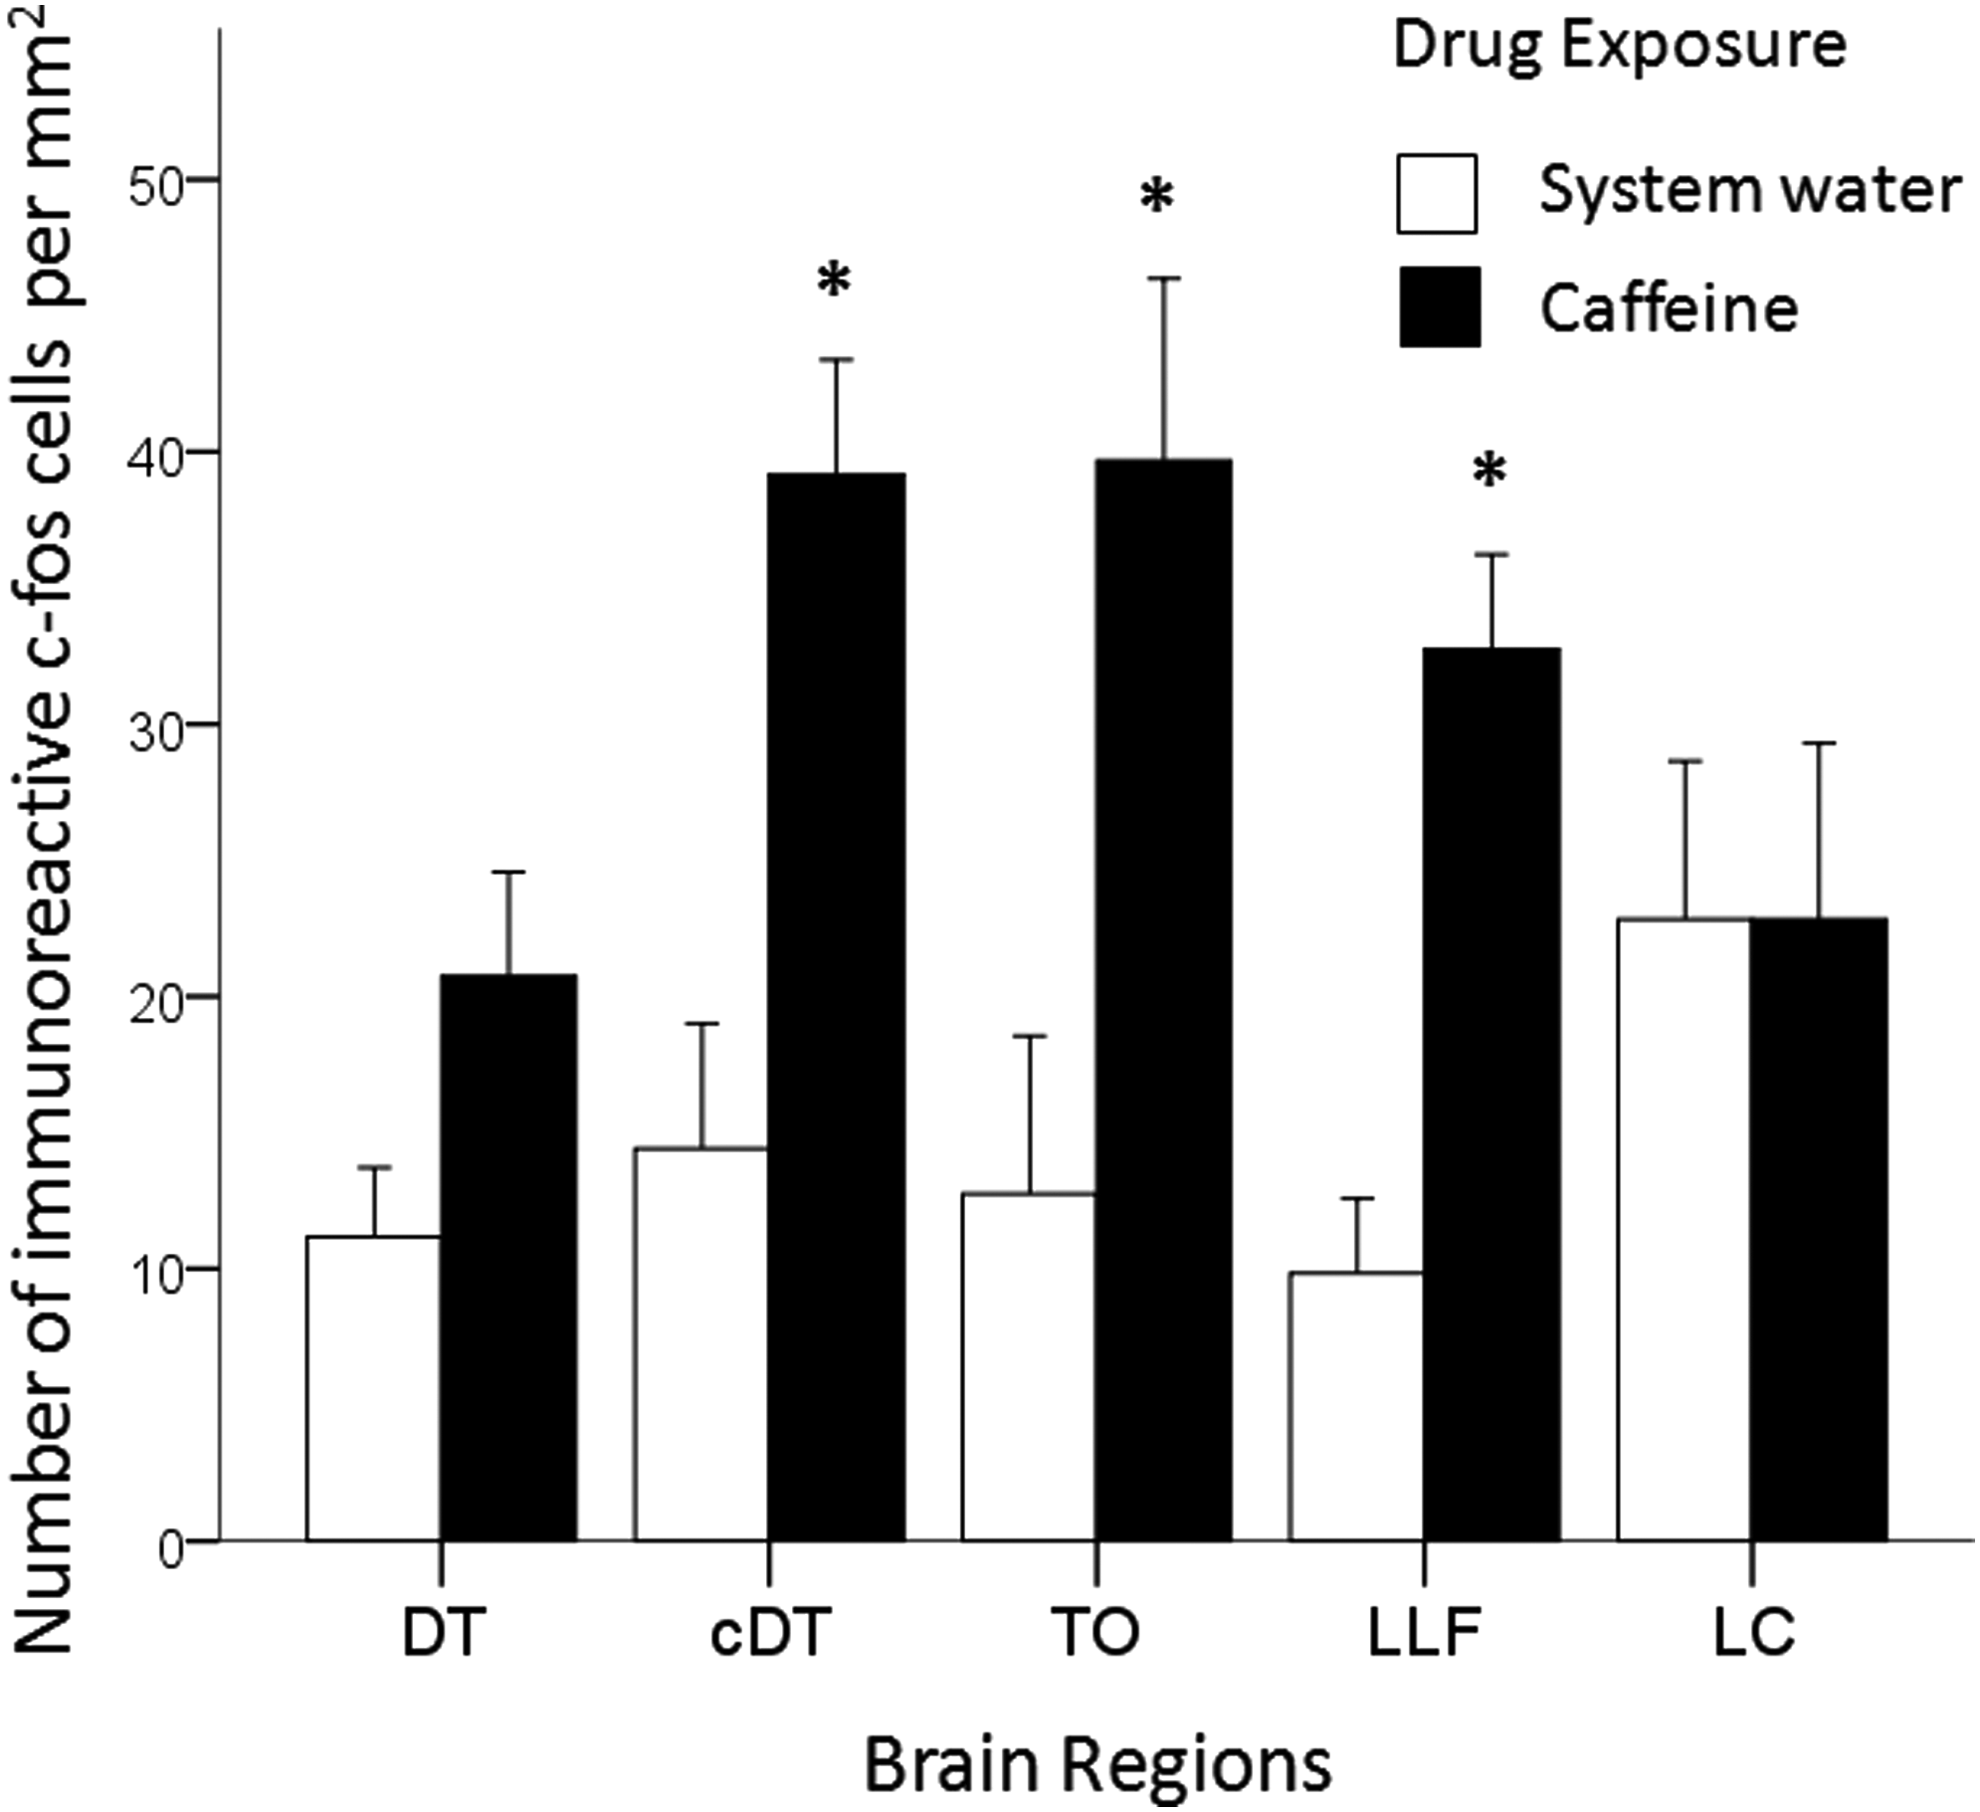
Brain region and caffeine treatment specific change in c-fos immunoreactivity. Mean ± SEM number of immunoreactive c-fos-positive cells per mm2 are shown for the dorsal telencephalic area (DT), central part of the dorsal telencephalic area (cDT), tectum opticum (TO), lateral longitudinal fascicle (LLT), and lobus caudalis (LC) for zebrafish exposed to system water or 100 mg/L caffeine for 60 min (n = 5 per group). Independent samples t-tests with bonferonni correction was used to compare differences between system water and caffeine-treated zebrafish with significance reported at *p ≤ 0.05.
Discussion
The presence of background autofluorescence is a major problem for immunofluorescence staining27,28 and, according to our own experience, is prevalent in zebrafish brain sections. Intense background autofluorescence was observed following brain tissue fixation even with freshly prepared 4% paraformaldehyde solution. However, treating brain sections with sodium borohydride was found to drastically reduce autofluorescence. The significance of this reduction was important for optimizing the signal to noise ratio when quantifying immunoreactive positive cells. The primary c-fos antibody used in this study was found to detect a single band following western blot analysis. The primary antibody used was initially developed to detect the N-terminus of the c-fos protein in humans and was recommended for the detection of c-fos protein in humans, mice, and rats (Cat. No. C2813; Santa Cruz Biotechnology). The detection of c-fos protein in zebrafish brain homogenate suggests that the amino acid sequence of the c-fos protein in zebrafish is highly conserved from fish to mammals. In addition, the FITC-conjugated secondary antibody used in this study did not exhibit non-specific binding. Our negative control experiment revealed no significant fluorescence following incubation with the secondary antibody without the primary antibody, suggesting that our results are unlikely to be due to the detection of a false positive signal.
In this study, we used a 1 h caffeine exposure as a positive control for the induction c-fos expression, which we quantified by counting immunoreactive c-fos-positive cells in the zebrafish brain. A previous study showed that induction of c-fos protein expression can be observed starting at 30 min post-stimulus with a peak at ∼90 min. 29 In our study, we exposed zebrafish to caffeine for 1 h, and measured immunoreactivity after this period, which is within the time window of robust c-fos protein expression, but we note that one may need to conduct a dose-response and detailed time-course analysis to determine the peak of c-fos induction specific to each future employed stimulus or stimulation method. Exposure to caffeine has been previously shown to induce c-fos protein expression in vertebrates including rodents.24,25 In zebrafish, exposure to high concentrations of caffeine (e.g., 100 mg/L) has been shown to increase anxiety-like behavioral responses in a novel tank such as decreased transition to the top to the tank and decreased time spent in the top portion of the tank. 26 We found increased c-fos-positive cells in specific brain regions of caffeine-treated fish compared to system water-treated controls reinforcing the specificity of the c-fos antibody used in the current experiment. For example, a significant increase in c-fos protein expression was observed in the central part of the dorsal telencephalic area, tectum opticum, and lateral longitudinal fascicle, but not in the dorsal telencephalic area or lobus caudalis. Our results indicate that the immunofluorescent staining method employed in this study can be successfully used to study neuronal activation in the zebrafish brain using c-fos protein expression as the marker.
In situ hybridization and quantitative polymerization chain reaction have been previously used to investigate changes in c-fos gene expression in the zebrafish brain.19,20,22,30,31 However, very few studies have examined c-fos protein expression in zebrafish. In a recent study, von Trotha et al. 30 quantified c-fos protein expression from zebrafish brain sections using a free floating sectioning protocol. Staining of free floating sections is common practice for larger brains (e.g., rat or mouse brains) in which tissue sections are stained before mounting on a microscope slide. However, using a free floating sectioning protocol for zebrafish may be problematic considering the small size of the brain. The method described in our current study can be successfully used for immunofluorescence staining of zebrafish brain sections on microscope slides, thereby reducing the possibility of mistaking the sequence of sections or losing the sections during the procedure, a common issue with free floating sectioning of small structures such as the zebrafish brain. In addition, a common method for detecting conjugated secondary antibodies following a free floating protocol is to use a colorimetric approach. For example, 3,3′-diaminobenzidine (DAB) can be used to detect antibodies conjugated to HRP.18,32 In comparison to our immunofluorescence method of detection, using DAB interferes with endogenous peroxidase commonly observed in brain tissue. In addition, the use of DAB for colorimetric detection is more variable due to minor differences in incubation times and solution concentration, an issue that is bypassed with fluorescence detection. In conclusion, we demonstrate that our immunohistochemical method for detecting c-fos protein expression can be used in zebrafish to investigate neuronal activation, and we suggest that this method is an excellent tool that may prove to be essential in the field of behavioral neuroscience.
Footnotes
Acknowledgments
This work was supported by an NSERC Discovery Grant (311637) issued to R.G. and an NSERC CGS D issued to S.T.
Disclosure Statement
No competing financial interests exist.