
Abstract
Abstract
In previous publications, we described the population incidence of abnormalities in zebrafish larvae exposed to toxicants. Here, we examine the phenomenon of clustering or co-occurrence of abnormalities in individual larva. Our aim is to see how this clustering can be used to assess the specificity and severity of teratogenic effect. A total of 11,214 surviving larvae, exposed continuously from 1 day postfertilization (dpf) to one of 60 toxicants, were scored at 5 dpf for the presence of eight different abnormal phenotypes. These were as follows: pericardial edema, yolk sac edema, dispersed melanocytes, bent tail, bent trunk, hypoplasia of Meckel's cartilage, hypoplasia of branchial arches, and uninflated swim bladder. For 43/60 compounds tested, there was a concentration-dependent increase in the severity score (number of different abnormalities per larva). Statistical analysis showed that abnormalities tended to cluster (i.e., to occur in the same larva) more often than expected by chance alone. Yolk sac edema and dispersed melanocytes show a relatively strong association with one another and were typically the first abnormalities to appear in single larvae as the concentration of compound was increased. By contrast, hypoplastic branchial arches and hypoplastic Meckel's cartilage were only frequently observed in the most severely affected larvae. We developed a metric of teratogenicity (TC3/8), which represents the concentration of a compound that produces, on average, 3/8 abnormalities per larva. On this basis, the most teratogenic compounds tested here are amitriptyline, chlorpromazine hydrochloride, and sodium dodecyl sulfate; the least teratogenic is ethanol. We find a strong correlation between TC3/8 and LC50 of the 43 compounds that showed teratogenic effects. When we examined the ratio of TC3/8 to LC50, benserazide hydrochloride, copper (II) nitrate trihydrate, and nicotine had the highest specific teratogenicity, while aconitine, hesperidin, and ouabain octahydrate had the lowest. We conclude that analyzing the clustering of abnormalities per larva can provide an enriched teratogenic dataset compared with simple measurement of the population frequency of abnormalities.
Introduction
The zebrafish as a model for screening teratogens
T
Zebrafish share many homologous developmental processes with mammals, 8 and many fundamental cellular and molecular pathways involved in the response to chemicals or stress are also highly conserved.1,9 The zebrafish has been shown to be a useful vertebrate model for studying the toxicity of different compounds.10–18 In principle, the effects of different compounds on zebrafish embryos might provide a useful prescreening for toxicity of compounds.14,19 However, there is disagreement on the degree of predictivity that D. rerio developmental assays offer for reproductive toxicity in mammals; thus, one study 14 found good predictivity, whereas another found that assays based on larval zebrafish or other teleosts had only weak predictivity. 20
Quantifying the teratogenicity of compounds
Teratogenicity (developmental toxicity) is the property of an agent in causing deleterious effects (including physiological dysfunction, behavioral defects, anatomical malformations, growth defects, and death) in populations of exposed embryos, larvae, or fetuses. There are several metrics used in assessing and quantifying the developmental toxicity (teratogenicity) of compounds in mammals, Xenopus, and other organisms.
The developmental specificity of a toxin is the property of being selectively toxic to developmental systems. It is used to assess the teratogenic hazard of a compound. 21 It is a relative metric and can be derived by comparing the adult lethality of a compound with its teratogenicity. On that basis, for example, thalidomide would be classified as having high developmental specificity because it causes severe developmental defects (in humans) but has little or no harmful action on the adult. 22 The relative teratogenic index 21 is a similar metric.
In the Xenopus laevis (African clawed toad) assay, the teratogenic index, 23 also called the developmental hazard index, 24 has been used. These indices are expressed as LC50/EC50, where LC50 is the concentration of compound that kills 50% of the larvae, and EC50 is the concentration of compound that causes malformations in 50% of the larvae.
The frequency (prevalence or incidence) of one or more abnormal phenotypes 11 in an exposed population is a simple and commonly used measure of teratogenicity. The frequency in this case is defined at the population level and does not consider the clustering of multiple malformations per embryo. Recording the frequency of abnormal phenotypes in the exposed population allows the dose response to a teratogen to be examined and can yield metrics such as the concentration (EC50) that causes abnormalities in 50% of individuals.
The severity of abnormalities induced by a toxin can be scored semiquantitatively using the graduated severity index (GSI). This assigns abnormalities to mild, moderate, or severe categories based on specific criteria. 25 Severity can also be assessed using a morphometric approach to quantify the degree to which the anatomy has been distorted by a particular abnormality. 26
It is also possible to look at the co-occurrence or clustering of abnormalities per embryo. Thus, in a study of ethanol toxicity, we examined this co-occurrence or clustering of defects and found that we could identify a critical stage of exposure, which resulted in many individual embryos, each having multiple abnormalities (see Ref. 12 and Fig. 7 therein).
Aims of the current study
The aim of the present study is to see whether analyzing the clustering of abnormalities per larva can provide insights into teratogenicity compared with simple measurement of the population frequency of abnormalities. In previous publications from our group,11,13,14 the toxic and behavioral effects of a selection of different compounds on zebrafish embryos or larvae were reported. By convention, the zebrafish “embryo” is called a larva at 72 h postfertilization (hpf) and older. 7 The toxicants tested were alkaloids, glycosides, carboxylic acids, alcohols, amides, and others chosen to represent a range of chemical classes and toxicological mechanisms. In this study, we reanalyze the same larvae. The LC50 data (following a 96-h exposure) for these compounds have been published elsewhere. 14 To determine the teratogenicity, a visual assessment was performed on larvae surviving to 5 dpf. In this study, 11,214 survivors were analyzed at 5 dpf for nine phenotypes, which are easily scored under the dissecting microscope: (1) normal, that is, lacking any of the following eight abnormal phenotypes, (2) pericardial edema, (3) yolk sac edema, (4) dispersed melanocytes, (5) bent tail, (6) bent body axis, (7) hypoplastic Meckel's cartilage, (8) hypoplastic branchial arches, and (9) uninflated swim bladder.
Materials and Methods
The embryos used for the purpose of this study are the same samples that have been used for the determination of mortality rates, behavioral responses, and teratogenicity caused by the toxicants in previous reports from our laboratory.11,13,14
Ethics statement
All animal experimental procedures were conducted in accordance with local and international regulations. The local regulation is the Wet op de dierproeven (Article 9) of Dutch Law (National) and the same law administered by the Bureau of Animal Experiment Licensing, Leiden University (Local). This local regulation serves as the implementation of Guidelines on the protection of experimental animals by the Council of Europe, Directive 86/609/EEC, which allows zebrafish larvae to be used up to the moment of free living (∼5–7 days after fertilization). Because larvae used here were no more than 5 days old, no licence is required by Council of Europe (1986), Directive 86/609/EEC, or the Leiden University ethics committee.
Animals
Male and female adult zebrafish (D. rerio) of AB wild type were purchased from Selecta Aquarium Speciaalzaak (Leiden, the Netherlands), who obtain stock from Europet Bernina International BV (Gemert-Bakel, the Netherlands). The AB strain is a wild-type strain (see www.zfin.org) and shows high genetic diversity, increasing the likelihood that we will detect idiosyncratic responses to the toxicants. Fish were kept at a maximum density of 100 individuals in glass recirculation aquaria (L 80 cm; H 50 cm; W 46 cm) on a 14-h light: 10-h dark cycle (lights on at 08.00). Water and air were temperature controlled (26 ± 0.5°C and 23°C, respectively). The fish were fed twice daily with “Spirulina” brand flake food (O.S.L. Marine Lab., Inc.) and twice a week with frozen food (Artemia sp.; Dutch Select Food; Aquadistri BV).
Defined embryo buffer
To produce a defined and standardized vehicle (control) for these experiments, we used 10% Hanks' balanced salt solution (made from cell culture-tested powdered Hanks' salts, without sodium bicarbonate, Cat. No. H6136-10X1L; Sigma-Aldrich) at a concentration of 0.98 g/L in Milli-Q water (resistivity = 18.2 MΩ cm), with the addition of sodium bicarbonate at 0.035 g/L (Cell culture tested, Sigma Cat S5761), and adjusted to pH 7.46. A similar medium has been used previously as a zebrafish embryo buffer.10–14,27,28
Care of embryos and larvae
Eggs were obtained by random pairwise mating of zebrafish. Three adult males and four females were placed together in small breeding tanks (Ehret GmbH) the evening before eggs were required. The breeding tanks (L 26 cm, H 12.5 cm, W 20 cm) had mesh egg traps to prevent the eggs from being eaten. The eggs were harvested the following morning and transferred into 92 mm plastic Petri dishes (50 eggs per dish) containing 40 mL fresh embryo buffer. Eggs were washed four times to remove debris. Furthermore, unfertilized, unhealthy, and dead embryos were identified under a dissecting microscope and removed by selective aspiration with a pipette. At 3.5 hpf, embryos were again screened and any further dead and unhealthy embryos were removed. Throughout all procedures, the embryos and the solutions were kept at 28 ± 0.5°C, either in the incubator or in a climatized room under a 14-h light:10-h dark (lights on at 08:00) cycle. All pipetting was done manually, with an 8-channel pipettor.
Exposure to test compounds
We used water-soluble toxic compounds representing a range of different chemical classes and biochemical activities. 11 These compounds have been screened by us for embryo lethality in two previous studies.13,14 The required dilution was always freshly prepared in buffer just before the assay on zebrafish embryos. Embryos were chronically exposed to toxicants for 4 days (96 h), beginning at 24 hpf; the experiment was terminated at 5 dpf.
Range finding
To determine a suitable range of concentrations for testing, we performed range finding using a logarithmic series (0, 1, 10, 100, and 1000 mg/L) as recommended in standard protocols. 29 Zebrafish embryos of 24 hpf from the Petri dish were gently transferred using a sterile plastic pipette into 96-well microtiter plates (Costar 3599; Corning, Inc.). A single embryo was plated per well, so that dead embryos would not affect others and also to allow individual embryos to be tracked for the whole duration of the experiment. A static nonreplacement regimen was used. Thus, there was no replacement or refreshment of buffer after the addition of compound. Each well contained 250 μL of either freshly prepared test compound or vehicle (buffer) only as controls. All pipetting was done manually, with an 8-channel pipettor. We used 16 embryos for each concentration and 16 embryos as controls for each compound. The embryos for controls and treatment groups for each compound were plated in the same 96-well microtiter plates in each independent experiment.
Geometric series
After the range finding experiments, a series of concentrations lying in the range between 0% and 100% mortality were selected. The actual concentrations used are shown in supplementary table 2 in Ref. 11 The concentrations were in a geometric series, in which each was 50% greater than the next lowest value. 29 Each geometric series of concentrations for each compound was repeated three times (in total 48 embryos per concentration and 48 embryos for vehicle for each compound). The embryos for controls and treatment groups for each compound were plated in the same 96-well microtiter plates in each independent experiment.
Morphological assessment of larval phenotypes in the survivor population
Mortality rates at 48, 72, 96, and 120 hpf, in both logarithmic series and geometric series, were determined by visual inspection under a dissecting stereomicroscope as previously described. 14 Morphological assessment was done according to Ref. 12 Briefly, at day 5, larvae were fixed in 4% paraformaldehyde (PFA) in phosphate-buffered saline, pH 7.2, at 4°C overnight. They were then rinsed five times in distilled water and dehydrated in a graded series of ethanol (25, 50, and 70%) for 5 min each. Larvae were rinsed in acid alcohol (1% concentrated hydrochloric acid in 70% ethanol) for 10 min. They were then placed in filtered Alcian blue solution (0.03% Alcian blue in acid alcohol) overnight. Larvae were subsequently differentiated in acid alcohol for 1 h and washed 2 × 30 min in distilled water. Finally, they were cleared and stored in 100% glycerol. All larvae remained in their original multiwell plates, so that each individual could be tracked throughout the entire experimental and analysis procedure. Analysis of larval morphology was carried out under a dissecting stereo microscope. The phenotypes were scored according to the criteria listed in Table 1 and illustrated in Figure 1. To minimize observer error, one of us (J.A.) scored all embryos. Then, a selection of these observations was validated by a second observer (S.A.).
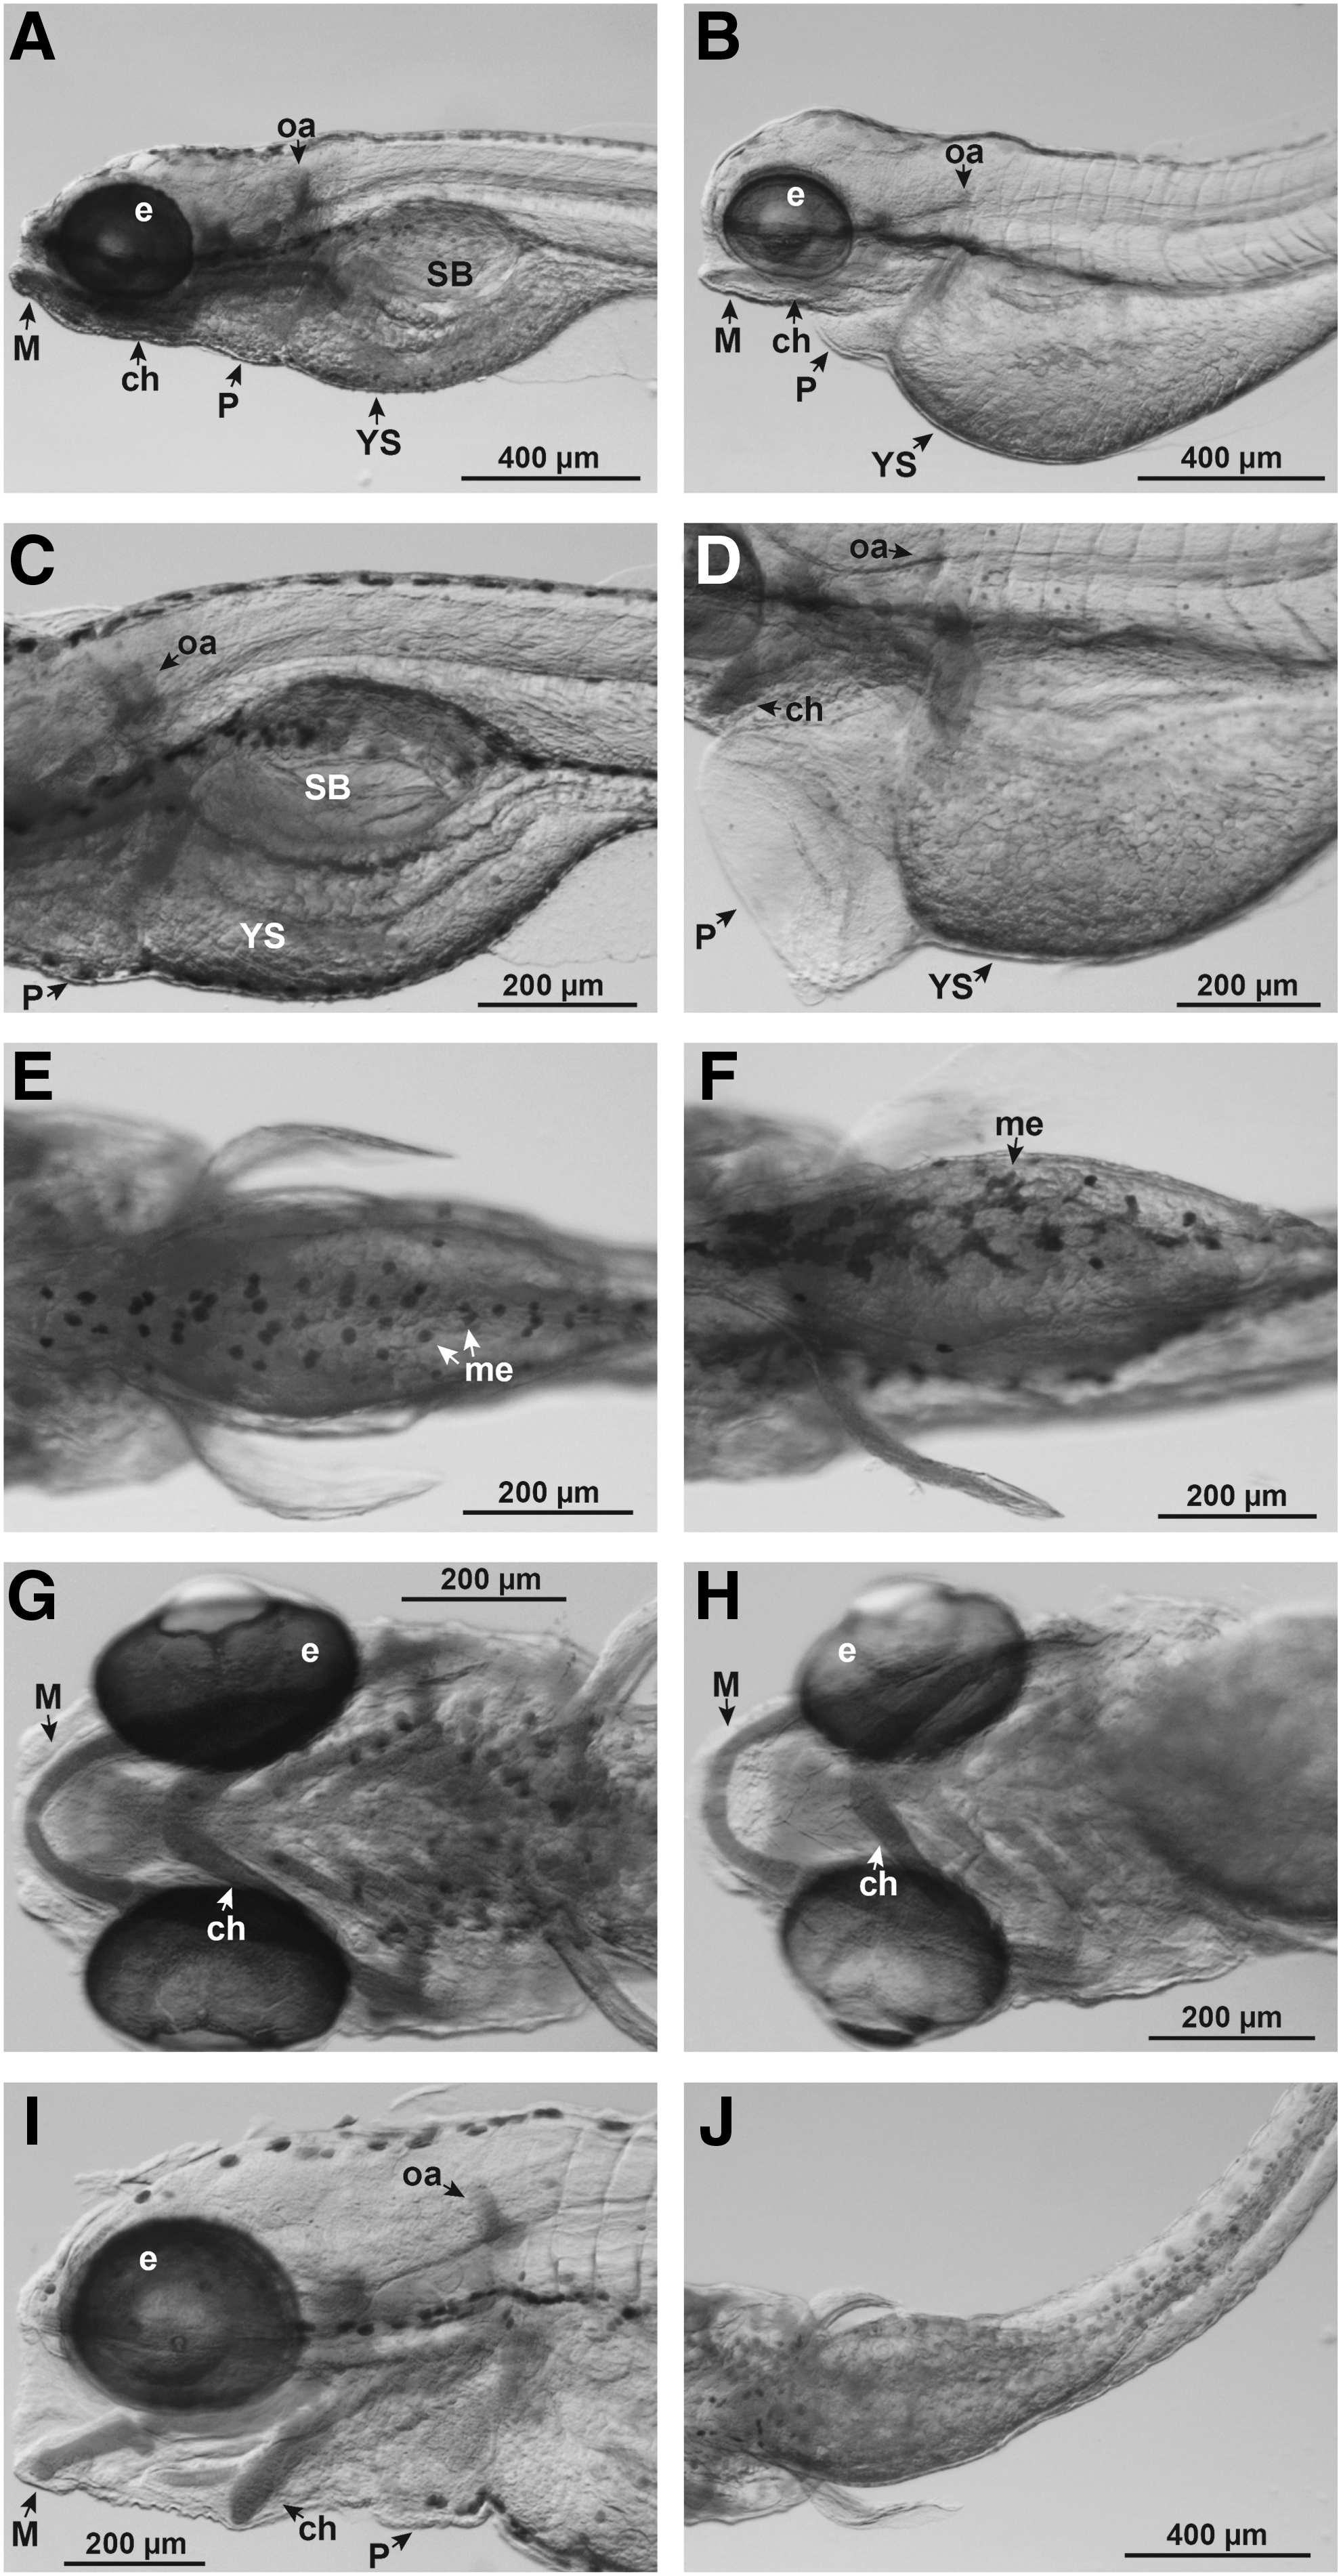
Examples of selected phenotype clusters. Zebrafish larvae were analyzed at 5 dpf and stained with Alcian blue. This figure illustrates a selection of phenotypes with different severities. (
See Figure 1 for selected illustrations of these phenotypes.
Statistical analyses
Spearman's rank correlation coefficient (Spearman's rs) was used to determine whether the number of abnormalities per larva is dose dependent. It is expected that no abnormalities occur when the larvae are not exposed to any compound and a maximum of eight abnormalities when exposed to the highest concentration of a compound. The observed data describe the linear part of the relationship, and so we used linear regression to examine the dose (untransformed) dependency of teratogenic effects. Analyses were made in SPSS and Microsoft Windows Excel 2010.
To investigate whether abnormalities occurred independently of each other, or tended to cluster with specific associations, we calculated expected frequencies. The frequency of each abnormality was calculated by dividing the number of larvae having the abnormality with the total number of larvae, which are 11,214 larvae. If abnormality A occurs with frequency a and B with frequency b, then the expected fraction of individuals with both abnormalities is ab, the fraction without abnormalities is (1 − a)(1 − b), the fraction with only abnormality A is a(1 − b), and the fraction with only abnormality B is (1 − a)b. This can easily be extended to eight abnormalities to calculate all 256 combinations and from that the expected frequencies of individuals with zero to eight abnormalities. To attain a large sample size we added all data. This could also affect deviations from expectations, and therefore, the result should be taken as indicative.
Next, we analyzed which specific abnormalities occur together. We did this by focusing on the 43 substances with the strongest teratogenic effects. For each substance, we made a two-by-two table of individuals with or without abnormality A and with or without abnormality B. For each compound, the highest concentration having a minimum of 10 survivors was used for this association analysis (ranging from 13 to 57 survivors, with an average of 33). We noted the significance of the association using a Fisher Exact Probability Test (α = 0.05, two sided). The strength of the association is the fraction of all cases (n = 43) in which there was a significant positive association between abnormality A and B.
Results
Phenotype clusters
The complete data set consisted of 11,214 survivors at 5 dpf. Of these, 3095 were control (untreated) larvae; 8119 had been exposed to one or more concentrations of one of the toxicants. We scored each survivor for nine different phenotypes (Table 1). The different abnormalities are illustrated in Figure 1. By scoring abnormalities per larva in this way, each larva may be defined as exhibiting a particular “phenotype cluster.” Given that there are eight phenotypes and two phenotype states (namely: present, absent), the total number of potential phenotypes is 2 8 or 256. We found just under half of this number, namely 123 unique phenotypes (Supplementary Table S1; Supplementary Data available online at www.liebertpub.com/zeb).
In Supplementary Table S1, percentages for the incidence of the different phenotypes in the complete data set and the incidence in each severity group are given. In the total data set, 54% of the larvae were scored as “normal” because they did not have any of the eight developmental abnormalities listed in Table 1. The number of affected larvae declines dramatically as the number of abnormalities per larva increases. Thus, for example, larvae with one abnormality constitute 24.92% of the total data set (controls + treatments), while larvae with eight constitute only 0.04% of the total. The phenotype “yolk sac edema” occurred most often, in 10.7% of the larvae. The second most prevalent phenotype was “swim bladder uninflated” (7.4%) and the third is the phenotype “melanocytes dispersed” (5%). Of the larvae with two developmental abnormalities, 76.2% had a phenotype consisting of a combination of two of the following abnormalities: yolk sac edema, melanocytes dispersed, or swim bladder uninflated. Moreover, in larvae with three abnormalities, 40.6% had the phenotype cluster “yolk sac edema, melanocytes dispersed, and swim bladder uninflated.”
We also analyzed the observed and expected incidence of phenotype clusters for larvae exposed to a compound and for larvae that had no treatment (control). More larvae with the “normal” phenotype are observed (6064 larvae) than expected (4544 larvae) (Supplementary Table S1). Larvae with one and two abnormalities were less often observed than expected. In cases where the severity score was higher than three abnormalities per larvae, the incidence was higher than expected, showing that many abnormalities occur together, forming clusters. In Figure 2, the observed and expected incidence of larvae for each severity is indicated for controls and treatment. While, by chance, it is not expected to find an embryo with more than four abnormalities, observations show larvae with up to six malformations. For larvae that were exposed to a compound, up to eight abnormalities per larvae are observed, while only up to five abnormalities per larvae are expected. Chi-square analysis for the observed and expected values per severity is highly significant p << 0.001 with 4 degrees of freedom, meaning that the clustering is strong.

Expected and observed incidence of larvae (treatment and control). The control group of larvae is indicated with the round dots, and the treatment group of larvae is indicated by the square. For each group, the line shows the expected number of larvae for each severity. The black filled symbols show the observed number. More larvae with higher severity are observed than expected.
Association of abnormalities (clustering per larva)
We examined whether certain abnormalities tended to occur together in affected larvae. The major association (30.2%) was between dispersed melanocytes and uninflated swim bladder (Table 2). This coincides with the findings in Supplementary Table S1, where more larvae with two malformations have melanocytes and uninflated swim bladder than expected (422 vs. 327 larvae), while for the other phenotypes with two malformations, fewer larvae are observed than expected.
Note that only the 43 compounds that show teratogenic effects are analyzed.
Bo, bent body axis; Br, branchial arch hypoplasia or abnormality; Mk, Meckel's cartilage hypoplasia or abnormality; Mn, melanocyte dispersion; Pc, pericardial edema; Sb, swim bladder uninflated; Ta, bent tail; Yo, yolk sac edema.
Concentration-dependent induction of developmental abnormalities
The eight abnormal phenotypes screened for are not all equally frequent in occurrence for each severity (Fig. 3 and Table 5). Yolk sac edema, dispersed melanocytes, and uninflated swim bladder show a similar distribution and occur in a relatively high frequency, regardless of the number of abnormalities. Hypoplasia of branchial arches is seldom observed in larvae having few abnormalities; it only becomes frequent in larvae with several other abnormalities. Pericardial edema is a good teratogenic predictor, having a relatively low frequency in less severely affected larvae (with a severity score of 0–2 abnormalities per larva) and a higher frequency in more severe cases (with a severity score in the range 3–8). Starting from a severity of four abnormalities per larva, hypoplastic branchial arches and hypoplastic Meckel's cartilage became more frequently observed.
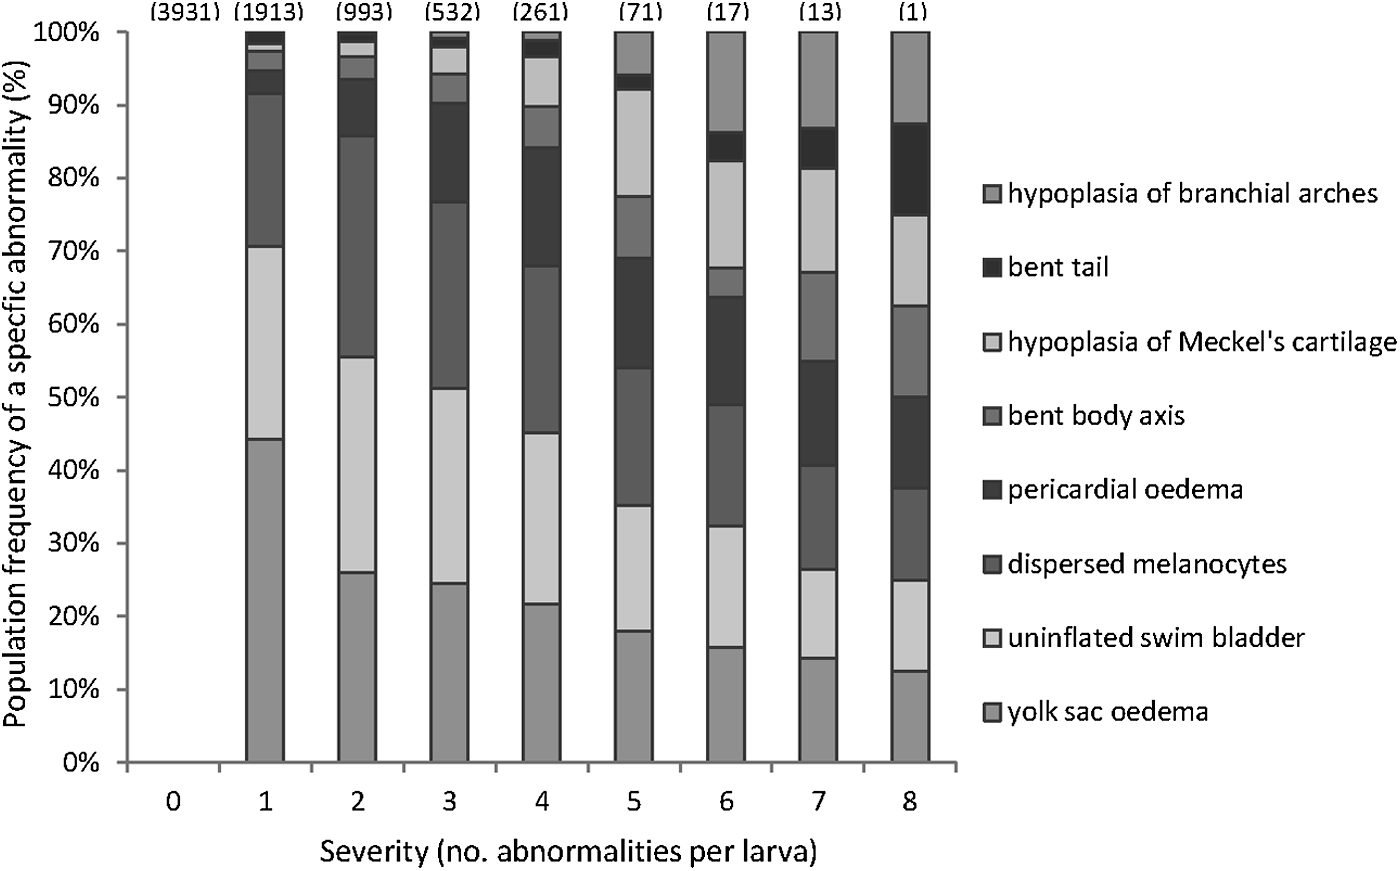
Incidence of specific abnormalities as a function of severity (no. of abnormalities per larva). This figure shows the abundance of the eight abnormalities for each severity of the 43 compounds that cause teratogenic effects (the 17 compounds marked with the plus in Table 3 are excluded from the analysis). The numbers given on each bar represent the total number of observed larvae. At the highest severity, eight abnormalities per larva, the frequency of the abnormalities is equal. In less severity, the majority of the abnormalities observed are yolk sac edema, uninflated swim bladder, and dispersed melanosomes. Table 5 shows the number of observations for each specific abnormality at each severity.
Concentration-dependent effects of toxicants on the number of abnormalities per larva
If we consider the untreated (vehicle) and treated larvae as two separate populations, it can be seen that the treatment group has a higher percentage of larvae with developmental abnormalities (Fig. 2). We analyzed the relationship between toxicant concentration and number of abnormalities per larva using Spearman's rank correlation (Table 3). The strength of the correlation was assigned to one of three categories: strong (>0.7), moderate (0.3–0.7), and weak (<0.3). The teratogenic effects of the compounds are described by a linear regression model, where the concentration of the compound is expected to determine the teratogenicity. A total of 17 compounds were excluded from the analysis because of an insufficient number of data points (when n = 2 or lower), based on linear regression and rank correlation. The remaining 43 compounds all showed concentration dependency of the severity score. Figure 4 illustrates the compound acetic acid as an example.
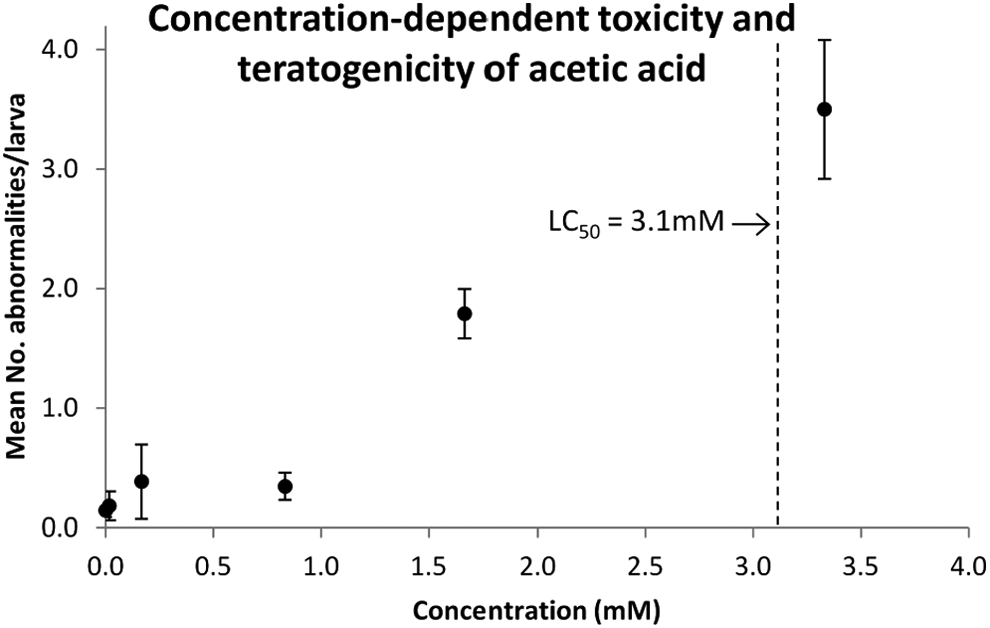
Example of concentration-dependent effects in terms of the severity of teratogenic effect (average number of abnormalities per larva). The data shown are for acetic acid. The error bars show the standard error of the mean. The LC50 value is shown to relate the teratogenic effect to toxicity. 11
Rank correlation and linear regression model refer to the relation between dose (untransformed) vs. number of abnormalities.
The p-value of the Spearman's rank correlation is underlined when not significant (p > 0.05). X stands for the concentration of compound in mM. The linear regression model is underlined when it does not significantly describe the data points. The plus “+” indicates compounds that will be discarded from the analyses on the basis of the regression model, rank correlation, or only two data points in the data set.
NA, not available (insufficient data points).
A teratogenicity metric (TC3/8)
While 43 compounds show dose-dependent effects, the severity of those effects relative to the compound concentration is not the same. Our data show that most compounds produce larvae with up to four developmental abnormalities. The established linear regression model (Table 3) provides a good prediction of data within the measured range. To be confident about the standardization, it was decided to determine at what concentration three abnormalities per larva occur. This teratogenicity level, here called TC3/8, gives the concentration at which a certain compound causes an average of three out of the eight selected abnormalities in exposed zebrafish embryos. It is assumed that the higher the value for TC3/8, the less teratogenic the compound.
Teratogenicity versus lethality
Based on their TC3/8 values, the compounds can be ranked by teratogenicity (Fig. 5). Amitriptyline, chlorpromazine hydrochloride, and sodium dodecyl sulfate are the most teratogenic. Ethanol is the least teratogenic compound. For completeness and comparison, LC50 and EC50 values are included as previously reported. 11
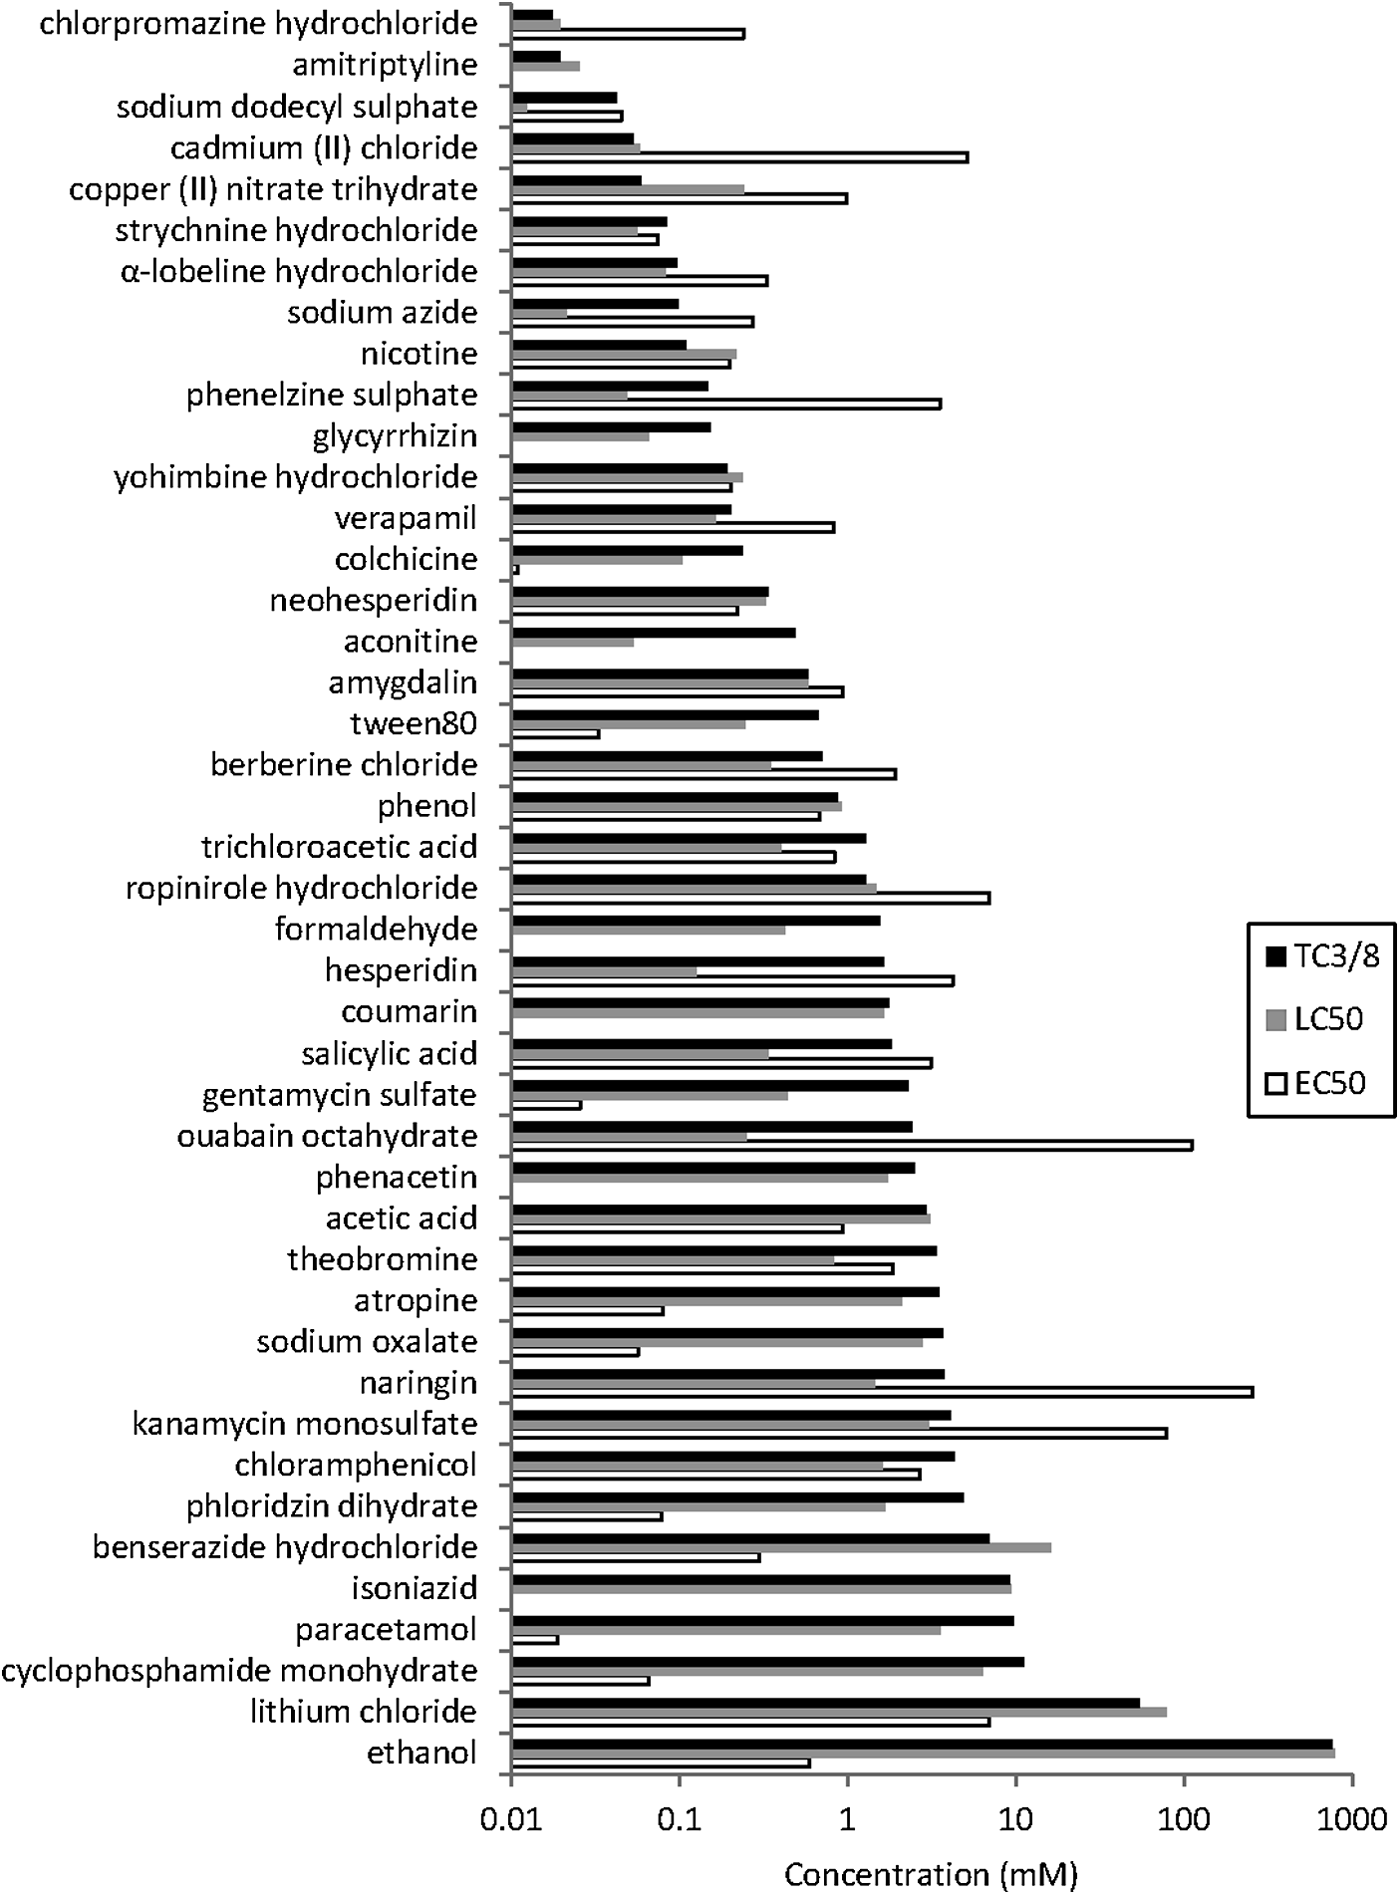
Ranking of compounds according to their teratogenicity. The 43 compounds that do show teratogenic effects (listed in Table 4) are ranked accordingly to their TC3/8 value, from the lowest value on top to the largest value on the bottom. It is assumed that the lower the TC3/8 value the more teratogenic the compound. The LC50 values are indicated in gray to illustrate the toxicity relative to the teratogenicity. Furthermore, the EC50 is shown in the white box to compare with TC3/8. Note that the y-axis is on a log scale and indicates the TC3/8, LC50, and EC50 values in mM.
We find a significant rank correlation (Fig. 6) between the teratogenicity of compounds (based on TC3/8 values) and their lethality (described by LC50 values). The value for Spearman's ρ was 0.88 and the p < 0.00001. The slope on the log–log graph was 0.89, suggesting that TC3/8 (on Y) is leveling off with LC50 (on X) when plotting the untransformed data. The deviation from slope 1 was, however, not significantly different (p = 0.05669). So we can assume that TC3/8 is roughly proportional to LC50 (TC3/8 = b × LC50); the line goes through the origin, and slope b is a useful measure for the relative teratogenicity. Points with a high value of b are above the line in the untransformed graph of TC3/8 (on y) versus LC50 (on x).
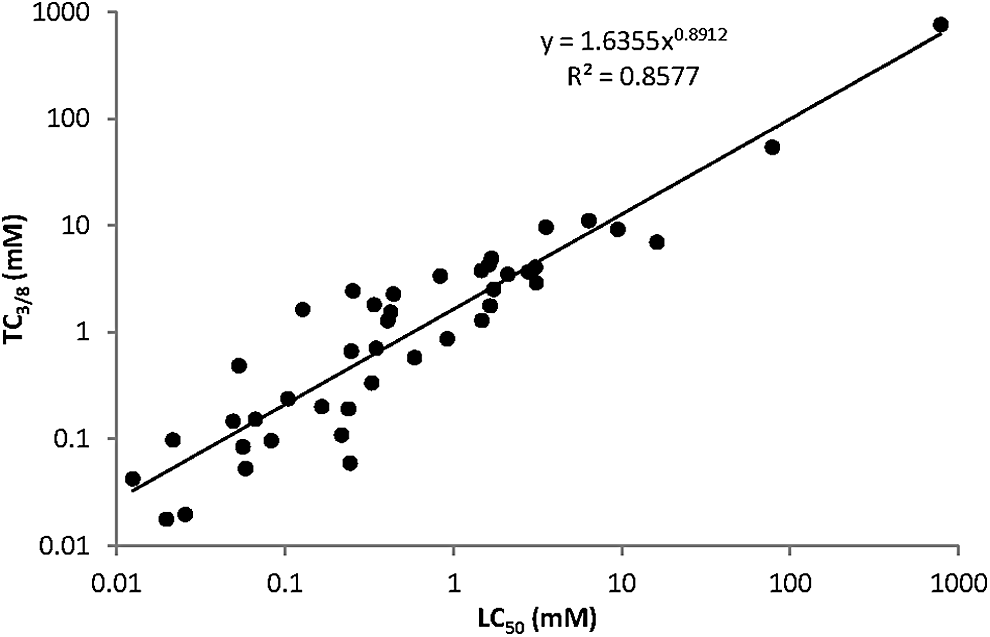
The correlation between teratogenicity and toxicity. The LC50 and TC3/8 values of the 43 compounds (as shown in Fig. 5) are plotted in one graph to demonstrate their correlation. This graph illustrates that toxicity can predict teratogenicity of a compound. The formula of the regression line is ln TC3/8 = 0.49192 + 0.89124 ln LC50 with SE = 0.05669. Note that both axes of the figure are on log scale.
The ratio between teratogenicity and lethality is a relative measure that could be used to compare the teratogenicity of different compounds. A ratio lower than 1 can be assumed relatively teratogenic or having a higher specific teratogenic effect, while a ratio higher than 1 can be considered as relatively lethal. In Figure 7, this principle is illustrated. It can be seen, for example, that copper is relatively much more teratogenic than it is lethal. Thus, the ratio b = TC3/8: LC50 for copper (II) nitrate trihydrate is b = 0.06/0.243 = 0.25 (Table 4). By contrast, the same ratio for hesperidin is 12.88, suggesting that this compound is relatively more lethal than teratogenic. This ratio shows that three compounds, benserazide hydrochloride, copper (II) nitrate hydrate, and nicotine have the highest specific teratogenicity. Both copper (II) nitrate hydrate and nicotine are among the top in the ranking of the teratogenicity, while benserazide is among the least teratogenic. The compounds aconitine, hesperidin, ouabain octahydrate, gentamycin sulfate, and salicylic acid were found to be more lethal than they were teratogenic.
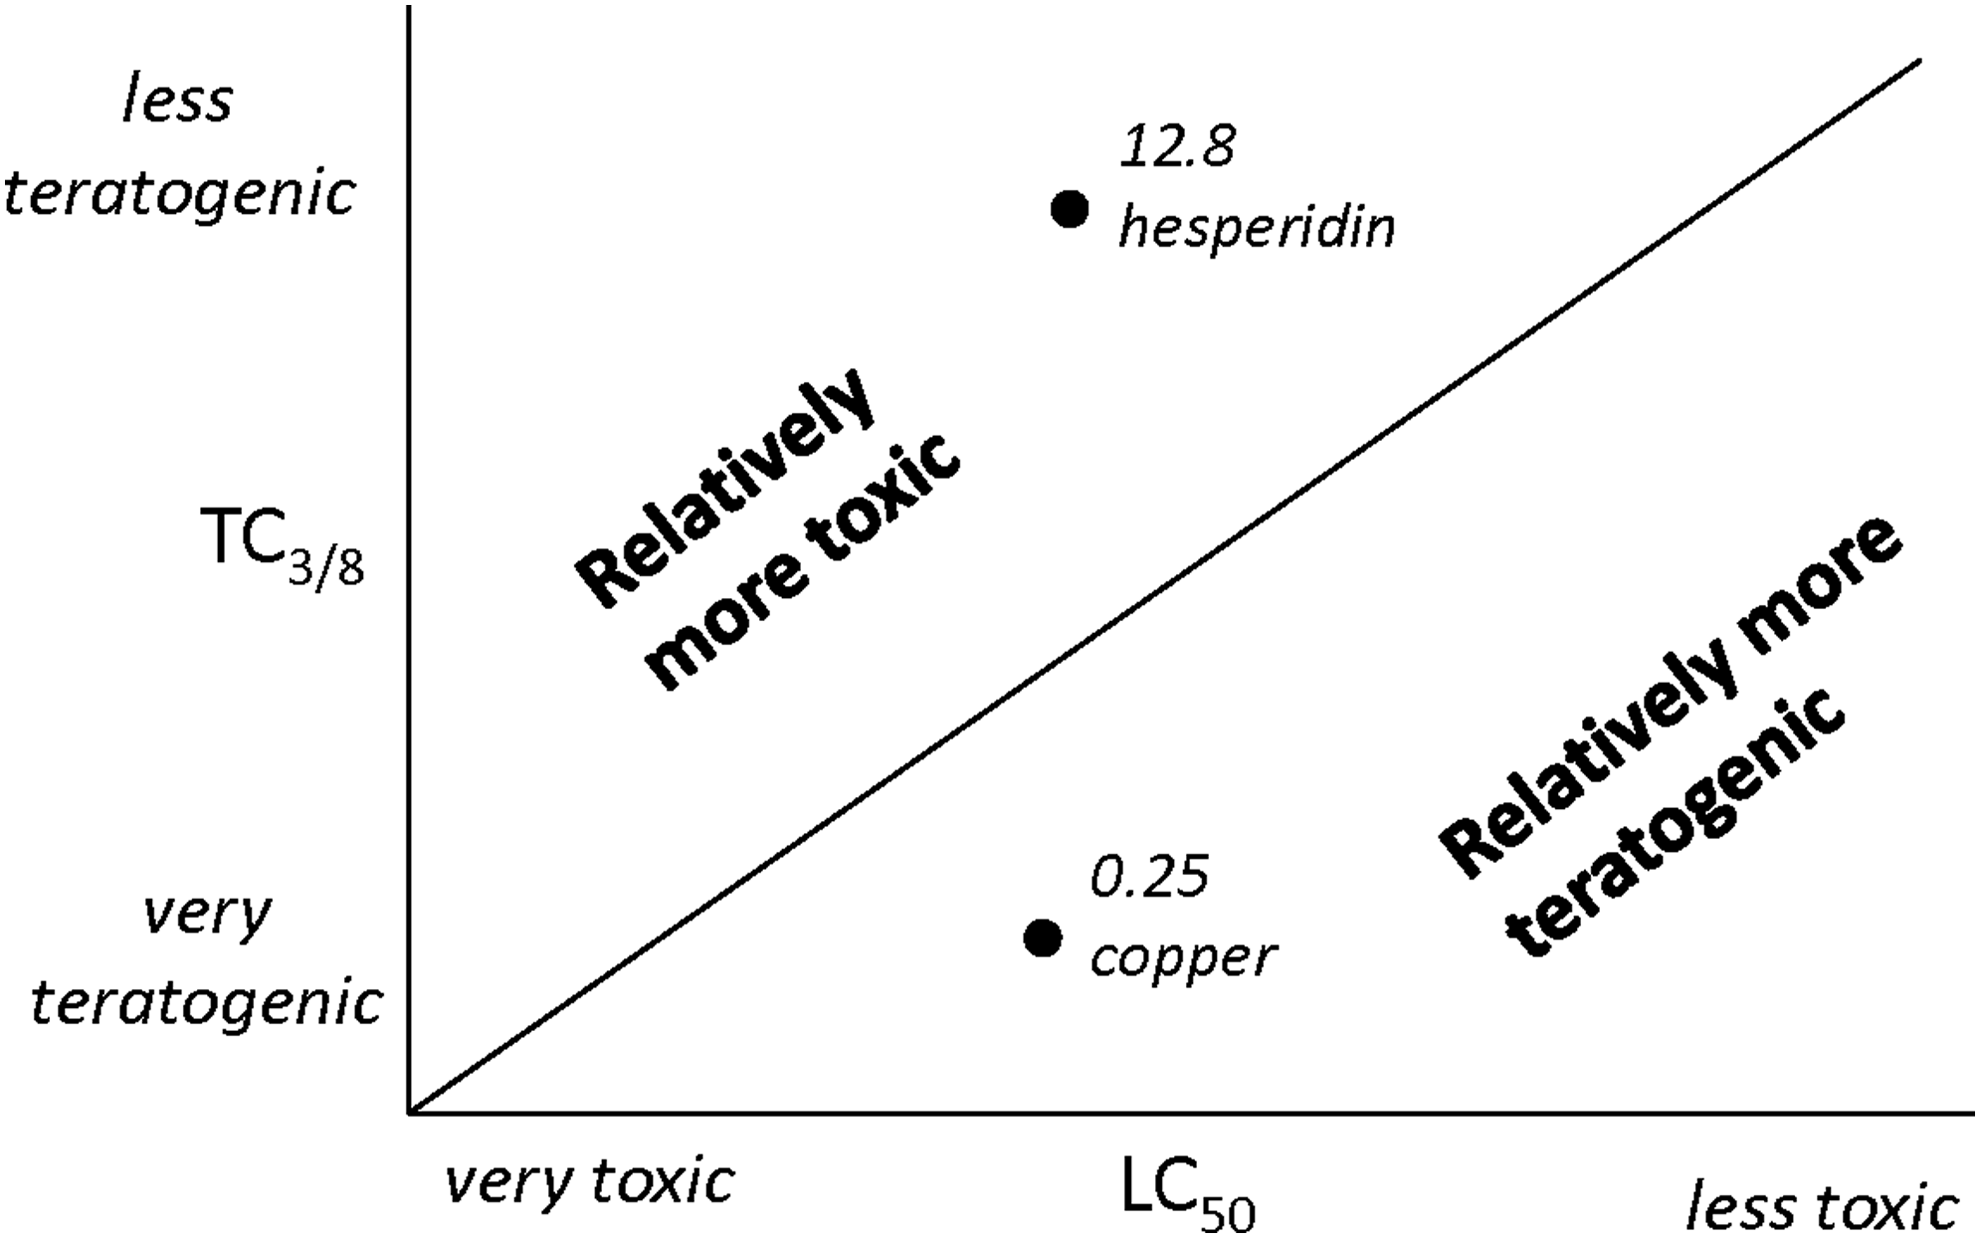
The ratio between the toxicity and teratology measure. The ratio between toxicity and teratology is a relative measure that could help to compare the compounds. A low value of a measure indicates a high severity. When the ratio is below 1, the compound can be considered relatively teratogenic. When the ratio is higher than 1, the compound is relatively toxic.
Note that this table shows 43 compounds; the compounds marked+ in Table 3 were excluded from the analysis.
Discussion
We have examined the effects of toxicants on zebrafish larvae. We tested 60 water-soluble toxicants belonging to different chemical classes and having different biochemical activities. Each individual larva was then screened for the presence of eight abnormal phenotypes. By this means, we derived a metric, TC3/8, which expresses the severity of teratogenic effect in terms of the concentration of toxicant needed to induce three abnormalities per larva. We found in our data set a background level of abnormalities and death in control (untreated) larvae; the origin of these abnormalities is not clear.30,31
Key Findings
• The commonest abnormalities were dispersed melanocytes, yolk sac edema, and uninflated swim bladder.
• When more than one abnormality was found in one embryo, the only significant association was that between dispersed melanocytes and uninflated swim bladder, which tended to occur together.
• Pericardial edema is a good predicator of teratogenicity as its frequency increases with a higher severity index.
• There was a good correlation between the lethality and teratogenicity of compounds (where teratogenicity is all developmental abnormalities in survivors).
• The compounds with the highest specific teratogenicity (based on the ration of TC3/8 to LC50) were benserazide hydrochloride, copper (II) nitrate hydrate, and nicotine.
• The most teratogenic compounds according to the TC3/8 measure alone were amitriptyline, chlorpromazine hydrochloride, and sodium dodecyl sulfate. Ethanol was the least teratogenic on this measure.
Phenotype clusters and the co-occurrence of abnormalities in single larvae
The clustering of abnormalities could explain why significantly more larvae with five or more abnormalities are observed (118 larvae) than expected (1.1 larvae). This observation is noted for both the control and treatment group of larvae. The majority of the phenotype clusters consisted of at least one of the following abnormalities: yolk sac edema, dispersed melanocytes, or uninflated swim bladder. In our previous publication, 11 we showed that at least one of these abnormalities occurred in 54 of the 60 compounds tested. Only aconitine, convallotoxin, lead acetate trihydrate, ampicillin sodium, paracetamol, and glycerol did not show an increase in any of these three abnormalities after exposure.
In 30.2% of the tested compounds dispersed, melanocytes and uninflated swim bladder occurred in combination. This indicates that certain abnormalities occur much more frequently in relationship with another, possibly because a common developmental pathway is affected.
Concentration dependency of effects
For 43 out of the 60 tested compounds, concentration-dependent effects were observed. Thus, with higher concentrations of toxicant, a higher severity index is observed. In the remaining 17 cases, there was no such relationship, or there were too few data points to make an assessment. In this study, we used a normal/abnormal calling system for abnormalities rather than a semiquantitative assessment of severity (e.g., as used in Ref., 25 ). Although our approach may be less sensitive for identifying concentration responses, it does allow us to screen a large number of larvae. 32
Yolk sac edema, dispersed melanocytes, and uninflated swim bladder are the commonest abnormalities, occurring frequently as part of a cluster over the whole range of compounds and concentrations. Pericardial edema can be considered as a good predictor of teratogenicity, because it is more abundant when the severity index is higher (three to eight abnormalities per larva), but is less frequently observed in larva with only one or two abnormalities. The abnormalities hypoplastic branchial arches and hypoplastic Meckel's cartilage could be good predictors for severe teratogenicity; they are both more frequently observed at high severity indices (five to eight abnormalities per larva) while they have low incidence when the severity index is lower.
Ranking the compounds by TC3/8
Teratogenicity was quantified by the TC3/8 value using linear regression. This value represents the concentration of compound at which three out of the eight abnormalities occur. Based on the ranking of the TC3/8 levels, ethanol is the least teratogenic of the 43 compounds analyzed in line with previous findings. 11 Three compounds: amitriptyline, chlorpromazine hydrochloride, and sodium dodecyl sulfate, have teratogenic effects higher than the other analyzed compounds. Compared to the EC50, which represents the concentration of compound at which half of the larvae show abnormalities, the TC3/8 aims to indicate the severity of the effect.
Relationship between lethality and teratogenicity
The correlation between lethality and teratogenicity was established using rank correlation. The ratio between lethality and teratogenicity has been used before to determine the teratogenic potential of compounds and to categorize the compounds as teratogens or nonteratogens. 33 Our results reveal that three compounds, benserazide hydrochloride, copper (II) nitrate hydrate, and nicotine, are more teratogenic than they are lethal. The compounds aconitine, hesperidin, ouabain octahydrate, gentamycin sulfate, and salicylic acid were found to be more lethal than they were teratogenic.
Suitability of data set for analysis
It can be argued that all compounds can be teratogenic, if the concentration is sufficiently high. However, depending on the ratio between LC50 and EC50, larvae might die before teratogenic effects other than lethality are expressed. Equally, in mammals, a compound might kill the mother before the embryo develops abnormalities. 22
Limitations of our analysis
It must be taken into account that, in this study, only eight abnormalities were screened for. Although these abnormalities were selected to cover a broad range of abnormalities, they are far from being exhaustive. Therefore, we can only give preliminary results on the teratogenicity of compounds on the basis of the abnormalities examined. It is recommended that the assessment of the teratogenicity of compounds should also include morphometrics and the examination of more internal anatomical structures, even though this approach may limit the throughput of the analysis. Although 5 dpf may be an optimal endpoint for assessing teratogenicity, 33 a greater number of screening endpoints may give more insights by showing, for example, early yolk sac abnormalities that lead to lethality before 5 dpf. 34
Footnotes
Acknowledgments
The authors thank Gerda E.M. Lamers for assistance with microscopy. This work was supported by the Smart Mix Programme of the Netherlands Ministry of Economic Affairs and the Netherlands Ministry of Education, Culture and Science (M.K.R.), and the University of Azad Jammu and Kashmir, Pakistan (S.A.). None of these funding sources had any further role in the study design, the collection, analysis and interpretation of data, the writing of the report, or the decision to submit the article for publication.
Authors' Contributions
J.A., S.A., and M.K.R. designed, conducted the experiment, and analyzed the data. J.A., S.A., M.K.R., and T.J.J. performed statistical analysis of the data. M.K.R. provided the materials and all research facilities. J.A., S.A., and M.K.R. wrote the article.
Disclosure Statement
No competing financial interests exist.
References
Supplementary Material
Please find the following supplemental material available below.
For Open Access articles published under a Creative Commons License, all supplemental material carries the same license as the article it is associated with.
For non-Open Access articles published, all supplemental material carries a non-exclusive license, and permission requests for re-use of supplemental material or any part of supplemental material shall be sent directly to the copyright owner as specified in the copyright notice associated with the article.