
Abstract
Abstract
Gene Ontology (GO) analysis is a powerful tool in systems biology, which uses a defined nomenclature to annotate genes/proteins within three categories: “Molecular Function,” “Biological Process,” and “Cellular Component.” GO analysis can assist in revealing functional mechanisms underlying observed patterns in transcriptomic, genomic, and proteomic data. The already extensive and increasing use of zebrafish for modeling genetic and other diseases highlights the need to develop a GO analytical tool for this organism. The web tool Comparative GO was originally developed for GO analysis of bacterial data in 2013 (www.comparativego.com). We have now upgraded and elaborated this web tool for analysis of zebrafish genetic data using GOs and annotations from the Gene Ontology Consortium.
G
GO analysis provides the opportunity for function-based and quality-based identification of important genes/proteins in omics studies. Many GO tools have been developed in recent years,3,6,7 but none of them is designed specifically for use with zebrafish omics data. In addition, to detect statistically significantly altered GOs, common GO tools only compare the enrichment of GO terms for a particular sample (e.g., a set of genes/proteins with significantly altered expression) versus their enrichment over the entire genome (as a reference set). These tools are not able to compare GOs between two or more samples directly. 1
The already extensive and increasing use of zebrafish for modeling genetic and other diseases highlights the need to develop a GO analytical tool for this organism. The web tool Comparative GO was originally developed for GO analysis of bacterial data in 20131 (www.comparativego.com) and extended for human samples recently. 8 We have now upgraded and elaborated this web tool for analysis of zebrafish genetic data using GOs and annotations from the Gene Ontology Consortium. 9 We update these GOs and annotations in our database regularly every 6 months. Database tables were designed in a PostgreSQL database system and a Java-based application is used for data extraction from source files, integrated with an R package to perform the statistical analysis and a Cytoscape plugin for visualization of GO networks. The web tool performs the following analyses: (1) GO classification of zebrafish genes/proteins in terms of “Molecular Function,” “Biological Process,” and “Cellular Component,” (2) comparison of the GO distribution of a sample of genes/proteins verses that of the genome using a hypergeometry approach (with statistical significance testing by Fisher's exact test), (3) direct (tabular) comparison of GO enrichments between two or more samples of genes and determination of the key upregulated/downregulated GO groups based on the fold change of GO enrichment (as yet without statistical significance testing although this may be developed in future), and (4) statistics-based comparison of overall GO enrichment between two or more samples using the Wilcoxon signed rank test with continuity correction, the two-sample Kolmogorov–Smirnov test, and the chi-square test. The Comparative GO web tool also produces the following graphical outputs: (1) pie charts of GO classification of one or more samples and (2) networks visualizing GO relationships and highlighting central regulatory GO mechanisms. “GO regulatory networks” find the GOs with the highest number of interactions with the other GO groups and place them in the center of a network to build a regulatory network. The web tool includes a facility to incorporate information on gene/protein expression levels with GO enrichment data, since levels of expression can significantly affect GO enrichment. 7 The user has this opportunity to save the gene list in the web tool permanently to be accessed from any computer when the user logins.
As guidance for the use of the Comparative GO tool and as an example of its functions and outputs, we have provided Supplementary Information (Supplementary Data are available online at www.liebertpub.com/zeb) showing GO classification and analysis (Supplementary Data S1) of up- and downregulated genes from an mRNA-level comparison of hypoxic and normoxic adult zebrafish brains (Supplementary Data S2).
GO network analysis (Fig. 1) highlighted the central regulatory role of the GO activation of cysteine-type endopeptidase activity involved in apoptotic process (Gene Ontology ID: 6919, including diabloa), regulation of transcription, DNA templated (Gene Ontology ID: 6355, including bzw1b), and regulation of Rho protein signal transduction (Gene Ontology ID: 35023, including arhgef9b) in the zebrafish brain's response to hypoxia.
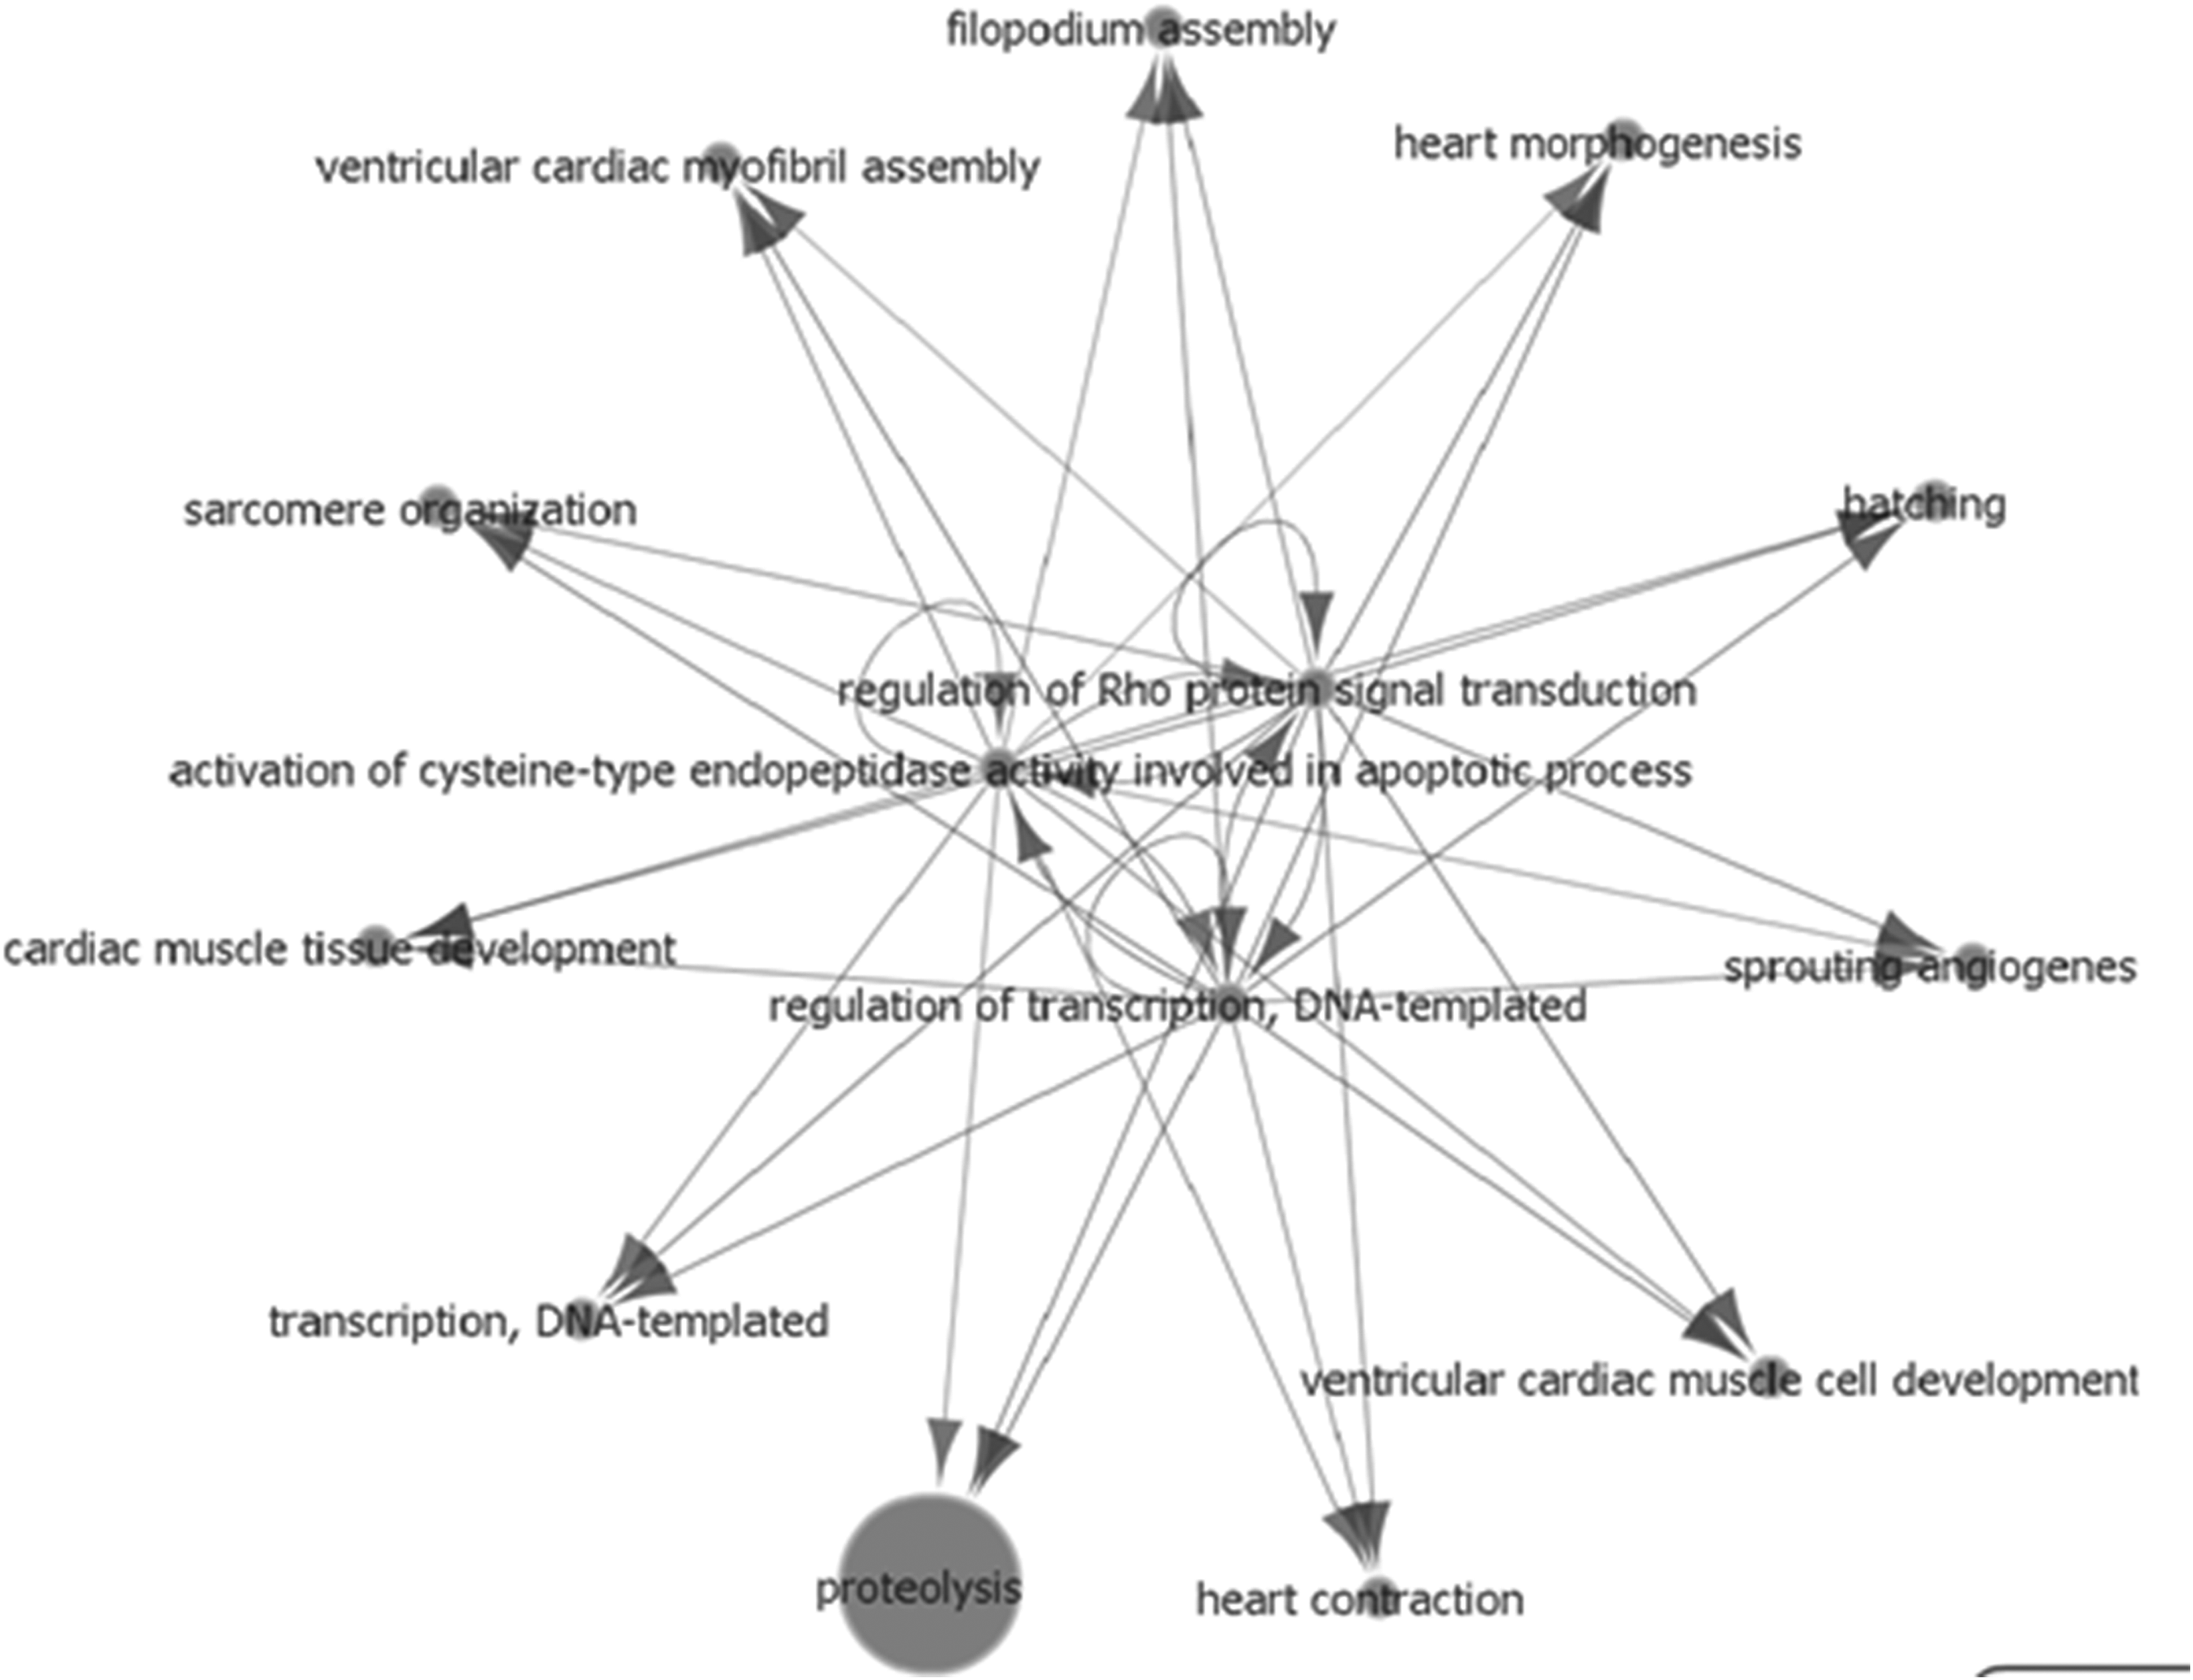
Gene Ontology regulatory network of upregulated genes in the zebrafish brain under hypoxia. See Supplementary File S1 for more information on outputs from the Comparative GO web tool. GO, Gene Ontology.
Footnotes
Acknowledgments
The computational part of this research was supported by use of the Nectar Research Cloud, a collaborative Australian research platform supported by the National Collaborative Research Infrastructure Strategy (NCRIS). Laboratory experiments were supported by the National Health of Australia Project grant (NHMRC Project APP ID: 1061006).
Disclosure Statement
No competing financial interests exist.
References
Supplementary Material
Please find the following supplemental material available below.
For Open Access articles published under a Creative Commons License, all supplemental material carries the same license as the article it is associated with.
For non-Open Access articles published, all supplemental material carries a non-exclusive license, and permission requests for re-use of supplemental material or any part of supplemental material shall be sent directly to the copyright owner as specified in the copyright notice associated with the article.