
Abstract
Abstract
A standard diet for zebrafish, based on their specific nutritional requirements, is of primary importance to improve experimental outcomes with this model organism and optimize its large-scale production. However, the main basic nutritional requirements of zebrafish are yet to be determined. This study aimed at contributing to fill this gap by evaluating the dietary protein requirement of zebrafish juvenile. Ten isoenergetic fishmeal-based diets with increasing protein levels (15%–60%) were formulated, and each diet was assigned to duplicated groups of zebrafish (53.6 mg/17.8 mm initial mean body weight/fork length), fed to apparent satiation during 8 weeks. Weight gain, protein retention, and feed efficiency significantly increased in fish fed diets with increasing protein levels up to 35%–40% and then stabilized. Based on dose–response models, the dietary protein requirement of zebrafish juvenile was estimated at 37.6% and 44.8% for maximum weight gain and maximum protein retention, respectively (with a crude protein-to-energy ratio of about 22.5 g/MJ), corresponding to a protein intake of 14 mg/g average body weight/day. Feed intake increased linearly when fish were fed diets with decreasing protein levels below the estimated requirement, suggesting that zebrafish would regulate feed intake primarily to meet protein needs. On the other hand, the efficiency of protein utilization and retention linearly decreased when fish were fed diets with increasing protein levels above the estimated requirement, indicating that the excess of dietary protein would be deaminated, contributing to increased ammonia excretion. The whole-body composition of fish was affected by the dietary protein level, with fish fed diets with higher protein levels having higher water and protein contents and lower energy content. Considering that zebrafish juveniles are often reared with diets containing excessive amounts of protein, we suggest that the estimated protein requirement should be taken into account to formulate a more suitable, cost-effective, and less pollutant diet for this species.
Introduction
T
Protein is of primary importance for somatic growth and must be provided by diet in sufficient amount to promote optimal growth. On the other hand, attention should be paid to the excess of dietary protein relative to the fish needs since it will lead to increased ammonia excretion, 8 what is of particular concern in recirculating aquaculture systems. Thus, this study aimed to evaluate dietary protein requirement of zebrafish during the juvenile stage, characterized by intensive growth. This will allow the formulation of a zebrafish diet with the optimal level of protein, which will improve protein utilization, maximizing growth, and limiting ammonia excretion.
Materials and Methods
Fish
The study was carried out using laboratory-reared zebrafish juveniles, with 54 days postfertilization (dpf), 53.6 mg mean body weight, and 17.8 mm fork length at the start of the growth trial. These fish were originated from a broodstock that was part of the F1 progeny of wild-type zebrafish obtained in a commercial supplier of ornamental species. From first-feeding to the start of the trial, larvae/postlarvae were reared in a recirculating water system as described elsewhere, 9 fed on newly hatched artemia nauplii (INVE; 56% protein, 15% lipid) up to 30 dpf and flake feed (TetraMin; 47% protein, 10% lipid; twice a day) between 30 and 54 dpf. During that period, water temperature was maintained at 28°C ± 1°C, the photoperiod was set at 14 h light/10 h dark, nitrogenous compounds remained at residual levels, pH stayed around 8.2.
Experimental diets
Ten diets were formulated to be isoenergetic and contain increasing levels of protein, from 15% to 60% of dry matter (diets 15P–60P, Table 1). Fishmeal was used as protein source. Di-calcium phosphate was added to adjust the level of phosphorus in all diets to that of the diet with the highest fishmeal content. Cod liver oil content was changed in the different diets to offset oil in the fish meal and keep diets isolipidic/isoenergetic. For the production of diets, all powdered ingredients were well mixed and then oil and water were added to form a moist blend. The blend was pelleted with a grinder and pellets were dried in an oven at 40°C for 24 h. Dried pellets were crushed and sieved through a battery of sieves to obtain food particles of 400–600 and 600–1000 μm diameter.
Pesquera Centinela, Steam Dried LT, Chile.
Soluble fish protein concentrate, Sopropêche, France.
Pregelatinized maize starch: C-Gel Instant—12016, Cerestar, Mechelen, Belgium.
Mineral mix (mg/kg diet): cobalt sulfate, 1.91; copper sulfate, 19.6; iron sulfate, 200; sodium fluoride, 2.21; potassium iodide, 0.78; magnesium oxide, 830; manganese oxide, 26; sodium selenite, 0.66; zinc oxide, 37.5; dicalcium phosphate, 8.02 (g/kg diet); potassium chloride, 1.15 (g/kg diet); sodium chloride, 0.4 (g/kg diet).
Vitamin mix (mg/kg diet): retinol, 18,000 (IU/kg diet); calciferol, 2000 (IU/kg diet); alpha tocopherol, 35; menadion sodium bis., 10; thiamin, 15; riboflavin, 25; Ca pantothenate, 50; nicotinic acid, 200; pyridoxine, 5; folic acid, 10; cyanocobalamin, 0.02; biotin, 1.5; ascorbyl monophosphate, 50; inositol, 400.
Aquacube, Agil, United Kingdom.
Growth trial
The growth trial was performed in a recirculating water system containing twenty 10-L plastic tanks (experimental units). A group of 20 zebrafish juveniles was allocated to each experimental unit and each diet was randomly assigned to duplicated groups of fish. Since the recirculation system was limited to 20 tanks, it was decided to use only duplicates of each treatment (protein level) to increase the number of treatments and thus improve the accuracy of the regression model 10 used for estimation of the protein requirement.
Fish were fed by hand to visual apparent satiation twice daily (around 0900 and 1600), 6 days a week, during 8 weeks. For this, feed particles were provided in small amounts until fish feeding activity has stopped, which was done in a tank at a time and repeated in two consecutive cycles, at each meal period. Utmost care was taken to assure that all feed supplied was consumed and to prevent subsatiation. To avoid any bias during feeding, feed containers were coded, so it was not possible to know what diet was allocated to each tank. The size of feed particles was 400–600 μm during the first 2 weeks, 400–1000 μm during the following 2 weeks, and 600–1000 μm during the last 4 weeks.
At the start of the experiment and every 2 weeks, fish of each tank were bulk weighed after 24 h fasting. For that, fish were caught with a net and excess water was drained with paper towels. Then, fish were placed in a tared beaker containing system water and weighed on an electronic balance to the nearest 0.01 g. The feed container corresponding to each tank was weighed with the same periodicity to determine feed consumption in each time interval.
Tanks were siphoned daily to eliminate feces and fish were transferred into clean tanks on weighting days. Water temperature, water chemistry, and photoperiod remained as before (see above in this section).
A sample of 100 juvenile fish from the original stock (with 54 dpf, corresponding to those at the start of the experiment) was euthanized with 2-phenoxyethanol (0.3 mL/L) and stored at −80°C for later analysis of body composition. Another sample of 10 fish from the original stock was euthanized and photographed with a digital camera (Canon PowerShot-A620 with a Canon LA-DC-58F adaptor) coupled to a stereomicroscope (Zeiss-Stemi DV4). Digital images were used for measurement of fish fork length with the software ImageJ (available in http://imagej.nih.gov/ij/index.html). At the end of the growth trial, all fish from each tank were euthanized, bulk weighed, photographed, and measured (as described before in this section), and then stored at −80°C for later analysis of body composition.
Chemical analyses
The chemical proximate composition of diets and fish (pooled fish of each tank) was analyzed using the following AOAC standard methods 11 : dry matter, after drying in an oven at 105°C until constant weight; ash, by incineration in a muffle furnace at 450°C for 16 h; crude protein (N × 6.25), by the Kjeldahl method after acid digestion using a Kjeltec system; total lipids, gravimetrically after petroleum ether extraction in a SoxTec system (not determined in fish due to insufficient sample amount); and gross energy, through direct combustion in an adiabatic bomb calorimeter.
Statistical analysis
Before analyses, data were checked for normality and homoscedasticity by the Shapiro–Wilk and Levene tests, respectively, and transformed when needed. Data were analyzed by one-way analysis of variance (ANOVA) and means were compared by the Tukey multiple-range test when significant differences were found (p < 0.05), using the software IBM SPSS Statistics v22 (IBM Corp.). Two models were applied comparatively to fit fish weight gain or nitrogen retention against dietary protein level and protein intake, allowing the estimation of protein requirements: the more conventional broken-line (or linear-plateau) model (BLM) and the four-parameter saturation kinetics model (4-SKM).10,12,13 The rationale for comparing both models is that the protein requirement estimate can significantly vary depending on the estimation model.12,13 These models are defined by the equations:
where Y is the response criterion (weight gain or protein retention); Ymax is the maximum theoretical response; X is the dietary protein level or protein intake; R is the minimum dose required to reach the plateau; U is the parameter describing the response; b is the intercept on the Y axis; n is the apparent kinetic order; K0.5 is the concentration for ½ of (Ymax + b). For both models, model parameters were estimated by an iterative process with the Gauss–Newton method, with the software Statistica v12 (Dell, Inc.).
Results
Growth performance and feed utilization efficiency are summarized in Table 2. Increasing dietary protein levels up to 35%–40% led to increased fish growth, but higher protein levels did not produce any significant improvement. The feed intake significantly decreased as the dietary protein level increased up to 35%, remaining stable from this level onward. As diets were isoenergetic, energy intake followed this same trend. On the contrary, protein intake continuously increased as the dietary protein level increased. In general, the feed efficiency tended to increase with increasing levels of dietary protein up to 35%, while the protein efficiency ratio (PER) steadily decreased as the dietary protein level increased above 35%. Daily protein retention (mg/g average body weight [ABW]) increased with increasing levels of dietary protein up to 35% and then stabilized, while expressed as percentage of protein intake it peaked at the 35% dietary protein level. Daily energy retention (kJ/g ABW) was not influenced by the dietary treatment, but expressed as percentage of energy intake it significantly increased with increasing levels of dietary protein up to 40% and then tended to decrease. Fish condition factor and survival were unaffected by the dietary protein level.
Means in the same row with different superscript letters are significantly different (p < 0.05).
Average body weight (ABW) = (initial body weight + final body weight)/2.
Specific growth rate = ([ln final body weight − ln initial body weight]/number of days) × 100.
Condition factor index = (final body weight/final fork length3) × 100.
Feed efficiency = weight gain/dry feed intake.
Protein efficiency ratio = weight gain/dry protein intake.
Protein or energy retention (mg or kJ/g ABW/day) = (final body protein or energy content − initial body protein or energy content)/ABW/number of days.
Protein or energy retention (% intake) = (protein or energy retention/protein or energy intake) × 100.
SEM, pooled standard error of the mean.
Concerning fish body composition at the end of the trial (Table 3), dry matter was in general lower at higher dietary protein levels than at lower dietary protein levels. Whole-body protein increased linearly with the dietary protein level for protein levels up to 40% and then stabilized. The body energy was higher in fish fed diets with protein levels below 35%–40% and significantly lower in those fed diets with the two highest protein levels.
Means in the same row with different superscript letters are significantly different (p < 0.05).
Both models fitted well the obtained data (0.98 ≥ r ≥ 0.87; Figs. 1 and 2). In the BLM, the estimated protein requirement is given by the abscissa value at the breakpoint, which corresponds to the minimum dietary protein level or protein intake that will produce the maximum response (weight gain or protein retention). Thus, based on the BLM, a dietary protein level of 38.2% and 42.5% (Fig. 1) or a daily protein intake of 14.4 and 14.2 mg/g (Fig. 2) is required for maximal weight gain and protein retention, respectively. In the 4-SKM, since the maximum response is not reached within the tested range of nutrient levels (or intake levels), protein requirement is conventionally estimated as the abscissa value at 95% of the maximum response.12–14 Accordingly, with the 4-SKM, a requirement of 37.0% and 47.1% of dietary protein level (Fig. 1) or 12.5 and 13.7 mg/g of daily protein intake (Fig. 2) was estimated for maximal weight gain and protein retention, respectively.

Dose–response relationship between dietary protein level and weight gain (left) or protein retention (right). For each relationship, the estimated protein requirement is indicated according to the BLM or the 4-SKM. In the 4-SKM the requirement is estimated for 95% of the maximum response. 4-SKM, four-parameter saturation kinetics model; BLM, broken-line model.
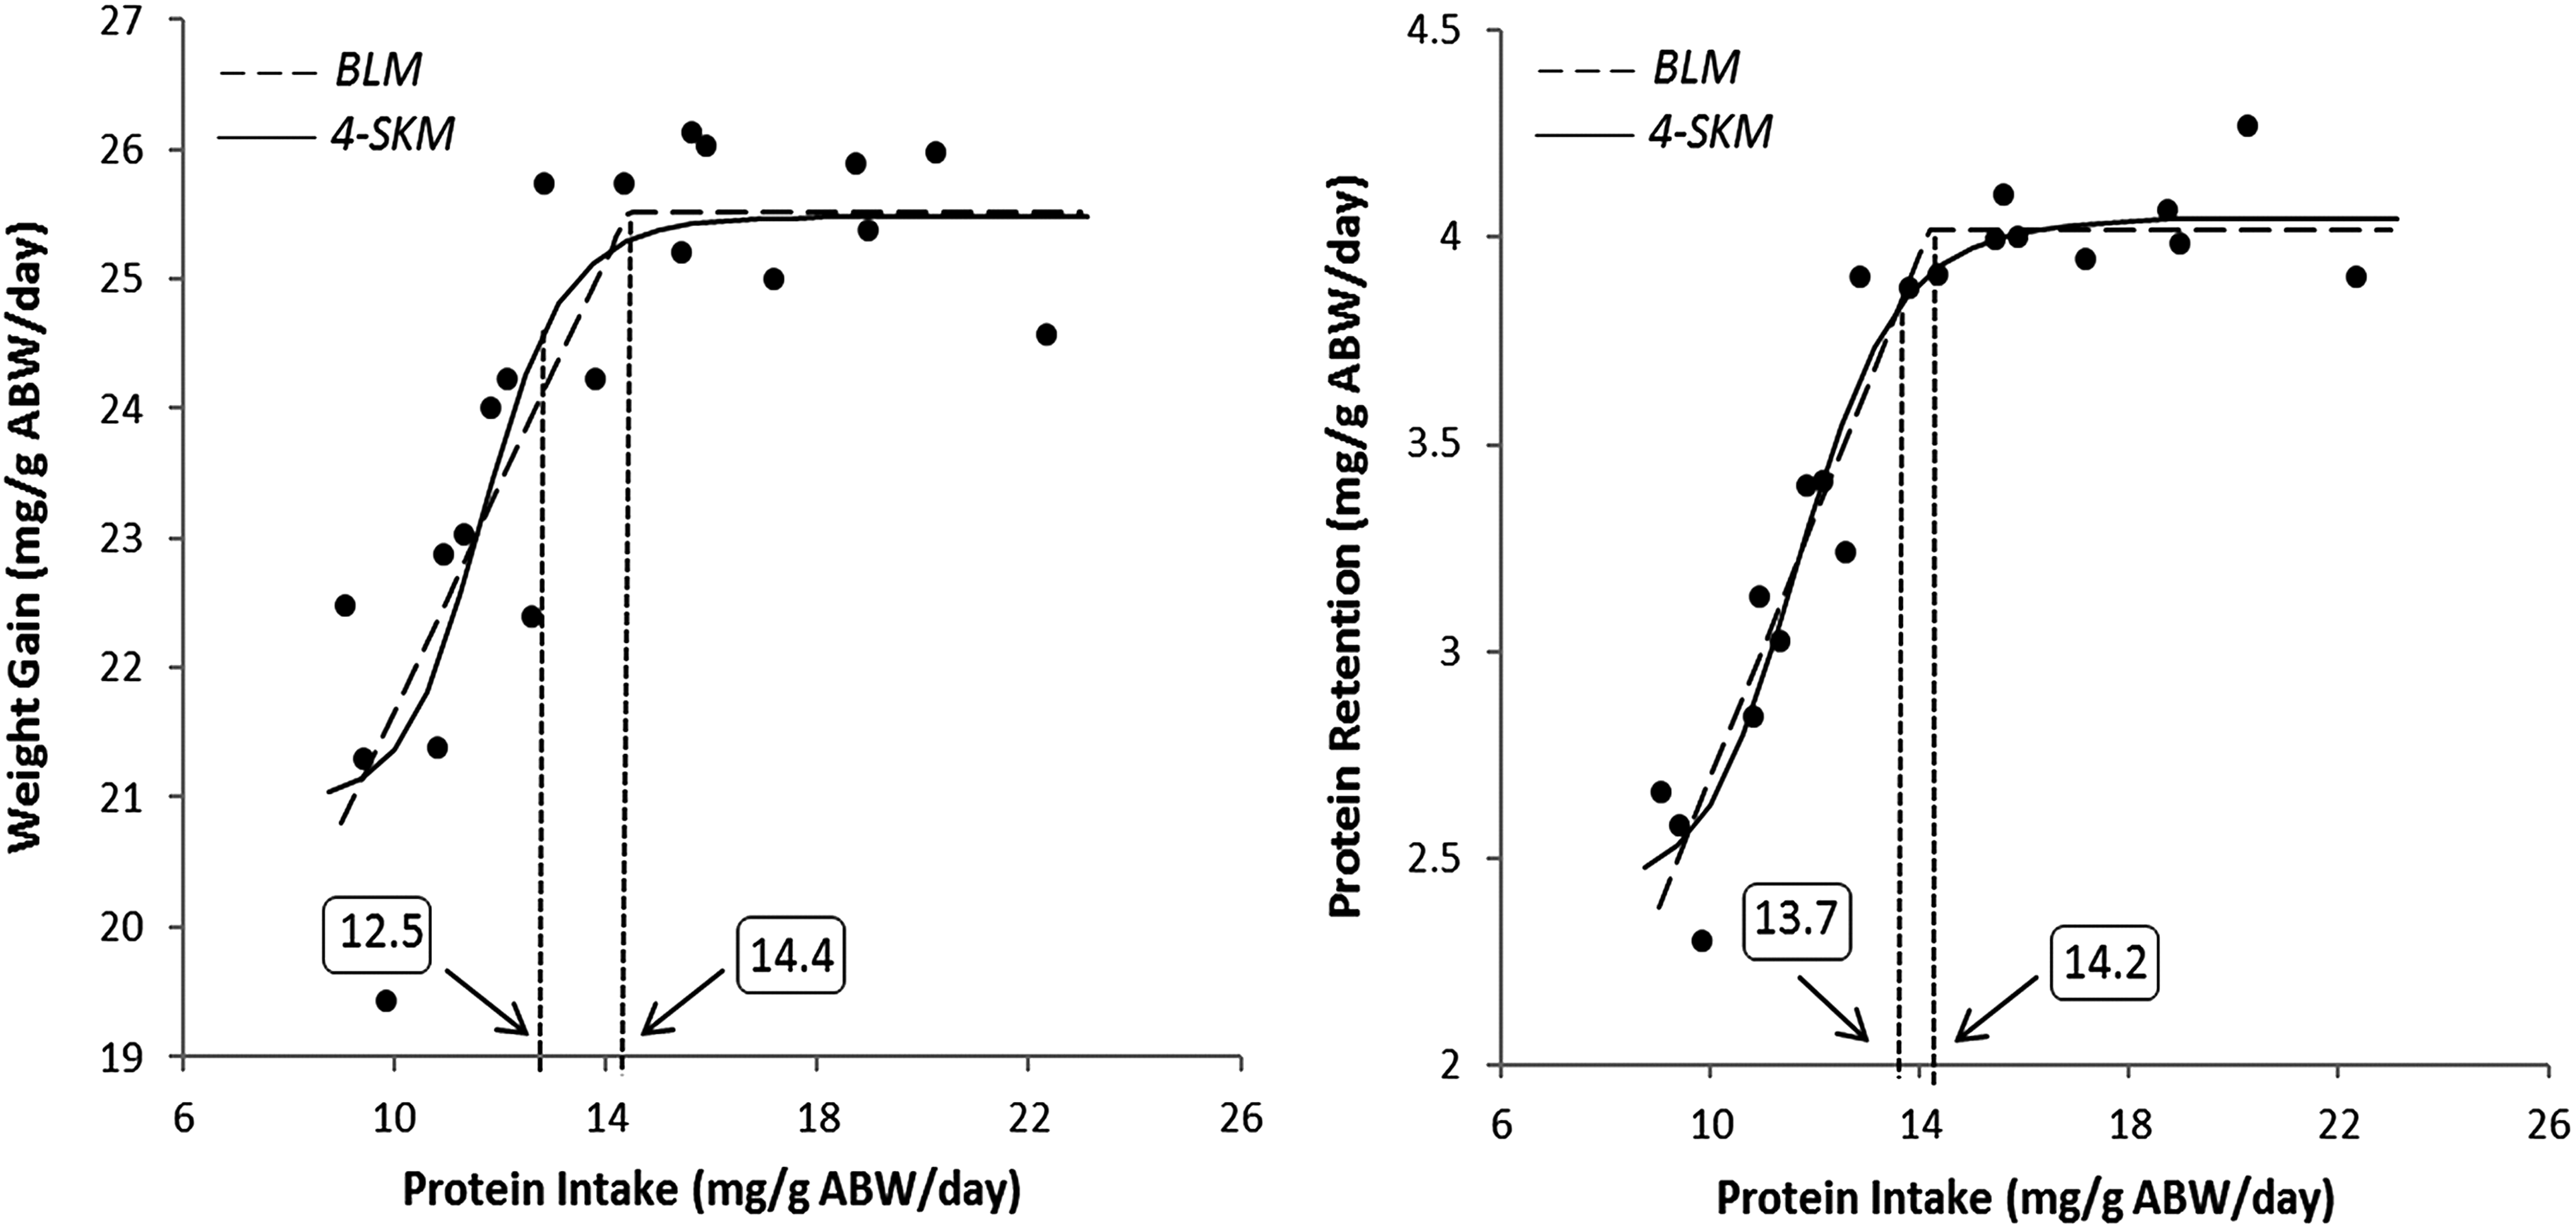
Dose–response relationship between protein intake and weight gain (left) or protein retention (right). For each relationship, the estimated protein requirement is indicated according to the BLM or the 4-SKM. In the 4-SKM the requirement is estimated for 95% of the maximum response.
Discussion
This study showed that dietary protein level had a significant effect on growth, feed utilization efficiency, and body composition of zebrafish during the juvenile stage. Both weight gain and protein retention clearly stabilized above a given dietary protein level, allowing to set at 37.0%–38.2% (average 37.6%) and 42.5%–47.1% (average 44.8%) the dietary protein requirement for maximizing body mass growth and protein accretion, respectively. Previous studies in different species have reported a slightly higher protein requirement when considering protein retention rather than weight gain as the response criterion.15–17 In theory, protein retention has been considered a more specific criterion than any growth criterion and thus estimations of protein requirements based on protein retention should be preferred.18,19
The analysis of a number of studies in different fish species revealed that the use of the broken-line method often leads to a substantial underestimation of nutrient requirements, comparatively to curvilinear models (like the 4-SKM).12–14 This is most likely because in most of these studies the breakpoint in the BLM was placed at the lowest nutrient level from which ANOVA found no significant differences. 12 Instead, in our work the breakpoint in the BLM was determined by an iterative process, and the estimations given by both models were reasonably close.
A recent study 20 suggested that 32% of dietary protein is sufficient to meet the growth requirement of older zebrafish, with an initial body weight of 250 mg (105-day-old), in the transitional stage from juvenile to adult. Those fish showed a specific growth rate two to three times lower than that observed in our work for juvenile fish with about 54 mg initial body weight, supporting a significant decrease in growth rate as zebrafish is closer to the adult stage and its maximum size. 21 Thus, the lower requirement found for older zebrafish, comparatively to our estimation for early juvenile, should be related with the pronounced decrease in the growth rate at that stage, and will not reflect the requirement for juvenile growth. Other studies have revealed sex-specific growth differences in zebrafish, detected at the onset of sexual maturation or later, in general with females showing higher growth rates than males of same age.6,21–23 In our study, regardless the dietary treatment, sexual differentiation/maturation was not evident in several fish at the end of the trial, so results refer to growth of fish from the whole population (not separated by sex). Since the onset of sexual maturation in zebrafish can take place around 3–4 months of age 2 (depending on strain and rearing conditions) and fish in our study were in that age range at the end of the trial, then our results should reflect growth mostly before sexual maturation (i.e., during juvenile growth).
Our estimation of dietary protein requirement for zebrafish falls within the range of values found for other omnivorous cyprinids in the juvenile stage: common carp (38%–45%), 14 gibel carp (36%–42.6%), 24 Indian major carps (35%–40%), 25 Fuxian minnow (38.6%) 26 and golden-line barbell (38.6–41.4). 17 In terms of protein intake, the requirement of zebrafish corresponded to about 14 mg/g body weight/day for maximal growth and protein retention, similar to the estimation of 12 mg/g body weight/day for maximal protein retention in juvenile common carp. 27
It has long been assumed that fish, as other animals, regulate feed intake to meet energy requirements.28,29 Yet it has been suggested that some fish species can also, to some extent, regulate feed intake to meet protein requirements.13,30–33 Both types of regulation of feed intake appear to have occurred in zebrafish. Feed intake in zebrafish fed low-protein diets (i.e., with protein levels below the estimated requirement, around 40%) increased linearly with decreasing dietary protein level. As diets were isoenergetic, this suggests that those fish increased feed intake trying to compensate for the low dietary protein level, to meet protein needs. On the other hand, feed intake (and consequently energy intake) remained unchanged when zebrafish were fed diets with protein levels around or above the estimated requirement, suggesting that it was adjusted to meet energy demands. Taken together, these findings indicate that zebrafish gives priority to meeting protein needs, entering in hyperphagia in case of protein deficit, even if that results in energy overconsumption. Similar results have been found in previous studies in pigs 34 and rats, 35 providing evidence for a physiological regulation of feed intake to ensure a proper supply of protein. The overconsumption of energy due to hyperfagia in zebrafish fed deficient-protein diets was not followed by increased energy retention, since daily energy retention (kJ/g body weight) was similar to that of zebrafish fed nondeficient-protein diets. As a result, fish fed deficient-protein diets showed a significantly lower efficiency of energy retention (as percentage of energy intake), decreasing as the dietary protein level decreased.
When too much protein is supplied in fish diets, only part of it is channeled to growth, and the excess is deaminated and used for energy.8,36,37 This supports the observed progressive decrease of PER and efficiency of protein retention in zebrafish fed diets with increasing protein levels above the estimated requirement, and the stabilization of protein retention at a maximum value once the required protein level was reached. The deamination of the surplus of dietary protein in fish fed high-protein diets would lead to increased ammonia excretion, which is highly toxic to fish and whose accumulation must be prevented in recirculating aquaculture systems.
The dietary protein requirement of fish cannot be dissociated from the protein-to-energy balance (P/E) of the diet,5,8 since an optimal dietary P/E ratio will maximize the allocation of protein for growth and minimize its use as energy source for metabolic purposes. According to our results, the highest efficiency of energy retention was found with the diet containing 40% of dietary protein, roughly corresponding to the estimated dietary protein requirement (37.6%–44.8%). This suggests that a P/E ratio of 22.5 g/MJ would assure a proper balance between crude protein and energy in diets for zebrafish juvenile. Comparable dietary P/E ratios have been proposed as suitable for juvenile of other omnivorous cyprinids, such as the common carp (26.0 g/MJ, expressed as digestible protein/digestible energy), 38 the silver barb (21.1 g/MJ), 39 the Jian carp (23.7 g/MJ), 40 the fringe-lipped carp (19.0 g/MJ, expressed as digestible protein/digestible energy), 41 and the golden-line barbell (25.6–27.3 g/MJ). 17
Results on the effect of the dietary protein level on body composition of fish are often inconsistent. In this work, the body protein content was lower in fish fed dietary protein levels below the estimated requirement, and tended for a gradual increase as the dietary protein level increased up to the required protein level. Contrarily, the body energy content was higher in these fish, probably reflecting a higher body lipid content compared with fish fed dietary protein levels around or above the estimated requirement. Actually, the excess of energy intake and a diet with improper balance of protein to energy, as was in the case of zebrafish fed low-protein diets, may result in deposition of a larger proportion of retained energy as lipid. 42 The same phenomenon was observed in rats fed diets with low protein levels, in which the hyperphagia and consequent increase in energy intake led to an increase in body fat mass. 35 Moreover, the deposition of lipids reduces the water content of the body,33,42 what can explain the general higher dry matter content of fish fed diets with lower protein levels.
Conclusion
This study indicates that the dietary protein requirement for zebrafish juvenile growth should be set at 37.6% for maximum weight gain and 44.8% for maximum protein retention, corresponding to a protein intake of 14 mg/g ABW/day. Considering that zebrafish juveniles are often reared with commercial diets containing excessive amounts of protein (up to about 60%), we suggest that the estimated protein requirement should be taken into account to formulate a more suitable, cost-effective, and less pollutant diet for this species.
Footnotes
Disclosure Statement
No competing financial interests exist.