
Abstract
Abstract
The central nervous system (CNS) of the non-mammalian vertebrates has better neuroregenerative capability as compared with the mammalian CNS. Regeneration of habenula was observed 40 days after damage in zebrafish. During the early stage of regeneration, we found a significant increase of apoptotic cells on day-1 post-damage and of proliferative cells on day-3 post-damage. To identify the molecular factor(s) involved in the early stages of neuroregeneration, differentially expressed proteins during sham, 20- and 40-h post-habenula damage were investigated by proteomic approach by using two-dimensional differential gel electrophoresis (2D-DIGE) coupled with Matrix-Assisted Laser Desorption/Ionization–Time-of-Flight (MALDI-ToF) and tandem mass spectrometry. Protein profiles revealed 17 differentially (>1.5-fold) expressed proteins: 10 upregulated, 4 downregulated, 2 proteins were found to be downregulated at the early stage but upregulated at a later stage, and 1 protein was found to be upregulated at 2 different time points. All proteins identified can be summarized under few molecular processes involved in the early stages of neuroregeneration in zebrafish CNS: apoptosis regulation (Wnt inhibitory factor 1 [WIF1]), neuroprotection (metallothionein), cell proliferation (Spred2, ependymin, Lhx1, and Wnts), differentiation (Spred2, Lhx9, and Wnts), and morphogenesis (cytoplasmic actins and draculin). These protein profiling results suggest that drastic molecular changes occur in the neuroregenerative process during this period, which includes cell proliferation, differentiation, and protection.
Introduction
T
Proteomic approaches have also been successfully applied to determine protein profiles in the mammalian CNS during spinal cord injury.7,8 Furthermore, proteomic approaches have revealed post-translational modifications of proteins during spinal cord injury in rats. 9 Profiling studies have also been used to study neuroregeneration in the brown ghost knifefish Apteronotus leptorhynchus and zebrafish after cerebellar lesion.10,11 However, most proteomic studies on mammalian and non-mammalian regenerating CNS have mainly focused on protein profiling in the later stages of regeneration, and limited studies have examined differential protein expression during the early stages of neuroregeneration.11,12 Characterization of the molecular profile during the early stages of neuroregeneration in fish is important to understand the molecular mechanism underlying this process and may provide insight into the limitations of the neuroregenerative capability of the mammalian CNS.
In this study, we chose zebrafish (Danio rerio) as a model organism because of the high regenerative capability of their CNS, the availability of complete protein sequence data for this species, and their high degree of homology with humans.4,13–15 First, we characterized neuroregeneration in the zebrafish CNS by examining cell proliferation (bromodeoxyuridine [BrdU]-immunohistochemistry) and apoptosis (terminal deoxynucleotidyl transferase dUTP nick-end labeling [TUNEL]) at different time points (1, 3, 15, and 40 days post-damage). For experiments involving brain damage, we selected the habenula as the target region, because this brain structure is evolutionarily highly conserved among vertebrates 16,17; therefore, the information obtained in this study may be relevant to other vertebrates. Furthermore, the habenula is an adult stem cell niche in the teleost brain, and it is located on the surface of the teleost brain, facilitating its easy surgical removal. 18 We used a transgenic strain of zebrafish (brn3a-hsp70:Green fluorescent protein [GFP]), in which the habenular neurons are labeled with GFP, 19 which enabled us to monitor the structural and functional recovery of the damaged habenular area. To analyze the protein profile present during the early stages of neuroregeneration, differentially expressed proteins in the damaged zebrafish brain were analyzed by using a proteomic approach involving two-dimensional differential gel electrophoresis (2D-DIGE) combined with matrix-assisted laser desorption/ionization (MALDI) time-of-flight (ToF) mass spectrometry (MS) and tandem (ToF/ToF) MS.
Materials and Methods
Animals
Sexually mature male zebrafish (D. rerio, wild type) with a standard length from 2.8 to 3.0 cm were used for the study. A transgenic, Tg (brn3a-hsp70:GFP)rw0110b zebrafish strain19,20 was obtained from Prof. Hitoshi Okamoto, National Bioresource Project of Japan, RIKEN (Wako, Japan). Fish were kept in freshwater aquaria at 27°C ± 0.5°C with a controlled standard photoregimen (14/10 h, light/dark). The fish were maintained and used in accordance with the guidelines of the Animal Ethics Committee of Monash University (Approval No. SOBSB/MY/2008/42).
Local damage to the brain tissue
To damage the habenula region, fish were anesthetized by immersion in a 0.025% of benzocaine (Sigma) solution, and the fish were placed on a water-soaked sponge for positioning. Guided by the specific landmark on the zebrafish's head (5.0 mm from the mouth, 2.0 mm from the eye frontal), a 4.0 mm2 area of the skull was removed by a sterile surgical blade (Grade 11, Sheffield, England) under a dissection microscope (Nikon SMZ 1500, Tokyo, Japan) (Supplementary Fig. S1; Supplementary Data are available online at www.liebertpub.com/zeb). An extra fine tweezers with tip measures, 0.06 mm width × 0.02 mm thick (5/5A Fontax; Taxal, England, United Kingdom) was inserted (1.0 mm depth) under the cranium to damage the habenula region. The opening on the cranial was sealed by the dissected skull with a water-proof instant adhesive (LOCTITE 404, Sunnyvale, CA). The fish were then returned to an isolated tank for recovery and kept for 1, 3, 15, and 40 days (n = 6/group) to observe progressive neuroregeneration. For the proteomic study, 20 and 40 h (n = 8/group) post-damage fish were used. As a negative control, sham-operated fish (surgically operated with the skull plate removed but without any brain damage) (n = 6 − 8) were prepared and kept for the same time periods for recovery.
To observe neuroregeneration in the brain of Tg zebrafish, the same operation was conducted under a dissection microscope with a B-2A filter (Nikon Instruments, Tokyo, Japan) to remove the GFP-expressing habenula. The location of the habenula on the surface of the zebrafish brain allowed viewing the fluorescence, even without removal of the skull. The operated transgenic fish (n = 3) were then returned to an isolated tank and were monitored 3 days, 2 weeks, and 40 days after habenula removal under the dissection microscope.
TUNEL staining
For characterization of the apoptotic process during neuroregeneration, apoptotic cells were detected by apoptotic TUNEL assay by using the Cell Death Detection Kit (Roche Diagnostics, Mannheim, Germany) according to the manufacturer's protocol. The habenula-damaged (1-, 3-, 15-, and 40-days post-habenula damage) (n = 6) and sham control (n = 6) fish were anesthetized in 0.025% of benzocaine solution and killed by decapitation. The brains were dissected, embedded in Tissue-Tek Optimal Cutting Temperature (OCT) compound (Sakura Finetechnical Co. Ltd., Tokyo, Japan), and frozen on dry ice. The brains were cut into 14 μm of coronal sections by using a cryostat, and the sections were thaw-mounted onto aminopropyltriethoxy silane-coated slides (Fisher Scientific Co., Fairlawan, NJ). The sections were fixed in buffered 4% paraformaldehyde (PFA) in 0.1 M phosphate buffer (PB) at 4°C for 5 min. The sections were then washed with phosphate-buffered saline (PBS, pH 7.4) for three times, 2 min each to remove the fixative solution. The slides were then treated in 0.01 M citrate buffer (citric acid/sodium citrate, pH 6.0) and irradiated for 2 min at a microwave power of 750 W. The slides were immediately immersed in PBS at room temperature for rapid cooling. After the pretreatment, the slides were incubated for 60 min at 37°C with TUNEL reaction mix containing the TdT enzyme and fluorescein-labeled dUTPs (Roche Diagnostics). Positive and negative controls were included and processed in parallel with the test samples. As for the positive control, sections were treated with 1 U/μL concentration of DNAase (Promega, Madison, WI) for 5 min at room temperature before the treatment with TUNEL reaction mixture; whereas for the negative control, the sections were treated as described earlier without TdT enzyme. The sections were further counterstained with 1 μg/mL of 4′,6-diamidino-2-phenylindole (DAPI; Sigma).
BrdU immunohistochemistry
To observe neurogenesis during neuroregeneration, S-phase cells were labeled by combining BrdU and 5-fluoro-2′-deoxyuridine (FdU) treatment, which has been previously applied in an in vivo study in fish. 21 The habenula-damaged (1-, 3-, 15-, and 40-days post-habenula damage) and sham control (n = 6/group) fish were anesthetized in 0.025% of benzocaine solution and injected intraperitoneally with a cocktail of 3.0 mg/mL BrdU (Sigma) and 0.3 mg/mL FdU (Sigma) in 0.9% w/v sterile NaCl saline with ∼l00 μL/g of body weight 24 h before sampling. Twenty-four hours after the injection, the fish were anesthetized in 0.025% of benzocaine solution and killed by decapitation. The brains were removed and fixed in buffered 4% PFA for 6 h at 4°C. Cryoprotection was achieved by transferring the brains into 20% sucrose in PB at 4°C overnight. Subsequently, the brains were embedded in OCT compound, quickly frozen with dry ice, and sectioned coronally by using a cryostat at 14 μm.
For staining, the sections were incubated in 2 N HCl at 37°C for 1 h to denature the DNA. The reaction was stopped by a 10 min rinse in 0.1 M borate buffer (pH 8.5) at room temperature, followed by three rinses in PBS. After incubation at room temperature for 30 min in blocking solution (2% normal horse serum and 0.5% Triton X-100 in PBS), the sections were incubated in a mouse anti-BrdU antibody (BD PharMingen Laboratories, Franklin Lakes, NJ) that was diluted 1:200 in the blocking solution at 4°C overnight. As negative controls, sections were processed without the primary antibody. After two rinses in PBS for 10 min each, the sections were incubated for 2 h at room temperature with Alexa Fluor 594-labeled anti-mouse IgG (Invitrogen, Carlsbad, CA) that was diluted 1:200 in blocking solution. Coverslips were applied with Vectashield (Vector Laboratories, Burlingame, CA).
Cell counts and statistical analysis
The sections were examined, and images were captured by using an inverted fluorescence microscope (TE2000; Nikon Instruments) with a G-2A filter (Nikon Instruments) to reveal BrdU-labeled cells with 4 × and 10 × objective lens. Images of BrdU-labeled cells were first captured with a digital camera (DXM1200; Nikon Instruments), and cell numbers on the images were counted via Image-Pro Plus 6.0 software (Media Cybernetics, Inc., Rockville, MD). In the habenula-damaged experiments, the number of anti-BrdU cells were counted in the whole section containing the habenula region on ∼15 sections per fish (n = 6/group). All values are expressed as mean ± standard error of the mean. Data were compared by using an analysis of variance (ANOVA) for multiple comparisons with the Tukey–Klamer post-hoc test. The statistical significance was accepted with p < 0.05. Cell counting of TUNEL-labeled cells was inapplicable by the software given the over-compact nature of these images.
Proteomics analysis
Sample preparation and protein extraction
To prepare protein samples, the habenula-damaged and sham-operated fish were anesthetized and sacrificed 20- and 40-h post-damage (n = 8/group). The brain (covering from the olfactory bulb to the cerebellum) was removed from the skull and immediately transferred into a microcentrifuge tube containing 150 μL of cytoplasmic protein extraction lysis buffer (50 mM Tris-HCl [pH 7.0], 0.1 M KCl, 20% glycerol, and 1% protease inhibitor [Amersham Biosciences, Piscataway, NJ]). 22 The brain was homogenized on ice, and the homogenate was vortexed vigorously for 2 min and centrifuged at 14,000 rpm for 20 min at 4°C. The supernatant was collected as cytoplasm protein lysate, re-concentrated, and desalted via a 3 kDa cut-off centrifugal filter device (Amicon Ultra-4, Millipore, Rockville, MD). The fractionated lysate was further purified with a 2-D Clean-Up Kit (GE Healthcare Biosciences, Little Chalfont, United Kingdom) for protein precipitation before 2D gel electrophoresis, which has previously been used for fish samples including zebrafish23,24 The protein pellet was resuspended in 20 μL of DIGE lysis buffer (7 M Urea, 2 M Thiourea, 30 mM Trizma base, and 4% [w/v] of CHAPS, pH 8.5). Protein concentration was determined by using a 2-D Quant Kit (GE Healthcare Biosciences). All procedures were performed according to the manufacturer's instructions.
Fluorescence labeling with CyDyes
For quantitative comparison of protein expression, 2D-DIGE analysis was performed. Brain protein lysates of sham, 20- and 40-h post-damage were labeled with CyDye DIGE fluors by using minimal CyDye kit (GE Healthcare Biosciences) according to the manufacturer's instructions. Internal pools of samples were prepared by combining equal amounts of all groups of samples, including habenula-damaged and sham control (n = 8/group), and labeled with Cyanine 2 (Cy2); whereas individual samples (pooled from two fish) were labeled with Cy3 or Cy5. The combinations of sample for labeling are summarized in Supplementary Table S1. Ten micrograms of protein were labeled with 80 pmol of working CyDye solutions (CyDyes reconstituted in dimethylformamide) for 30 min at 4°C in the dark. The reaction was terminated by addition of 1 μL 10 mM lysine to the mixture and incubation for 10 min in the dark on ice. The CyDye-labeled lysates were then subjected to first-dimension isoelectric focusing separation.
2D-DIGE and image analysis
Seven-centimeter Immobiline immobilized pH gradient (IPG) DryStrips (pH 3–10; GE Healthcare Biosciences) was placed in a chamber for overnight rehydration with 125 μL of rehydration buffer (2 M thiourea, 7 M urea, 2% [w/v] CHAPS, 2% IPG buffer, 2% [w/v] DTT, and trace amount of bromophenol blue) at room temperature without sample. The CyDyes-labeled samples were then diluted with rehydration buffer and loaded by cup-loading at the anodic end on top of the rehydrated IPG strips. The strips were then subjected to first-dimension separation by using an IPGphor system (GE Healthcare Biosciences) with the following protocol: 300 V for 30 min; 1 kV (gradient) for 30 min; 5 kV (gradient) for 1:20 h; and 5 kV for 30 min and holding. The focused strips were equilibrated at room temperature for 15 min in equilibration buffer (75 mM Tris-HCl with pH 8.8, 6 M Urea, 30% glycerol, 2% [w/v] sodium dodecyl sulfate [SDS], trace amount of bromophenol blue with 0.5% [w/v] DTT), followed by another 15 min of equilibration buffer washing with 4.5% (w/v) iodoacetamide. The equilibrated strips were electrophoresed on 12.5% second dimension of sodium dodecyl sulfate-polyacrylamide gel electrophoresis (SDS-PAGE) gels by using SDS electrophoresis running buffer (25 mM Tris HCl, 192 mM Glycine, and 0.2% [w/v] SDS).
The electrophoresed second-dimension SDS-PAGE gels were immediately scanned for Cy2 (520 BP40 filter), Cy3 (580 BP30 filter), and Cy5 (670 BP30 filter) fluorescence with the use of a Typhoon Trio Imager (GE Healthcare Biosciences) at a pixel resolution of 100 μm. The scanned gel images were loaded into the DeCyder software program v6.0 (Amersham, GE Healthcare Biosciences) for differential in-gel analysis and biological variation analysis.
MS and protein identification
After 2D-DIGE analysis, the gels were fixed in 10% acetic acid and stained with Coomassie Brilliant blue, G250 (Fisher Scientific Co.) to confirm the presence of a sufficient amount of proteins in the spots to generate high-quality mass spectra. The stained gels were matched and compared with the images to determine the positions of the protein spots of interest.
Spots of interest were manually cut by using sterilized scalpels or micropipette tips (depending on spot size). Excised gels were destained by washing in 50 mM ammonium bicarbonate containing 50% of acetonitrile; then washed for 60 min in 20 mM ammonium bicarbonate and for 10 min in acetonitrile for dehydration. The gel pieces were treated with 500 ng of trypsin (Promega) in 20 mM ammonium bicarbonate solution pH 8.0 at 37°C overnight. The digests were sonicated in a water bath for 10 min after overnight incubation. The digests were desalted and concentrated via ZipTips (Millipore, Billerica, MA), and 0.5 μL of concentrated digests were spotted on an MALDI plate on top of 0.5 μL of α-hydroxycinnamic acid matrix.
The dried spots with matrix-tryptic digests were analyzed by 4700 MALDI ToF-ToF (Applied Biosystems, Foster City, CA). The spectra were collected over the range m/z 800 − 3,500, and they were processed by using 4000 series Explorer software (Applied Biosystems) to generate monoisotopic peptide masses, which were used to identify proteins using Mascot Server and MascotScience against the National Center for Biotechnology Information (NCBI) database. Cysteine modification by iodoacetamide, methionine oxidation modification, 50 ppm peptide tolerance, and one missed trypsin cleavage were included as search parameters.
Cloning and quantitative real-time polymerase chain reaction
For cloning of the genes selected from proteomics data, total RNAs were isolated from the whole brains of 0 (sham), 10, 20, and 40 h post-habenula damage by using TRIzol (Invitrogen). Six hundred nanograms of the total RNAs were reverse transcribed in 20 μL volume with a High-Capacity cDNA Reverse-Transcription Kit (Applied Biosystems). Beta-tubulin was also cloned as an internal reference in quantitative polymerase chain reaction (PCR) analysis, as its messenger RNA (mRNA) expression was reported to be more consistent compared with other housekeeping genes regardless of the experimental condition or cell type. 25 Primer sequences used for cloning and GenBank accession numbers of the genes of interest and beta-tubulin (tubulin, beta 4B class IVb) are listed in Table 1.
PCR products were electrophoresed to confirm the size and inserted in a pGEM®-T Easy Vector (Promega) cloning vector. The sequences of the PCR products were further confirmed by sequence analysis with ABI PRISM 3130 Genetic Analyzer (Applied Biosystems) and Sequence Analysis Software (Applied Biosystems).
Real-time PCR was conducted by using the 7500 Real-Time PCR System with software SDS version 1.3.1 (Applied Biosystems). The reactions of 10 μL contained 1 × Power SYBR Green Master Mix (Applied Biosystems); 0.25 μM gene-specific forward and reverse primers and 1 μL complementary DNA (cDNA) were quantified under the following thermal cycler conditions: 50°C for 2 min, 95°C for 10 min, 95°C for 15 s, and 60°C for 1 min for 40 cycles; and a dissociation stage was added with the following conditions: 95°C for 15 s, 60°C for 1 min, and 95°C for 15 s. Data were then obtained through absolute quantification. The quantities of all genes were determined and normalized against the internal control, beta-tubulin. Beta-tubulin was used as an internal control for quantitative PCR analysis, as its mRNA expression was reported to be more consistent compared with other housekeeping genes regardless of the experimental condition or cell type for spinal cord tissue after traumatic injury. 25 Data were compared by using an ANOVA for multiple comparisons with the Tukey–Klamer post-hoc test. p < 0.05 was considered statistically significant.
Results
Habenular-like restoration in zebrafish after habenular region damage
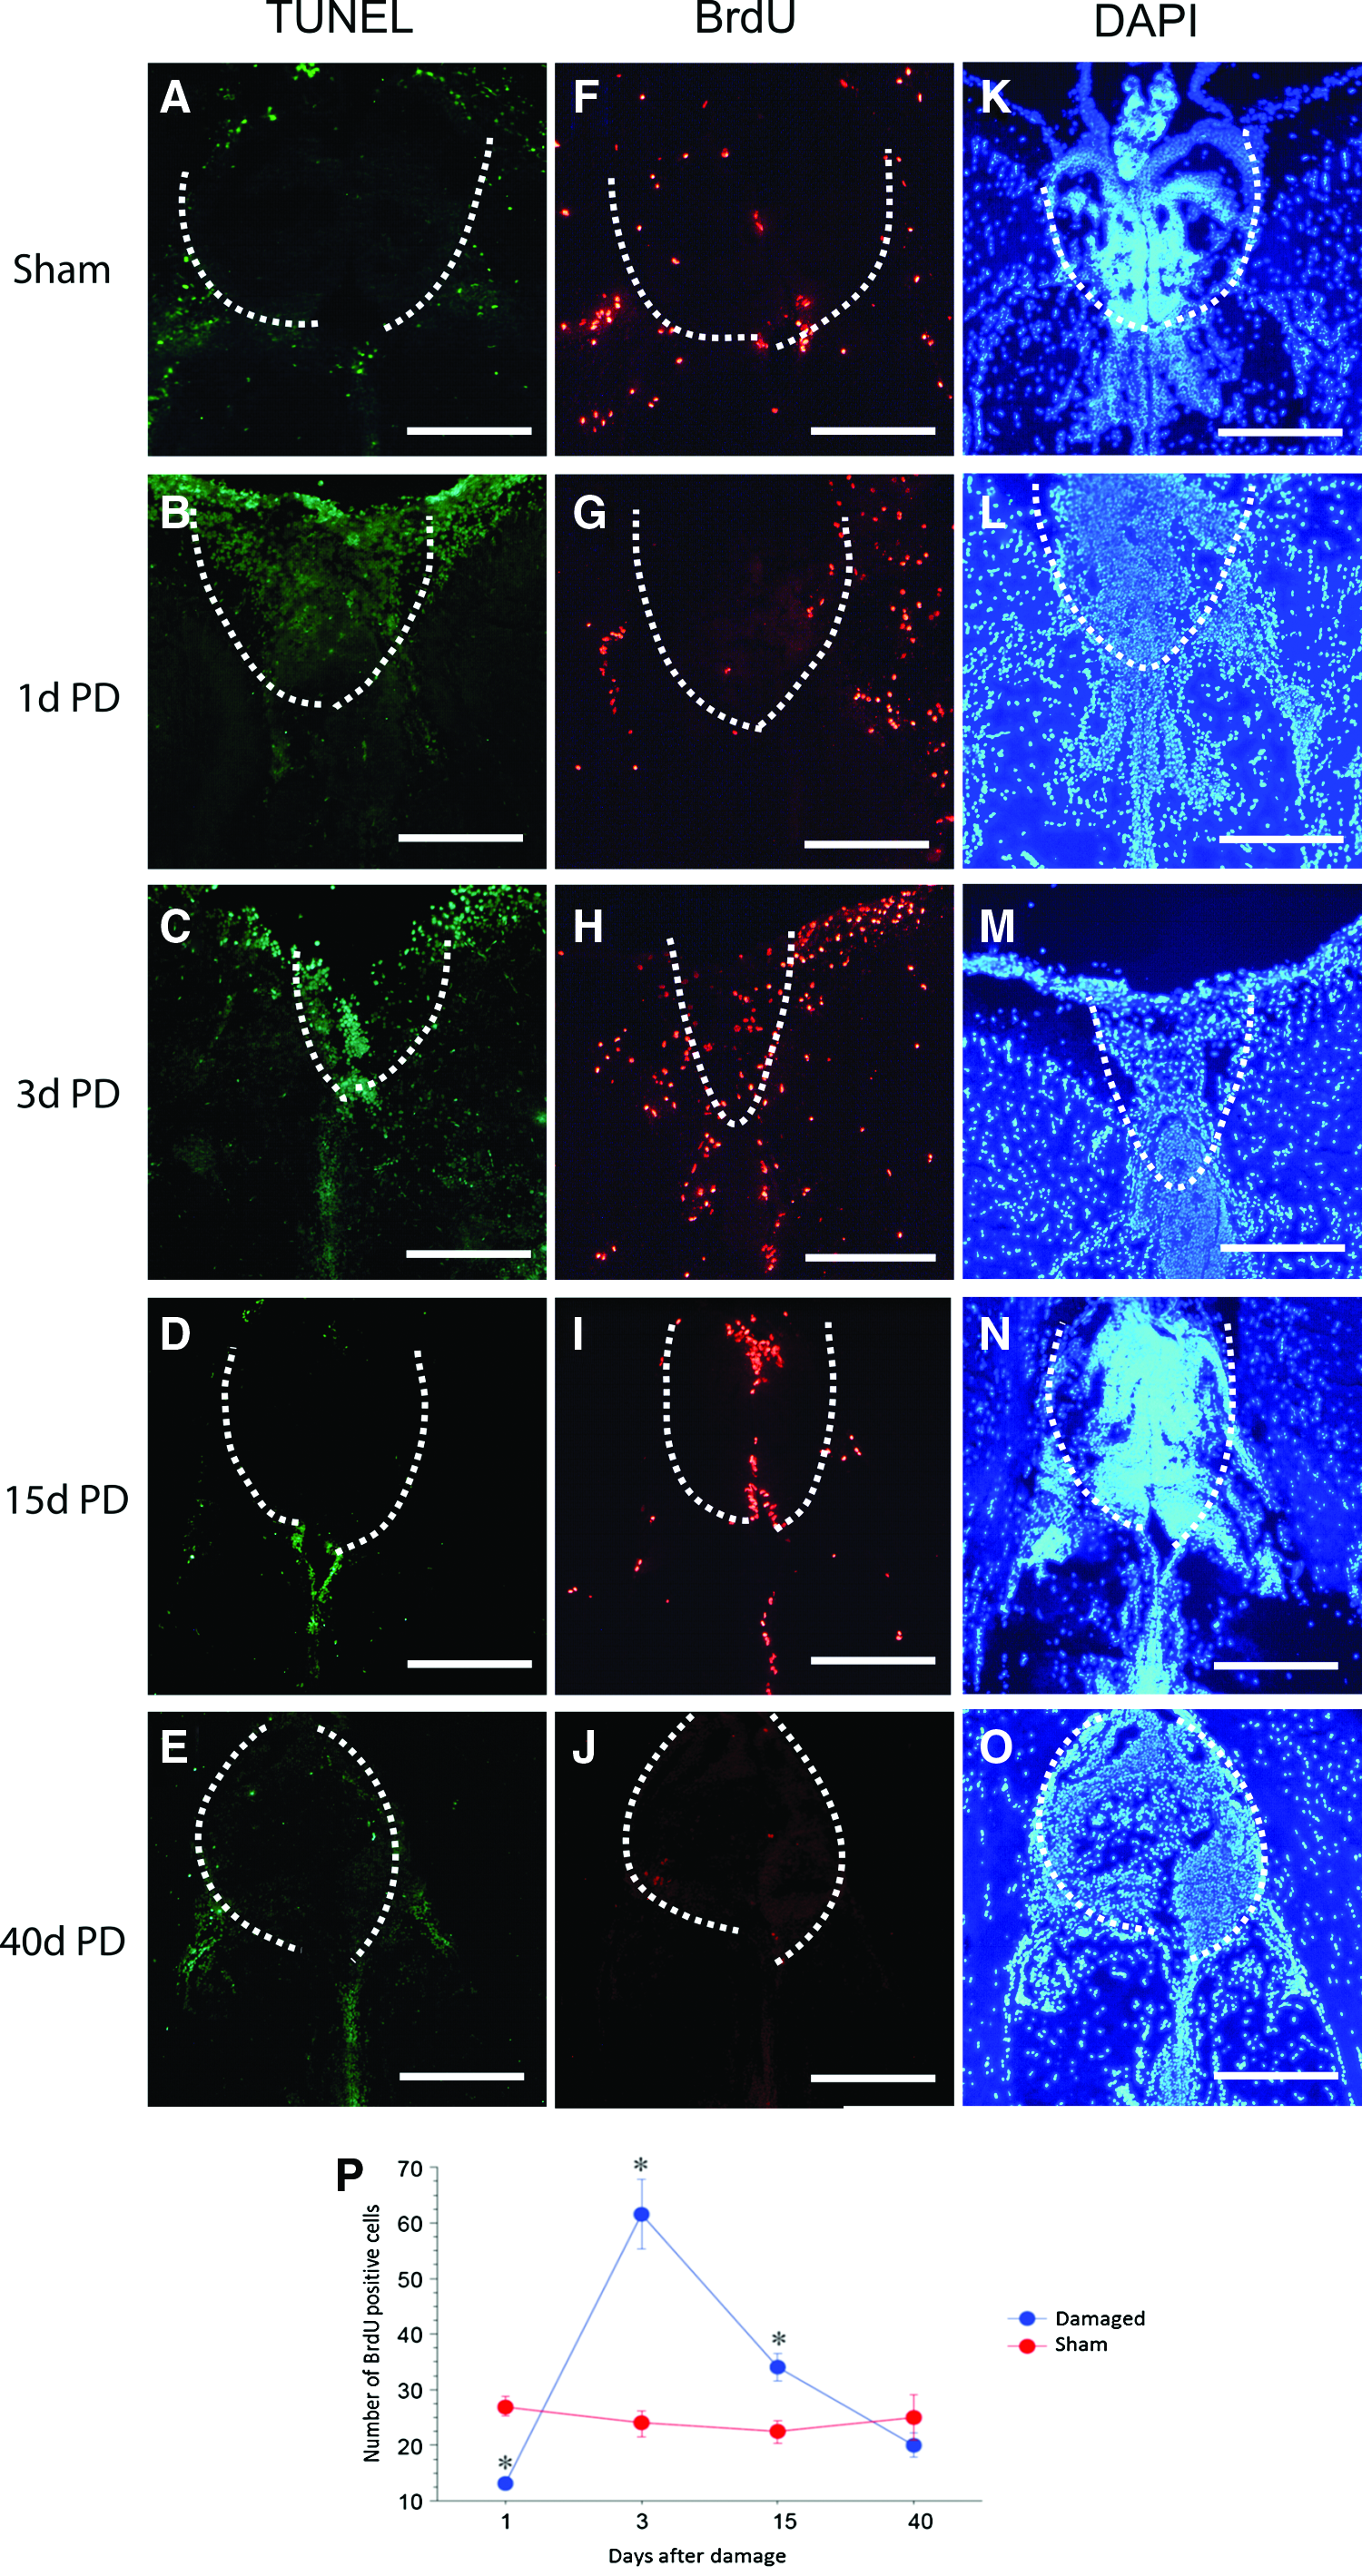
The habenular region was damaged by using tweezers that were guided by a specific landmark (Fig. 1 and Supplementary Fig. S1). Gradual restoration of the tissue was visualized in the damaged habenular region by using TUNEL (Fig. 2A-E), BrdU immunohistochemistry (Fig. 2F-J) and DAPI staining (Fig. 2K-O). In sham-operated fish, few TUNEL-labeled cells were evident in the habenular region (Fig. 2A). The TUNEL-labeled cells had accumulated at the area of habenular region 1-day post-habenular damage (Fig. 2B). The clumped TUNEL-labeled cells had disallowed cell counting to progress; hence, an observation was made based on the overall changes. The morphological structure of habenular region had deformed (Fig. 2L) after the damage as compared with sham-operated fish (Fig. 2K). This indicated that the habenular region had successfully been damaged after the local damage procedure and was going through apoptosis. By 3 days post-damage, accumulated TUNEL-labeled cells were almost cleared (Fig. 2C). No habenular-like region was observed at 3 days post-damage (Fig. 2M). The number of TUNEL-labeled cells had decreased to that which was evident at baseline at 15 and 40 days post-damage (Fig. 2D, E).
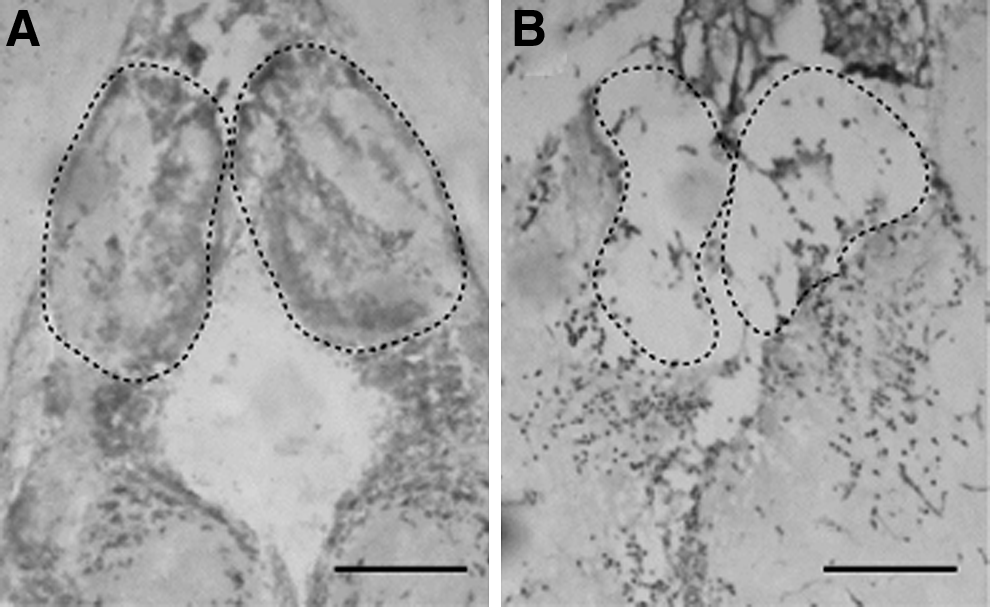
Cresyl violet (nuclei stain)-stained coronal sections of the zebrafish brain before
TUNEL
Cell proliferation at the damaged site was examined by immunolabeling BrdU-positive cells (Fig. 2F–J). The number of BrdU-positive cells had increased significantly at 3 and 15 days after habenular damage (Fig. 2H, I, P; p < 0.05) and went back to normal levels by 40 days post-damage (Fig. 2J). This significant change was mainly due to the dispersed pattern of the BrdU-positive cells throughout the nearby habenula region, in comparison to the BrdU-positive cells that were accumulated only in the midline of the small newly regenerated habenula region. Forty days post-damage, the habenular-like structure was seen to be gradually reformed with an oval shape (Fig. 2K–O).
Using a transgenic strain of zebrafish (brn3a-hsp70:GFP), we evaluated the restoration of the damaged habenula via recovery of the green fluorescent signal that was specifically expressed on the habenular region with transgene (Fig. 3). After damage to the GFP-labeled habenular region, the green fluorescent signal diminished (Fig. 3A–D). However, it gradually reappeared 2 weeks post-damage (Fig. 3E, F).

Photos of
At 3 days post-damage, a significant increase in the number of BrdU-positive cells was visible at the habenular damaged site, as well as its neighbor regions, throughout the optic tectum and forebrain regions (Fig. 4A), compared with that in sham-operated fish and the situation at 1 day post-damage (2.6-fold compared with that in sham-operated fish and 2.2-fold compared with that 1 day post-damage, p < 0.05; Fig. 4B). A sharp increase in the number of BrdU-labeled cells occurred between 48 and 72 h (the BrdU-injected period), suggesting that dramatic molecular changes occur before 48 h post-damage. Therefore, we examined differential protein expression in the whole zebrafish brain at 20 and 40 h post-damage to identify proteins related to early neuroregeneration.
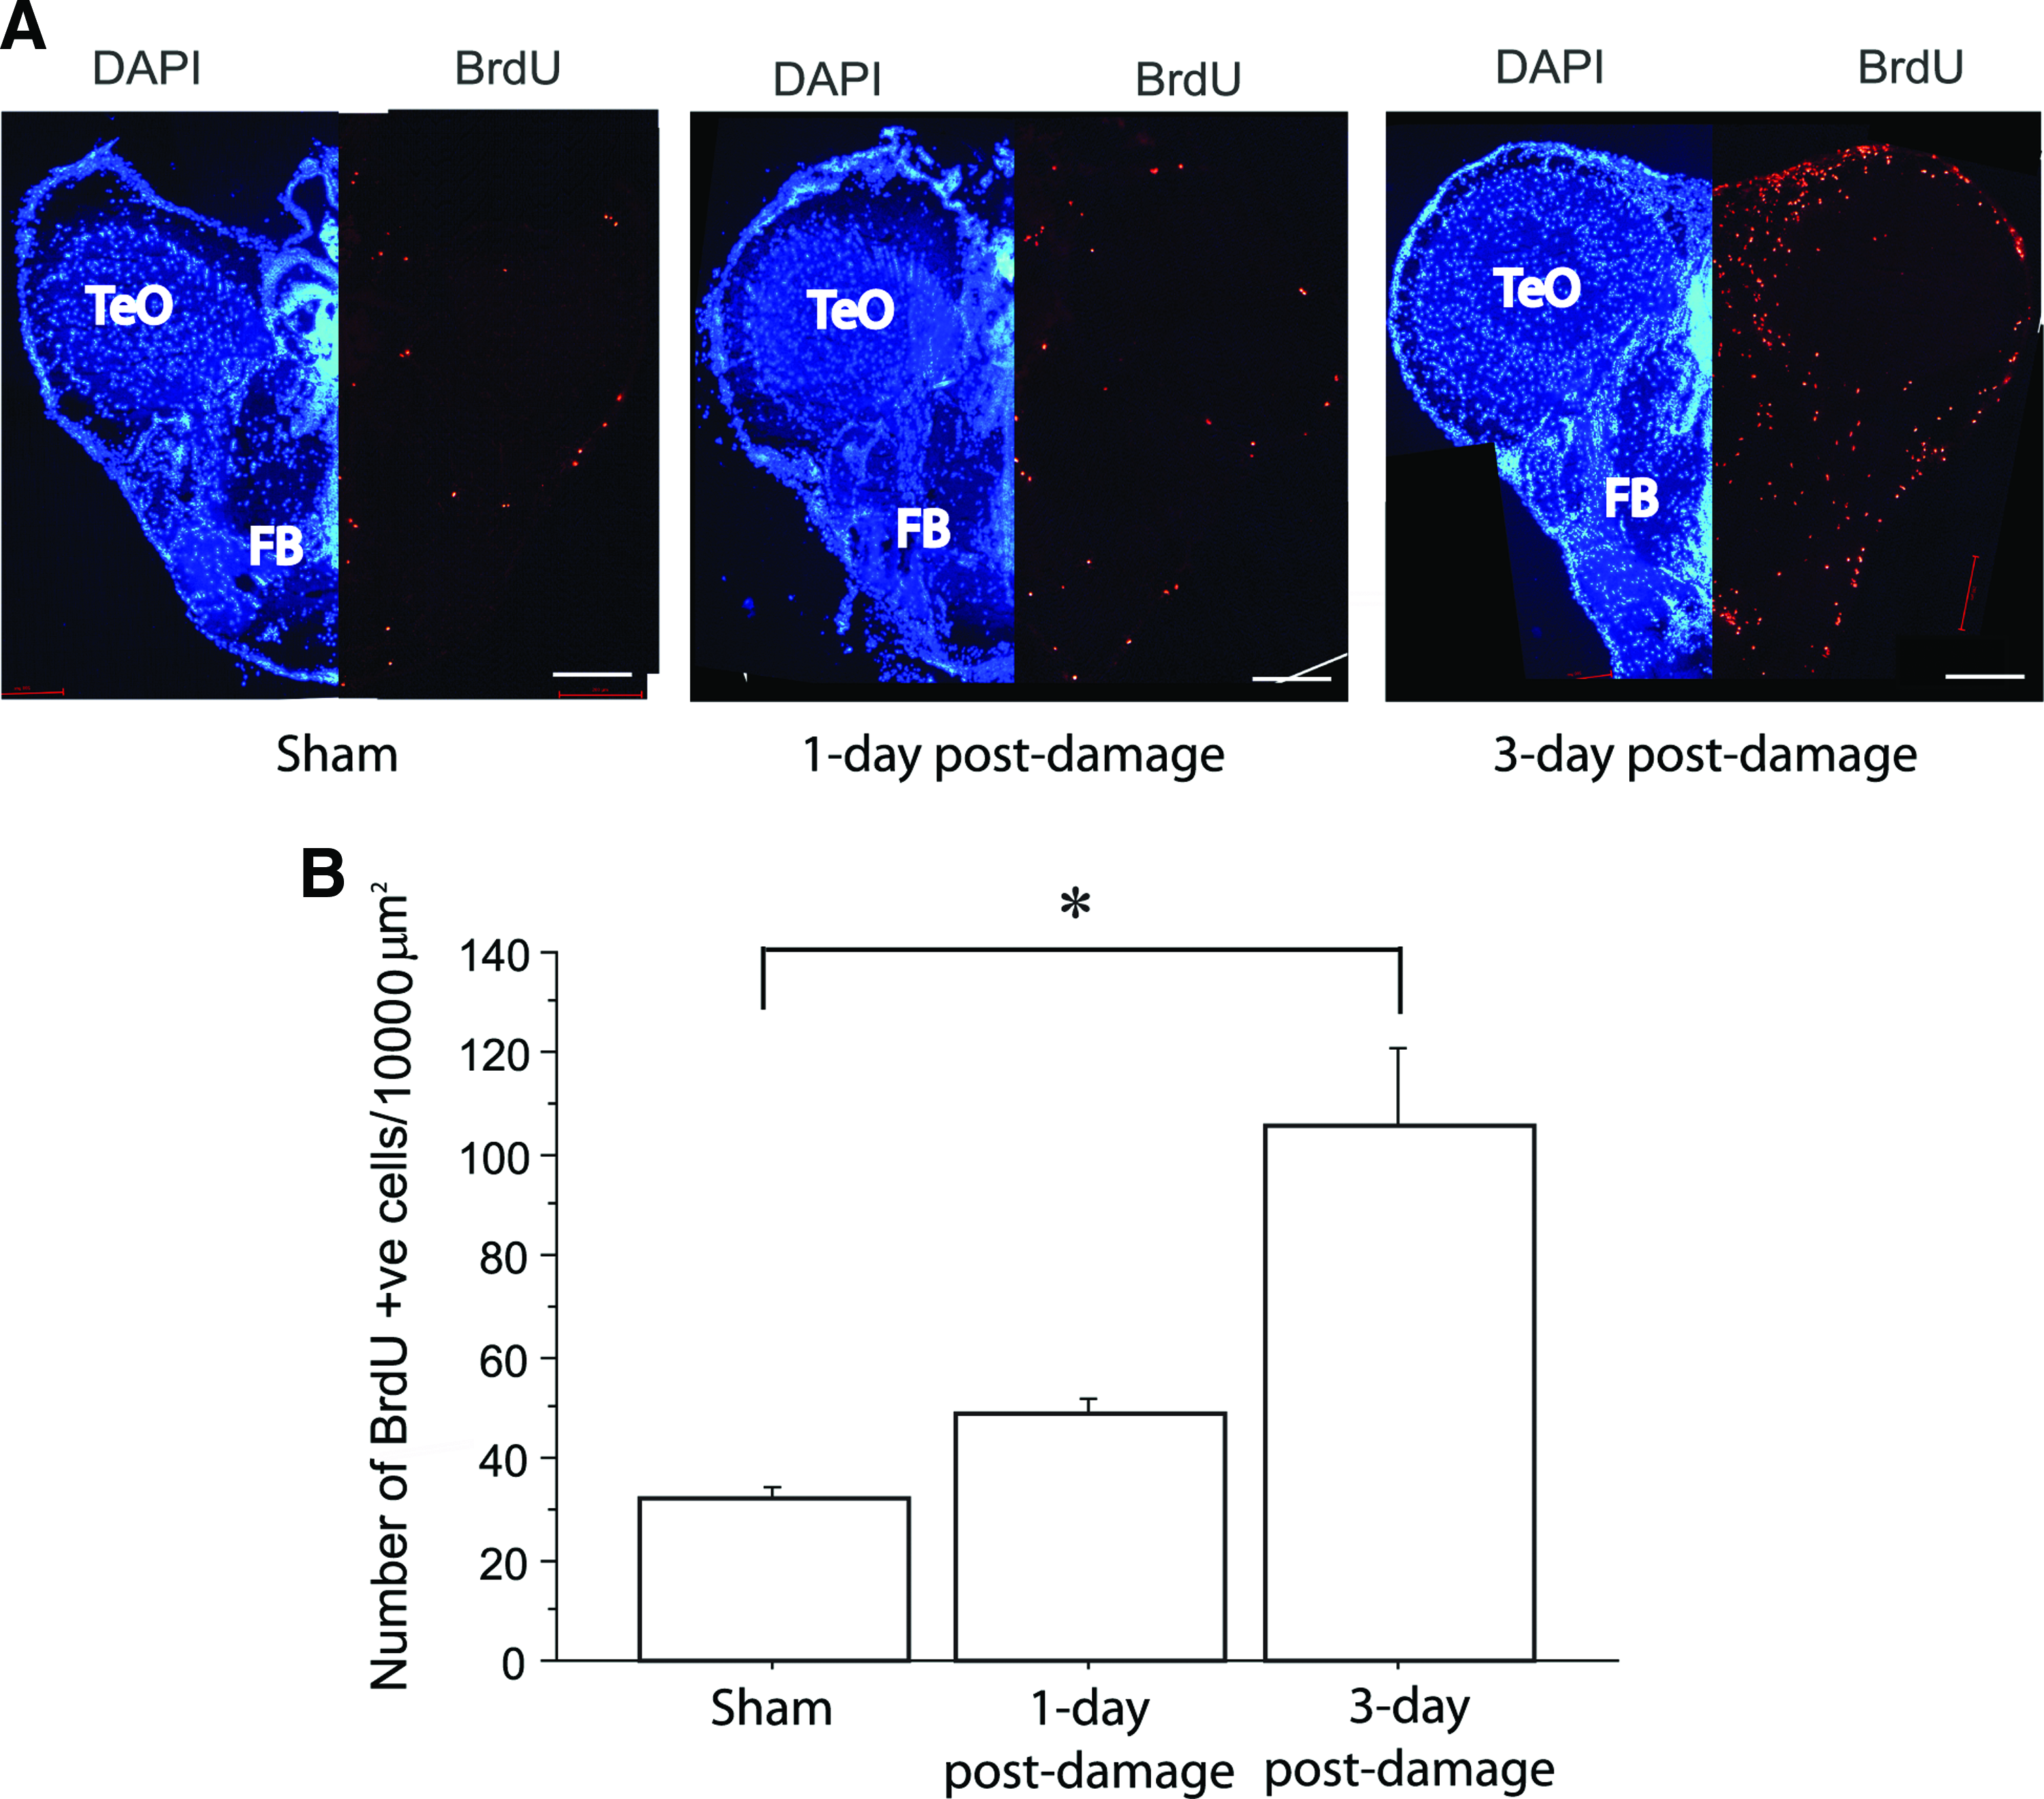
Coronal sections of the zebrafish brain with DAPI and BrdU stainings during habenula regeneration (1 and 3-day) after damage compared with the sham
Identification of differentially expressed proteins
To analyze protein expression profiles during neuroregeneration, cytoplasmic protein was extracted from the brains of sham fish and injured fish at 20 and 40 h post-damage and it was analyzed by using 2D-DIGE. Cy3 and Cy5 scans were aligned for multi-dye co-detection of protein spots within each gel, and to quantify the relative abundance of protein spots between two groups, compared with the internal standard (Fig. 5). Approximately 600 spots from each gel were detected by the software, of which ∼3% were differentially expressed (Supplementary Tables S2 and S3). An average of 19 protein spots (>1.5-fold change [increase/decrease] in staining density, p < 0.05) were differentially expressed between the sham-operated and injured brains (2 time points) (Fig. 5F). Protein spots that were clearly visible after Coomassie Brilliant Blue staining were selected to ensure a sufficient amount of proteins for further analyses and processed for MALDI ToF/ToF analysis to identify them. Only proteins with significant protein scores in a database analysis and a matched isoelectric focusing point were selected for further investigation. Overall, 17 proteins were significantly differentially expressed between sham fish, which is also the control, and injured fish at 20 and 40 h post-damage with >1.5-fold change in staining intensity (p < 0.05) (Table 2). At 20 h post-damage, seven proteins—including glyceraldehyde-3-phosphate dehydrogenase (G3P), follistatin-A, probable E3 ubiquitin-protein ligase makorin-1 (MKRN1), LIM homeobox protein (Lhx) 9, Metallothionein (MT)-1 and 2, and Wnt-2 protein—were significantly changed in injured fish compared with those in sham fish. Between 20 and 40 h post-damage, five proteins were significantly upregulated: actin type 1 and 2, ependymin, retinoic acid receptor gamma-A (RARGA), and Wnt inhibitory factor 1 (WIF1). Sprouty-related enabled/vasodilator-stimulated phosphoprotein homology-1 (EVH1) domain-containing 2 (Spred2) and Wnt-2 protein were downregulated compared with injured fish at 20 and 40 h post-damage. At 40 h post-damage, MKRN1, cysteine-rich motor neuron 1 protein (CRIM1), fibulin-1, and WIF1 were upregulated; whereas zinc finger protein draculin (DRL) and Lhx1 were downregulated, compared with that in sham fish.

Representative example of 2D-DIGE analytical gel (Gel 1): DIGE images of 10 μg of internal control (Cy2)
The protein score reflects the combined scores of all observed mass spectra that can be matched to amino acid sequences within that protein.
CNS, central nervous system; MW, molecular weight; SD, standard deviation.
Gene expression of selected genes of different time points
The gene expression data showed a significant increase in mt2 mRNA levels (approximately twofold, p < 0.05) at 20 h after the injury when compared with sham [ANOVA, F(3,18) = 3.187]. Spred2 gene expression was significantly decreased at every timeframe [ANOVA, F(3,18) = 8.490]: 0-h versus 20-h (12.5% decrease, p < 0.01); 10-h versus 40-h (73.5% decrement, p < 0.05); and 0-h versus 40-h (approximately twofold decrease, p < 0.01) after the habenula damage (Fig. 6).

Levels of
Discussion
Cell proliferation is stimulated by apoptotic cell clearance
In this study, we demonstrated regrowth of the habenula-like structure 40 days after the habenular region was damaged in the adult zebrafish. Furthermore, using a transgenic strain of zebrafish harboring a brn3a promoter-driven GFP transgene, the recovery of green fluorescence was observed 2 weeks post-damage. This indicates the recovery of the damaged habenula that expresses the transgene. Nevertheless, only a partial recovery of the fluorescence was observed, which may be due to a reduction in total cell numbers in the regenerated habenula. We found a similar observation in the regenerated habenula stained with DAPI at 40 days post-damage. Similarly, in A. leptorhynchus, there is a 40% reduction in the total number of cells in the regenerated spinal cord, even with successful structural and functional recovery. 26
Our morphological analyses revealed a significant increase in the generation of new cells on days 1–3 post-damage in the habenula and surrounding areas. This suggests that molecular events during early stages of tissue damage trigger the generation of large numbers of new cells for brain tissue repair and regeneration, as well as a gradual reduction in apoptosis. This is similar to observations made in other brain areas in various fish species. 27 This implies that apoptotic events play a major role in mediating the removal and elimination of damaged cells before their replacement with newly generated cells, as in other fish species. 28
In addition to these observations, this study showed an increase in the number of new cells generated not only near the damage site but also in the surrounding regions. In fish, a stimulant of cell proliferation is believed to diffuse into neighboring regions, inducing the generation of more new cells to compensate for those lost in the injured area.29,30 This suggests that neuronal damage could trigger molecular pathways for neuroregeneration in both damaged and non-damaged regions of the brain. Therefore, we decided to examine the differences in protein expression between sham-operated and injured brains, particularly before the first significant increase in the number of proliferating cells was evident at the damaged site between day 1 and 3 post-injury.
Differentially expressed proteins and their possible functions in brain regeneration
We investigated proteins potentially involved in early stages of neuroregeneration by using a proteomic approach. Using 2D-DIGE analysis, we identified the following twenty proteins as differentially expressed in the zebrafish brain during neuroregeneration. Among the 20 proteins, few of them have not been discussed with regard to their direct role in neurogenesis or neuroregeneration:
Draculin
Draculin is a zinc finger protein: a DNA-binding protein with a hairpin motif containing zinc finger domains. 31 In zebrafish, Draculin is expressed in the haematopoietic lineage during embryogenesis. 32 However, no report has shown a correlation between Draculin and neurogenesis. Nevertheless, the increase in Draculin in the brains of zebrafish at 40 h post-damage could reflect a role in morphogenesis and haematopoiesis during neuroregeneration, similar to that during neurulation in zebrafish. 33
LIM homeobox proteins 1 and 9
The LIM domain homeobox is a protein–protein interaction motif with implications for processes such as cell fate determination, neuronal pathfinding, and Actin organization in both teleosts and mammals.34–36 One member of the LIM homeobox protein family, Lhx1, is involved in the regulation of interneuron differentiation and progenitor cell proliferation and differentiation.35,37
Similar to Lhx1, Lhx9 is also involved in the regulation of cell differentiation in several neural cell types.38,39 In chickens (Gallus gallus), Lhx1 and Lhx9 are expressed in the diencephalon from early stages and may contribute to the regulation of regionalization of the diencephalon during chick development. 40 Interestingly, Lhx1 and Lhx9 are expressed in the same interneuronal population in the spinal dorsal horn and serve binary switches for each other in controlling the rostral versus caudal longitudinal turning of caudal commissural axons. 39 Therefore, differential expression patterns of Lhx1 and Lhx9 during neuroregeneration (Lhx9 increased at 20 h post-damage, and Lhx1 decreased at 40 h post-damage compared with that in sham fish) observed in this study reflect dramatic morphological changes during this period in the damaged zebrafish brain.
Wnt signal transduction pathway
Wnt is known for its roles in embryogenesis and oncogenesis. Wnt proteins are signaling molecules and activate pathways that are responsible for a variety of events in developmental processes, ranging from embryonic development to cell proliferation, differentiation, polarity, and apoptosis. 41 To date, 19 different Wnts have been identified in mammals, and 10 have been identified in zebrafish (according to the UniProt Database). 42
In this study, high Wnt2 expression was observed at 20 h post-damage but returned to the baseline level in injured fish at 40 h post-damage as compared with sham fish. Conversely, WIF1 expression was significantly high in injured fish at 40 h post-damage compared with that in sham fish and injured fish at 20 h post-damage. Wnt2 acts through the beta-catenin pathway and is expressed in many cell types, including dopaminergic, granulose, and endothelial cells.42–44 It plays a role in the regulation of apoptosis and increases DNA synthesis. 44 Wnt2 null mice display decreased neurogenesis, in terms of the number of proliferating cells and progenitor cells generated. 42 Thus, changes in the expression of Wnt2 and WIF1 demonstrated in this study indicate the involvement of the Wnt signaling pathway in the regulation of cell proliferation, differentiation, and apoptosis during neuroregeneration in the zebrafish CNS after injury.
Metallothionein type 1 and 2
MT1 and 2 are two ubiquitously expressed isoforms of a small, cysteine-rich protein that binds to heavy metals such as zinc, copper, and iron in the CNS and peripheral nervous system of mammals.45,46 In the mammalian CNS, MT is mainly present in astrocytes, indicating a role in the regulation of astrogliosis. 47 Its isoforms play neuroprotective roles and suppress or minimize the damage caused by oxidative stress and degeneration.45,48,49 Both MT1 and 2 knockout mice exhibit chronic inflammation, impaired brain parenchyma recovery, a significant increase in oxidative stress, neurodegeneration, and apoptosis after brain injury. 45
In fish, MT expression is commonly used to monitor and assess stress caused by metal contaminants.46,49,50 MT2 has recently been shown to be expressed specifically in neurons, and its role in neurogenesis and neuroprotection has been suggested. 51 It has been proposed that elements—especially metals, such as reduced iron from Ferritin—released from apoptotic cells can induce the expression of MT, which, subsequently, exerts a neuroprotective effect on the CNS. Therefore, a further investigation of the role of MT in fish as an anti-oxidative agent for neuroprotection is warranted.
Sprouty-related EVH1 domain-containing 2
In mammals, there are three types of Spred (Spred1, 2, and 3), all of which are expressed in the brain and spinal cord. 52 In the zebrafish, two Spred homologs, Spred1 and 2, have been identified, although zebrafish Spred1 shares less similarity with human SPRED (55% protein homology). The amino-acid sequences of protein domains of Spred2—the EVH1 and cysteine-rich sprouty-related (SPR) domains—show high homology with those of Xenopus (EVH1: 80%, SPR: 70%) and humans (EVH1: 84%, SPR: 79%) according to UniProt-Blast, suggesting conservation of this receptor tyrosine kinase (RTK) pathway among all vertebrates.
Spred genes are members of the sprouty-like gene family that downregulate the RTK pathway by controlling Ras and Raf.53–55 The RTK pathway regulates cell proliferation, differentiation, and survival. 54 In sham fish, the highly expressed Spred2 inhibits the activation of extracellular signal-regulated kinase (ERK) in the RTK pathway. Protein profiling showed a significant reduction in Spred2 expression at 20 h post-damage. A reduction in Spred2 expression allows more ERK to be activated, thus inducing more cell proliferation, differentiation, and migration.52,56,57
Proteins identified in this study are cytoskeletal proteins, developmental proteins, transcriptional regulators, metal ion-binding proteins, and signal transduction regulators, similar to protein profiles found in other species during neuroregeneration. A recent study in A. leptorhynchus 11 applied proteome analysis at 30 min post-lesion and identified proteins involved in energy metabolism, blood clotting, electron transfer in oxidative reactions, cytoskeletal degradation, apoptosis, synaptic plasticity, axonal regeneration, and mitotic activity promotion, 11 whereas proteome analysis at 3 days post-lesion in the same species identified proteins involved in cell proliferation, cell motility, neuroprotection, and energy metabolism. 10 In comparison, our study identified more proteins responsible for cell proliferation and neuroprotection between day 1 and 3 post-injury.
Gene expression study of mt2 and spred2
Among the 20 proteins identified, MT2 and sprout-related, EVH1 domain-containing protein 2 (Spred2) were further verified via gene expression quantification due to their potential involvement in neurogenesis stimulation after a limited functional study in the CNS.46,52 Gene expression quantification revealed that the expression patterns of mt2 and spred2 are in agreement with those obtained by proteomic analysis.
In the present study, MT2 protein level as well as its mRNA level was significantly increased in the brain of zebrafish during neuroregeneration. In mammals, extensive evidence demonstrates the roles of MT as an oxidant damage protector and astrogliosis regulator.47,58 Zebrafish MT protein shows 62% of homology with MT2 of rat, suggesting that fish MT2 could also be functionally conserved. Although the role of Spred-2 in the fish brain has not been verified, the significant decrease of Spred2 protein as well as its mRNA observed in the present study suggests that it plays a role as the regulator for cell proliferation, differentiation, and migration in cancer cells.
Conclusion
MTs have been well documented to have a neuroprotective role in the mammalian CNS. Spred2 is crucial for cell proliferation and differentiation in cancer cell. However, there is little or no research suggesting a role for these two proteins in neuroregeneration, in non-mammalian vertebrates, in particular in the teleost. Hence, it is imperative to study these proteins and, thus, assess their potential involvement in mediating CNS regeneration in both teleost and mammals.
Footnotes
Acknowledgments
The authors are grateful to Dr. David Steer and Ms. Shane Reeve for their help in 2D-DIGE and MS experiments conducted at the Monash Biomedical Proteomics Facility, Monash University Clayton Campus. We thank Dr. Hitoshi Okamoto (RIKEN BSI, National Bioresource Project of Japan) for providing the Tg (brn3a-hsp70:GFP)rw0110b zebrafish line. We would also like to thank the Brain Research Institute, Monash University Malaysia, for bearing the expense for travel to the Clayton Campus to carry out the proteomics study. This work was supported by grants from Monash University Malaysia, M-2-2-06 and M-2-07 (to S.O.), MM-2-5-06 and MM-7-07 (to I.S.P); Malaysian Ministry of Science, Technology & Innovation (MOSTI), 02-02-10-SF0044 and 02-02-10-SF0161 (to I.S.P); and the National Health & Medical Research Council of Australia (to A.I.S.).
Authors’ Contributions
F.T.L., S.O., and I.S.P. designed the experiments; F.T.L. performed zebrafish lesion studies and morphological analysis; F.T.L. and A.I.S. performed proteomics analysis; F.T.L. and S.O. wrote the article; and I.S.P. edited the article.
Disclosure Statement
No competing financial interests exist.
References
Supplementary Material
Please find the following supplemental material available below.
For Open Access articles published under a Creative Commons License, all supplemental material carries the same license as the article it is associated with.
For non-Open Access articles published, all supplemental material carries a non-exclusive license, and permission requests for re-use of supplemental material or any part of supplemental material shall be sent directly to the copyright owner as specified in the copyright notice associated with the article.