
Abstract
Abstract
In this study, we show that an adaptation of the spinning test can be used as a model to study the exercise–exhaustion–recovery paradigm in fish. This forced swimming test promotes a wide range of changes in the hypothalamus–pituitary–interrenal axis functioning, intermediary metabolism, as well in fish behavior at both exercise and recovery periods. Our results pointed that this adapted spinning test can be considered a valuable tool for evaluating drugs and contaminant effects on exercised fish. This can be a suitable protocol both to environmental—to evaluate contaminants that act in fish energy mobilization and recovery after stressors—and translational perspectives—effects of drugs on exercised or stressed humans.
Introduction
S
Swimming activity could represent an exercise of mild, moderate, or high intensity, depending on the stimulus strength. Swimming exercise is primarily maintained by aerobic metabolism. 4 Metabolic parameters, such as carbohydrate reserves (glycogen, glucose, and lactate), are frequently used as physiological stress indicators in fish and could be altered on blood and tissues after exercise. 5 In some situations (e.g., predator–prey interactions), burst-type exercise is supported by anaerobic glycolysis.4,6 According to Wood, 7 the aptitude of decomposing the accumulation of lactate in muscles is classified as exercise capacity.
Exercise can cause osmotic, fluid, and electrolyte disturbance, 8 consequently leading to stress and increase of corticosteroids that last until 6 h after exercise, 9 aiming to mobilize energy reserves 10 to cope with these changes. In fish, increased plasma cortisol in conditions of exhaustive exercise seems to delay the restoration of metabolic status to pre-exercise levels inhibiting the glycogenesis.11,12 In addition, exhaustive exercise can induce behavioral alterations related to locomotor adjustments, which directly influence on the ability to cope with environmental threats. 13
The forced swimming task (called spinning test) was previously proposed by Blazina et al. 14 who exposed zebrafish to three rotational velocities, evaluating locomotor parameters (total distance traveled, time in the upper half, and absolute turn angle) and a light–dark task comparing with effects of psychotropic substances. However, neuroendocrine and metabolic parameters were not assessed, and we hypothesize that such a condition influences energy metabolism and the normal functioning of the hypothalamus–pituitary–interrenal (HPI) axis. In this study, we evaluate the neuroendocrine, metabolic, and behavioral alterations in zebrafish during the exercise and restoration periods, using an adaptation of the spinning test previously reported.
Methods
Ethical note
This experimental setup was approved by the Ethics Commission for Animal Use of the Universidade de Passo Fundo, Brazil (Protocol #29/2014), and followed the guidelines of the Conselho Nacional de Controle de Experimentação Animal (CONCEA).
Animals
A stock population of 432 male and female adult zebrafish (Danio rerio), wild-type short-fin strain, weighing 0.5 ± 0.2 g was housed (one fish per liter) in 12-L tanks equipped with biological filters, under constant aeration and a natural (14-h light–10 h dark) photoperiod (lights on at 20:00 pm). Water temperature was maintained at 27 ± 1°C, with pH = 7.3 ± 0.1. Fish were fed twice a day, with commercial flake fish food (Alcon® Basic, MEP 200 Complex, Brazil).
Experimental design
Our strategy was to submit adult zebrafish to an adapted spinning test, using three rotational velocities in three different periods (Fig. 1). Considering the recipient test diameter, we used three different speeds: 410 rpm corresponding to 0.283 m/s, 480 rpm corresponding to 0.333 m/s, and 570 rpm corresponding to 0.383 m/s. The recipient water volume was 1.2 L, and all water quality parameters were similar to maintenance tanks, within the desired range to zebrafish.
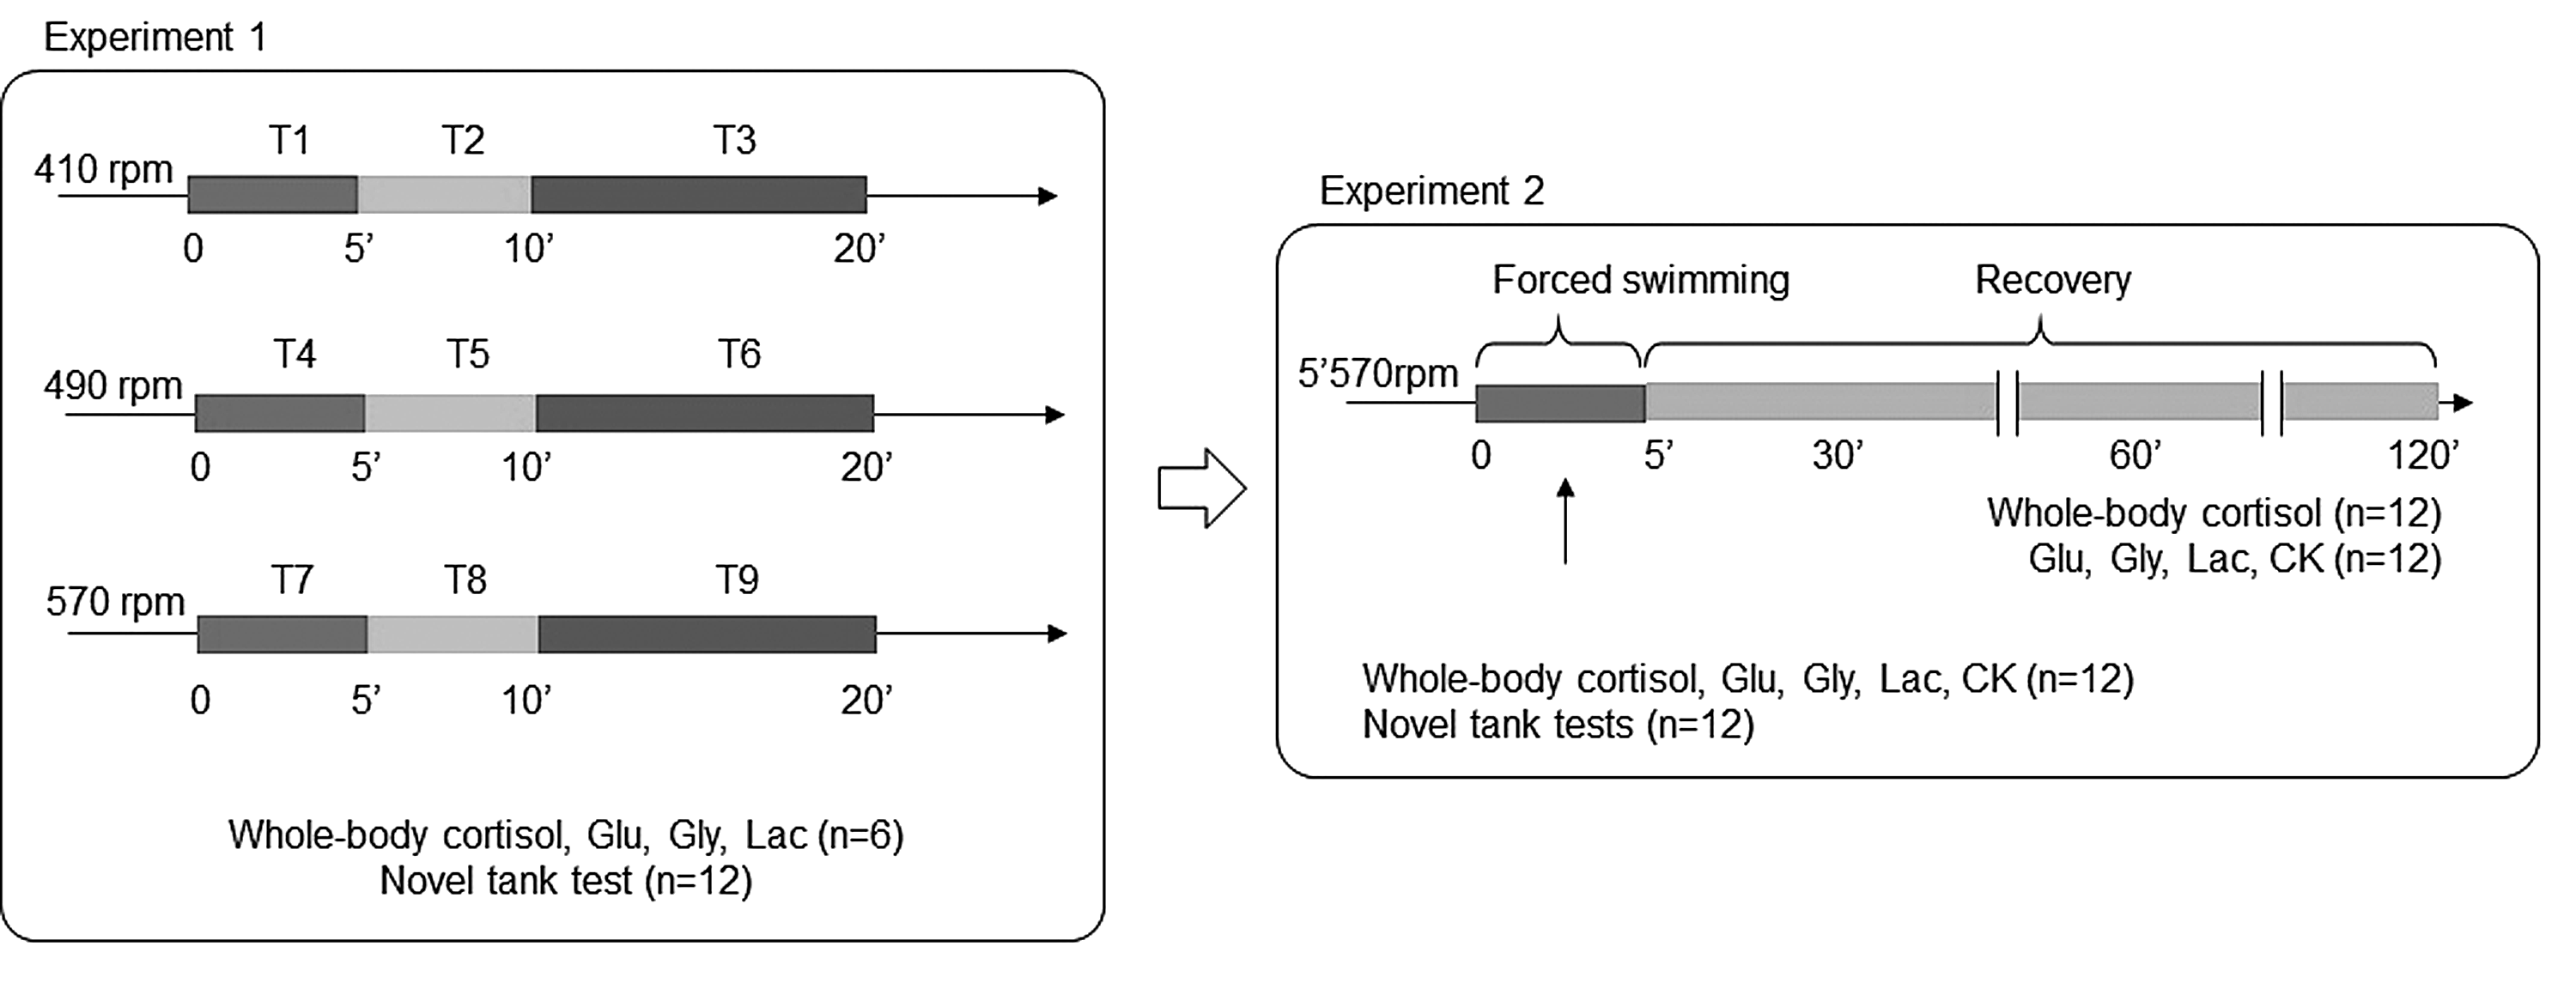
Schematic representation of the experimental design and strategy. To expose the animals to defined velocities, a beaker containing a stir bar was set at the top of a magnetic stirrer settled at different levels, corresponding to desired velocities.
Since the fish position in relation to the center of the recipient may interfere in the force that fish needs to maintain his position, we have filmed the assays to confirm that all fish maintained always at the edge of recipient and occasionally cross the center. The video camera (Logitech HD Webcam C525 camera, Romanel-surMorges, Switzerland) was positioned directly above the recipient. Thus, we believed that this variation source was eliminated between treatments.
In the first study, we evaluated the cortisol profile, metabolic and behavioral parameters during the forced exercise period, to determine which velocity is able to cause an activation of HPI axis and consistent metabolic changes. After, in the study 2, taking into consideration the results of the study 1, we evaluated the metabolic, endocrine, and behavioral changes in the velocity/time that showed major changes. We also assessed the recovery period 30, 60, and 120 min after the forced swimming test. The protocol is schematized in Figure 1.
Experimental procedures
Parameters evaluated
Whole-body cortisol
For the whole-body cortisol quantification, we used the method described by Oliveira et al. 15 After capture, fish were immediately frozen in liquid nitrogen for 10–30 s and maintained at −20°C until cortisol extraction. We measured the cortisol levels in duplicate samples using enzyme-linked immune assay kit (EIAgen CORTISOL kit, BioChem ImmunoSystems). The kit validation is fully described by Sink et al. 16 Briefly, the specificity of the test was evaluated by comparing the parallelism between the standard curve and serial dilutions of the tissue extracts in phosphate buffered saline.
The standard curve constructed with the human standards ran in parallel to that obtained using serial dilutions of zebrafish tissue extracts. In the linear regression test, a high positive correlation was found between the curves. The intra-assay coefficient of variation was 3.33%–3.65%. Measurement accuracy was evaluated by calculating the levels recovered from samples spiked with known amounts of cortisol (50, 25, and 12.5 ng/mL). The mean detection of spiked samples was 94.3%. All cortisol values were adjusted for recovery using the following equation: cortisol value = measured value × 1.0604.
Metabolism
In the first study, we evaluated whole-body glucose, glycogen, and lactate. In the main study, we evaluated these parameters and the enzyme activity of creatine kinase (CK). The whole-body glucose concentration was determined by glucose oxidase kit (Labtest, MG, Brazil). Glycogen content was determined by Van Handel 17 method while the determination of lactate concentration followed the method previously reported (Kit Vis Interteck/Katal). The CK activity was determined using the UV Interteck/Katal Kit (SP, Brazil).
Behavioral activity
The behavior of zebrafish was evaluated using the novel tank test (NTT).18,19 Briefly, fish were transferred individually to a glass transparent test tank (24 × 8 × 20 cm; width × depth × height) and filmed for 6 min. The test tank was divided into three virtual zones (upper, middle, and bottom zones). The videos were then analyzed using ANY-maze® software (Stoelting CO), and the following behaviors were scored: total distance traveled (m), number of crossings between the tank zones, and absolute turn angle. The following were also scored—relative time at upper zone, entries in upper zone, and latency to first entry in upper zone.
Statistics
In the first study, whole-body cortisol levels were compared by the Kruskal–Wallis test followed by Dunn's multiple comparisons test, while metabolic and behavioral parameters were compared by ANOVA (two and one way, respectively) followed by Tukey's test. In the second study, whole-body cortisol, metabolism, and behavioral data were compared by the Kruskal–Wallis test followed by Dunn's multiple comparisons test. Data normality was assessed by the Bartlett's test for significant effects. In all experiments, p was set at <0.05.
Results
Study 1
Whole-body cortisol
The forced swim induced a significant increase in cortisol levels typically related to an acute stress response. All groups, except the times 5 and 20 min at the velocity of 410 rpm, presented increased cortisol levels (Fig. 2).
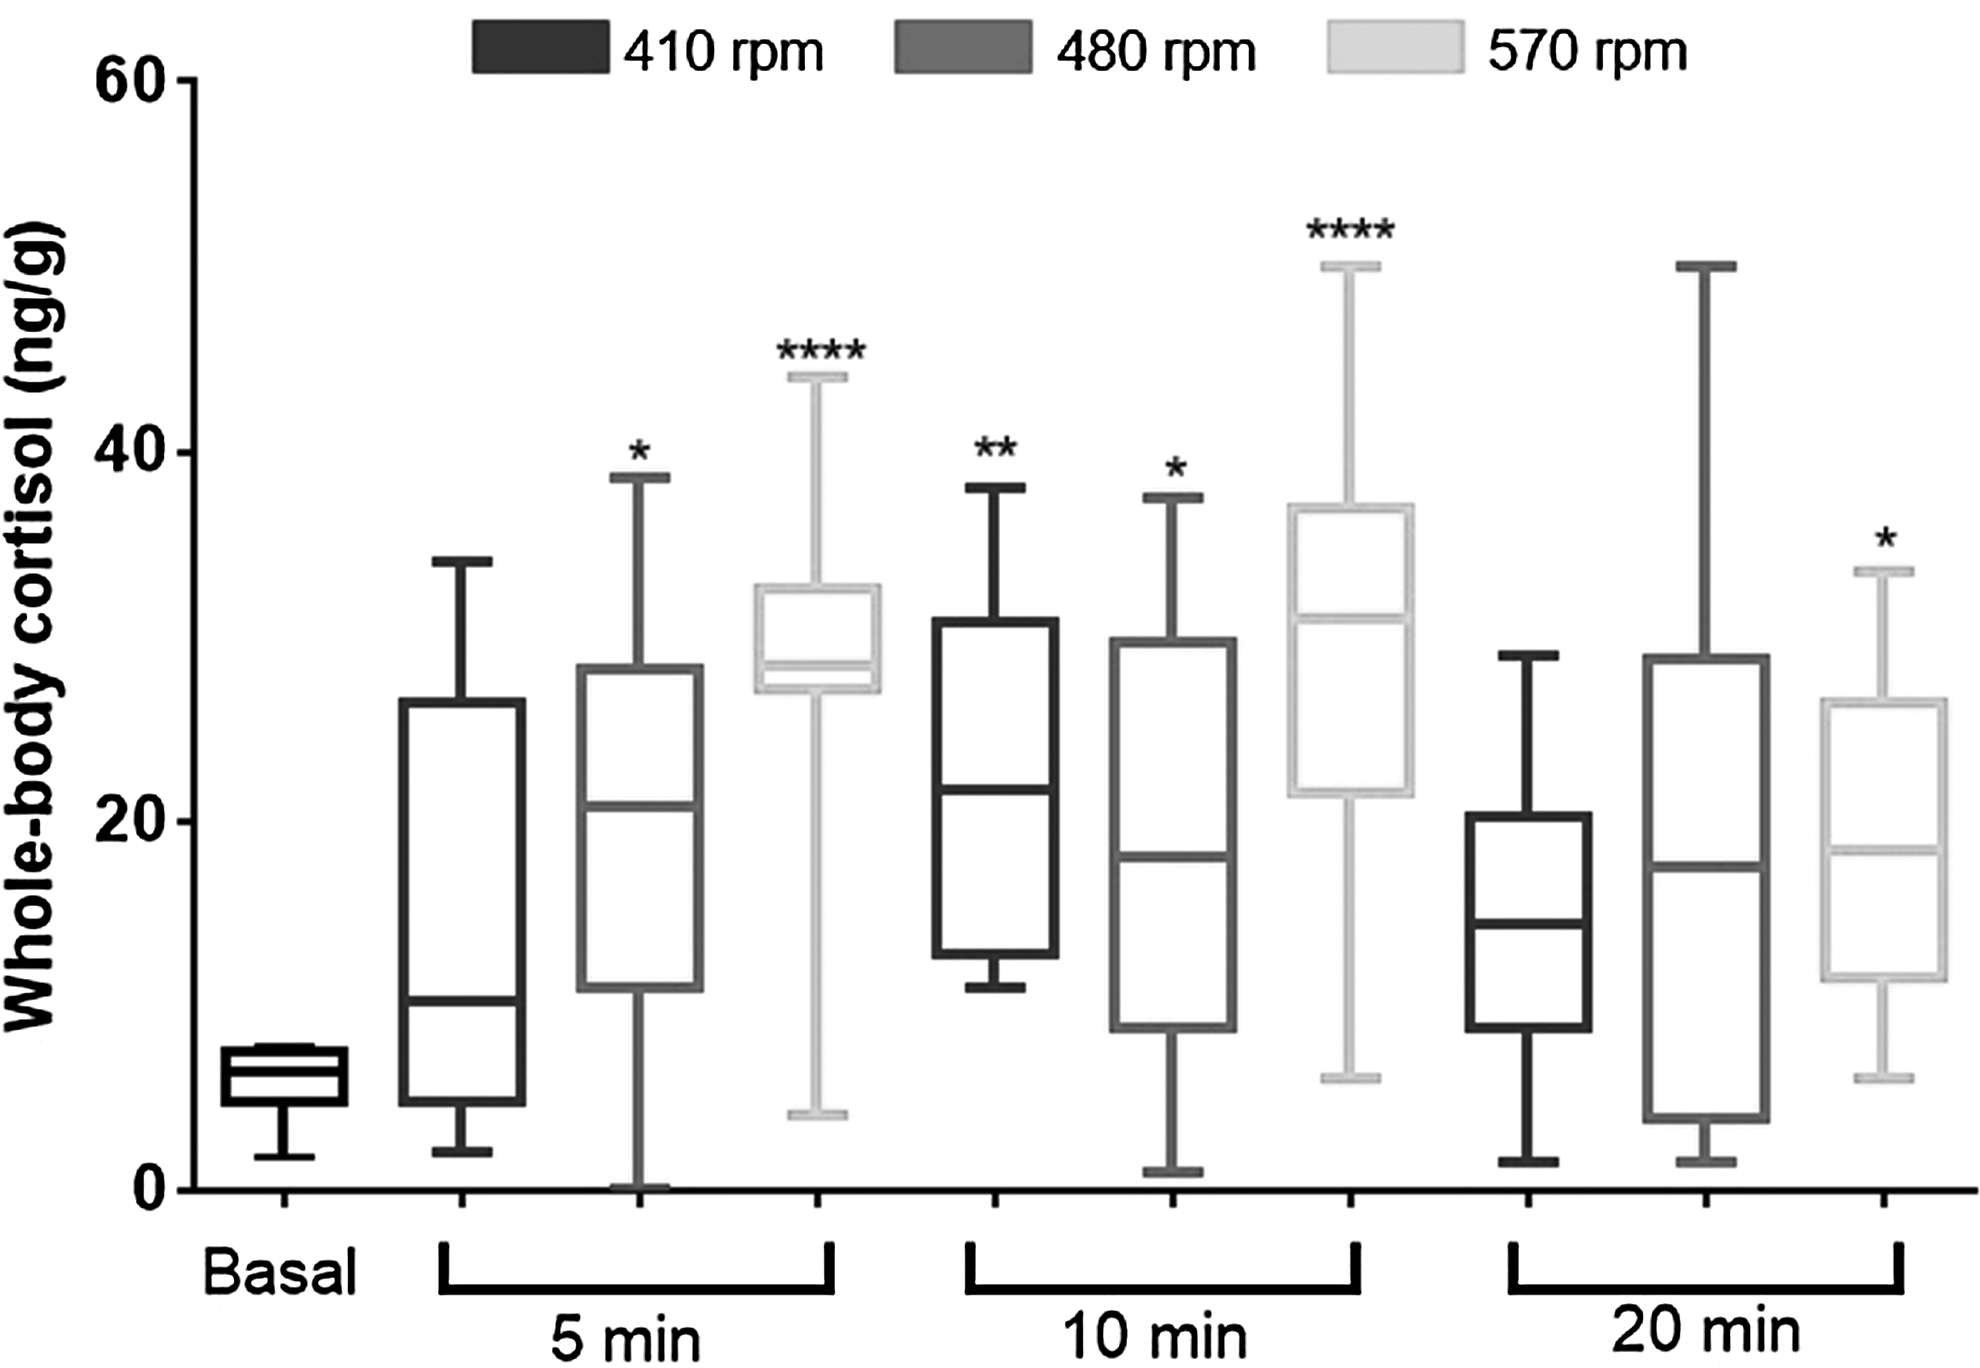
Whole-body cortisol concentrations in fish exposed to three rotational velocities during three periods. Data are expressed as mean ± standard error of the mean of 12 fish and compared by the Kruskal–Wallis test followed by Dunn's multiple comparisons test. p Values in the figure (*p < 0.05; **p < 0.01; and ****p < 0.0001).
Metabolic parameters
Whole-body glucose
There was a significant difference between the control group and fish exposed to 410 rpm for 5 and 10 min, with this group presenting higher whole-body glucose level (p < 0.05). Fish exposed to 570 rpm for 5 min presented similar levels of glucose when compared to control animals. After 10 min, fish exposed to both 480 and 570 rpm presented decreased glucose levels contrasting with fish exposed to 410 rpm (Fig. 3A).
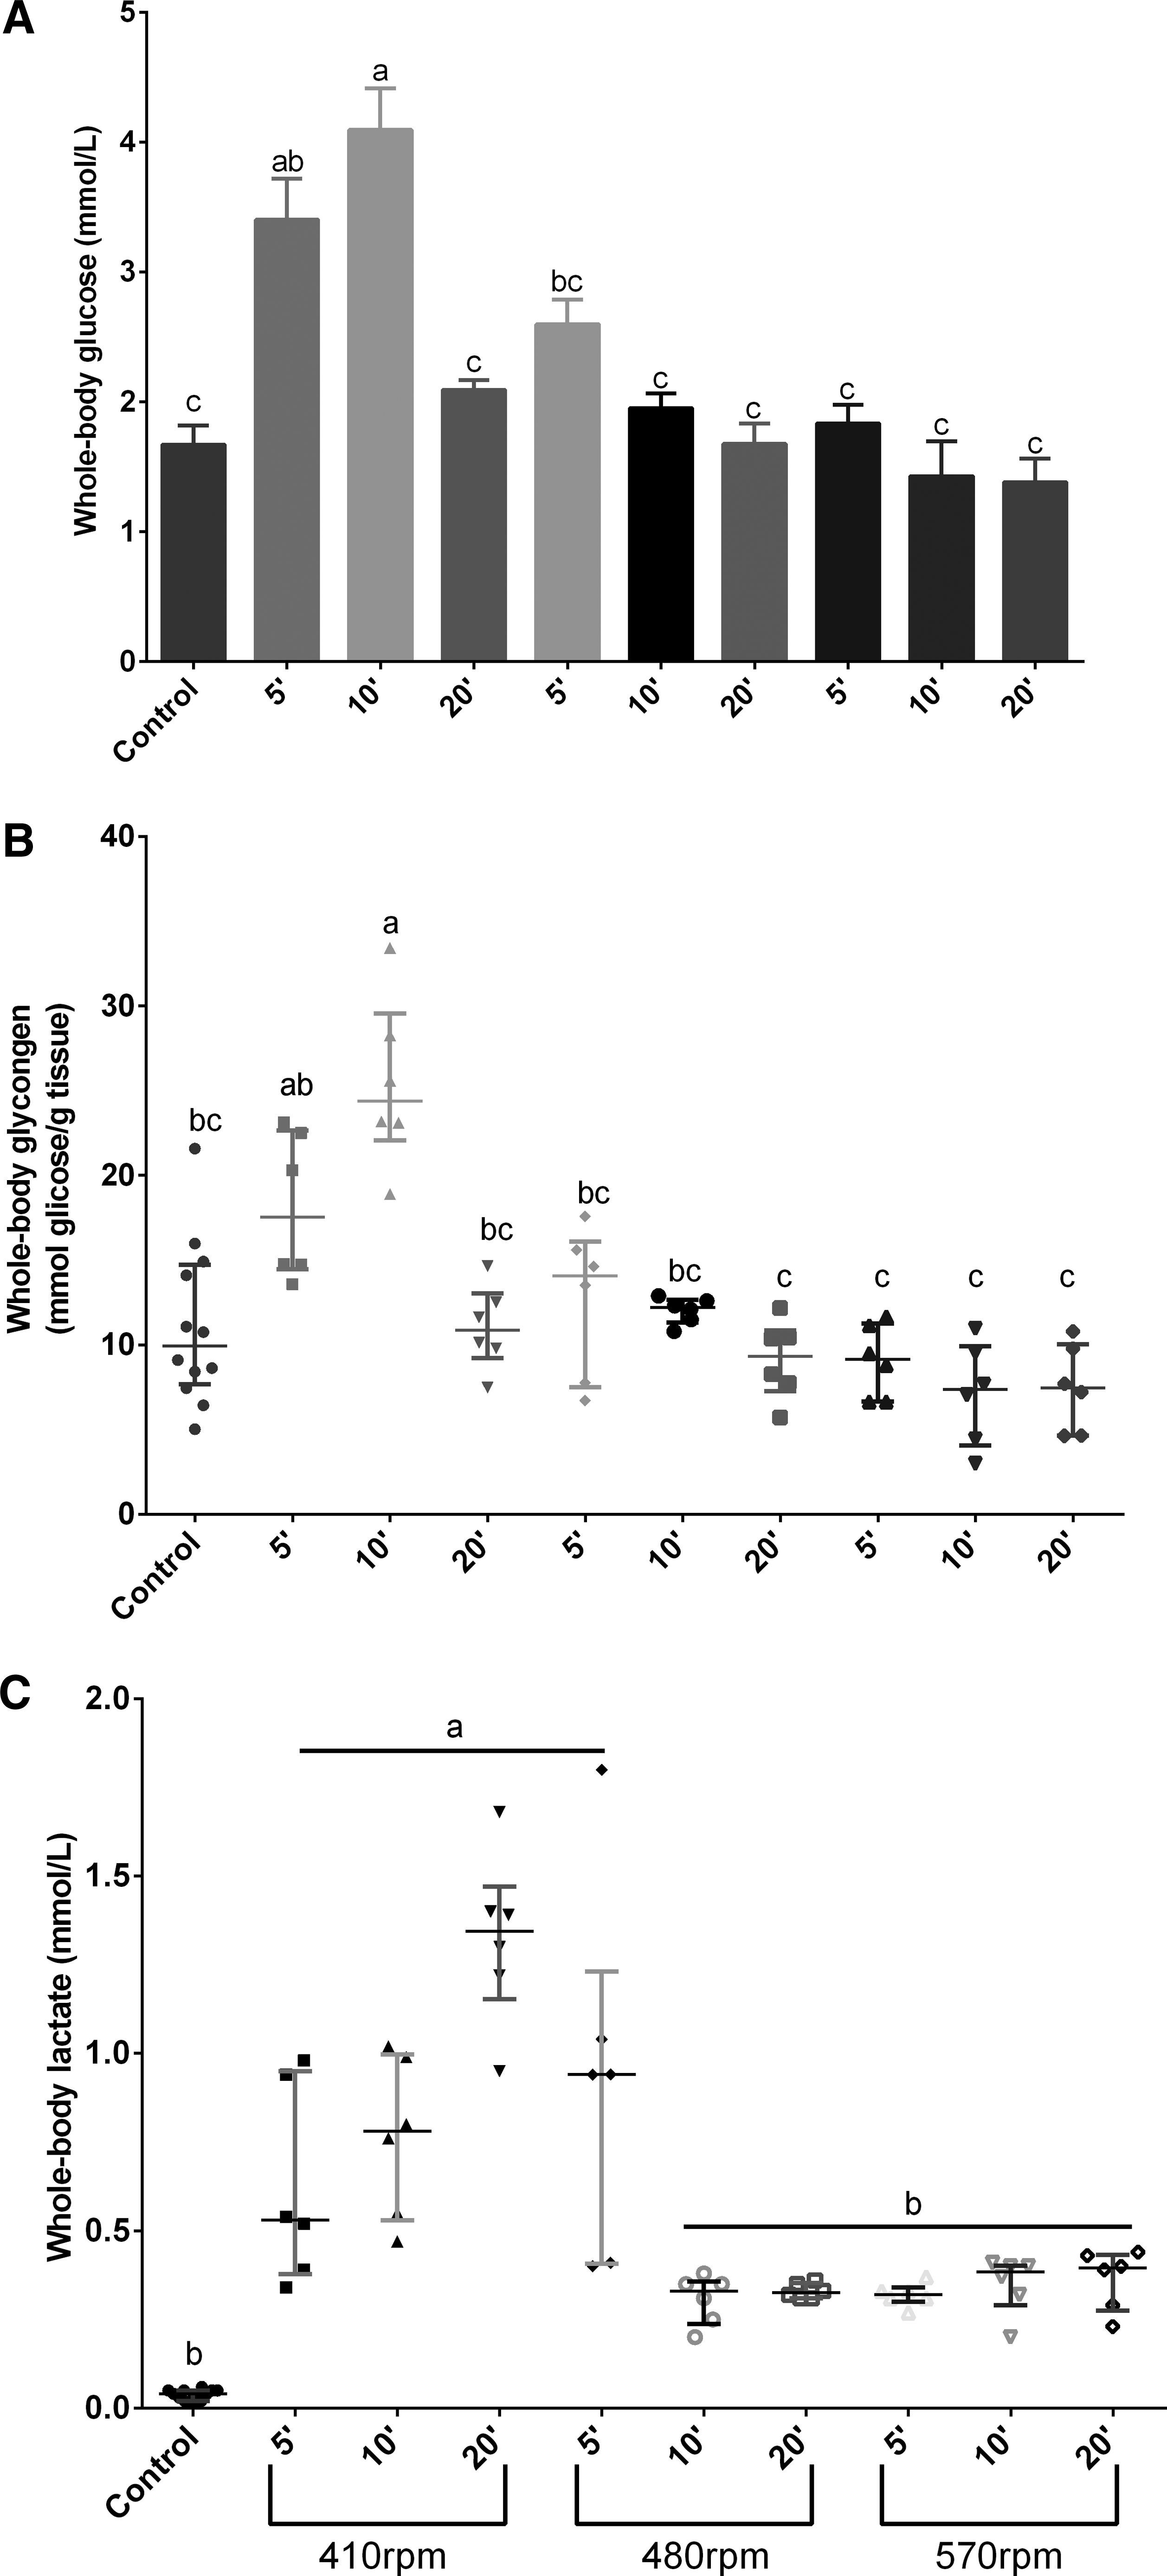
Metabolic changes in zebrafish exposed to a spinning test.
Whole-body glycogen
Fish exposed to 570 rpm for 5 and 10 min presented decreased glycogen levels (p < 0.05) when compared to the control group. Animals subjected to 410 and 480 rpm (Fig. 3B).
Whole-body lactate
Fish exposed to 570 rpm for 10 and 20 min presented decreased levels of lactate, similar to control. In the 5-min group, fish exposed to 480 presented increased lactate levels contrasting with ones exposed to 410 and 480 rpm (Fig. 3C).
Behavioral parameters
NTT
All treatments decreased the distance traveled (Fig. 4A). The major change occurred at 5 min at lower velocity (p < 0.0001). The relative time spent in the upper zone increased after 20 min in 410 and 570 rpm (Fig. 4C). Regarding the number of entries in the upper zone, animals exposed to 570 rpm for 5 min increased the frequency (p < 0.05) (Fig. 4D). The frequency of line crossings and the latency to first entry in the upper zone (Fig. 4B, E, respectively) did not alter after exposure to the different rotational velocities and periods.
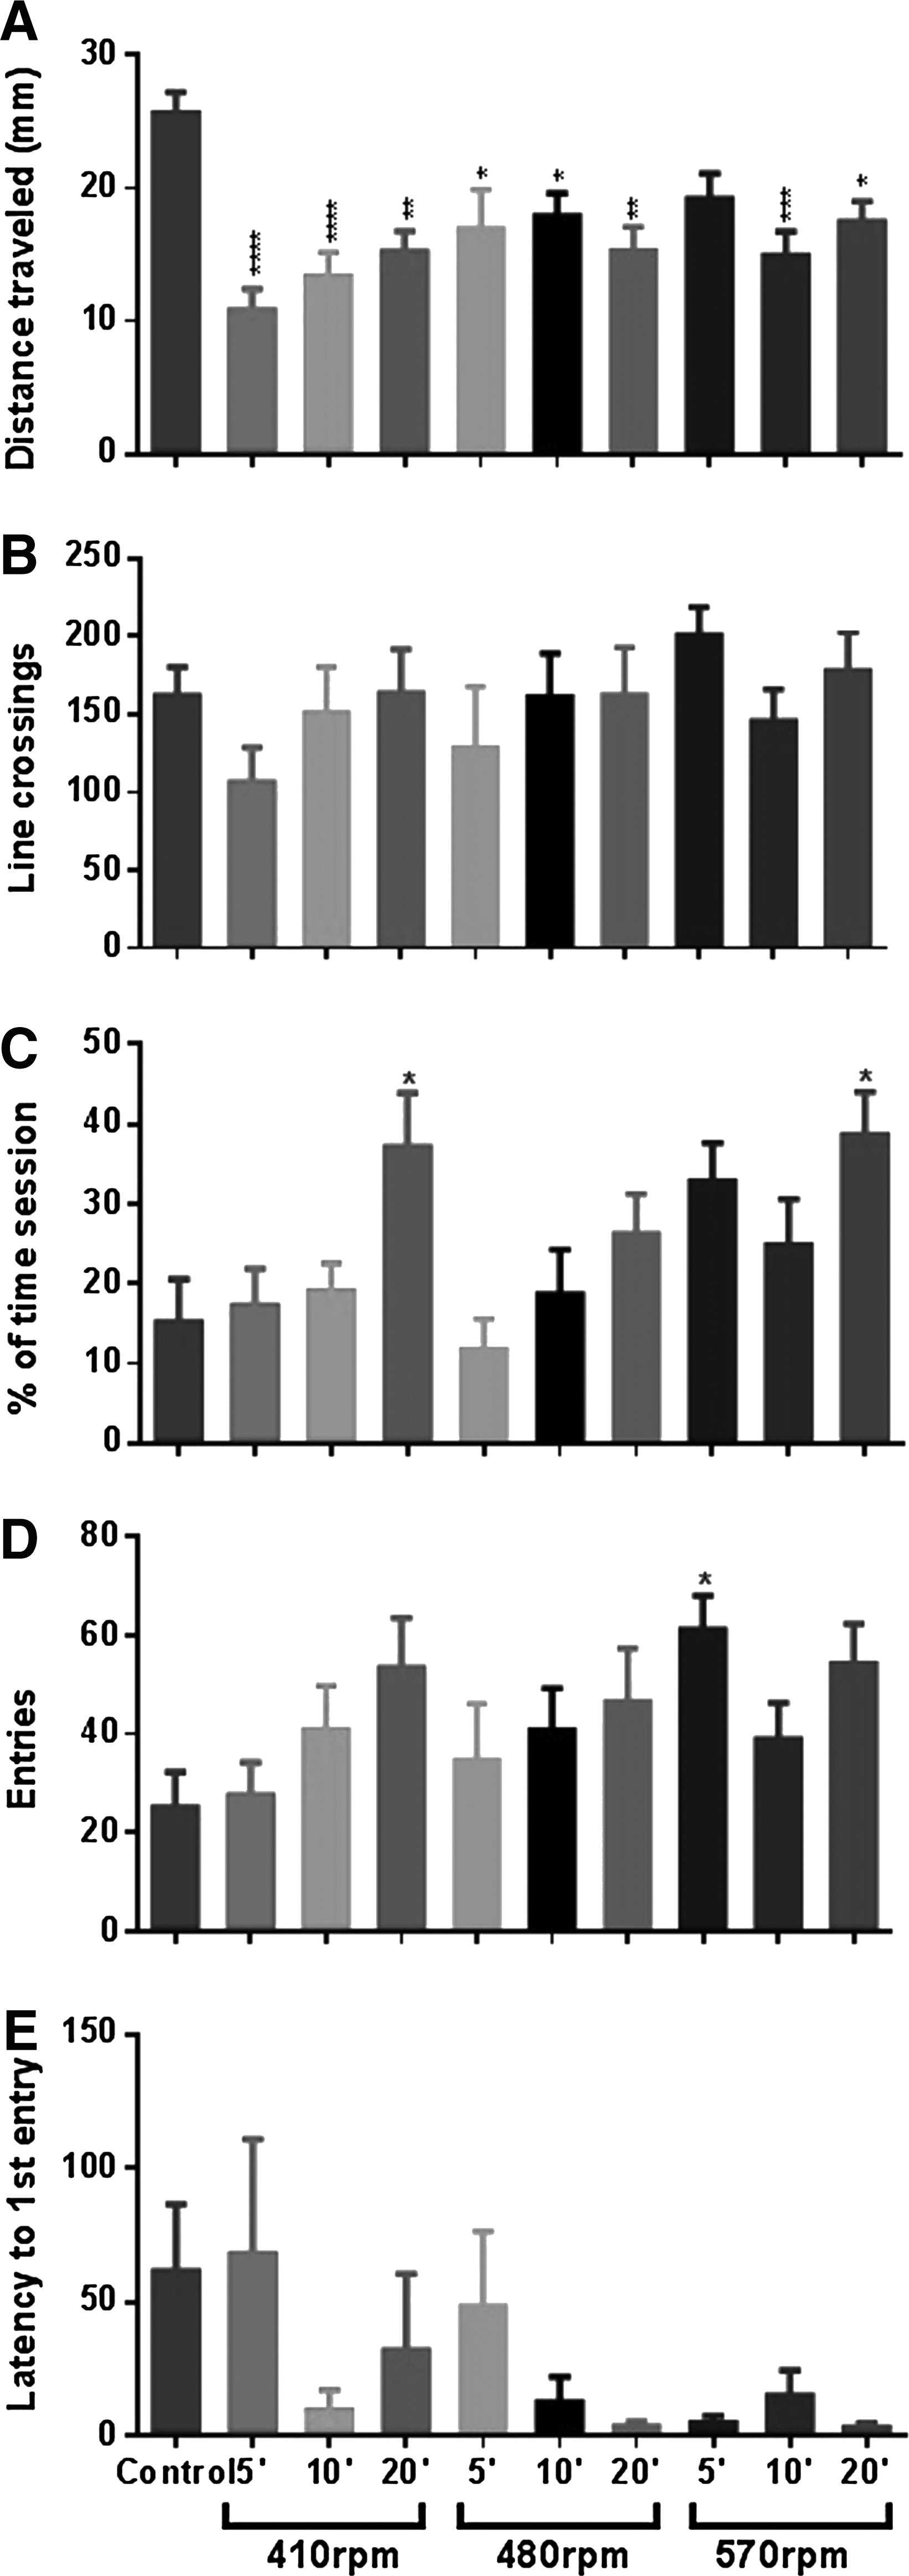
Locomotor parameters in zebrafish exposed to a spinning test.
Study 2
Whole-body cortisol
Fish immediately after the spinning test and after 30 and 60 min of recovery presented increased cortisol levels than control fish. After 120 min, cortisol levels are statistically indistinguishable than basal level. Overall, the decrease in whole-body cortisol levels during recovery period was apparently time dependent (Fig. 5).
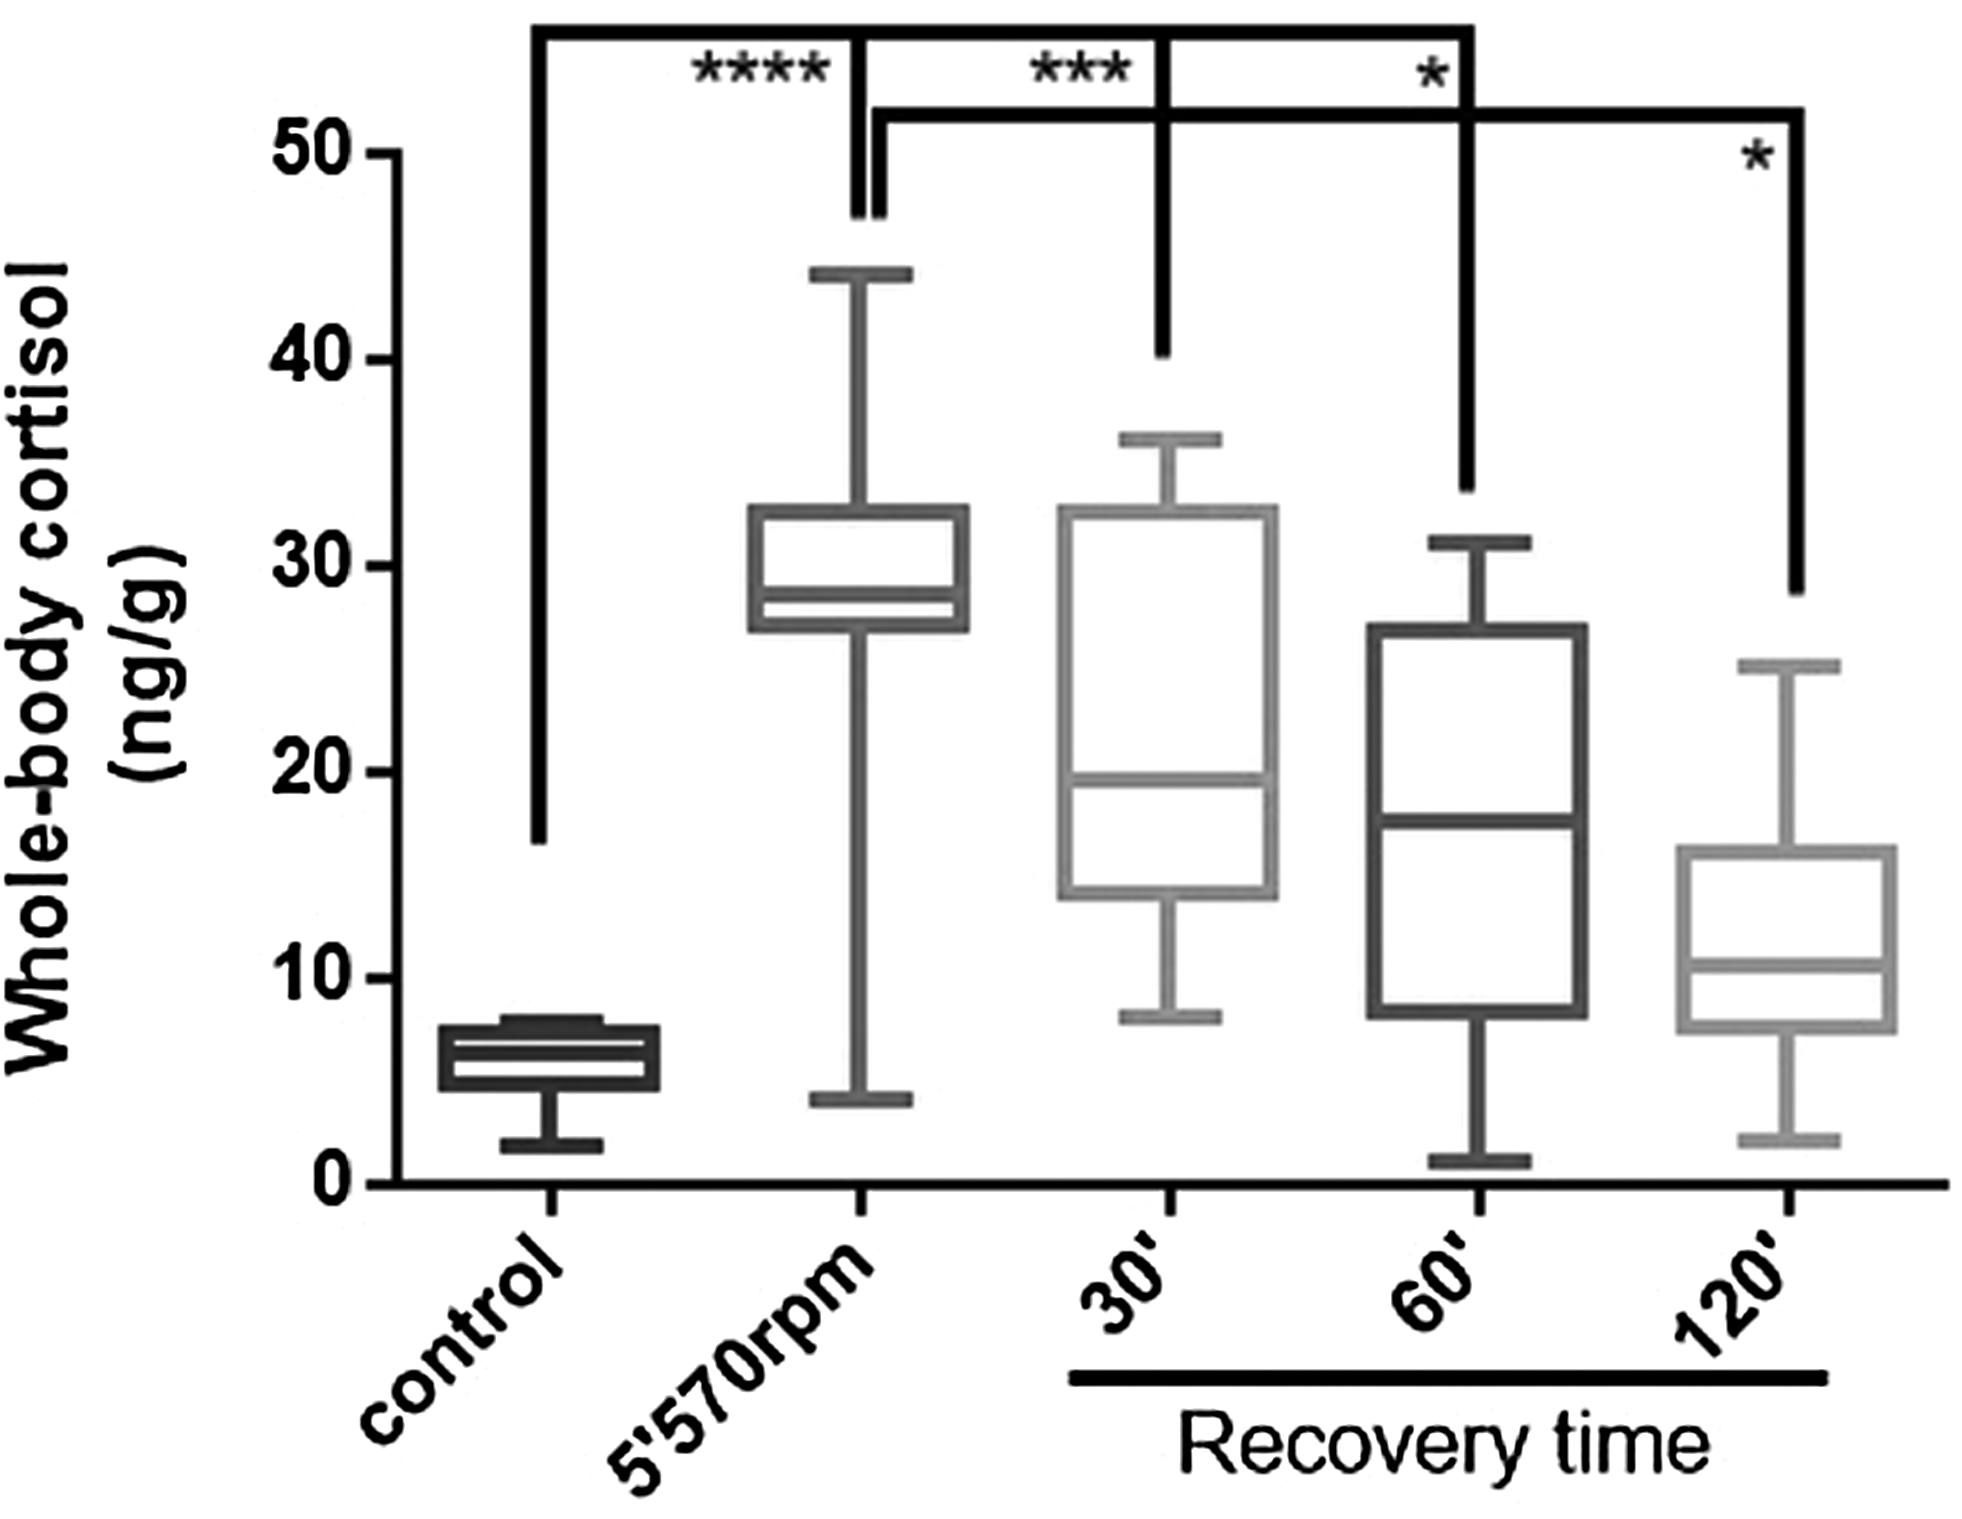
Whole-body cortisol concentrations in fish exposed to three rotational velocities during three periods. After 120 min of recovery, cortisol levels are statistically indistinguishable from the control level. Data are expressed as median ± interquartile interval of 12 fish and compared by the Kruskal–Wallis test followed by Dunn's multiple comparisons test. p Values in the figure (*p < 0.05; ***p < 0.01; and ****p < 0.0001).
Metabolic parameters
During all recovery times, glucose and glycogen levels were lower than those detected in the control groups (Fig. 6A, B). Lactate levels were increased at the three recovery times when compared to the control and in comparison to fish tested immediately after the spinning task (Fig. 6C). In addition, fish analyzed immediately after the spinning test and after 30 and 60 min of recovery presented increased CK levels than control fish (Fig. 6D).

Metabolic changes in zebrafish exposed to a spinning test.
Behavioral parameters
NTT
General locomotor parameters were altered after exposure to the spinning test. Total distance increased by forced exercise, returning to the control level after at least 60 min (Fig. 7A). The frequency of line crossings (Fig. 7B) increased after forced exercise, but not significantly in relation to control. However, this frequency diminished significantly after 60 and 120 min of recovery. The absolute turn angle decreased in the recovery period, presenting significant differences related to control and forced exercise (Fig. 7C).
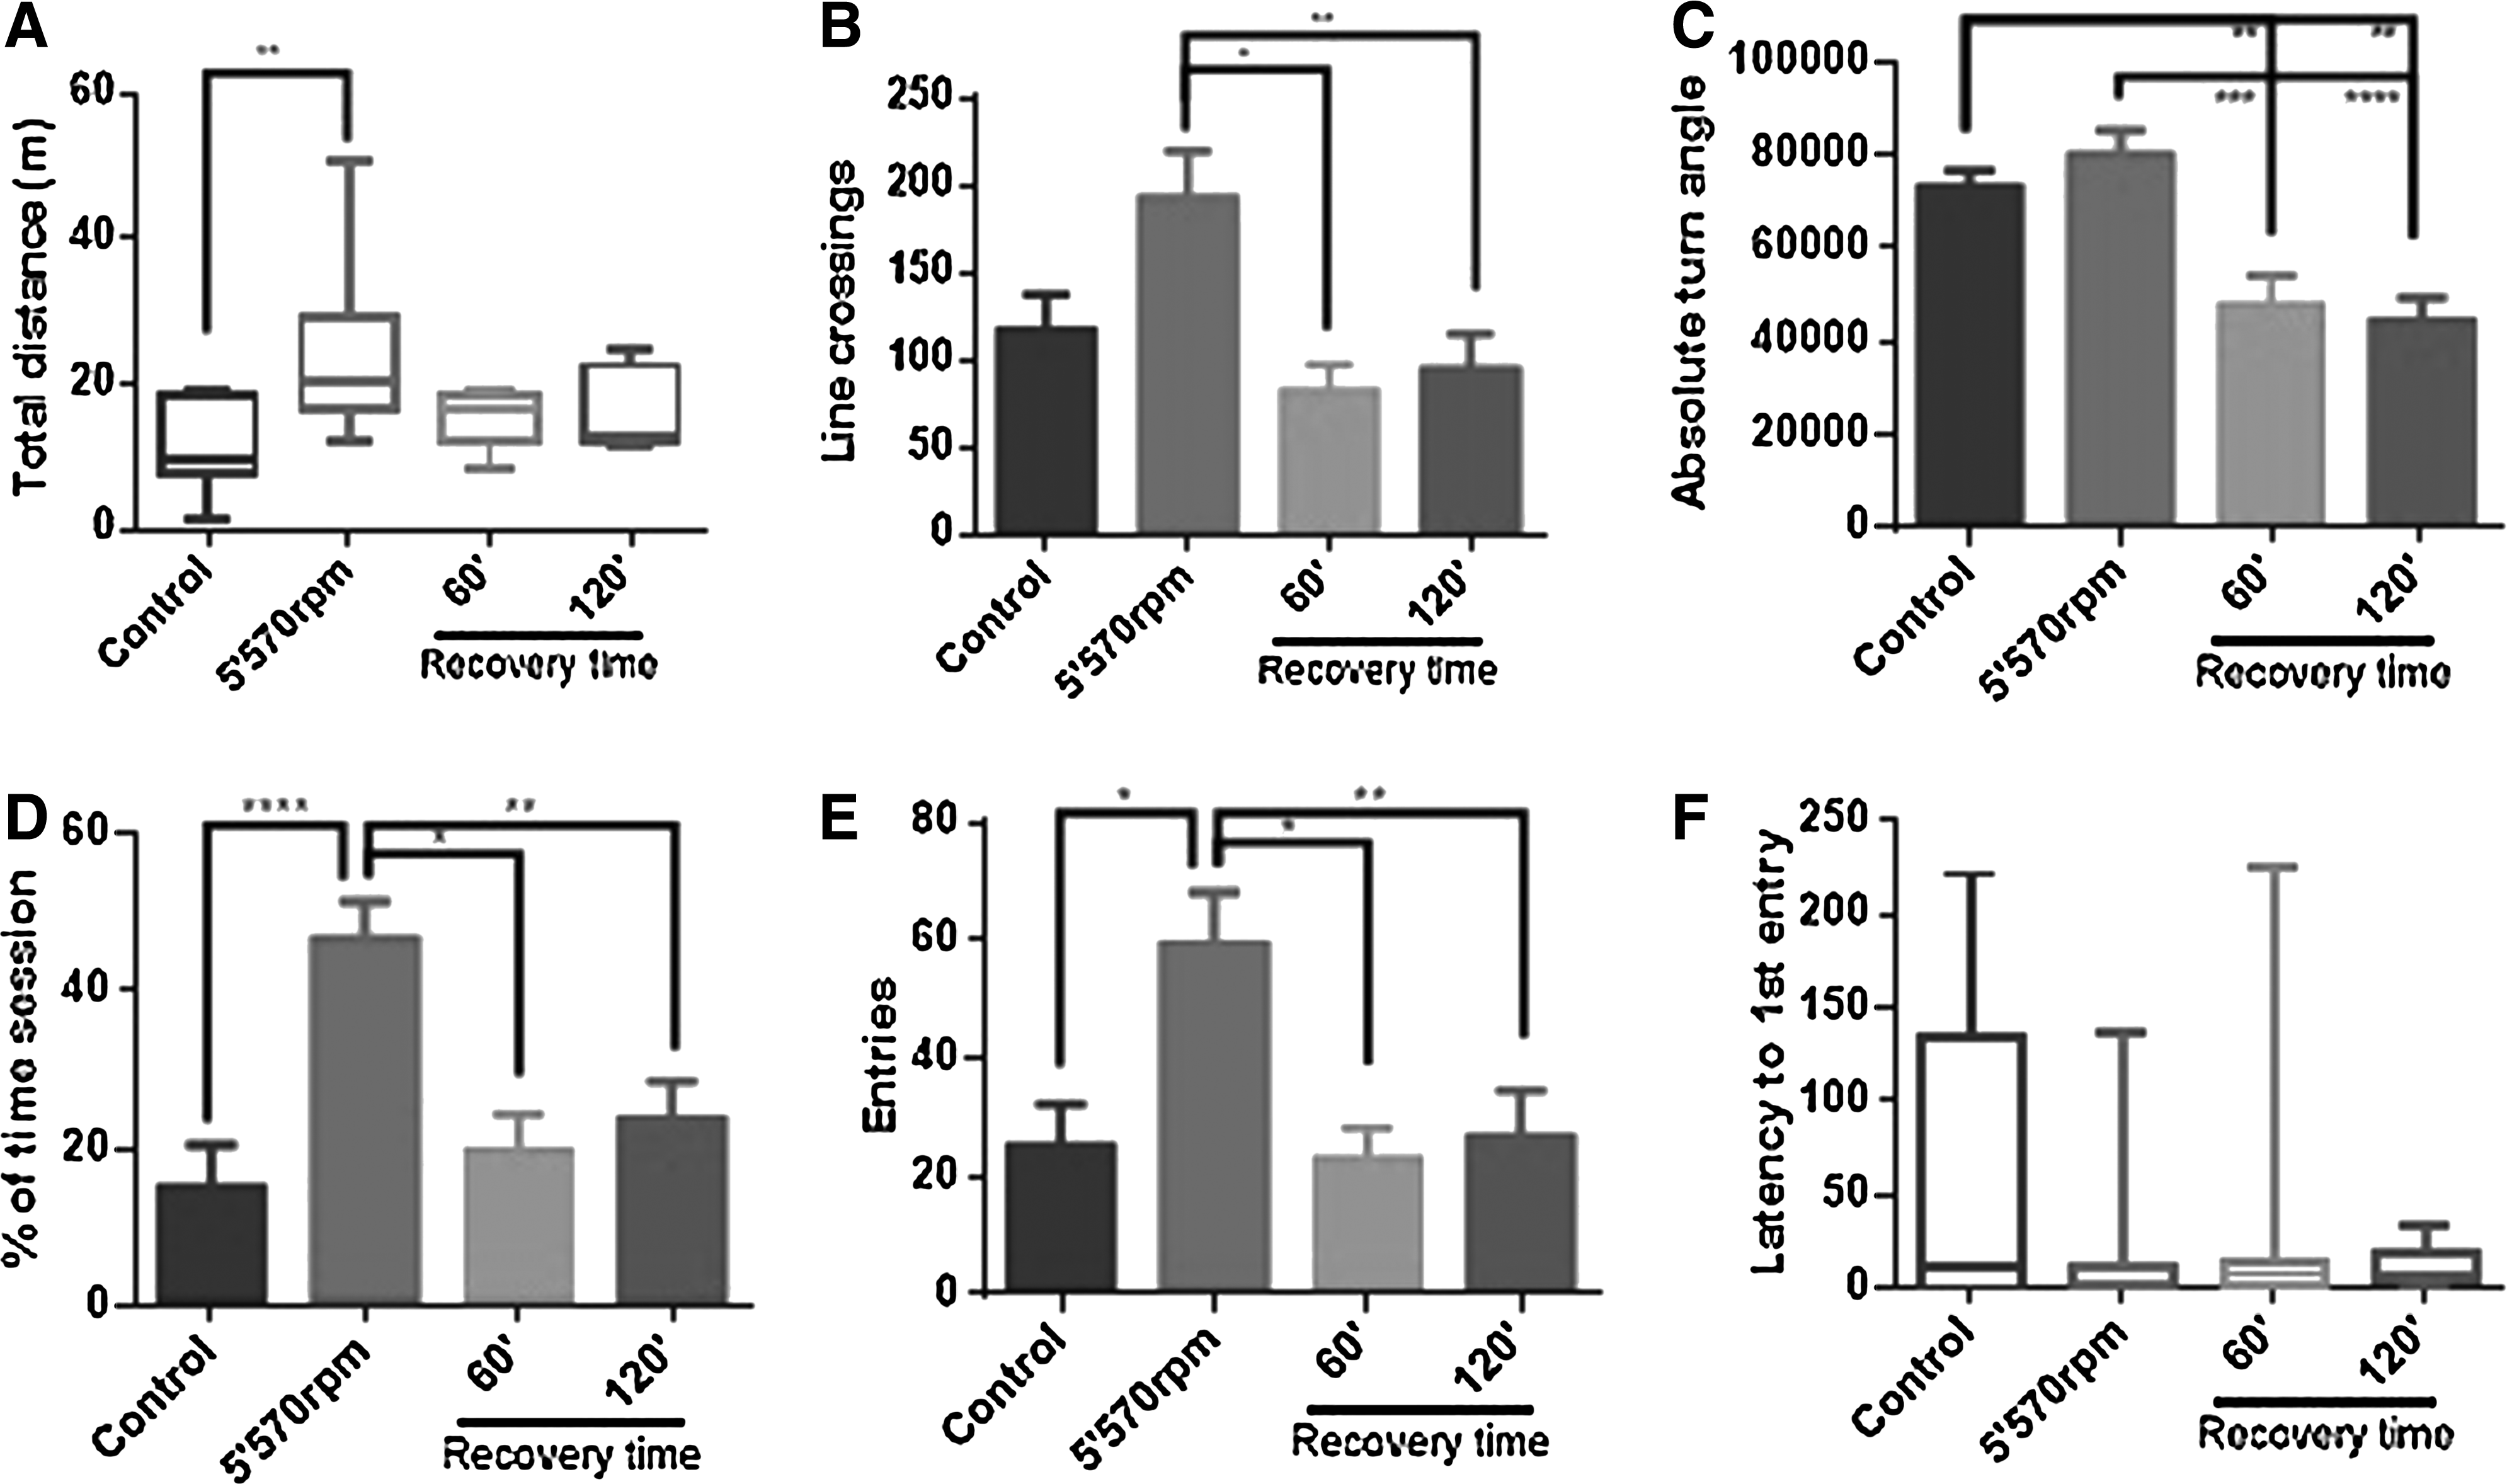
Locomotor parameters in zebrafish exposed to a spinning test.
The treatment increased the time spent in the upper zone as well as the number of entries in that zone, and those parameters reduced to control levels during the recovery period (Fig. 7D, E). Regarding latency to first entry in the upper zone (Fig. 7F), despite the difference between treatments, there was no significance, probably due to a high standard error.
Discussion
In this study, we show that the spinning test, first validated by Blazina et al., 14 can be used as a model to study the exercise–exhaustion–recovery paradigm. This forced swimming test was capable of promoting a wide range of changes in the HPI axis functioning, in the intermediary metabolism, as well as in fish behavior.
Regarding whole-body cortisol, the adapted-spinning test protocol was effective to promote endocrine alterations. In the first study, the group exposed to 570 rpm for 5 and 10 min showed significant increase in cortisol levels, showing that this velocity can promote the activation of the HPI axis. We can assume that this response occurs due to forced exercise, since our protocol eliminates the “fright” that can occur in other protocols. 9 This increase appears to be stimulated by the forced exercise, since cortisol plays a key role in energy substrates recruitment.20,21
Since the 5 and 10 min of exercise at 570 rpm showed similar results, we chose to use 5 min of exercise to optimize the laboratory procedures. In the main study, we tested the higher velocity (570 rpm) for 5 min, as well as three times of recovery. The cortisol profile confirmed the results of the pilot study, where 5 min of exercise at 570 rpm can increase cortisol levels. Concerning the recovery time, only at 120 min after exercise, the fish could restore the cortisol at similar levels as control.
The intermediary metabolism was also modulated by forced exercise. At the velocity of 410 and 480 rpm, depletions on glycogen and glucose levels did not occur, indicating that the swimming activity for this time (5 and 10 min) does not decrease the carbohydrate reserves. As the exercise intensifies (480 and 570 rpm), glycogen and glucose reduce, indicating consumption of carbohydrate reserves. 22 The decrease of glycogen and glucose is proportional to the increase in exercise intensity. According to Navarro and Gutiérrez, 22 the glycogen mobilization seems to be more related to exercise and muscular activity than other physiological processes.
It has been reported that metyrapone-treated fish increases muscle glycogen levels, in contrast with the controls suggesting a direct link between plasma cortisol levels and glycogenesis. 23 The activation of this response can be triggered by many stressor stimuli, like increased cellular temperature and metabolic stress, 24 factors which take place in the intense exercise.
Metabolic stress represented by reduction of glucose availability also seems to be involved with exercise-induced stress response. 25 The intense exercise in fish induces a decrease of glycogen levels, with the complete restoration only after ∼6 h.9,26 Regarding the levels of lactate, the group submitted to lower intense exercise presented an increase as exercise becomes more intense.
In this line, Liew et al. 27 demonstrated that Carassius auratus exposed to burst exercise presented increase of lactate that is concomitant with glycogen and glucose decrease, suggesting the involvement of anaerobic metabolism. At the medium velocity, there was an increase of lactate after 5 min of exercise, which might be related to glycogen and glucose decrease. However, after 10 and 20 min of exercise, the lactate concentrations decrease, and glycogen and glucose stabilize, suggesting a new pathway of glycogenesis since the recovery of white muscle does not depend on Cori's cycle, as glucose mobilization occurs at 10% of glycogen storage. 28
In the main study, the forced exercise did not induce a significant decrease of glycogen and glucose levels. Importantly, both parameters kept stabilized even with the increase of lactate in forced exercise. However, another metabolic biomarker, the CK activity, increases, indicating that the energy necessary to maintain the exercise might be supported by phosphocreatine, which is the primary source of energy during intense exercise. 29
We highlight that our forced-exercise protocol alters fish behavior. At the higher velocity, behavioral parameters such as distance, speed, and line crossings are elevated. In the recovery period, the absolute turn angle decreases. These alterations can be interpreted as a state of hyperactivity, suggesting that the forced exercise may lead to an anxiety-like behavior.30,31 A similar anxiogenic effect of exercise was found in rodents, with probable relation between exercise and neurogenesis. 32
Besides, neurogenesis can occur in adult teleosts, including after exercise,33–35 it seems less likely this occurs due to the brief period of exercise in our experiment. In mice, Binder et al. (2004) 36 found that in the determined behavioral test, the animals showed anxiety behavior after voluntary exercise for 4 weeks. However, in the same study, an anxiolytic response was observed in another test. This discrepancy of results may occur by nature of test, where additional behaviors, like stress responsiveness and impulsivity, can be evaluated.
In our work, we used behavioral tests that are indicative of anxiety-related behavior. In addition, we assessed these parameters after a protocol of acute forced exercise, a situation that can trigger the release of several neurotransmitters that cause this behavior. Thus, another hypothesis is the involvement of the sympathoadrenal system. The activation of the hypothalamus–pituitary axis provokes the release of adrenocorticotropic hormone (ACTH) into the circulation. Besides promoting the release of corticosteroids, the ACTH is involved in the catecholamine modulation.37,38 Catecholamines are released after exposure to several stressor stimuli, including high-intensity exercise,38–40 aiming energy mobilization.
Pacak et al. (1995) 41 related a consistent relationship between plasma ACTH and catecholamine in paraventricular nucleus (PVN) microdialysate, in rats, after the activation of hypothalamic–pituitary–adrenal (HPA) axis. The axis activation in consequence to a stress response generates an anxiogenic effect. 42 This activation leads to a defense state that could be interpreted as “anxiety.” Studies suggest that the physical effects of anxiety, as hyperactivity and elevated heart rate, are caused by adrenergic system. 43 This hypothesis is supported by experimental evidence, since these effects can be suppressed by administration of beta-adrenergic blockers.44,45
Taking into consideration that plasma catecholamines are elevated in acute exercise,40,41 and given the strict relation between HPI axis and sympathetic nervous system,37,38 it is plausible to assume that this anxiety-like behavior was caused by the forced exercise protocol.
Interpreting our results, we propose three exercise levels as follows: (i) mild exercise (410 rpm/5 min)—stable glucose levels, with the initial metabolism of glycogen, and elevated lactate levels; (ii) moderate exercise (490 rpm/5 min)—the energetic reserves start to decrease, evidenced by the reduction of glucose and glycogen levels. This fact indicates the activation of anaerobic metabolic pathway, verified by consumption of lactate; (iii) intense exercise (570 rpm/5 min)—significant decrease of glucose, glycogen, and lactate. Besides, we observe an increase in CK activity, whole-body cortisol levels, and robust behavioral changes. In the same way, Fuss et al. (2009) 32 reported a significant activation of HPA axis in rodents after voluntary exercise, and the increase of circulating corticosteroids in mice after running exercise was also related. 46
The last comment is about the methodology of measuring metabolic parameters in whole body. Despite the fact that usually these parameters were measured in total blood or specific tissues as white or red muscle, the results obtained in whole fish were within the expected common ranges and respecting the dynamics: consumption of energy storages–elevation of corticosteroids–accumulation of metabolites–recovery.7,9,10
Zebrafish present similar neuroendocrine and physiologic structures when compared to other vertebrates, as mammals and humans.34,47 This similarity makes possible the application of zebrafish in biomedical research, representing a great translational value. Besides, we highlight that the zebrafish is a valuable model organism for ecotoxicological research, acting as a model system to evaluate and monitor environmental pollutants and their biological effects. 48
Thus, taken together, our results pointed that this adaptation of the spinning test may serve as a valuable tool to evaluate the effects of different drugs on exercised fish. The protocol may be applied both to environmental (to evaluate contaminants that act in fish energy mobilization and recovery after stressors) and translational perspectives (drug or abuse substance effects on exercised or stressed humans).
Footnotes
Acknowledgments
This study was funded by the Universidade de Passo Fundo and CNPq (grant number 470260/2013-0). L.J.G.B. holds a CNPq research fellowship (301992/2014-2). The authors acknowledge Murilo S. Abreu by the comments regarding fish behavior.
Disclosure Statement
No competing financial interests exist.