
Abstract
Abstract
The present study outlines a protocol for examining retinal structure in zebrafish, a popular model organism for ocular studies, using spectral domain optical coherence tomography (SD-OCT). We demonstrate how this live imaging modality can be used to obtain high quality images of several retinal features, including the optic nerve, retinal vasculature, and the cone photoreceptor mosaic. Retinal histology sections were obtained from imaged fish for comparison with SD-OCT cross-sectional B-scans. Voronoi domain analysis was used to assess cone photoreceptor packing regularity at 3, 6, and 12 months. SD-OCT is an effective in vivo technique for studying the adult zebrafish retina and can be applied to disease models for longitudinal serial monitoring.
Introduction
Z
Among the numerous advantages of studying zebrafish is their genetic manipulability, which has been pivotal in establishing the zebrafish as a biomedical model. 5 The zebrafish genome is well curated and it has been found that ∼70% of human protein coding genes have at least one zebrafish ortholog. 6 Previously, forward genetic screens using chemical or insertional mutagenesis have provided a host of zebrafish mutant ocular phenotypes for the identification of gene function in vivo.7–9 Many mutations in the zebrafish genome have been associated with phenotypes of visual dysfunction that have parallels with human disease, including models of retinitis pigmentosa and choroideremia.1–4
More recently, the development of modern genetic techniques, such as TALENs (transcription activator-like effector nucleases)10,11 and CRISPR (clustered regularly interspaced short palindromic repeats), 12 has made precise and efficient gene editing possible. The availability of relatively inexpensive and straightforward techniques will facilitate the production of numerous zebrafish mutant lines, modeling a range of retinal developmental and degenerative diseases. While providing insight into the underlying pathological details of various disorders, such mutants will serve as preclinical models for assessing the efficacy and safety of potential treatment strategies.
Currently, the established gold standard for studying retinal structure in zebrafish is ex vivo histological assessment. As this technique requires sacrifice of the animal being examined, longitudinal analysis within the same individual is not possible and large numbers of fish may be required to assess multiple different timepoints. Further limitations of traditional histological analysis include the risk of tissue damage and the time-consuming laboratory procedures involved. Alternatively, the use of live imaging modalities, such as optical coherence tomography (OCT) and confocal scanning laser ophthalmoscopy (cSLO), offers both economic and ethical advantages by enabling equivalent images to be obtained in a rapid in vivo context.
OCT is a noncontact, noninvasive imaging technology that can construct detailed cross-sectional and three-dimensional images of the eye.13,14 It is the optical analog of ultrasound. OCT imaging is based on interferometry, where light is sent through a sample arm and a reference arm, and backscattered light from the sample is combined with that from the reference arm to generate an interference signal. Most current generation systems use the spectral properties of wide bandwidth (50–100 nm) light sources in the near infrared range to depth resolve the optical properties of a sample. Due to the method of acquisition, these systems are referred to as spectral domain OCT (SD-OCT).15,16 Single depth measurements are called an A-scan, with series of depth scans along a single plane called B-scan, which creates an optical section. Series of densely sampled B-scans can be visualized en face to generate optical flat-mounts for further analysis.
The use of OCT is well established in the clinical setting, where it is used for diagnosis and monitoring of ophthalmic disease. 14 It has also been used to visualize a variety of animal retinas, including rodents,17,18 birds, 19 and Xenopus. 20 Previous studies have successfully used SD-OCT to image ocular tissues in larval, juvenile, and adult zebrafish in vivo.21–26 Other tissues, including the brain and heart, have also been examined.21,27
In adult zebrafish, it has been shown that detailed cross-sectional images of the laminated retina and optic nerve are possible and that SD-OCT can effectively detect degeneration and subsequent regeneration of the inner and outer retinal layers, demonstrated using light- and ouabain-mediated damage paradigms.22,23,25 It has also been used for accurate measurement of several eye dimensions in wild-type and myopia disease models. 24 Recently, in combination with cSLO, SD-OCT has been used to closely examine specific layers in outer retina, including the photoreceptors. 26 Although the utility of SD-OCT for zebrafish ocular imaging has been demonstrated, there is limited information available on the protocols used.
The present study details a protocol for obtaining cross-sectional and en face images of the retina in wild-type adult zebrafish, using the Bioptigen Envisu R-series Spectral Domain Ophthalmic Imaging System (SDOIS). The eyes of zebrafish of 3, 6, and 12 months in age were imaged to examine age-related differences in retinal layer thickness and the cone photoreceptor mosaic. Retinal histology sections from imaged fish were also obtained for comparison with SD-OCT cross-sectional images.
Materials and Methods
Animal care
Wild-type (AB) zebrafish were maintained at the University College London (UCL) Institute of Ophthalmology Biomedical Research Unit. The fish were raised to 3, 6, and 12 months of age at 28.5°C exposed to 200 lux illuminance for 14 h daily: 10 h darkness. A total of 18 fish had SD-OCT imaging carried out in their right eyes. Research was carried out in accordance with the principles and guidelines of The Animals (Scientific Procedures) Act 1986, United Kingdom, and the ARVO statement for the Use of Animals in Ophthalmic and Vision Research with local institutional review board approval.
Imaging and animal equipment
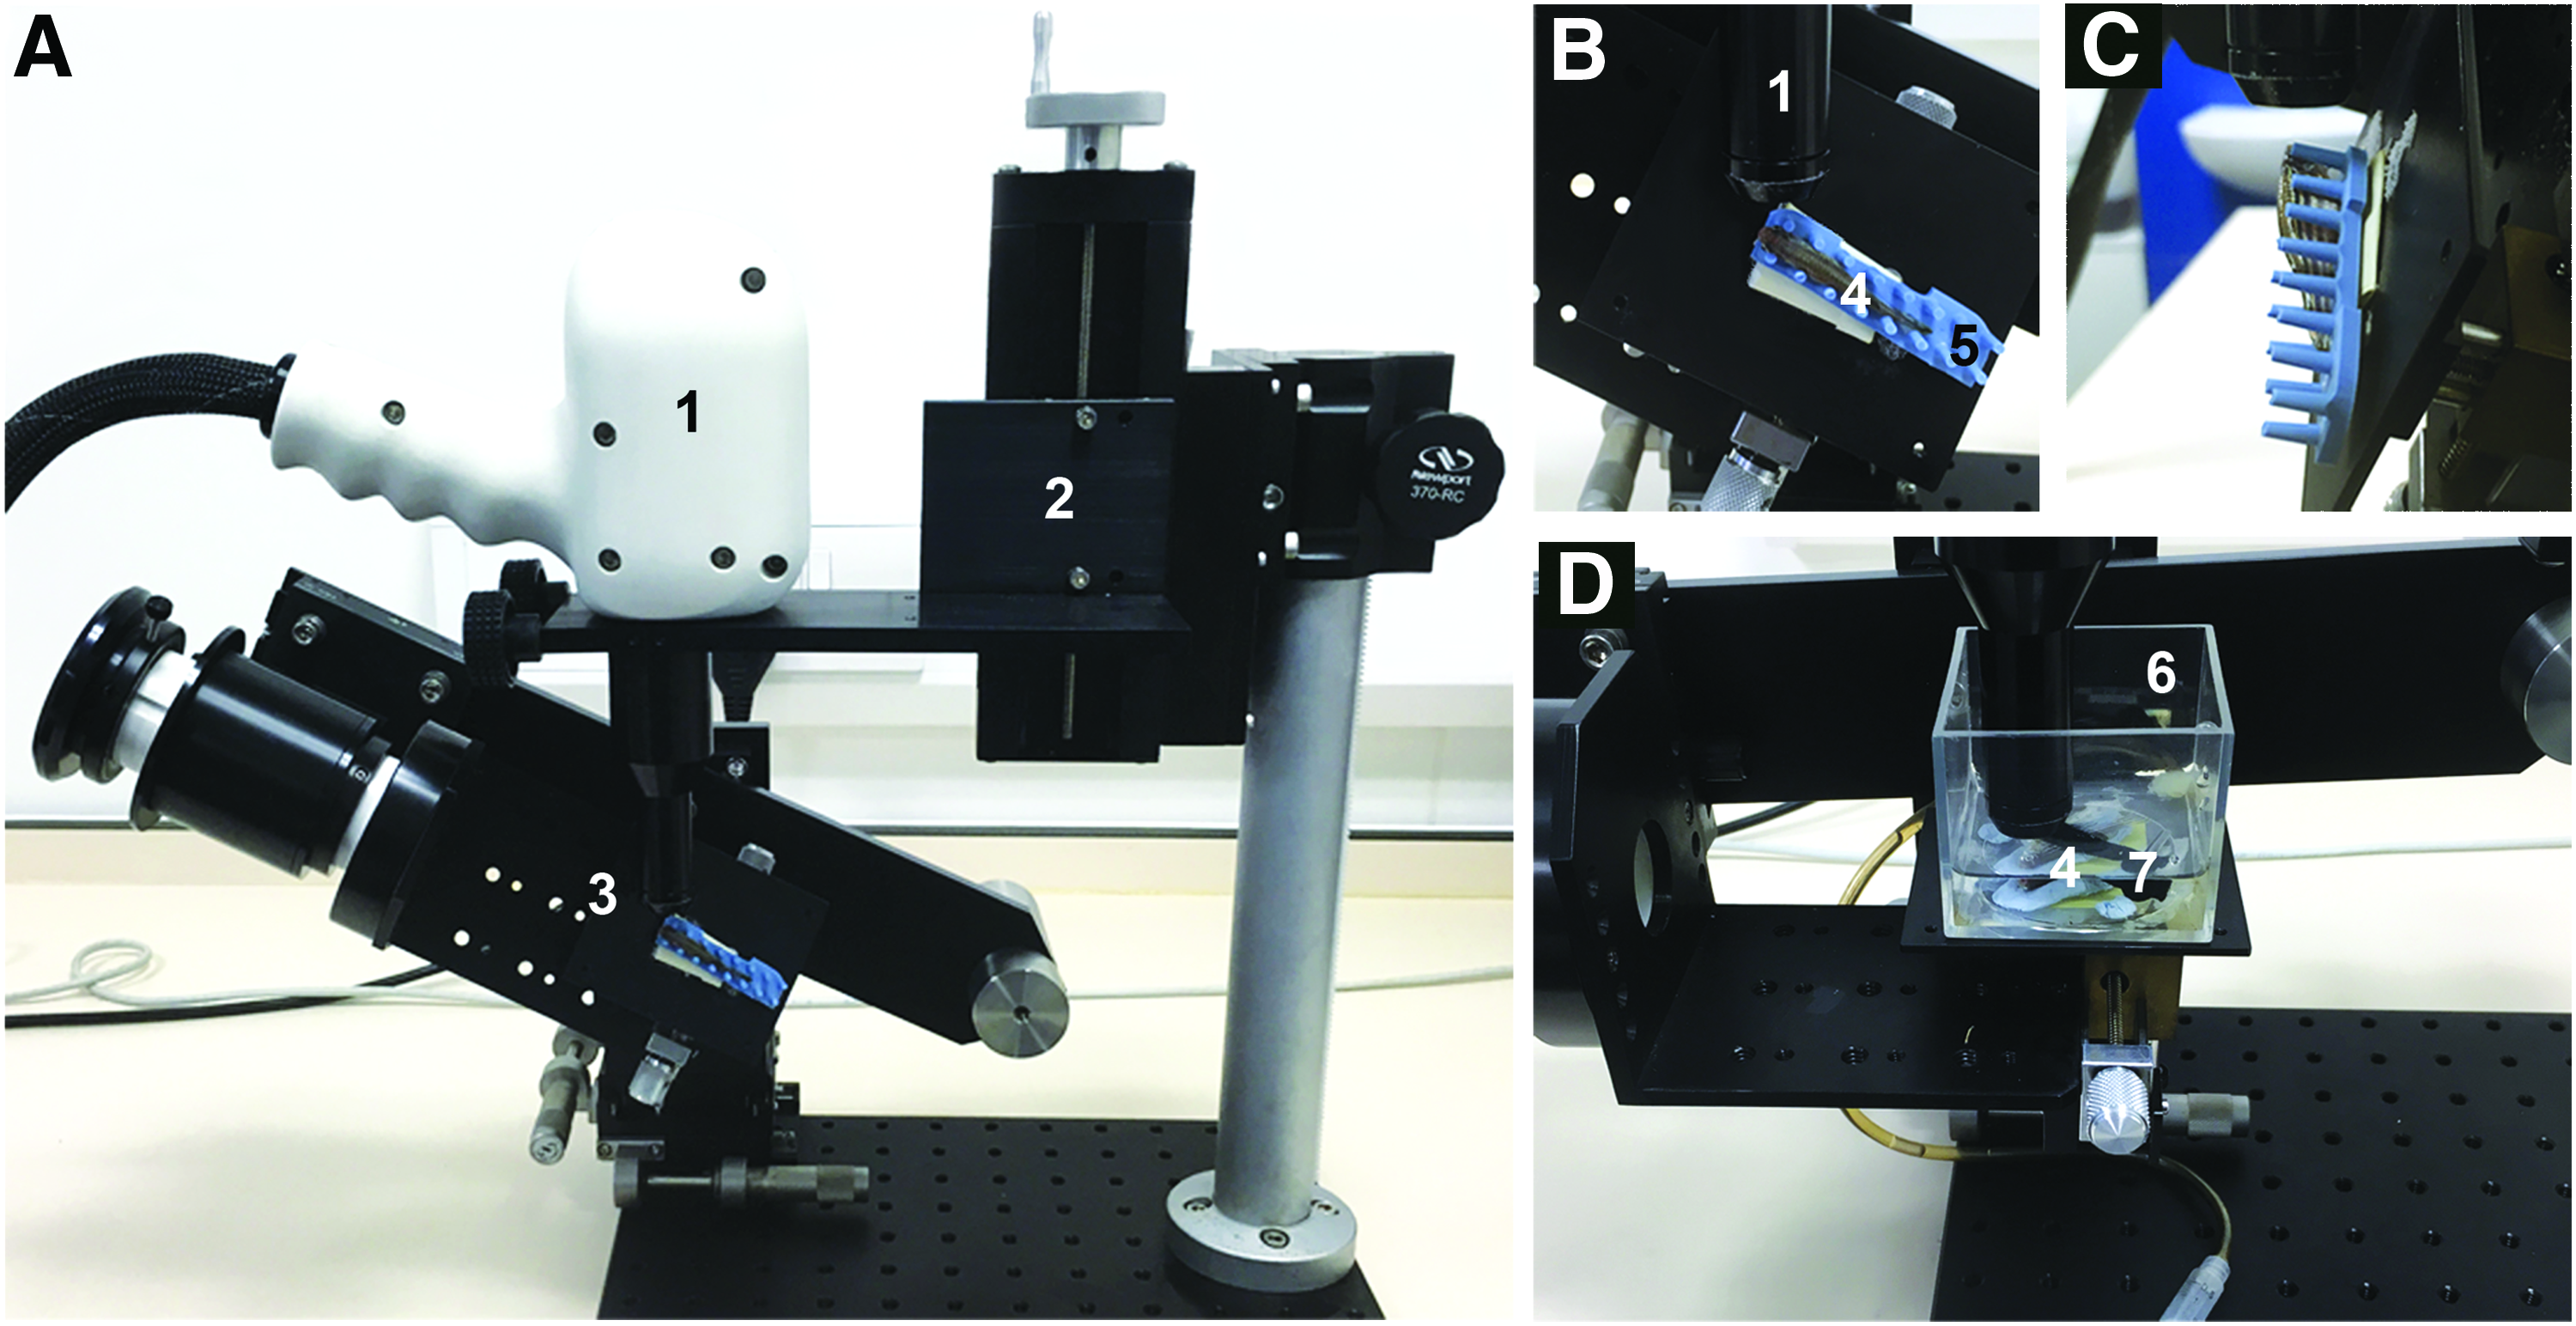
SD-OCT images were captured using the Bioptigen Envisu R2200 SDOIS (Bioptigen, Inc., Morrisville, NC), which is commercially available for small animal imaging. The SD-OCT apparatus included a base system (host computer, SD-OCT engine with reference arm, and a handheld SD-OCT probe), imaging mount, and animal alignment stage (Fig. 1). The probe was held in the mount in a vertical position directly above the alignment stage, where the zebrafish was placed and could be moved up and down. The alignment stage was able to move in the X or Z meridians. InVivoVue software (Bioptigen, Inc.) was used for creating and saving OCT image files.
SD-OCT equipment setup.
Before all SD-OCT imaging, 4 mg/mL tricaine (Western Chemical, Inc., Ferndale, WA) stock solution was diluted to 0.2 mg/mL in tank system water to anesthetize fish. When unresponsive to touch, anesthetized fish were transferred for imaging using a plastic spoon. For imaging of the optic nerve, a custom rubber holder with projections to maintain position was used to hold the zebrafish in place (Fig. 1B). When imaging the photoreceptor mosaic, the zebrafish were laid on a grooved plasticine wedge placed in an immersion tank with attached tubing and syringe to control water level. A weighted strap was used to stabilize the fish. Surgical tape was used for attaching either the rubber holder or immersion tank to the alignment stage.
SD-OCT imaging of the optic nerve and retinal layers
For optic nerve imaging, the zebrafish was placed in the rubber holder and positioned at an angle relative to the probe as demonstrated in Figure 1B. For each fish, a new “patient” and “exam” file was created on the InVivoVue program. A 1.4 × 1.4 mm perimeter protocol with 1000 A-scans per B-scan with 100 total scans was used for imaging the optic nerve and retinal lamination. The bore of the SD-OCT probe was initially brought into very close proximity to the fish eye, and live imaging was commenced. Following this, the position of the probe relative to the animal stage could be finely adjusted until an adequate image could be obtained and the optic nerve was located. This was achieved by moving the mounted probe up or down, or adjusting the position of the platform with the fish holder. During the imaging process, drops of 0.2 mg/mL tricaine were regularly pipetted on the fish gills to maintain moisture and on the eye to prevent corneal desiccation and maintain image quality.
SD-OCT imaging of the photoreceptor mosaic
When imaging the cone photoreceptor mosaic, the anesthetized zebrafish was placed in the immersion tank containing 0.2 mg/mL tricaine in tank water solution and was perpendicular to the probe (Fig. 1A). A rectangular scanning protocol consisting of a 1 × 1 mm perimeter with 400 A-scans per B-scan with 400 total B-scans was used for volume intensity projection (VIP) images of the fundus mosaic. The syringe attached to the tank was used to adjust the water level. The optimal water height (∼1 mm above the cornea) determined the clarity and brightness of individual photoreceptors. When capturing en face images, it was necessary to wait for the fish breathing to become less frequent to reduce breathing artifacts. After imaging, fish were revived and returned to their tank system, unless being used for histological analysis.
Histological evaluation
After SD-OCT imaging, three fish per timepoint were euthanized for histological evaluation. The right eye, which underwent imaging, was enucleated and fixed with 4% paraformaldehyde overnight at 4°C. Following this, the eyes were washed in phosphate-buffered saline (PBS) and serially dehydrated through a graded ethanol series (30%, 50%, 70%, 95%, and 100%) in PBS before embedding in JB-4 resin (Polysciences, Inc., Warrington, PA) according to manufacturer's instructions. Using a Leica RM 2065 microtome, 10 μm transverse retinal sections were obtained and stained with 1% toluidine blue before imaging on a Zeiss LSM510 upright microscope with AxioCam MRc digital camera.
Image analysis
Retinal thickness measurements from SD-OCT B-scans were obtained manually using the Diver software (Bioptigen, Inc.). For histology images, a stage graticule was imaged at the same magnification for scaling, and the equivalent measurements were carried out on transverse retinal sections containing the optic nerve using ImageJ (National Institutes of Health, Bethesda, MD). Measurements of several easily distinguishable sublayers were taken at a distance of 200 and 400 μm from the optic nerve (two points per distance) for each fish retina. The mean and standard deviation of each retinal thickness measurement were calculated per timepoint for both SD-OCT and histology data. Paired t-tests and Bland–Altman plotting were used to compare the data sets and assess agreement between the two methods of measurement. Statistical analysis was carried out using JMP12 (SAS, Raleigh, NC).
For longitudinal assessment of retinal structure, three fish were imaged on two separate occasions over a 3 week period, and thickness measurements were taken at the same point on the retina, located using the vasculature as a landmark.
In addition to thickness, the organization of the photoreceptor mosaic was assessed. The ordering present in a photoreceptor array can be analyzed by several methods, including nearest-neighbor method, 28 neuron density, 28 and Voronoi tessellation, 29 to provide a statistical assessment of the regularity in a receptor array. Metrics such as nearest neighbor and neuron density require information regarding image magnification and size of the region of interest. Since optical models of the fish eye do not exist, and a fish eye size varies greatly with age, these metrics were not applicable to our research. Therefore, Voronoi domain analysis was selected to better describe the orderliness with which the receptor array tiles the retina.30,31 In this kind of tiling, all points in the plane are partitioned into Voronoi domains, which represent all those points in the plane that are closer to a particular cell than to any other cell. The ideal sampling of a mosaic is produced by hexagonally, six-sided arranged photoreceptor cells. In this study, photoreceptor cells were manually identified using ImageJ from en face SD-OCT scans. Cell coordinates were analyzed using custom MATLAB software (MATLAB; MathWorks, Natick, MA).30,32 Percentage of six-sided cells and distribution of sidedness were assessed.
Results
Imaging of the optic nerve, retinal lamination, and vasculature
Using our SD-OCT equipment setup, it was possible to obtain detailed cross-sectional views of the adult zebrafish retina with clearly delineated layers, ganglion cell layer (GCL), inner plexiform layer (IPL), inner nuclear layer (INL), outer plexiform layer (OPL), outer nuclear layer (ONL), photoreceptor layer, and retinal pigment epithelium (RPE), and optic nerve (Fig. 2). The optic nerve, which can be used as a retinal landmark to orient the scans, appeared as a smudge-like interruption to the linear arrangement of the retinal layers (Fig. 2A). In the en face projection, the inner retinal blood vessels could be visualized travelling outwards from the optic nerve region and branching toward the peripheral retina (Fig. 2B).
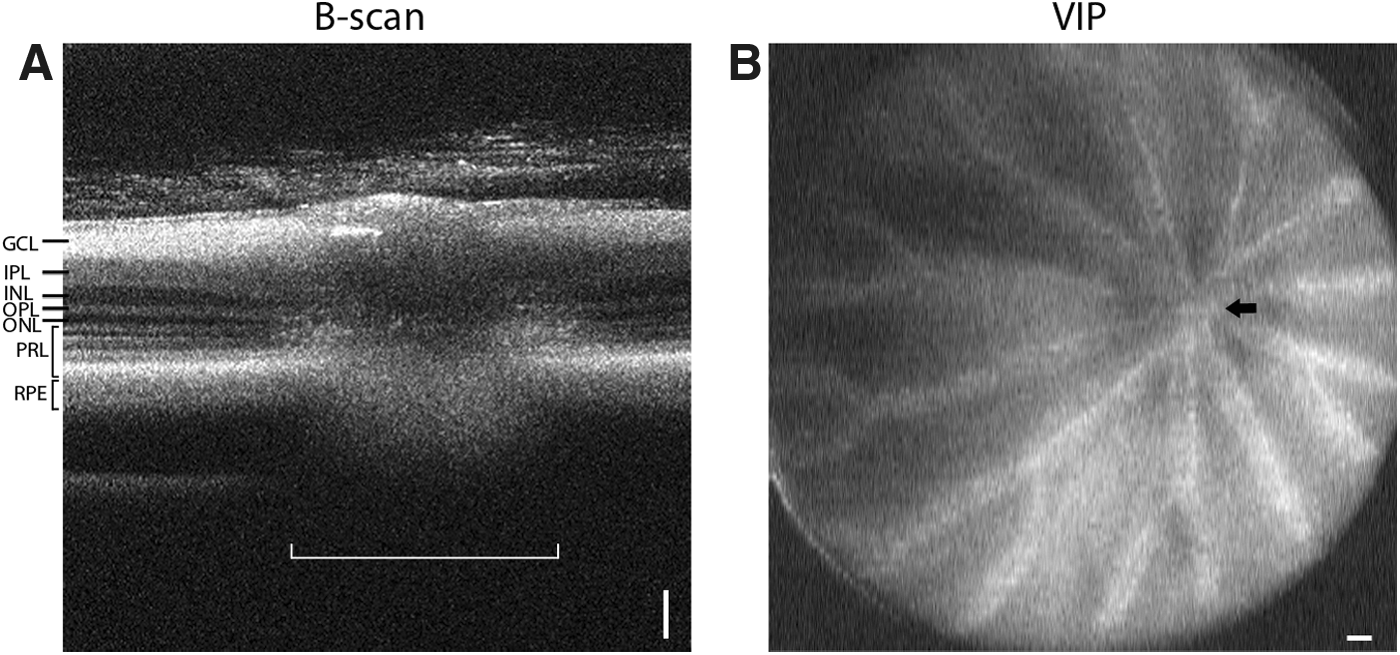
The optic nerve and retinal vasculature.
SD-OCT versus histology for assessment of retinal structure
By comparing SD-OCT retinal B-scans with retinal histology sections, we have shown that live imaging can provide an accurate representation of the structural organization of the zebrafish retina, with a level of detail akin to that obtained by histological methods (Fig. 3). Optimizing the level of water over the cornea of the eye being imaged produced greater definition in the retinal sublayers, particularly the outer layers in which the external limiting membrane (ELM) and photoreceptor outer segments (OS) could be distinguished.

SD-OCT retinal cross-sections
Measurement of individual retinal sublayers (GCL and IPL) or grouped sublayers (INL-ONL and GCL-ELM) was carried out on both SD-OCT and histology images of wild-type retinas at 3, 6, or 12 months of age (Table 1). Mean thickness values obtained from the two methods were similar for each timepoint. The mean GCL-ELM thicknesses taken from SD-OCT and histology images were 129 ± 8.0 and 129 ± 8.8 μm, respectively. Among the 3, 6, and 12 month timepoints, both data sets showed that retinal layer thicknesses varied minimally, and GCL-ELM measurements showed a modest overall increase from 3 to 12 months (4 and 12 μm on SD-OCT and histology images, respectively). Using paired t-tests to compare all SD-OCT and histology data for each retinal measurement, there was no significant difference between most layers (GCL, p = 0.2; INL-ONL, p = 0.074; and GCL-ELM, p = 0.28). Interestingly, the IPL thickness was significantly different between the two forms of assessment (p = 0.0318).
SD-OCT: n = 5 per timepoint. Histology: n = 3 per timepoint. Standard deviation in brackets.
ELM, external limiting membrane; GCL, ganglion cell layer; INL, inner nuclear layer; IPL, inner plexiform layer; ONL, outer nuclear layer; SD-OCT, spectral domain optical coherence tomography.
Bland–Altman analysis was used to calculate the mean differences between SD-OCT and histology measurements and to estimate the confidence interval (CI) within which 95% of the differences lie.
For GCL, IPL, INL-ONL, and GCL-ELM thickness measurements, the mean differences between SD-OCT and histology were 2 μm (95% CI: −18 to 22 μm), −4 μm (95% CI: −20 to 13 μm), 3 μm (95% CI: −18 to 20 μm), and 2 μm (95% CI: −30 to 33 μm), respectively. All timepoint data were analyzed together as separate Bland–Altman plots did not reveal age-related biases between the measurements.
Longitudinal assessment of retinal thickness
To examine the ability of SD-OCT to obtain reproducible longitudinal data within the same animal, repeat imaging and retinal thickness measurements at the same approximate point, using vasculature as a landmark, were carried out on three wild-type zebrafish over the course of 3 weeks (Fig. 4). The point of measurement was located each time using inner retinal vessel branching patterns on the en face projection as a reference. Using this method, we found that thickness values obtained from separate imaging sessions were relatively consistent within individual fish. The measurements (mean ± standard deviation) for the GCL, IPL, and GCL-ELM were, respectively, as follows: 37 ± 2.6, 26 ± 2.3, and 107 ± 13.3 μm at week 0 and 38 ± 2.6, 27 ± 3.8, and 108 ± 14.5 μm at week 3.
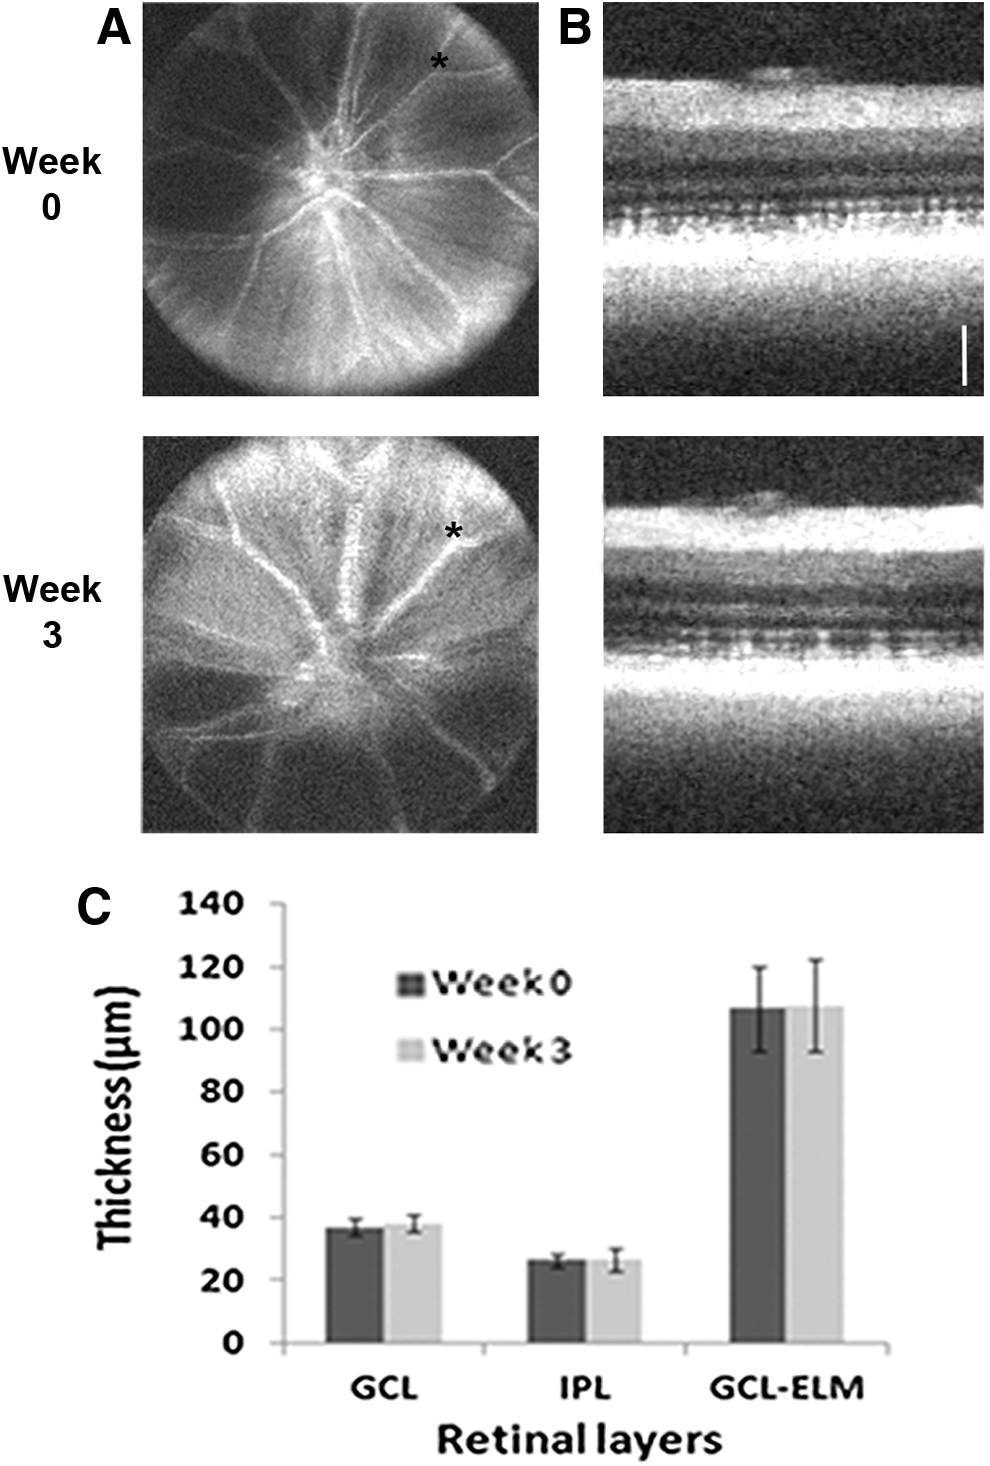
Longitudinal imaging of retinal structure.
Examination of the cone photoreceptor mosaic
The highly ordered spatial organization of photoreceptors is likely essential to maximize vision. The adult zebrafish retina has four cone photoreceptor subtypes, differing in their spectral sensitivity, which are arranged into a precise reiterated pattern (mosaic) with tiering.33,34 The well stereotyped mosaic organization consists of alternating rows of red/green-sensitive double cones and ultraviolet (UV)- and blue-sensitive single cones (Fig. 5). Using SD-OCT imaging, we demonstrated that by analyzing specific regions within the photoreceptor layer on the B-scan retinal cross-section (Fig. 5A, C), it was possible to visualize the innermost and outermost cone tiers, the presumptive UV and red/green submosaics, on the corresponding en face VIP views (Fig. 5B, D). By merging these cone layers, a detailed image of the precisely organized adult zebrafish cone mosaic was constructed (Fig. 5F).
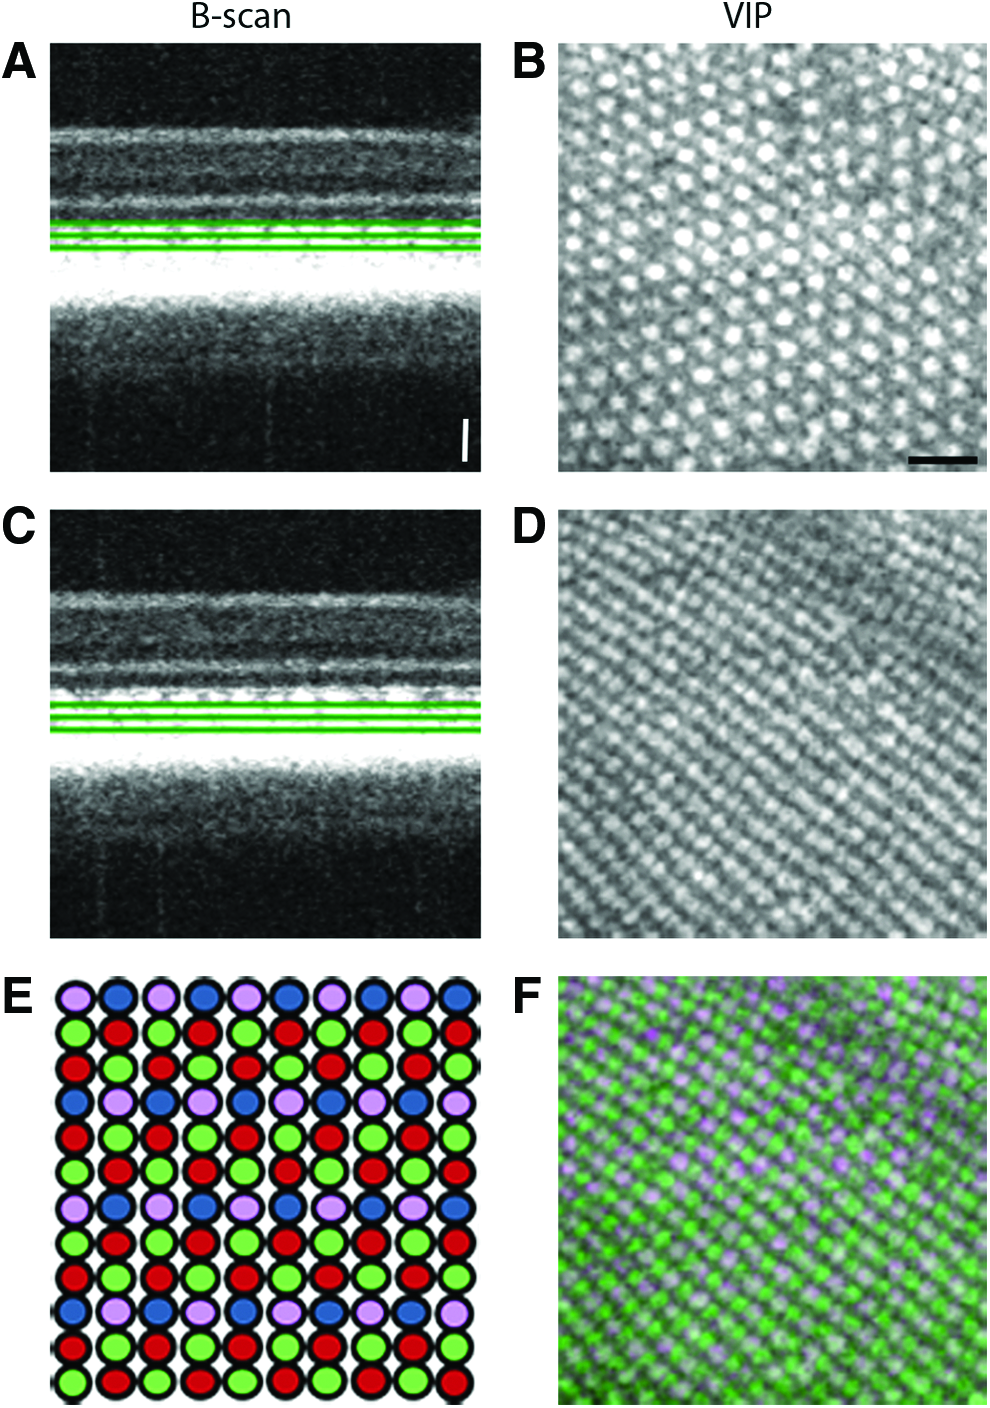
The zebrafish cone photoreceptor mosaic. The zebrafish has four spectral cone subtypes (UV, blue, green, and red).
Voronoi domain analysis was used to assess the regularity of the wild-type UV cone mosaic at 3, 6, and 12 months of age (Fig. 6). Only regions of the peripheral retina containing the adult mosaic growth were analyzed, and the disorganized larval remnant was excluded. Voronoi diagrams, in which a Voronoi polygon is associated with each cone photoreceptor and color-coded according to the number of sides it possesses, were derived from the cone mosaic images (Fig. 6B). The zebrafish retinas at each timepoint were dominated by regions of green-coded six-sided polygons, indicating a regular triangular lattice. The other colors marked points of disruption in the hexagonally packed mosaics. The presence of more numerous smaller domains highlighted a clear increase in cone cell number in the 12 month mosaic compared to that of 3 and 6 months.
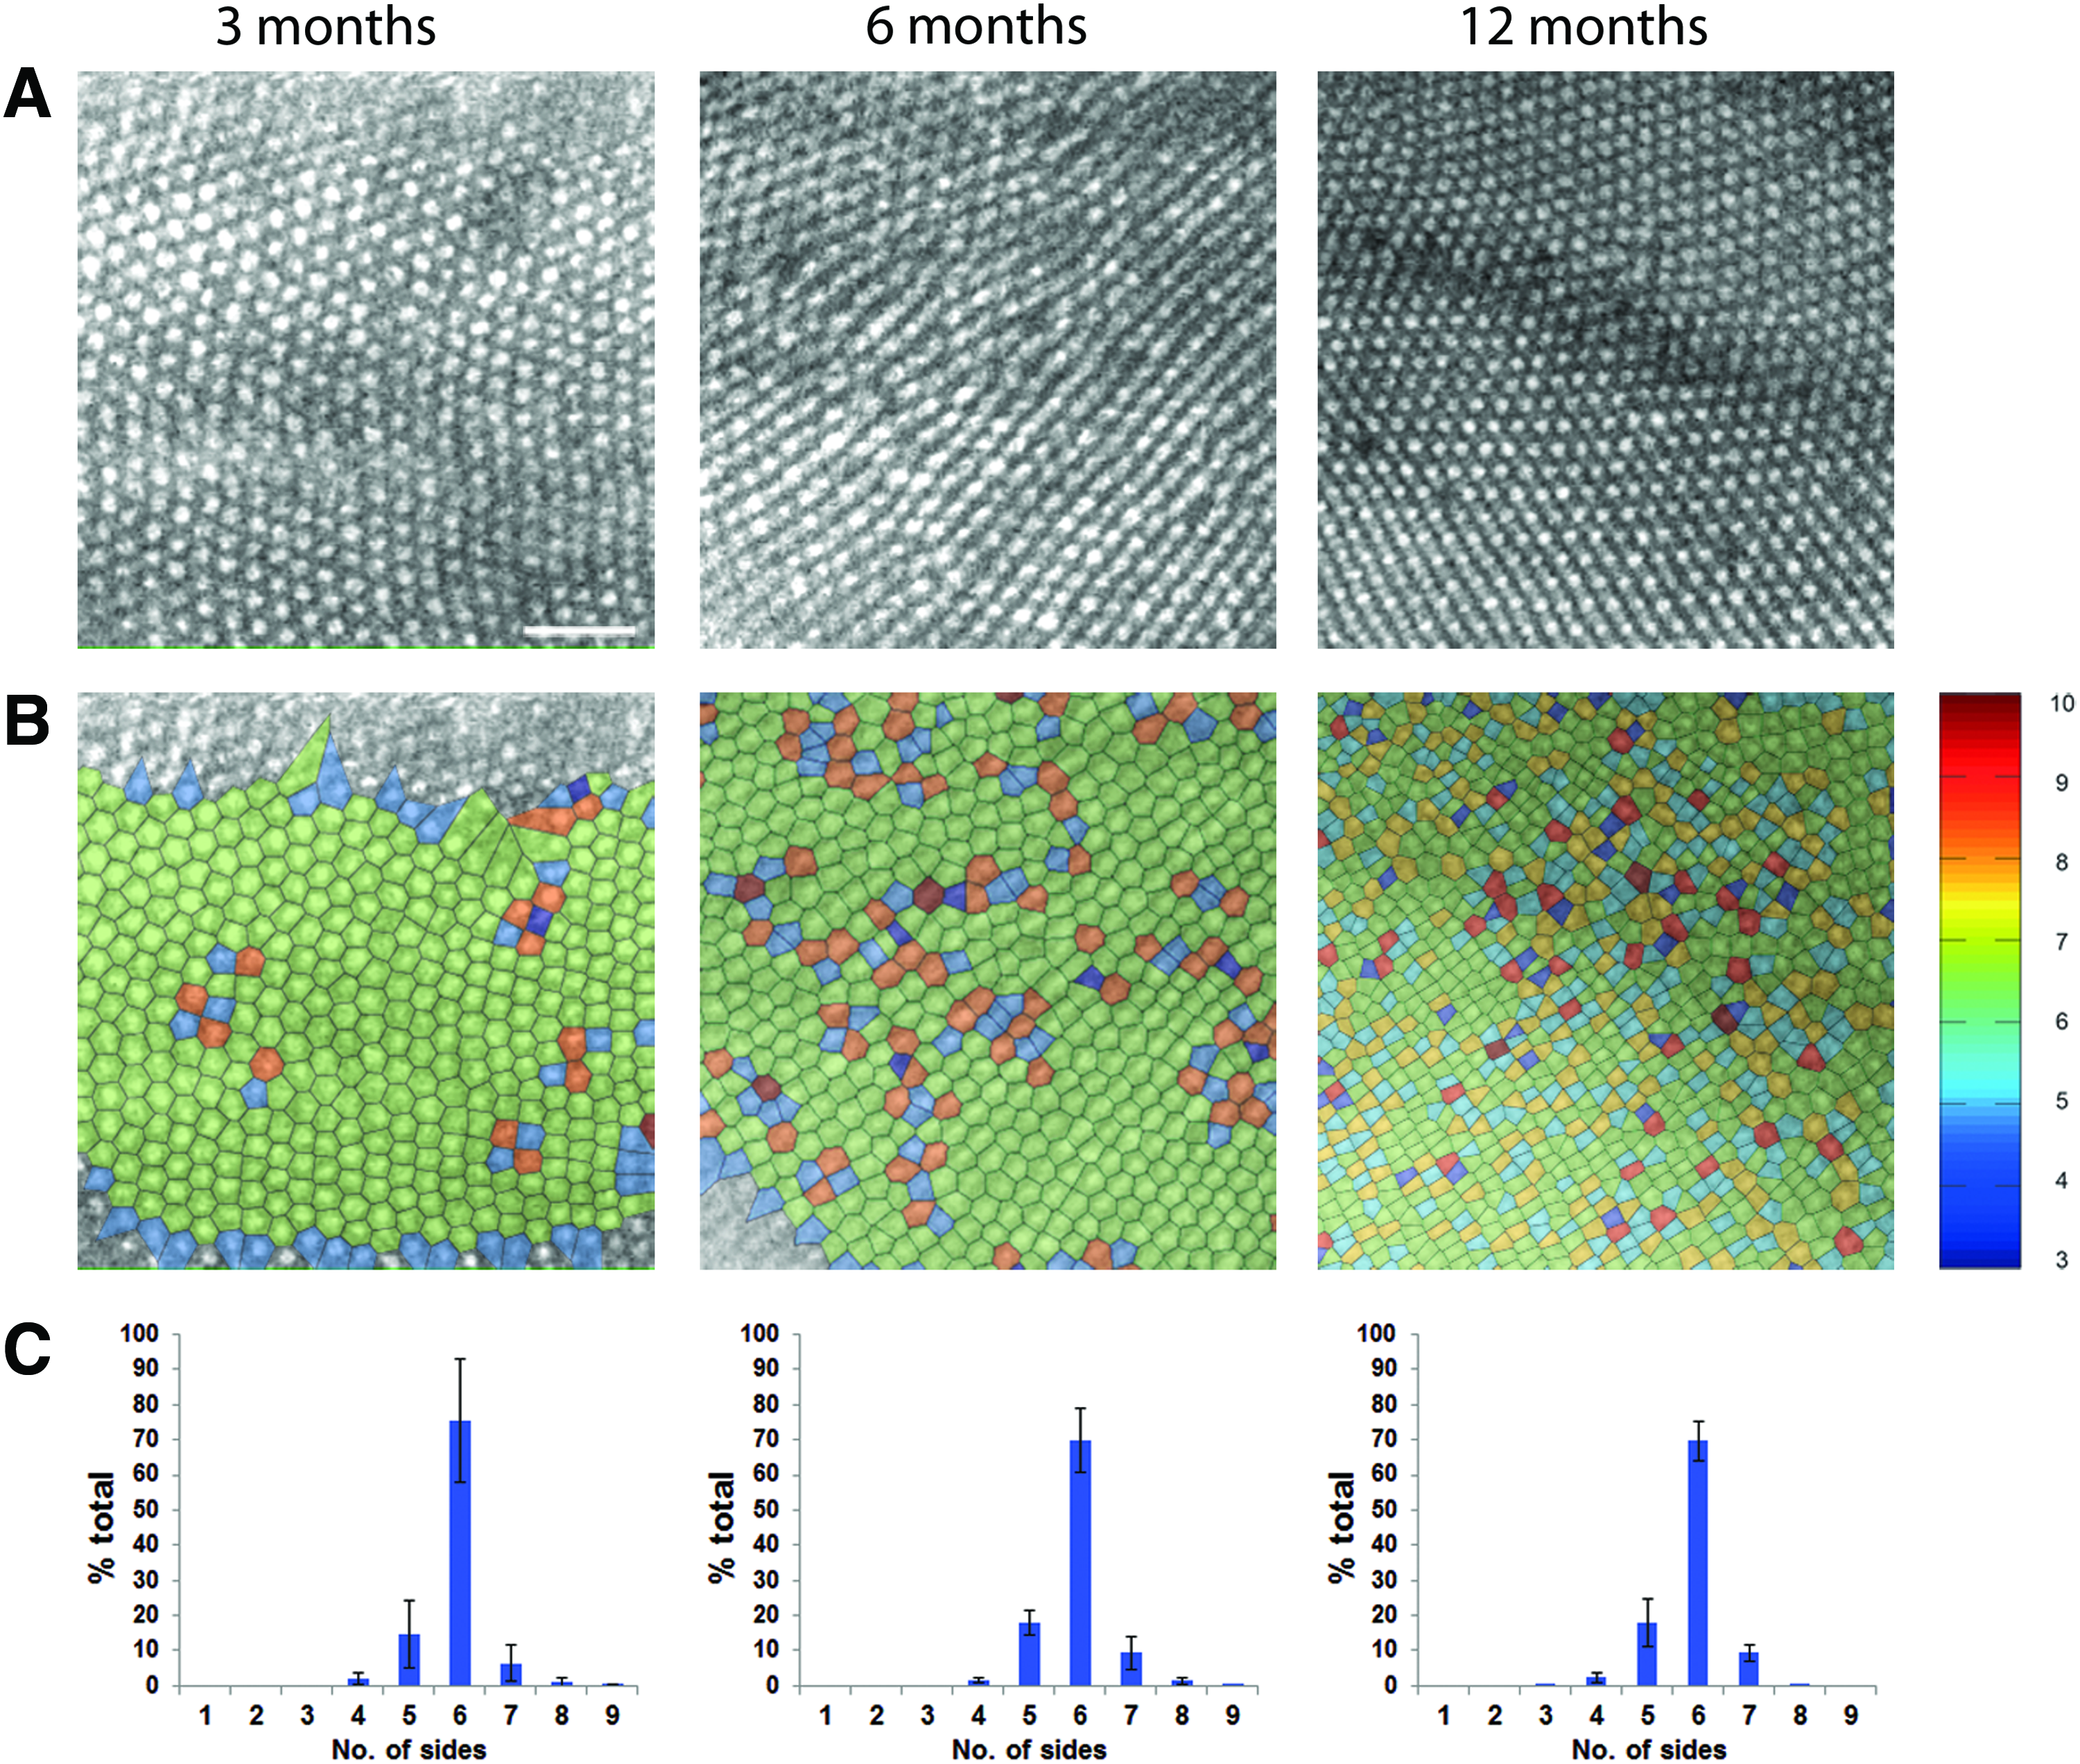
Cone photoreceptor mosaic geometry in zebrafish at 3, 6, and 12 months.
Assessment of the distribution of sidedness in the Voronoi domains for each timepoint (n = 3) demonstrates that there was minimal variation of the cone mosaic arrangement, maintaining its regularity with age (Fig. 6C). Overall, the number of sides was found to range between 4 and 9. At 3, 6, and 12 months, the mean percentage of cones with six neighbors was 75.4%, 69.7%, and 69.7%, respectively, indicative of mosaics with mostly regular hexagonal cone packing. Greater disorganization in the pattern is associated with lower percentages of six-sided domains. The reduction in regularity with age is predicted by normal loss of photoreceptors with age.
Discussion
SD-OCT is an important imaging modality used extensively in the clinical practice of ophthalmology. It has also become increasingly popular in the laboratory setting, as a noninvasive cost-effective alternative to ex vivo assessment of animal retinal structure. By reducing the number of animals necessary for experimentation, the use of such live imaging is in keeping with the guiding principles for ethical use of animals in research, known as the “three Rs” (replacement, refinement, and reduction). Several studies have already applied the technique to zebrafish and have shown its ability to form accurate representations of their ocular tissues.21–26 In this study, we have provided a practical and reproducible protocol for capturing high quality SD-OCT images of various retinal features, including the optic nerve, retinal vasculature, and photoreceptor mosaic, in wild-type adult zebrafish.
Using a commercially available SD-OCT device, we have demonstrated how in vivo imaging can be used to qualitatively and quantitatively assess the cross-sectional views of the zebrafish retinal lamination, providing a level of detail comparable to that of plastic resin-embedded histology sections (Fig. 3 and Table 1). Retinal layer thickness values obtained from histology followed the same overall trend of mild growth with age found by SD-OCT measurements between 3 and 12 months. Previously, it was shown that the retinal radius and other eye measurements continue to increase throughout the zebrafish lifetime. 24 Comparative analysis between SD-OCT and histology data showed that the two techniques produced similar results for GCL, INL-ONL, and GCL-ELM thicknesses, and mean differences were relatively small, ranging from −4 to 3 μm.
Prior studies in rodents and zebrafish have found good correlations between in vivo and ex vivo retinal measurements,18,22,35 although some inconsistency between the two methods from normal, damaged, and regenerative zebrafish retinas were reported. 22 Many factors may contribute to the discrepancy, including artifacts arising from histology procedures, such as tissue swelling, shrinking, and tearing.35–37 The retinal sublayers appear to be differentially affected by these processes, with IPL thickness being significantly different on SD-OCT and histology images, which may be related to the fact that it is a relatively large synaptic layer while the other measured layers (GCL and INL-ONL) have greater cell body content.
Despite the disparity in IPL thicknesses, GCL-ELM measurements were still very similar between the in vivo and ex vivo data. It is likely that SD-OCT imaging provides a more accurate depiction of the live zebrafish retina, due to its ability to acquire two- and three-dimensional information in a live unprocessed state. However, although SD-OCT provides a rapid and repeatable method for screening ocular phenotypes, the equipment is costly and it cannot replace histological techniques for imaging the morphology of the various retinal cells and how they interact, particularly the OS and RPE. In our study, we have used ex vivo data for comparison with SD-OCT retinal thickness measurements using the Diver software, which corrects for dispersion and optical effects of the system. However, for most accuracy it would be necessary to measure the axial length of the eye to correct for optical magnification in vivo. Such calibration is not required for assessing photoreceptor organization.
The adult zebrafish cone photoreceptor mosaic has a highly ordered spatial organization, consisting of four cone spectral subtypes packed into a reiterative lattice arrangement. 33 Examination of this retinal feature both ex vivo and in vivo has typically involved the use of fluorescent labelling and transgenic lines.33,38,39 In our study, we have used SD-OCT to capture high definition en face projections of the cone mosaic and demonstrated its ability to distinguish specific cone sublayers (Fig. 5). Visualization of the blue cone and rod photoreceptors was difficult using our equipment, and higher resolution systems will likely improve the ability to distinguish these cells. 26
Using Voronoi analysis, it was possible to quantitatively assess the regularity of the wild-type UV cone mosaic at different ages from SD-OCT images (Fig. 6). The percentage of six-sided Voronoi domains was around 70% at all three timepoints examined, indicative of regular hexagonal cone packing observed in healthy retinas. 30 Overall, our results suggest that using SD-OCT data to perform mosaic analysis could be a feasible and robust method for assessing longitudinal changes in photoreceptor organization in zebrafish disease models compared to wild type.
Zebrafish continue to grow in popularity as models of human degenerative retinal disorders. In addition, they offer a relatively inexpensive alternative to high maintenance mammalian models for assessing the safety and efficacy of new drug compounds and treatments. The burgeoning use of zebrafish will place increasing demand on developing rapid and cost-effective in vivo means of studying the zebrafish retina. SD-OCT is an excellent tool for noninvasive longitudinal examination of various aspects of the zebrafish ocular morphology, and the use of this technique is likely to greatly develop over the coming years.
Footnotes
Acknowledgments
The authors gratefully acknowledge the support of the National Institute for Health Research (NIHR) Biomedical Research Centre based at Moorfields Eye Hospital NHS Foundation Trust and UCL Institute of Ophthalmology. This study was supported by a multiuser equipment grant from the Wellcome Trust [099173/Z/12/Z] and grant funding from the Academy of Medical Sciences, Choroideremia Research Foundation USA and Fight for Sight UK.
Disclosure Statement
No competing financial interests exist.