




Abstract
Abstract
The objective of this study was to evaluate the permeability of small molecules into the brain via the blood–brain barrier in zebrafish and to investigate the possibility of using this animal model as a screening tool during the early stages of drug discovery. Fifteen compounds were used to understand the permeation into the brain in zebrafish and mice. The ratio of brain-to-plasma concentration was compared between the two animal models. The partition coefficient (Kp,brain), estimated using the concentration ratio at designated times (0.167, 0.25, 0.5, or 2 h) after oral administrations (per os, p.o), ranged from 0.099 to 5.68 in zebrafish and from 0.080 to 11.8 in mice. A correlation was observed between the Kp,brain values obtained from the zebrafish and mice, suggesting that zebrafish can be used to estimate Kp,brain to predict drug penetration in humans. Furthermore, in vivo transport experiments to understand the permeability glycoprotein (P-gp) transporter-mediated behavior of loperamide (LPM) in zebrafish were performed. The zebrafish, Kp,brain,30min of LPM was determined to be 0.099 ± 0.069 after dosing with LPM alone, which increased to 0.180 ± 0.115 after dosing with LPM and tariquidar (TRQ, an inhibitor of P-gp). In mouse, the Kp,brain,30min of LPM was determined to be 0.080 ± 0.004 after dosing with LPM alone and 0.237 ± 0.013 after dosing with LPM and TRQ. These findings indicate that the zebrafish could be used as an effective screening tool during the discovery stages of new drugs to estimate their distribution in the brain.
Introduction
D
It has been reported that the penetration is influenced by key parameters: Kp, which describes the concentration ratio of unbound drug in the brain and blood usually measured under steady-state conditions, and the brain to plasma concentration ratio (BP), which describes BBB permeability.4–6 BP provides quantitative information pertaining to the rate at which a specific compound will cross the BBB; but when used in isolation, it provides no assessment on the extent of drug permeation in the brain. Unfortunately, because of intrinsic difficulties in studying complex cellular interactions in vivo, the development of strategies to analyze the BBB in intact animal models has been limited. Hence, preclinical studies have instead focused on the pathophysiology of the BBB.
One suggested alternative to behavioral testing in rodents is the use of zebrafish (Danio rerio). As a vertebrate, zebrafish has conserved pharmacological targets and nervous system structures comparable to those of mammals, including humans.7–12 The use of zebrafish (Danio rerio) in drug discovery and developmental research is growing rapidly because of the numerous advantages, which include the small size, rapid generation, high productivity, and transparent eggs to perform high-throughput drug screening. In addition, adult zebrafish expresses the tight junction proteins ZO-1 and claudin-5 in the endothelial vascular cells, as well as the transporter protein permeability glycoprotein (P-gp)/ATP-binding cassette transporter subfamily B (ABCB) 4/5 within the brain.13–15
Therefore, the presence of claudin-5, ZO-1, and P-gp/ABCB 4/5 in the adult zebrafish brain demonstrates that the adult zebrafish possesses its own BBB similar to the human BBB.16–18 Moreover, the BBB of the zebrafish embryo starts working as early as 3 days postfertilization. 19 Compared to rodents, zebrafish is the smallest vertebrate model with a functional BBB and offers several advantages, such as higher fecundity, faster development, and lower quantities of test chemical required; moreover, the histological and ultrastructural similarities between the BBBs of zebrafish and humans are an added advantage.20,21
Therefore, the extent of permeability through the human BBB can safely be extrapolated from zebrafish BBB studies. Based on these characteristics, some BBB studies have been conducted in zebrafish models, in vivo. 22 However, no study has reported the correlation between mouse and zebrafish assays using a special oral gavage method.
In this study, we demonstrated that a zebrafish model could be comparable to the established mouse model in testing the permeability of small molecules that either cross or do not cross the BBB. We believe that this can contribute to the design of rational strategies for the screening of compounds with neurological indications and for the interpretation of results. In addition, it can aid in providing a system capable of predicting whether a novel compound might penetrate the human BBB.
Materials and Methods
Chemicals
This study used 15 compounds [caffeine (CAF), carbamazepine (CBZ), chlorpromazine (CPZ), donepezil (DPZ), simvastatin (SMV), loperamide (LPM), nilotinib (NTB), cetirizine (CTZ), LP533401 (LP), LDK-378, alectinib (ALT), KRCA-0391, KRCA-0476, KRCA-0605, and KRCA-0721] to assess BBB in zebrafish and mouse. Five CNS drugs (CAF, CBZ, CPZ, DPZ, and SMV) include antipsychotics, antiepilepsy, and anti-Alzheimer's disease medications, and are known to have variable penetration through the BBB utilizing different mechanisms.23–34 Four compounds (LPM, LP, NTB, and CTZ) include antidiarrheal, antidiabetes mellitus, anticancer, and antiallergy medications,35–38 and are known to not cross the BBB.39–43 CAF, CBZ, CPZ, CTZ, DPZ, LPM, NTB, and SMV were purchased from Sigma-Aldrich (St Louis, MO). LP, LDK-378, ALT, KRCA-0391, KRCA-0476, KRCA-0605, and KRCA-0721 were synthesized by the Center for Medicinal Chemistry at the Korea Research Institute of Chemical Technology (KRICT) (Fig. 1). Tariquidar (TRQ) was purchased from MedKoo Biosciences (Chapel Hill, NC). All chemicals and reagents used in this study were of high-performance liquid chromatography (HPLC) grade or better, and were used without further purification.
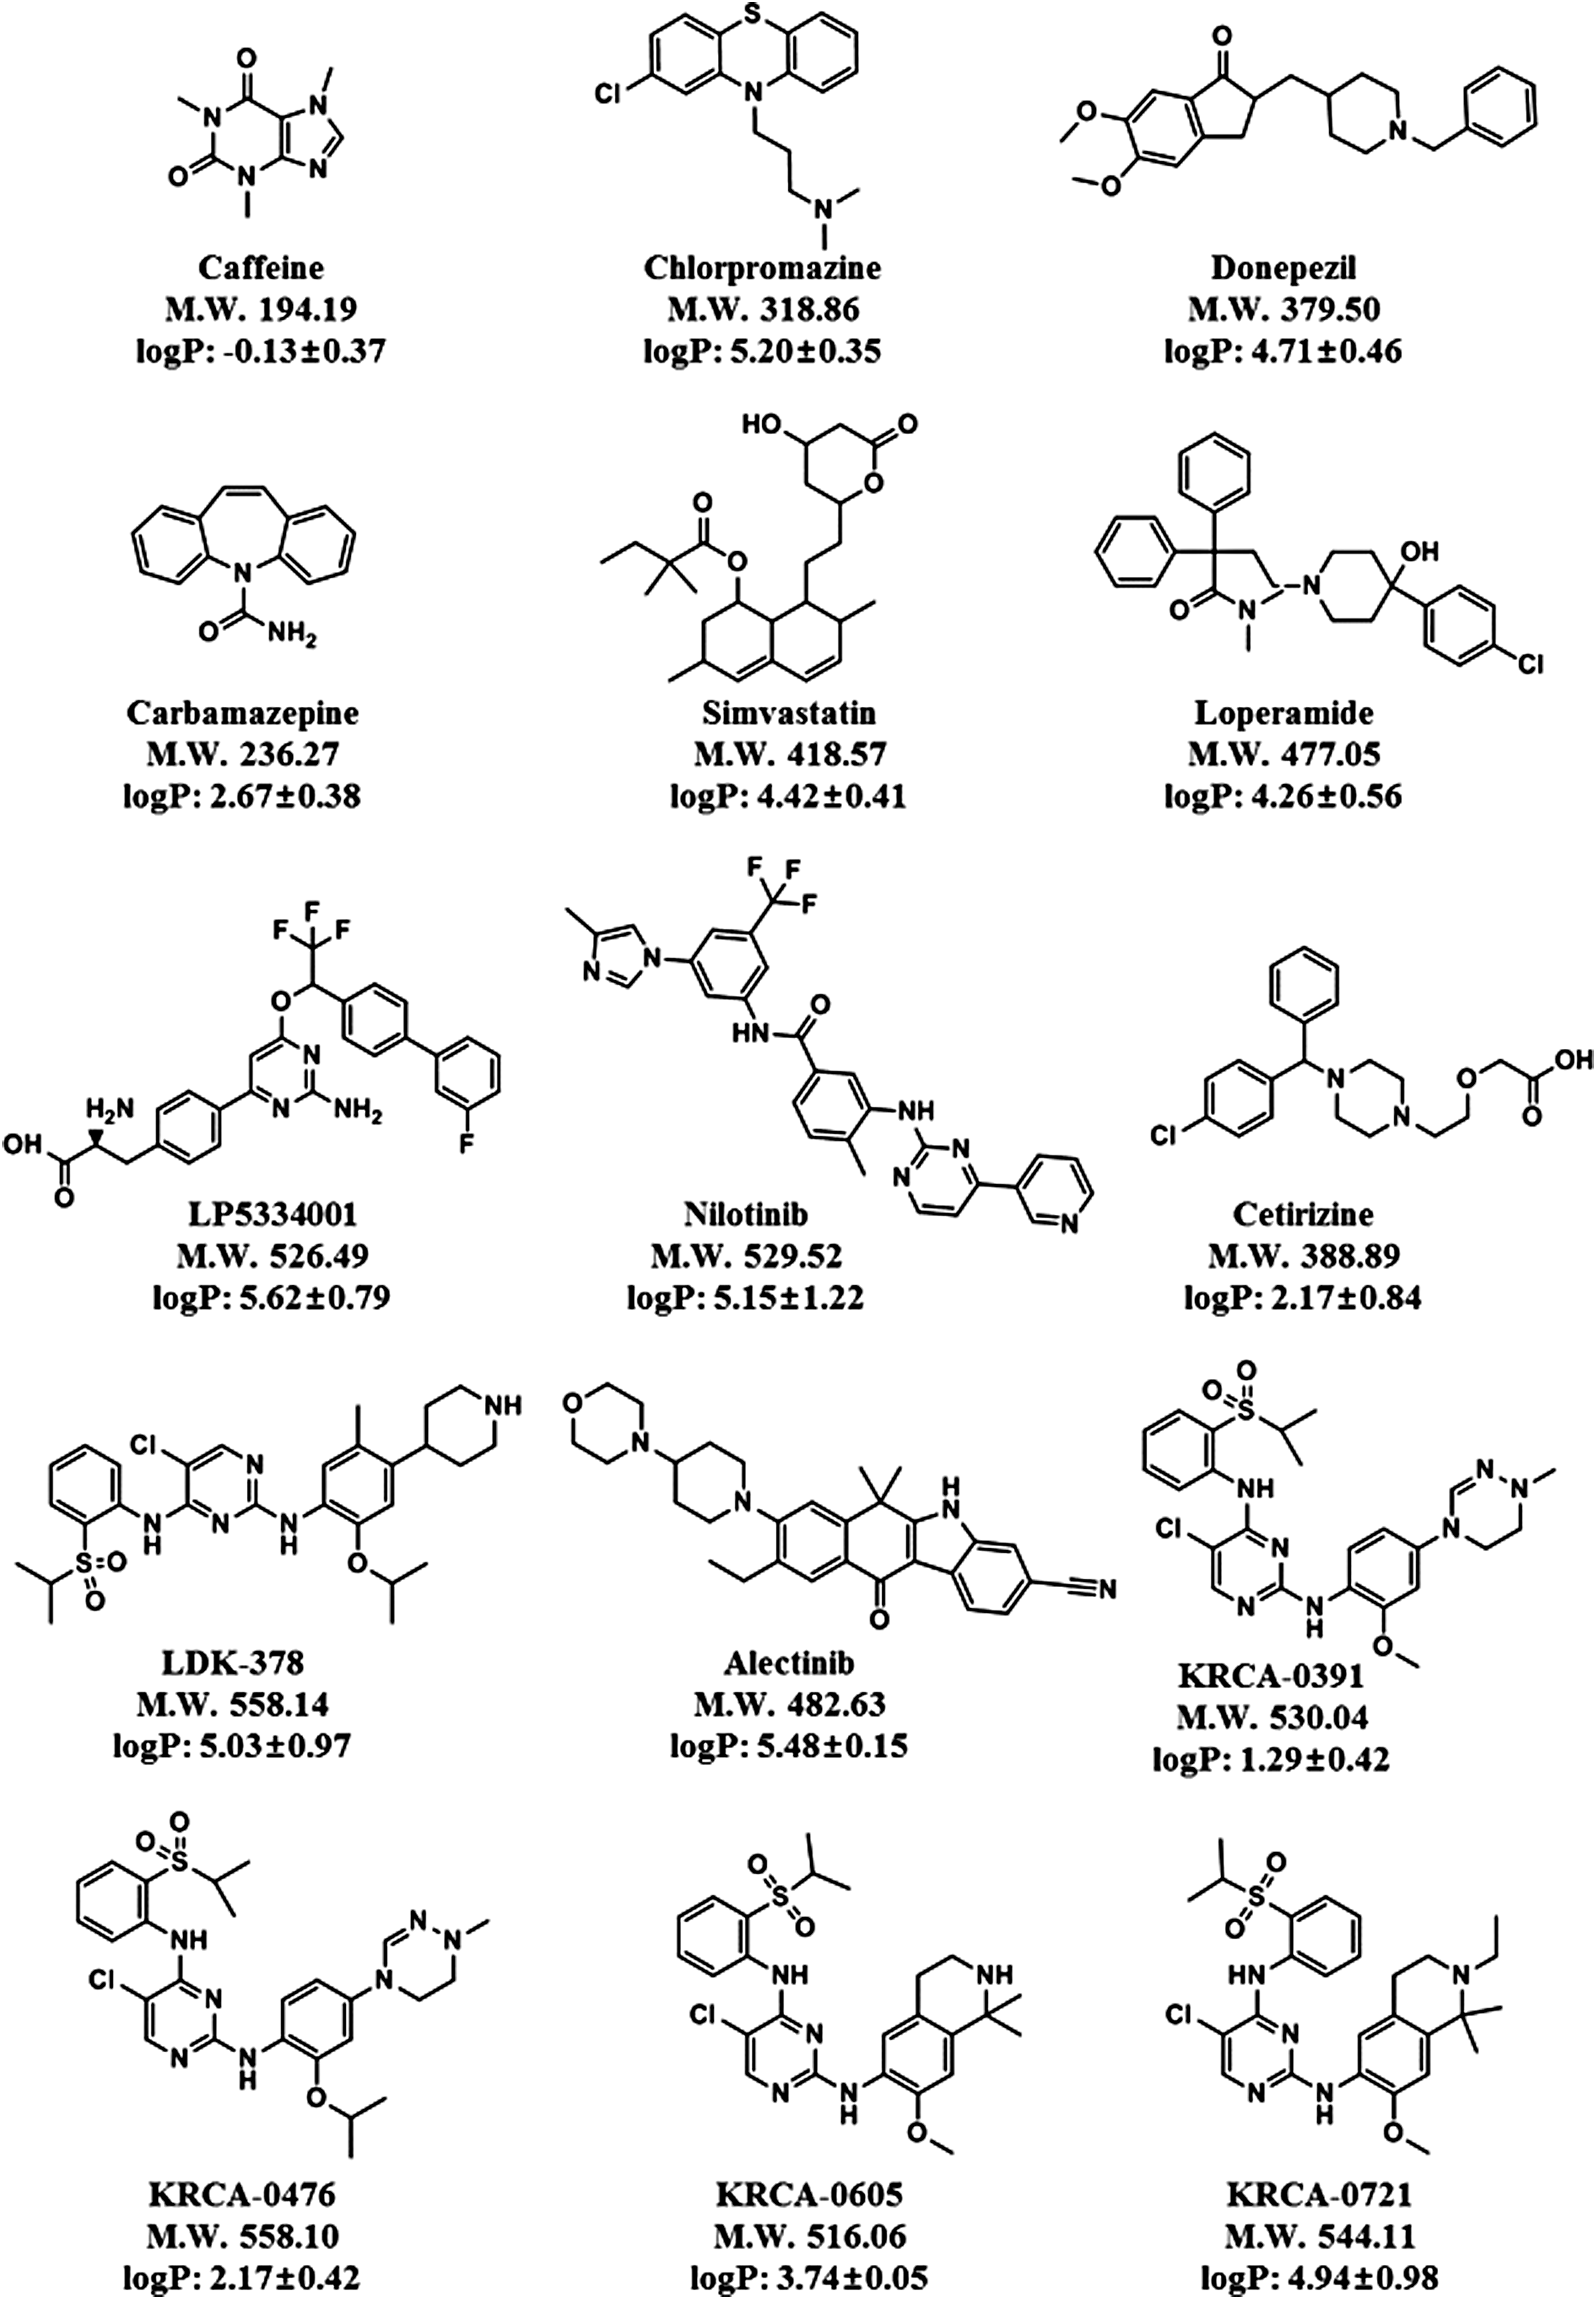
Chemical structures of the 15 compounds used to study permeability through the BBB in zebrafish. BBB, blood–brain barrier.
Animals
Adult male zebrafish of the Danio rerio strain, weighing approximately 0.26 g, were used in this study. The animals were maintained under the 14/10-h light/dark cycle at 28 ± 1°C in an aquatic recirculation system (Genomic Design Bioengineering Company, Daejeon, Korea). They were fed thrice daily with Artemia nauplii and fasted overnight before the experiments. Male ICR (Institute for Cancer Research) mice (6 weeks old) were purchased from Orient Bio, Inc. (Gyeonggi-do, Korea) and maintained in a case at a temperature of 23 ± 2°C with a humidity of 50% ± 10% under 12/12-h light/dark cycles with standard food (Rodent Chow, Purina Co., Korea) and water. All experimental protocols involving the animals used in this study were reviewed and approved by the Animal Care and Use Committee of the Korea Research Institute of Chemical Technology, according to the National Institutes of Health Publication Number 85–23 (revised 1985) in Principles of Laboratory Animal Care.
Animal experiments
Oral administration (p.o) of LPM to zebrafish
Three zebrafish were randomly assigned from the water tank based on the designated time, and the dosing method (oral gavage, p.o) was applied as described previously.44,45 Briefly, a moistened sponge was placed on the flat surface of the 1-L water tank, and the adult fish were slightly anesthetized with 0.4% tricaine. Each fish was moved on to the sponge in a vertical position, following which the dosing solution was orally administered with LPM (10 mg/kg) using a micropipette connected to a SILASTIC laboratory tubing (internal diameter, 0.64 mm; outside diameter, 1.19 mm). The fish were then individually placed into a tank of fresh water and incubated until sample collection. After the fish were separately sacrificed at the designated times (0.25, 0.5, 1, 2, 4, and 6 h), 2 μL of blood was carefully collected from the regions of the inferior vena cava and dorsal aorta using a micropipette with a heparinized tip. The brain samples were rinsed with cold saline and the wet weights were determined. The samples were then placed in four volumes (w/v) of phosphate-buffered saline (PBS, pH 7.4) and homogenized with a sonicator (Ultrasonic processor VCX-130; Sonics & Materials, Inc., Newtown, CT). The blood samples and brain homogenates were stored at −80°C until further analysis.
Estimation of brain to blood concentration ratio in zebrafish
The zebrafish were orally administered with each of the 15 compounds at different doses of 5 or 10 mg/kg optimized vehicle (Table 1) and then incubated in the 1-L tank of fresh water as described earlier. After the fish were separately sacrificed at designated times (0.167, 0.25, 0.5, or 2 h) after the dosing, the blood was collected and the brain was isolated as described earlier. The brain samples were rinsed with cold saline followed by wet-weight measurements. The samples were then placed in four volumes (w/v) of PBS (pH 7.4) and homogenized with an ultrasonicator. The blood samples and brain homogenates were stored at −80°C until further analysis.
ALT, alectinib; CAF, caffeine; CBZ, carbamazepine; CPZ, chlorpromazine; CTZ, cetirizine; DMSO, dimethyl sulfoxide; DPZ, donepezil; LP, LP533401; LPM, loperamide; MC, methylene cellulose; MRM, multiple reaction monitoring; NTB, nilotinib; PEG400, polyethylene glycol 400; p.o., oral administration or per os; SMV, simvastatin.
Estimation of brain to plasma concentration ratio in mice
Male ICR mice were administered orally (p.o.) with each compound at different doses of 5 or 10 mg/kg (1 or 2 mg/mL in optimized vehicles as shown in Table 1; dosing solution of 125 μL per 25 g mouse). The animal was sacrificed at designated times (0.167, 0.25, 0.5, or 2 h) after the administration, and blood and brain tissues were collected. The brain samples were rinsed with cold saline and the wet weights were determined. The samples were then placed in four volumes (w/v) of PBS (pH 7.4) and homogenized with an Ultra-Homogenizer (Ultra-Turrax T25 basic; IKA, Staufen, Germany). The plasma samples and brain homogenates were stored at −80°C until further analysis.
Inhibition of P-gp in zebrafish and mice
Zebrafish and male ICR mice were orally administered with 10 mg/kg TQR (P-gp inhibitor). After 2 h, LPM (P-gp substrate) was administered to each animal at a dose of 10 mg/kg. The animals were sacrificed 30 min after the administration of LPM, and blood and brain tissues were collected. The brain samples were rinsed with cold saline and the wet weights were determined. The samples were then placed in four volumes (w/v) of PBS (pH 7.4) and homogenized with an Ultra-Homogenizer (Ultra-Turrax T25 basic; IKA). The plasma samples and brain homogenates were stored at −80°C until further analysis.
Analytical procedure for the determination of compounds
The concentrations of each compound in the blood (i.e., zebrafish), plasma (i.e., mouse), and brain homogenates were determined by a specific liquid chromatography tandem-mass spectrometry (LC-MS/MS) assay using disopyramide as an internal standard (IS). An aliquot (38 μL for blood and plasma or 36 μL for brain homogenate) of the IS solution (concentration 5 ng/mL in acetonitrile) was added to 2 μL of plasma, 2 μL of blood, or 4 μL of brain homogenate. After vortexing for 10 min, the extracts were centrifuged (13,000 rpm, 5 min, 4°C). Next, 5 μL of the supernatant was injected onto the analytical column. Sample analyses were carried out with a 1200 series HPLC system (Agilent Technologies, Santa Clara, CA) coupled to an Agilent 6460 triple quadruple mass spectrometry (Agilent Technologies) and equipped with a turbo-electrospray interface in positive ionization mode for LC–MS/MS analysis. A mixture of acetonitrile and 10 mM ammonium formate (8:2, v/v) at a flow rate of 0.3 mL/min was used as the mobile phase. Separation was accomplished using a Kinetex C18 column (50 mm × 2.1 mm i.d., 2.6 μm; Phenomenex, Torrance, CA) using a guard cartridge system (SecurityGuard C18; 4 mm × 20 mm i.d.; Phenomenex). Quantification was carried out using multiple reaction monitoring at each optimized m/z value (data not shown). The optimized instrument conditions were as follows: source temperature, 350°C; gas flow, 10 L/min; nebulizer, 45 psi; sheath gas temperature, 350°C; and sheath gas flow, 11 L/min. The peak areas for all components were automatically integrated using MassHunter Quantitative Analysis (Ver. B.06; Agilent Technologies).
Pharmacokinetic analysis
The areas under the plasma concentration–time curve (AUC) and the first moment curve were calculated by the linear trapezoidal method extrapolated to infinity. The terminal half-life (t1/2) was calculated to be 0.693/λ, where λ represents the slope of the log-linear portion of the concentration–time profile. The peak concentration (Cmax) and time to reach Cmax (Tmax) were obtained directly from individual plasma concentration–time profiles. In this study, brain to blood partition coefficient (Kp,brain) for compounds in the zebrafish was calculated by dividing the mean AUCbrains (area under the brain concentration–time curve) by the mean AUCbloods (area under the plasma concentration–time curve) after administration. The Kp,brain,30min was calculated by dividing the concentration in the brain by the concentration of blood (in zebrafish) or plasma (in mouse) at 30 min after the administrations. To obtain the above pharmacokinetic parameters, all blood, plasma, and tissue concentration–time profiles were analyzed by a noncompartmental method using the nonlinear least squares regression approach on the WinNonlin® program (Pharsight, Mountain View, CA).
Statistical analyses
All data are expressed as mean ± standard deviation. Statistical analyses were performed using unpaired t-test. A value p < 0.05 was accepted as denoting a statistical significance.
Results
To evaluate drug penetration into the brain in zebrafish, we selected various known CNS drugs, including antipsychotics, antiepilepsy, and anti-Alzheimer's disease, and several anticancer compounds under development in KRICT (Fig. 1). To clarify the zebrafish BBB pharmacokinetic model by oral gavage method (p.o), the LPM was administrated with 10 mg/kg in adult zebrafish. The blood concentration–time profiles after oral administration of 10 mg/kg LPM in zebrafish are shown in Figure 2. The estimated pharmacokinetic parameters for loperamide are shown in Table 2. A standard moment analysis indicated that the loperamide AUClast and AUCinf were 1652 ± 976 h·ng/mL and 2312 ± 1156 h·ng/mL, respectively. The peak concentrations (Cmax) for loperamide were 1783 ± 869 ng/mL, whereas the time to reach Cmax (Tmax) was 0.400 ± 0.129 h. The AUClast and AUCinf for loperamide in the brain were determined to be 320 ± 248 h·ng/mL and 488 ± 308 h·ng/mL, respectively, after oral administration at a dose of 10 mg/kg in zebrafish. The ratio of the AUCinf for loperamide in the brain to that in the blood (Kp,brain) was estimated to be 0.194 in zebrafish.
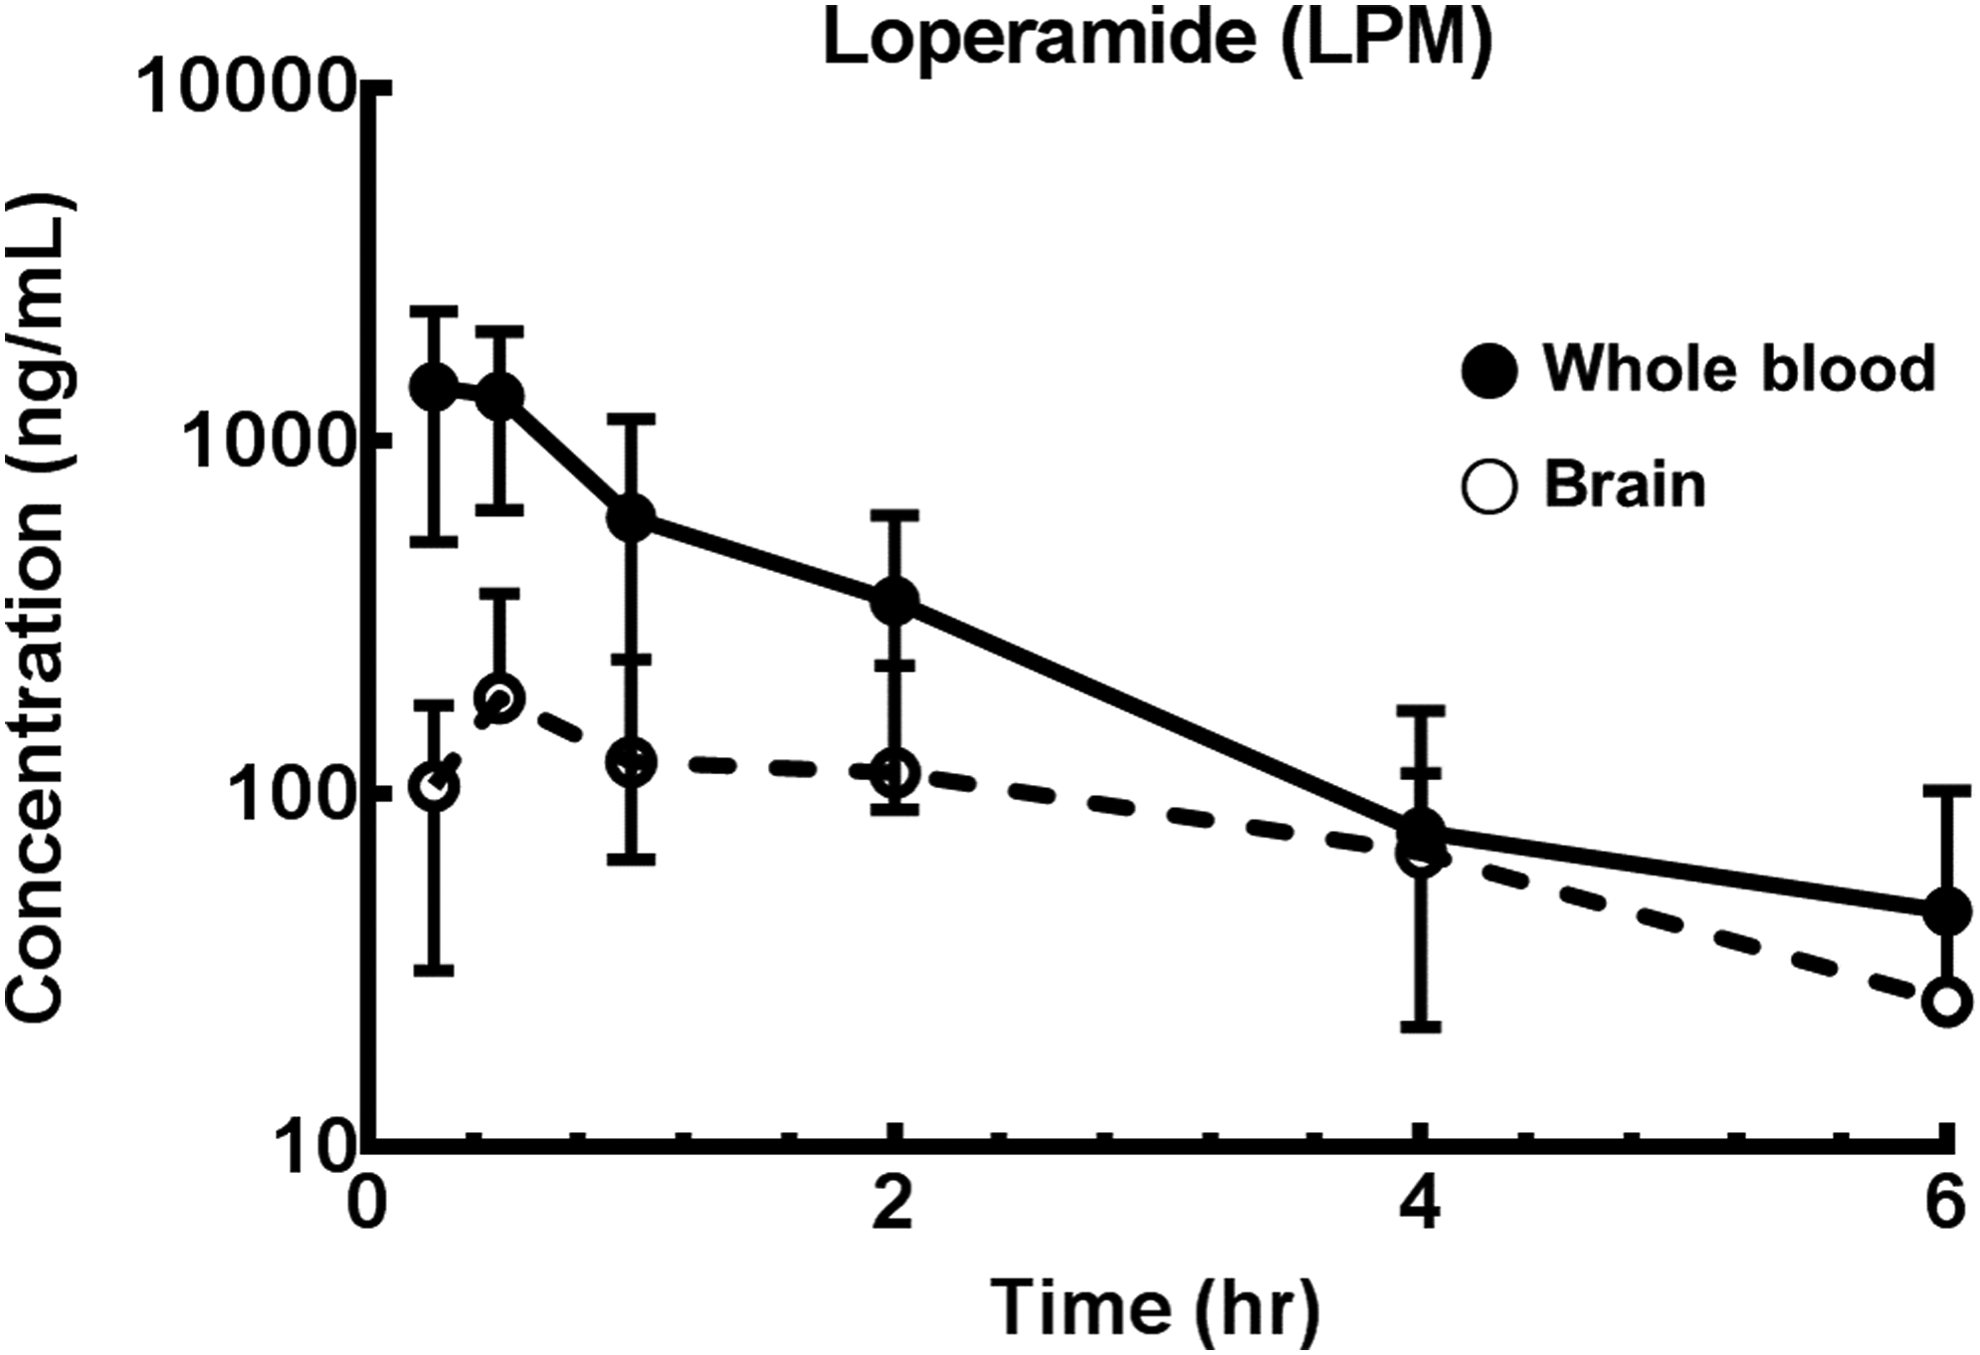
Whole blood and brain concentration–time profiles for LPM in zebrafish after oral administration. The closed and open circles represent the loperamide concentration in whole blood and brain, respectively. Each point represents the mean ± SD (n = 41). LPM, loperamide; SD, standard deviation.
The data represent mean ± SD (n = 41).
SD, standard deviation.
To determine the potential involvement of P-gp in the delivery of LPM via the BBB, drug–drug interaction studies were carried out in zebrafish and mice by oral administration. The Kp,brain,30min of LPM was determined to be 0.099 ± 0.069 after dosing with LPM alone, but the value was changed to 0.191 ± 0.105 after dosing with LPM and TRQ in zebrafish (Fig. 3A). In mouse, the Kp,brain,30min of LPM was determined to be 0.080 ± 0.004 after dosing with LPM alone, but the value was increased to 0.237 ± 0.013 after dosing with LPM and TRQ, as shown in Figure 3B.
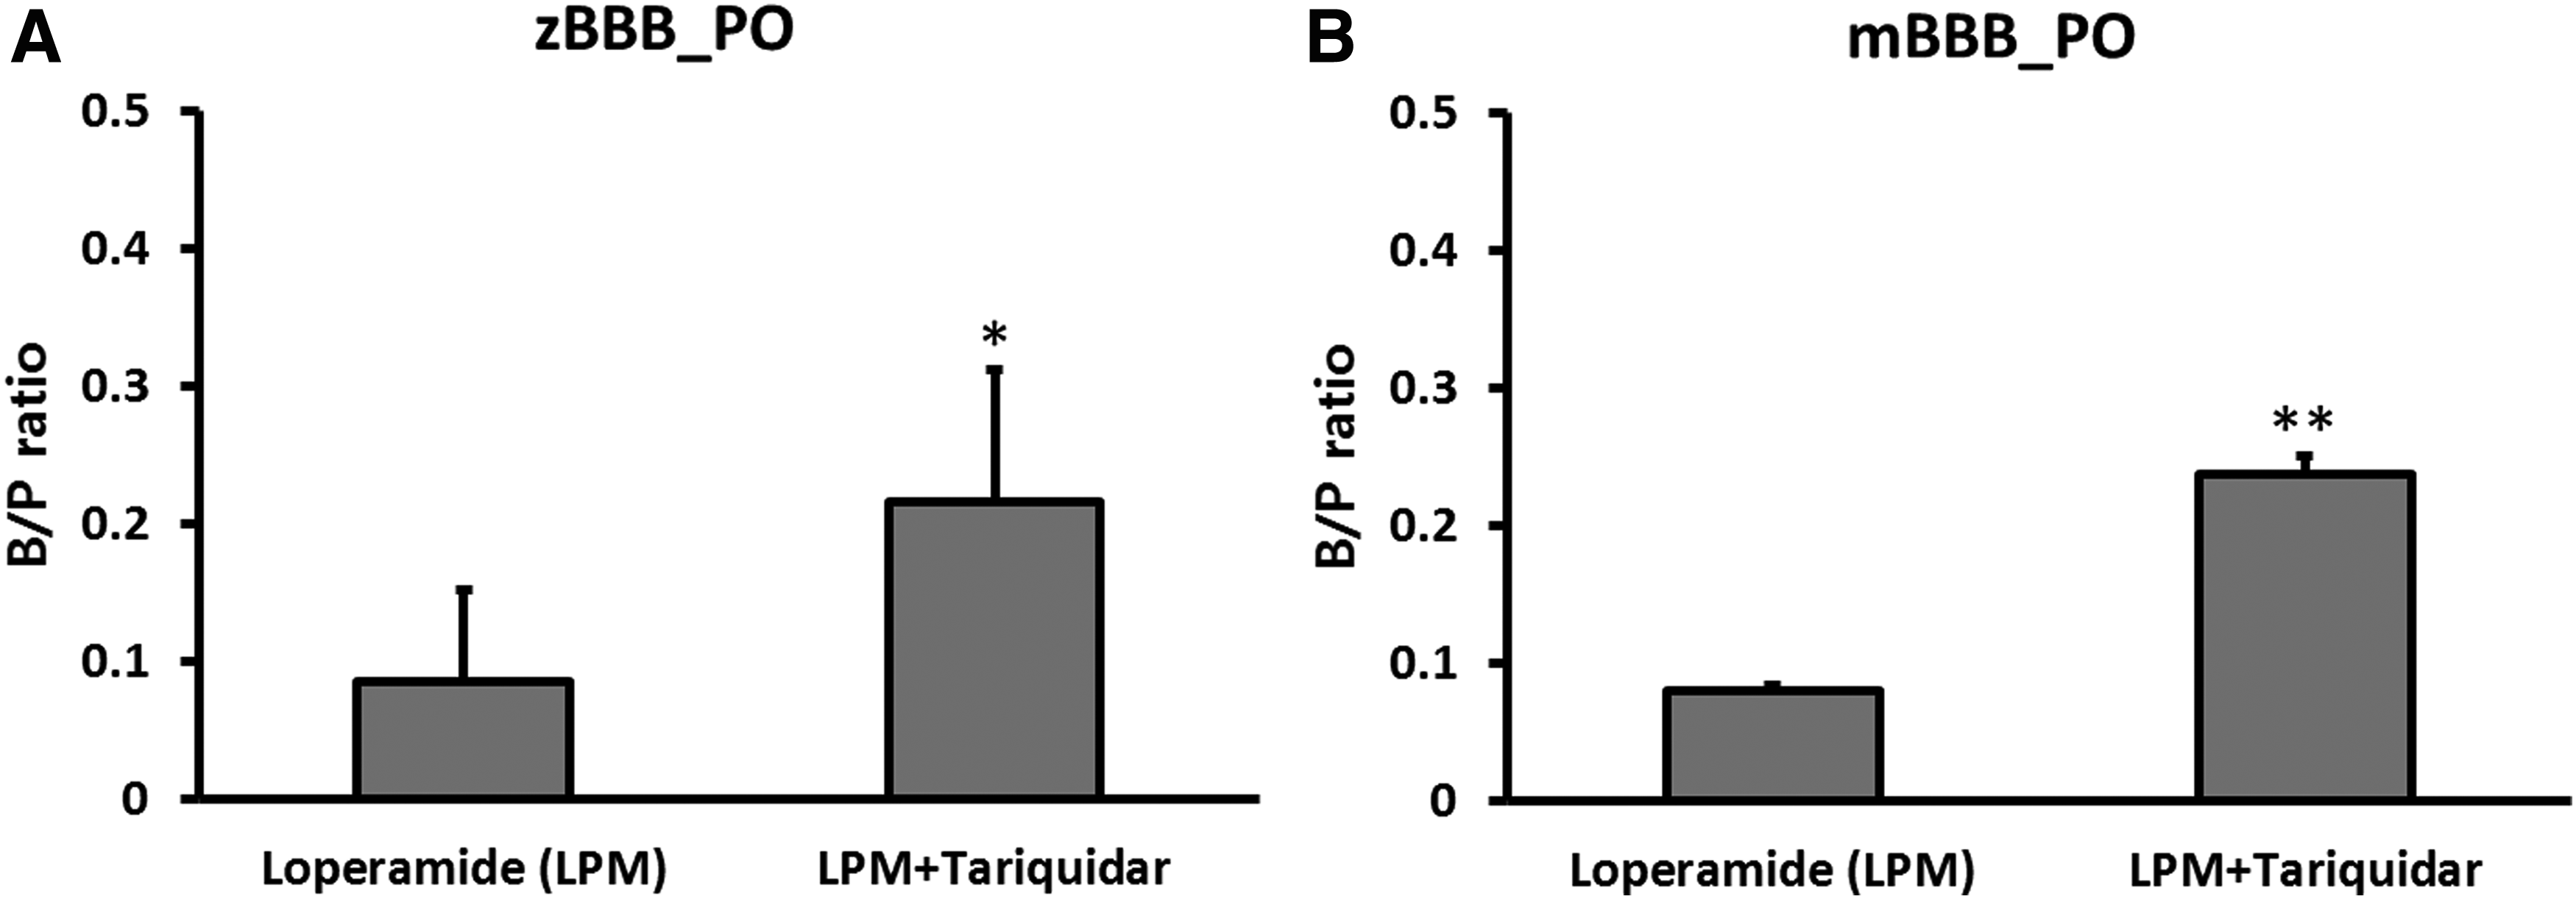
The Kp,brain value of loperamide with or without tariquidar in
For known CNS drugs (CAF, CBZ, CPZ, DPZ, and SMV) that cross the BBB in human, the Kp,brain was estimated using the concentration ratio at 0.167–0.5 h after the oral administrations; they were found to range from 0.85 (CAF) to 5.68 (CPZ) in zebrafish, and from 0.97 (CAF) to 11.8 (CPZ) in mouse (Table 3). In addition, LPM, LP, NTB, and CTZ that do not cross the BBB in human, Kp,brain was shown to range from 0.099 (LPM) to 0.21 (LP) in zebrafish, and from 0.08 (LPM) to 0.10 (LP) in mouse (Table 3). The Kp,brain values of the unknown compounds were found from 0.19 (LDK) to 3.00 (KRCA-0721) in zebrafish, and from 0.10 (KRCA-0476) to 0.39 (KRCA-0605) in mouse (Table 4). The Kp,brain obtained from zebrafish and mouse after oral administration was correlated, as shown in Figure 4A and B.
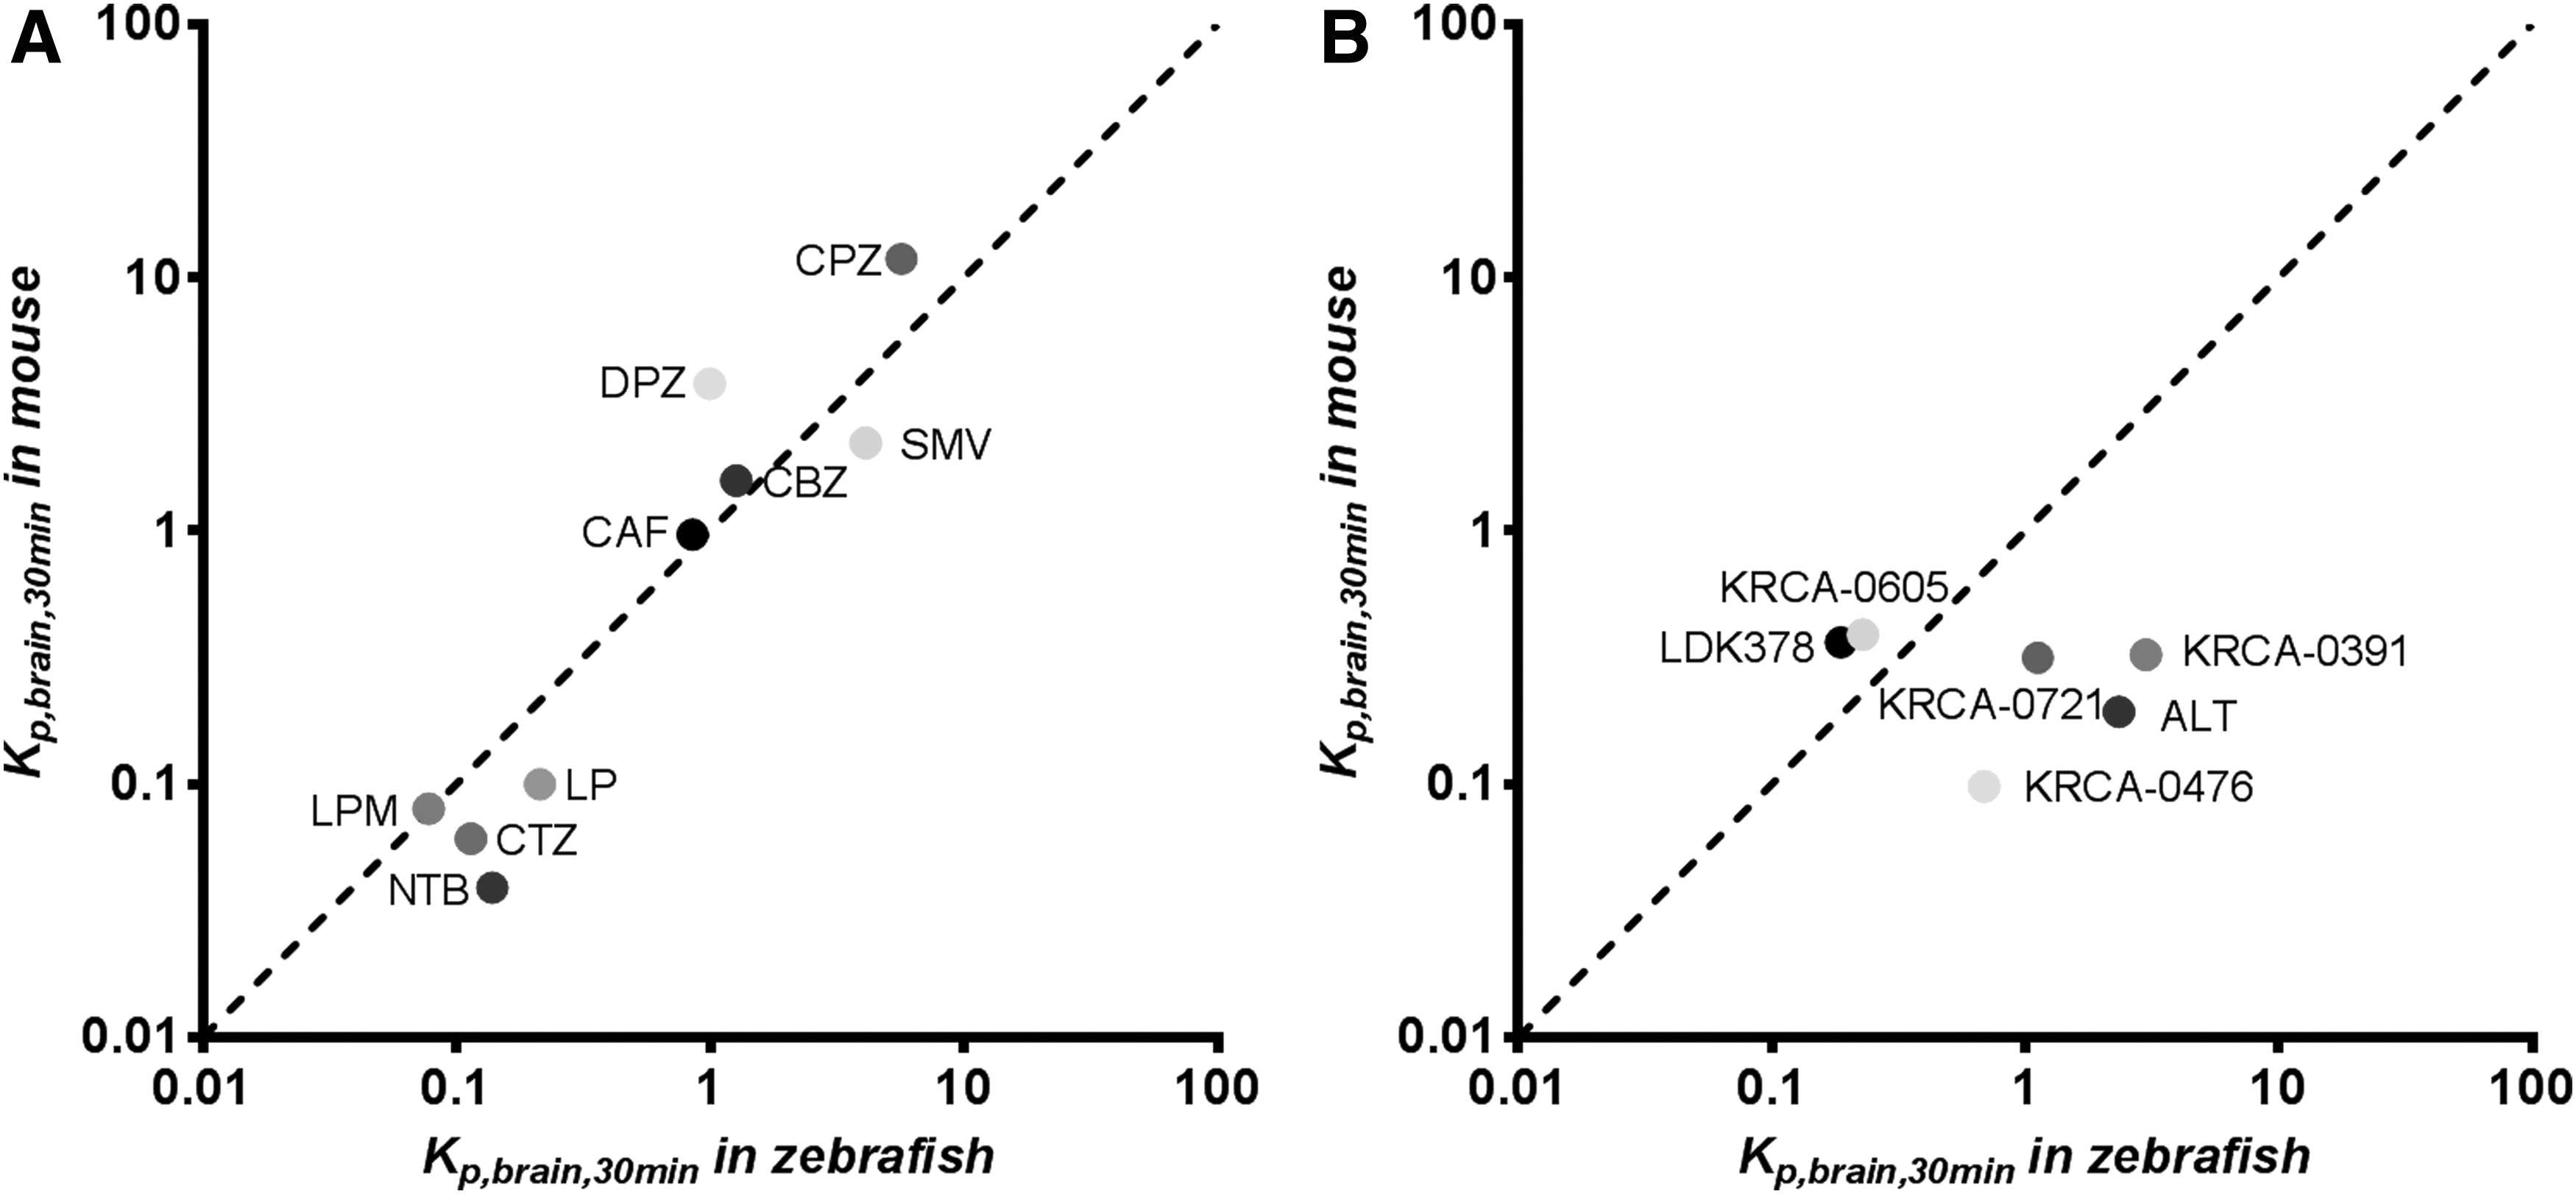
The correlation of Kp,brain for known compounds
The data represent mean ± SD (mouse, n = 3; zebrafish, n = 5–6).
BBB, blood–brain barrier.
The data represent mean ± SD (mouse, n = 3; zebrafish, n = 5–6).
Discussion
Zebrafish are currently being used as a powerful screening model for testing the efficacy and toxicity of new drugs. Unfortunately, very few pharmacokinetic studies for BBB using this model have been conducted so far owing to the difficulties associated with assessing the accurate amounts for oral administration, performing intravenous injections, and obtaining enough samples of whole blood or tissues to determine their concentrations. In many previous studies, the method of adding the drug into the water bath for administration to zebrafish was used. Emersion of the zebrafish in drug-treated water is a common technique; however, we used oral administration recently introduced in a study by Collymore et al. 44 A downside to this technique is that it is not as amenable to high-throughput analysis. The merit is that the new method requires a smaller amount of test drugs when compared with previous methods. Besides, we used in the present study, whole blood instead of plasma to measure the drug concentration in zebrafish, because the amount of whole blood collected from one zebrafish (2 μL) is too small to separate the plasma from whole blood. Although pharmacokinetic studies usually use the drug concentration in plasma to understand the behavior of drugs in the body, our supplementary study using mice has shown that the drug concentrations in plasma has similar values to ones in whole blood (Supplementary Table S1). In this study, Kp brain, describes the concentration ratio of unbound drug in the brain and blood usually measured under steady-state conditions, and BP, the brain–plasma ratio, describes BBB permeability.4–6 According to FDA approval, the cutoff criteria of therapeutic drugs for psychotic disorders are any drug with the Kp brain value more than 0.3 is classified as BBB positive, and one with Kp brain value <0.3 is BBB negative. 46
To validate this methodology in our laboratory, the administration of the oral dose same as mice and the sampling of whole blood and tissues were performed. The concentrations determined were validated using the LC–MS/MS systems before this study (data not shown).
In this study, the pharmacokinetics of LPM was characterized after oral administration in zebrafish. Whole blood was collected from the regions of the inferior vena cava and dorsal aorta, and LPM concentration was determined to characterize the systemic pharmacokinetics. In case of LPM, the brain to plasma partition coefficient (Kp,brain) was calculated from the ratio of AUCs of the concentrations in brain and blood and was found to be <0.3, indicating poor BBB penetration (Table 2).
Efflux transporters (P-gp) may be mediated in this uptake into the brain in zebrafish because LPM is a well-known P-gp substrate.5,30,39,40 Therefore, in this study, we performed in vivo transport studies to understand the P-gp transporter-mediated behavior of LPM in zebrafish. It is reported that the P-gp transporter is expressed in the BBB and intestine of zebrafish.47,48 As a result, the Kp,brain was increased in the zebrafish following dosing with TRQ as a P-gp inhibitor (Fig. 3A) similar to that shown in the mouse (Fig. 3B). This finding implies that in in vivo experiments, zebrafish can be used to evaluate the transport of drugs, including P-gp substrates through the BBB, and therefore can be used successfully instead of other rodents.
The objective of this study was to evaluate the permeability of small molecules into the brain via the BBB in zebrafish and to investigate the possibility of using this animal model as a screening tool during the early stages of CNS drug discovery. To investigate the correlation of uptake into the brain in zebrafish and mouse with nine compounds that either cross or do not cross the BBB in human, the Kp,brain obtained from zebrafish was compared with that of the mouse. We tested well-known CNS drugs (i.e., CAF, CPZ, DPZ, CBZ, and SMV) that are antipsychotics, antiepilepsy, and anti-Alzheimer's medications, and are known to have variable penetration through the BBB utilizing different mechanisms.23–34 We also tested four drugs (LPM, LP, NTB, and CTZ) that are antidiarrheal, antidiabetes mellitus, anticancer, and antiallergy medications, and are known to not cross the BBB.30,35–43 Our data showed the Kp,brain values of CAF, CBZ, SMV, LPM, LP, NTB, and CTZ were similar between zebrafish and mice, although those of DPZ and CPZ were higher in mice than in zebrafish (Fig. 4A). In this study, the Kp brain was estimated by ratios of the concentrations at one point time (after Cmax in whole blood) after oral administration in both zebrafish and mouse, although it was more appropriate to compare the AUCs. The simple experiments will be useful and can be tested quickly, and the information obtained can be used to understand the distribution of the drug in the brain, especially with relation to its efficacy or toxicity. Therefore, in this screening model, we accepted arbitrarily to four times of difference in Kp brain values of some drugs between zebrafish and mice. This was because the purpose of this study was to exploit the zebrafish to evaluate the uptake of compounds into the brain during the screening stage of drug discovery. In addition, we tested the six novel anaplastic lymphoma kinase (ALK) inhibitors (LDK, alectinib, KRCA-0391, KRCA-0476, KRCA-0605, and KRCA-0721), which are in the discovery or development stage. Since a promising result of novel ALK inhibitors was recently reported in patients with ALK-positive or c-ros oncogene-1 (ROS-1)-positive advanced nonsmall-cell lung cancer, including patients with brain metastases, 49 we tested the brain distribution of these ALK inhibitors in zebrafish as well as mice. However, some compounds (i.e., ALT, KRCA-0476, and KRCA-0721) did not show good correlation (Fig. 4B). It is thought that several factors such as biological or physicochemical properties related to permeability due to specificity of unknown compound affect organs other than the brain in mice and zebrafish.50–52 Especially, these differences in the three compounds could be caused from biological factors such as influx and/or efflux transporters expressed differently in BBB between zebrafish and mouse. If the mediated transporters of each compound should be characterized, it is not showing the applicability of zebrafish as screening tools. Therefore, only overall correlation was shown in this study and the predicted value using zebrafish can be used as cutoff value by objective of each experiment.
The partition coefficient (Kp,brain), estimated using the concentration ratio at designated times (10, 30, or 120 min) after oral administrations, ranged from 0.099 to 5.68 in zebrafish and from 0.080 to 11.8 in mice. As a result, there was a correlation between Kp,brain obtained from zebrafish and mouse, suggesting that the zebrafish can be used to estimate Kp,brain in humans as well. Calculation of the tissue to partition coefficient is made by isolating the tissue from the test subject, which is difficult to perform in humans without the use of radiolabeled compounds. Therefore, animal studies or in silico prediction methods of Kp,tissue in humans have been used to predict the efficacy or toxicity. In addition, physiologically based pharmacokinetic modeling and simulations have also been used for many new drugs. The prediction of drug concentration in the brain must be useful in clinical conditions such as Alzheimer's and Parkinson's diseases.
In conclusion, our results demonstrate that the zebrafish model can be effectively used as a screening model for the estimation of drug distribution in the brain during the new CNS drug discovery process.
Footnotes
Acknowledgment
This work was supported by a grant from the Ministry of Trade, Industry and Energy, Korea (grant no. 2016-10063396).
Disclosure Statement
No competing financial interests exist.
References
Supplementary Material
Please find the following supplemental material available below.
For Open Access articles published under a Creative Commons License, all supplemental material carries the same license as the article it is associated with.
For non-Open Access articles published, all supplemental material carries a non-exclusive license, and permission requests for re-use of supplemental material or any part of supplemental material shall be sent directly to the copyright owner as specified in the copyright notice associated with the article.
