
Abstract
Abstract
The zebrafish is becoming a popular model organism for studying numerous biological phenomena. Among these are brain function and behavior, including social behavior. Although usually neglected, few studies have already demonstrated that even trivial factors, such as features of the holding water may alter zebrafish behavior. In this study, we employed a 2 × 2 between-subject experimental design, exposing zebrafish to water of either high or low salinity and with chemosensory/olfactory cues of conspecifics either present or absent (while maintaining pH, temperature, nitrate, nitrite, and ammonia levels constant). We presented moving images of conspecifics to experimental zebrafish and analyzed their behavioral responses using video tracking. We found significant interaction between salinity and olfactory cues. For example, zebrafish exposed to their home tank water (high salinity with chemosensory/olfactory cues present) stayed significantly closer to the bottom of their tank compared with fish exposed to the other water conditions, and fish exposed to water with chemosensory/olfactory cues significantly reduced their turns compared with fish exposed to water without chemosensory/olfactory cues. These differences signify the impact environmental factors, for example, fluctuations in salinity level and presence or absence of chemosensory/olfactory cues, may have on zebrafish behavior. We conclude that maintaining stable environmental conditions and specifying and reporting them precisely are important for reducing error variation and for making results across independent studies more comparable.
Introduction
T
Social behavior of zebrafish may be influenced by a variety of factors, including characteristics of the experimental versus stimulus fish with which the experimental subject interacts, for example, sex, body size, stripe pattern, and pigmentation.14–16 Behavioral responses to social stimuli, or in general, the behavior of the zebrafish in most experimental conditions, may be also influenced by fear and/or anxiety, which may be dependent upon again a large number of factors, including the physical parameters of the test environment, handling procedure, housing conditions, individual differences, chronic or acute isolation, just to mention a few.17–22 The role of environmental factors on the behavior of many other species is also well documented in the literature.23–26 Controlling factors that influence zebrafish behavior may allow one to reduce experimental error variation, and thus may increase statistical power. In addition, knowing about the importance of certain environmental factors and providing a precise report on them would allow investigators to compare their results across studies and would minimize replicability issues that plague both animal as well as human studies. 27
Recently, Tran et al. 28 have shown that home tank water versus novel water differentially affects alcohol-induced locomotor activity and anxiety-related behaviors in zebrafish. Parker et al. 29 studied the effect of housing conditions, and, among other factors, also found that changing the holding water before testing significantly affected group-housed but not individually housed fish tested in a novel environment. These studies highlight the importance of controlling all possible environmental factors, including the water of the holding tanks as well as the water of the testing tanks. However, currently, it is unknown what aspects of the water may influence the behavior of zebrafish.
For the experimental tanks, most investigators use fresh “system water,” which is obtained by first filtering municipal water using reverse osmosis, and subsequently reconstituting the appropriate salinity by adding sea salt.22,30,31 This system water is completely devoid of all olfactory or chemosensory cues (detectable by the olfactory and/or the taste sensory apparatus of the fish). The fresh system water may also be different in salinity from the home tank water in which experimental zebrafish are regularly housed, because the latter is replenished with a variety of dissolvable compounds originating from the food delivered to the fish multiple times a day. In the current study, we investigated the potential effects of these two factors, salinity and chemosensory cues. We exposed our experimental zebrafish to either water, which had high salinity levels and chemosensory cues present, water with low salinity and with chemosensory cues present, novel water from an isolated reservoir with high salinity and with chemosensory cues absent, or novel water from an isolated reservoir with low salinity with chemosensory cues absent, a 2 × 2 between-subject experimental design. To dissociate the potential effects of salinity and chemosensory cues, we attempted to maintain all other features, including water chemistry parameters, constant across these four conditions. To investigate the effects of our treatment, we employed a simple yet sophisticated behavioral paradigm designed to elicit a range of behavioral responses, including novelty-induced fear/anxiety and exploratory behavior, as well as social behavior induced by presentation of an animated group of conspecific images.16,32,33 The simplicity of the paradigm allows one to test a relatively large number of experimental subjects quickly, thereby reducing potential time-dependent error variation. This paradigm is simple yet sophisticated, because it utilizes computerized methods to induce as well as to quantify a variety of behavioral responses. The combination of simplicity and sophistication, we hope, will allow us to reveal potential functional changes in the brain induced by our treatment.
Materials and Methods
Animals and housing
Adult zebrafish of the AB strain were obtained from the Zebrafish International Research Center (ZIRC, Eugene, OR), and were bred and housed in the Vivarium of the University of Toronto Mississauga (Mississauga, Ontario). We chose AB fish for our current study because this is the most frequently studied zebrafish strain. Our experimental zebrafish were third-generation offspring of the AB founders. Water quality for housing tanks was maintained at a stable pH (7.0), conductivity (600 μS), temperature (28°C), nitrate (0 ppm), nitrite (0 ppm), and ammonia (0 ppm). We tested a total of 69 fish, n = 17–18 for each condition of the 2 × 2 between-subject experimental design. All zebrafish tested were adults (12 months of age) and the sex composition of all our experimental groups was ∼50%–50% male–female. All our fish were housed in a recirculating filtration aquaculture rack system (Aquaneering, Inc., San Diego, CA) equipped with mechanical, biological, and activated carbon (chemical) filtration and a UV sterilizing unit. The water used in the rack and test tanks was reverse osmosis purified and reconstituted to the appropriate salt concentration by adding sea salt (Instant Ocean; Big Al's Aquarium Warehouse Outlets, Mississauga, ON, Canada). The water was maintained at a temperature of 28°C by thermostat-controlled heaters. Zebrafish were kept on a 12-h light–12-h dark cycle with lights on at 8:00 h. All zebrafish were fed ground flake food (a mixture of 3:1 TetraMin flake, Tetra Melle, Germany, and Spirulina; Jemco, Inc., Lambertville, NJ) once a day. Fish were housed at no more than 10 fish/3 L tank density on the rack system.
Behavioral apparatus
Fish were tested in a 37-L glass tank (50 × 30 × 25 cm, width × depth × height) with a white corrugated plastic sheet on the backside of the tank that increased the contrast and reduced glare for video tracking analysis. A flat LCD computer screen (17 inch Samsung SyncMaster 732N monitor) was placed on the left and right side of the tank, and each monitor was connected to a Dell Vostro 1000 Laptop Computer, running a custom-made software application we call Zebrafish Fish Presenter. 30 This software application allowed us to display animated, that is, moving, zebrafish images, the stimulus, on either of the two computer monitors at the predetermined period of time. Importantly, the software allowed us to present the stimulus in a consistent and controlled manner across all trials (number of fish images = 8, the length of the fish images = mean length of the experimental subjects, speed range = 3–4 cm/s, direction of swimming = randomized, location of images = 5 cm away from bottom and water surface of the test tank). A 15 W fluorescent light tube was placed directly above the tank for illumination. The behavior of each experimental fish was recorded using a JVC camera, and the recordings were transferred to an external hard drive, and later analyzed using EthoVision XT 8.5 (Noldus, Info Tech., Wageningen, The Netherlands).
Experimental design and testing procedure
To investigate the effect of the type of water on zebrafish social response and other behavioral parameters, we exposed zebrafish to four water types commonly utilized in behavioral testing. The testing tank contained either water in which live zebrafish were housed (chemosensory cues present) or novel water from an isolated reservoir that has never had zebrafish in it (chemosensory cues absent) and whose salinity was either high (600 μS, equaling the salinity level of the housing rack) or low (50 μS). pH, temperature, nitrate, nitrite, and ammonia levels were kept constant across all four experimental groups. Experimental fish were randomly placed in one of the four water types. The sample size for each condition was 17–18.
The experiment started with placing a single experimental fish in the test tank. We allowed this fish to acclimatize for 1 min and started a 25-min-long recording session subsequently. For the first 15 min of this session no stimuli were presented (the habituation period that allowed us to monitor novelty-induced anxiety/fear responses, their gradual reduction, and subsequent exploratory behavior). This period was followed by a 10-min-long zebrafish image presentation period during which the animated images of zebrafish were presented on one of the computer monitors adjacent to the experimental tank.
Quantification of behavior and statistical analysis
Video recordings were later replayed and analyzed using a video tracking software, EthoVision XT 8.5 (Noldus, Info Tech.). The following behavioral parameters were quantified: distance to stimulus presentation computer screen (this is the distance between the midpoint of the experimental fish and the glass wall of the experimental tank adjacent to the computer screen that is designated to present the animated conspecifics), distance to bottom of the experimental tank (the distance between the midpoint of the fish and the glass bottom of the experimental tank), absolute turn angle (the degree of turning without considering the direction of turning), speed, and the temporal (intraindividual) variance of these behaviors (this variance measures how consistently [low variance] or inconsistently [high variance] each experimental subject behaved). All behavioral parameters were quantified and expressed for 1-min intervals of the 25-min-long recording session.
For statistical analysis SPSS (version 21) was used. We conducted repeated measures analysis of variances (ANOVAs) with factors “interval” (repeated measure factor with 25 levels) and chemosensory cue (between-subject factor with two levels: absent or present) and salinity (between-subject factor with two levels: high (600 μS or low 50 μS). Notably, post hoc multiple comparison tests are not appropriate for repeated measures experimental designs. Also, ANOVA has been found to be underpowered to detect the significance of interaction between or among main factors.
34
Thus, to explore potential group differences (and interaction between the effect of salinity and chemosensory cues), subsequent to the overall repeated measures ANOVAs, where appropriate, we collapsed the repeated measure data as follows. We calculated the average of the behavioral performance measured during the habituation period as well as during the stimulus presentation period and subtracted the former from the latter, that is, we calculated the change of behavior induced by the stimulus presentation:
where Bs is behavior measured during the 1-min intervals of the stimulus period, Bh is the behavior measured during the 1-min intervals of the habituation period, and n is the number of 1-min intervals (n = 10 for the stimulus period and n = 15 for the habituation period). Note that a negative Change value, for example, represents a reduction of the given behavior. In addition, for some behaviors, we also calculated the change between the first 5 min and the subsequent 10 min of the habituation session. We analyzed the data calculated this way using univariate ANOVA with factors, chemosensory cues and salinity, and conducted post hoc multiple comparisons, where warranted using Tukey's honestly significant difference multiple range test.
Results
Distance to stimulus screen
Analysis of distance to stimulus screen revealed that most fish stayed, on average, about 25 cm from the stimulus screen during the habituation period, that is, showed no preference for either side of the tank when the stimulus screens were blank (the length of the tank was 50 cm and thus chance level performance is 25 cm) (Fig. 1A). Upon stimulus presentation (after the 15th min of the recording session), fish of some groups appeared to move closer, whereas others stayed at the same distance, yet others moved further away from the stimulus compared with chance, that is, compared with where they were during the habituation period. However, repeated measures ANOVA did not confirm these apparent changes, as it found no significant effect of any of the main factors, and also did not reveal any significant interaction term (Table 1). Nevertheless, one, the triple interaction term interval × chemosensory cue × salinity yielded p = 0.06, that is, border-line significance. Two, ANOVA is known to be underpowered to detect significance of interaction among main factors. 34 Three, detailed temporal changes shown in Figure 1A suggested potential treatment-dependent effects. For these three reasons, we decided to further explore potential group differences. We calculated the change of distance to stimulus screen between the habituation and stimulus periods as described above. The results shown in Figure 1B suggest an interaction between chemosensory cue and salinity treatment. It appears that fish exposed to high-salinity water with chemosensory cues present increased distance to the stimulus side upon presentation of the stimulus fish. But fish exposed to low-salinity water with chemosensory cues present did the opposite, that is, reduced the distance, the expected response to the appearance of conspecific images, while fish in the low-salinity group without chemosensory cues did not respond to the images at all. In general, ANOVA confirmed these observations. Although it found no significant main effects for chemosensory cue or salinity, it did find the interaction between these two factors significant (Table 2). Subsequent post hoc Tukey HSD analysis confirmed this interaction, and found fish exposed to high-salinity water with chemosensory cues present to be significantly further away from the stimulus than fish exposed to low-salinity water with chemosensory cues present (p < 0.05), whereas other group differences were found nonsignificant.
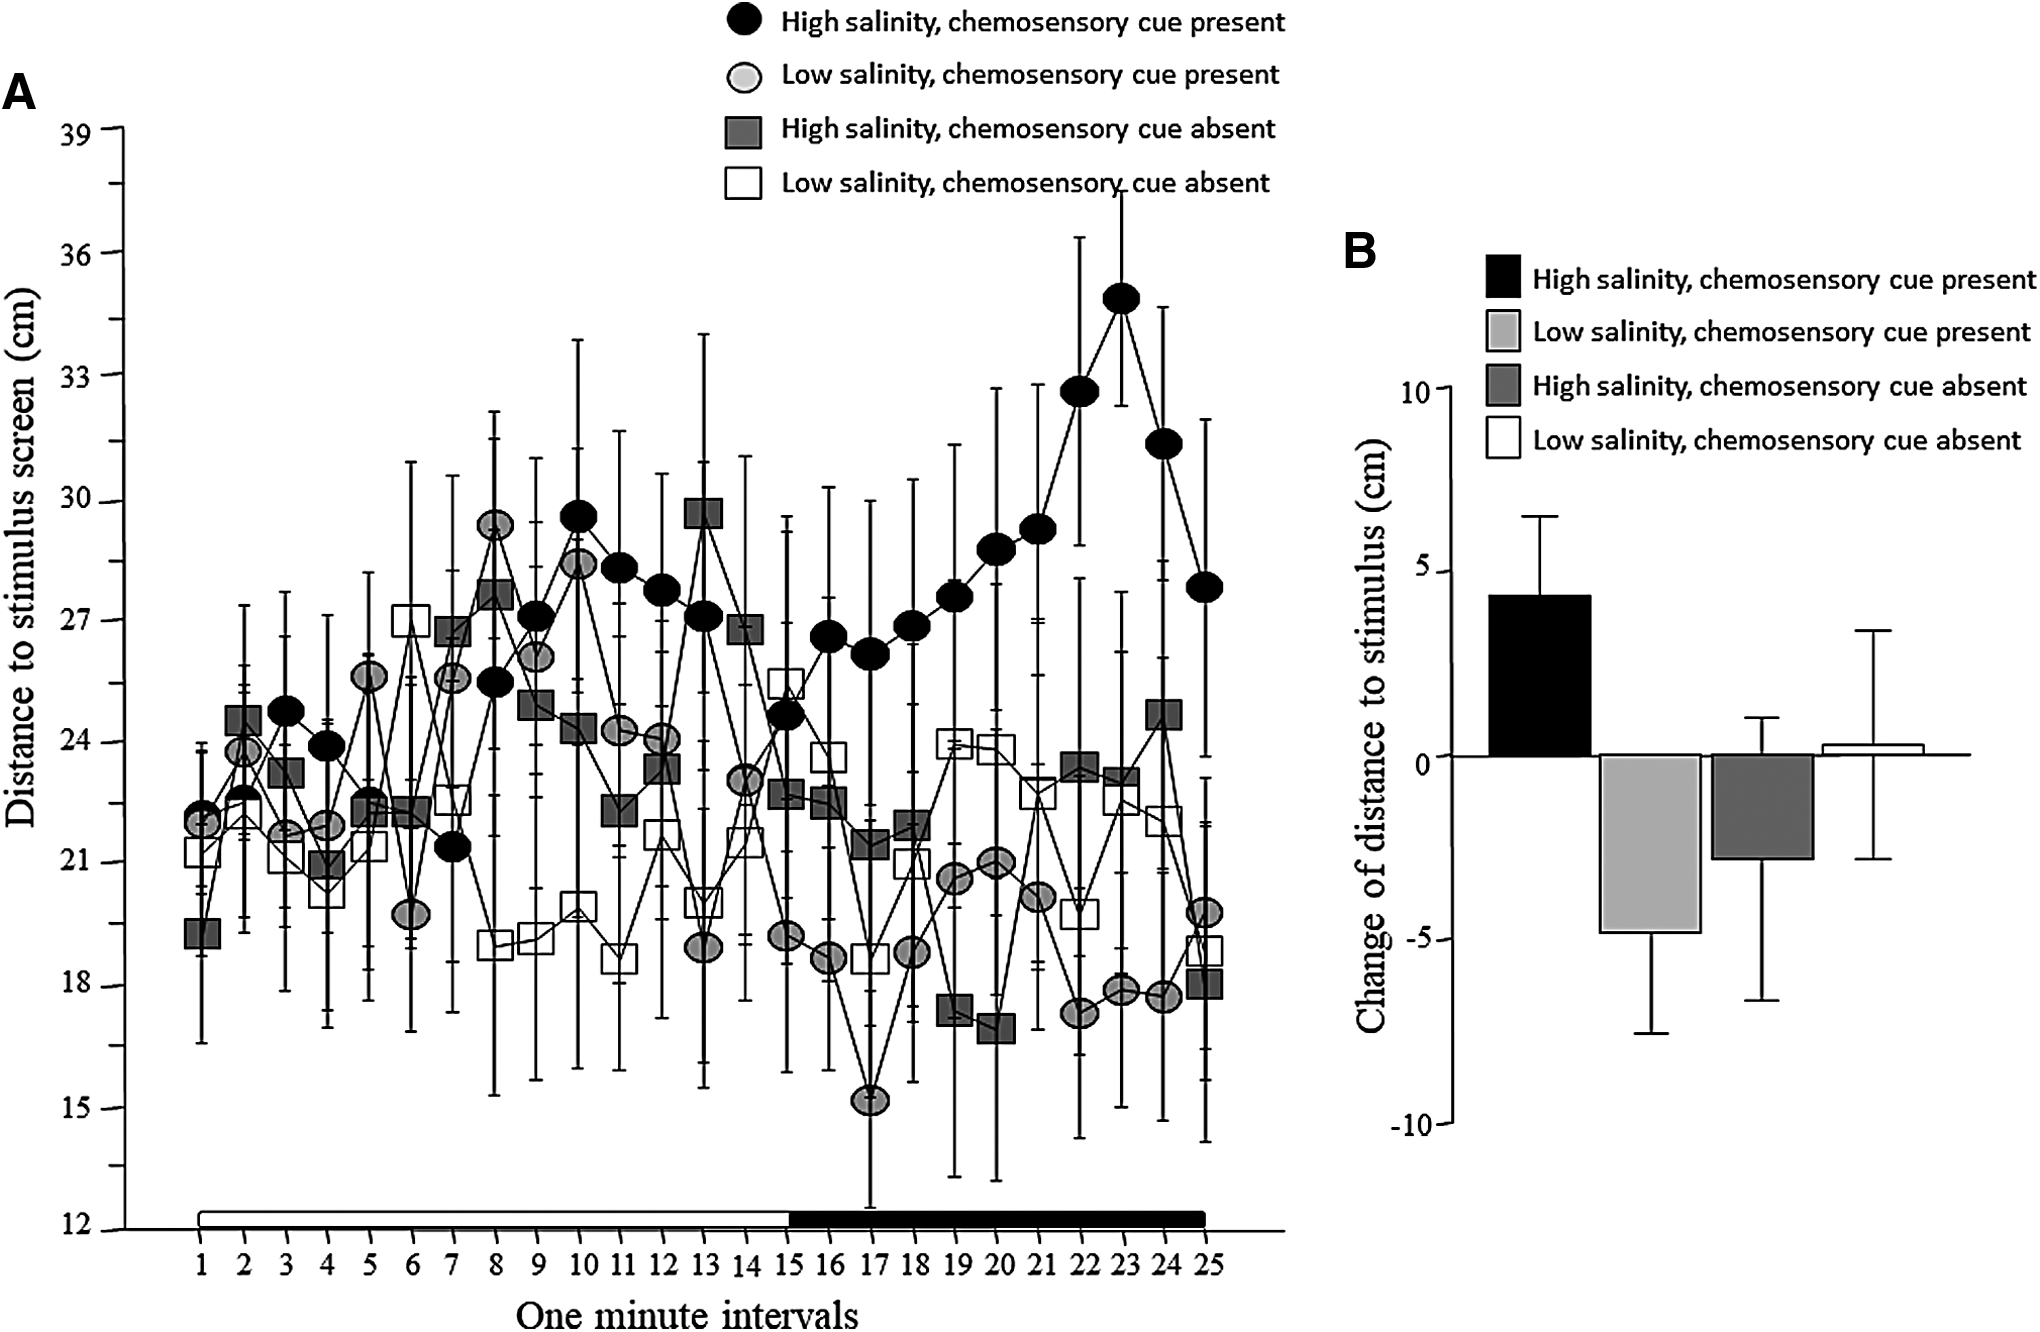
Distance to stimulus screen.
F values, degrees of freedom, and p-values are shown. Significant results are highlighted by dark gray background and bold font.
ANOVA, analysis of variance.
F values, degrees of freedom, and p-values are shown. Significant results are highlighted by dark gray background and bold font.
Intraindividual variability of distance to stimulus screen
Next, we examined the temporal stability of the distance to stimulus screen, that is, the intraindividual variability of this behavior (Fig. 2A). The results suggest that variability of the distance to stimulus screen decreased with time. Repeated measures ANOVA confirmed this and found a significant interval effect, but found the effect of chemosensory cues and of salinity nonsignificant (Table 1). All interaction terms, except interval × salinity was found nonsignificant (Table 1). To further investigate these results, we again calculated the change between the habituation period and stimulus presentation period, and found that all groups reduced their variance of distance to stimulus screen in response to the stimulus presentation (Fig. 2B). ANOVA found no significant chemosensory cue and salinity effects, and the interaction between these two factors was also nonsignificant (Table 2).

Intraindividual variance of distance to stimulus screen.
Distance from bottom
Fish of all treatment groups, except the ones treated with high-salinity water with chemosensory cues present, showed an apparent gradual decline of the distance they swam from bottom (Fig. 3A). Repeated measures ANOVA confirmed a significant interval effect and chemosensory cue effect, but found salinity to have no significant effect (Table 1). All interaction terms were found nonsignificant (Table 1). We also calculated the change of distance to bottom from the habituation period to the stimulus presentation period as explained for the other behavioral parameters (Fig. 3B). Although the graph depicts an apparent interaction similarly to the detailed line graph shown in Figure 3A, with fish exposed to high-salinity water with chemosensory cues present being different from all other groups, ANOVA found no significant interaction, and also did not reveal any significant main effects (Table 2).
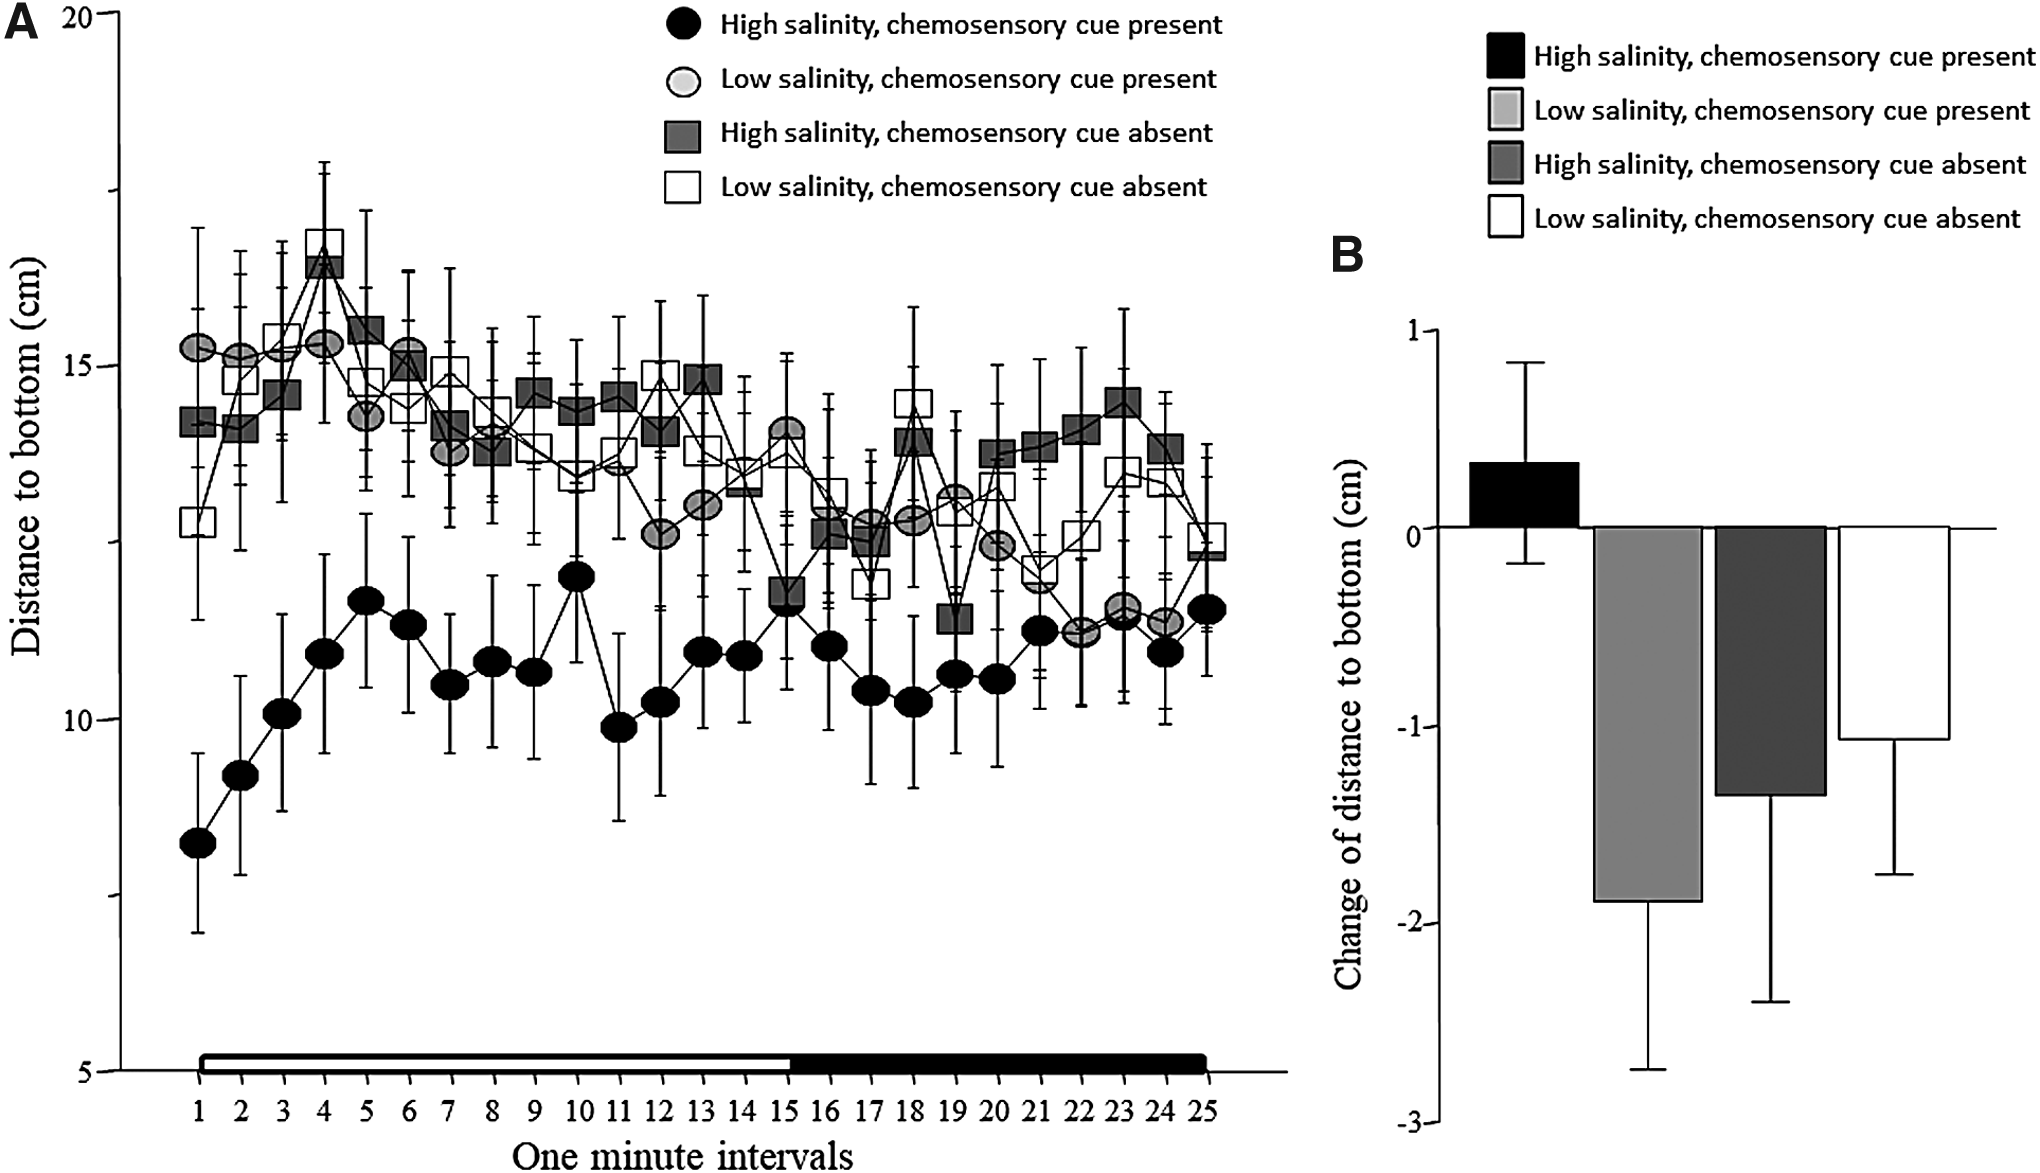
Distance to bottom.
Intraindividual variance of distance from bottom (vertical exploration)
Figure 4A shows how the variance of distance to the bottom changed with the time intervals of the recording session. We emphasize that this variance represents intraindividual variability of behavior, that is, not the variance among subjects but within each subject. The variance of distance to bottom is often interpreted as a measure of vertical exploration. 35 Figure 4A demonstrates that vertical exploration was low at the beginning of the recording session, and it gradually increased with time. The figure also suggests that this increase was not the same for fish of the four treatment conditions. ANOVA confirmed these observations and found a significant interval effect, a significant chemosensory cue effect, a significant interval × chemosensory cue interaction, and a significant interval × chemosensory cue × salinity interaction, whereas other effects/interaction terms were found nonsignificant (Table 1). Figure 4B shows the change of variance of distance to bottom between the habituation and stimulus presentation periods. The graph suggests that while fish in high-salinity water with chemosensory cues absent apparently increased their vertical exploration from habituation to the stimulus period, fish in the low-salinity water with chemosensory cues present apparently decreased their vertical exploration, and that the fish of the other two groups did not change their behavior. However, ANOVA could not confirm these observations, as it found no significant chemosensory cue or salinity effects, and also found the chemosensory cue × salinity interaction term nonsignificant (Table 2). The temporal trajectory seen in Figure 4A shows rising variance of distance to bottom during the first few minutes of the recording session. Furthermore, the period spanning the first 3–5 min that follows netting the fish from their home tank and placing it into a novel tank is known to reflect net stressor-induced fear responses. 36 For these reasons, we investigated the change of variance of distance to bottom between the first 5 min and the subsequent 10 min of the recording session. Similar to the calculations we described before, we calculated the difference between the average of the performance during the first 5 min, and the average of performance during the subsequent 10 min of the habituation period, that is, subtracted the latter from the former. The results shown in Figure 4C suggest that fish of some groups differed from others in the magnitude of change of variance between the first and second part of the habituation period. ANOVA confirmed this observation and found a significant chemosensory × salinity interaction, with no significant main effects of chemosensory cue or salinity (Table 3). To investigate which group differed from which, we conducted a Tukey's HSD post hoc analysis. We found that fish exposed to the high-salinity water with chemosensory cues present were significantly (p < 0.01) different from fish exposed to high salinity without chemosensory cues, whereas other group differences were nonsignificant (p > 0.05).
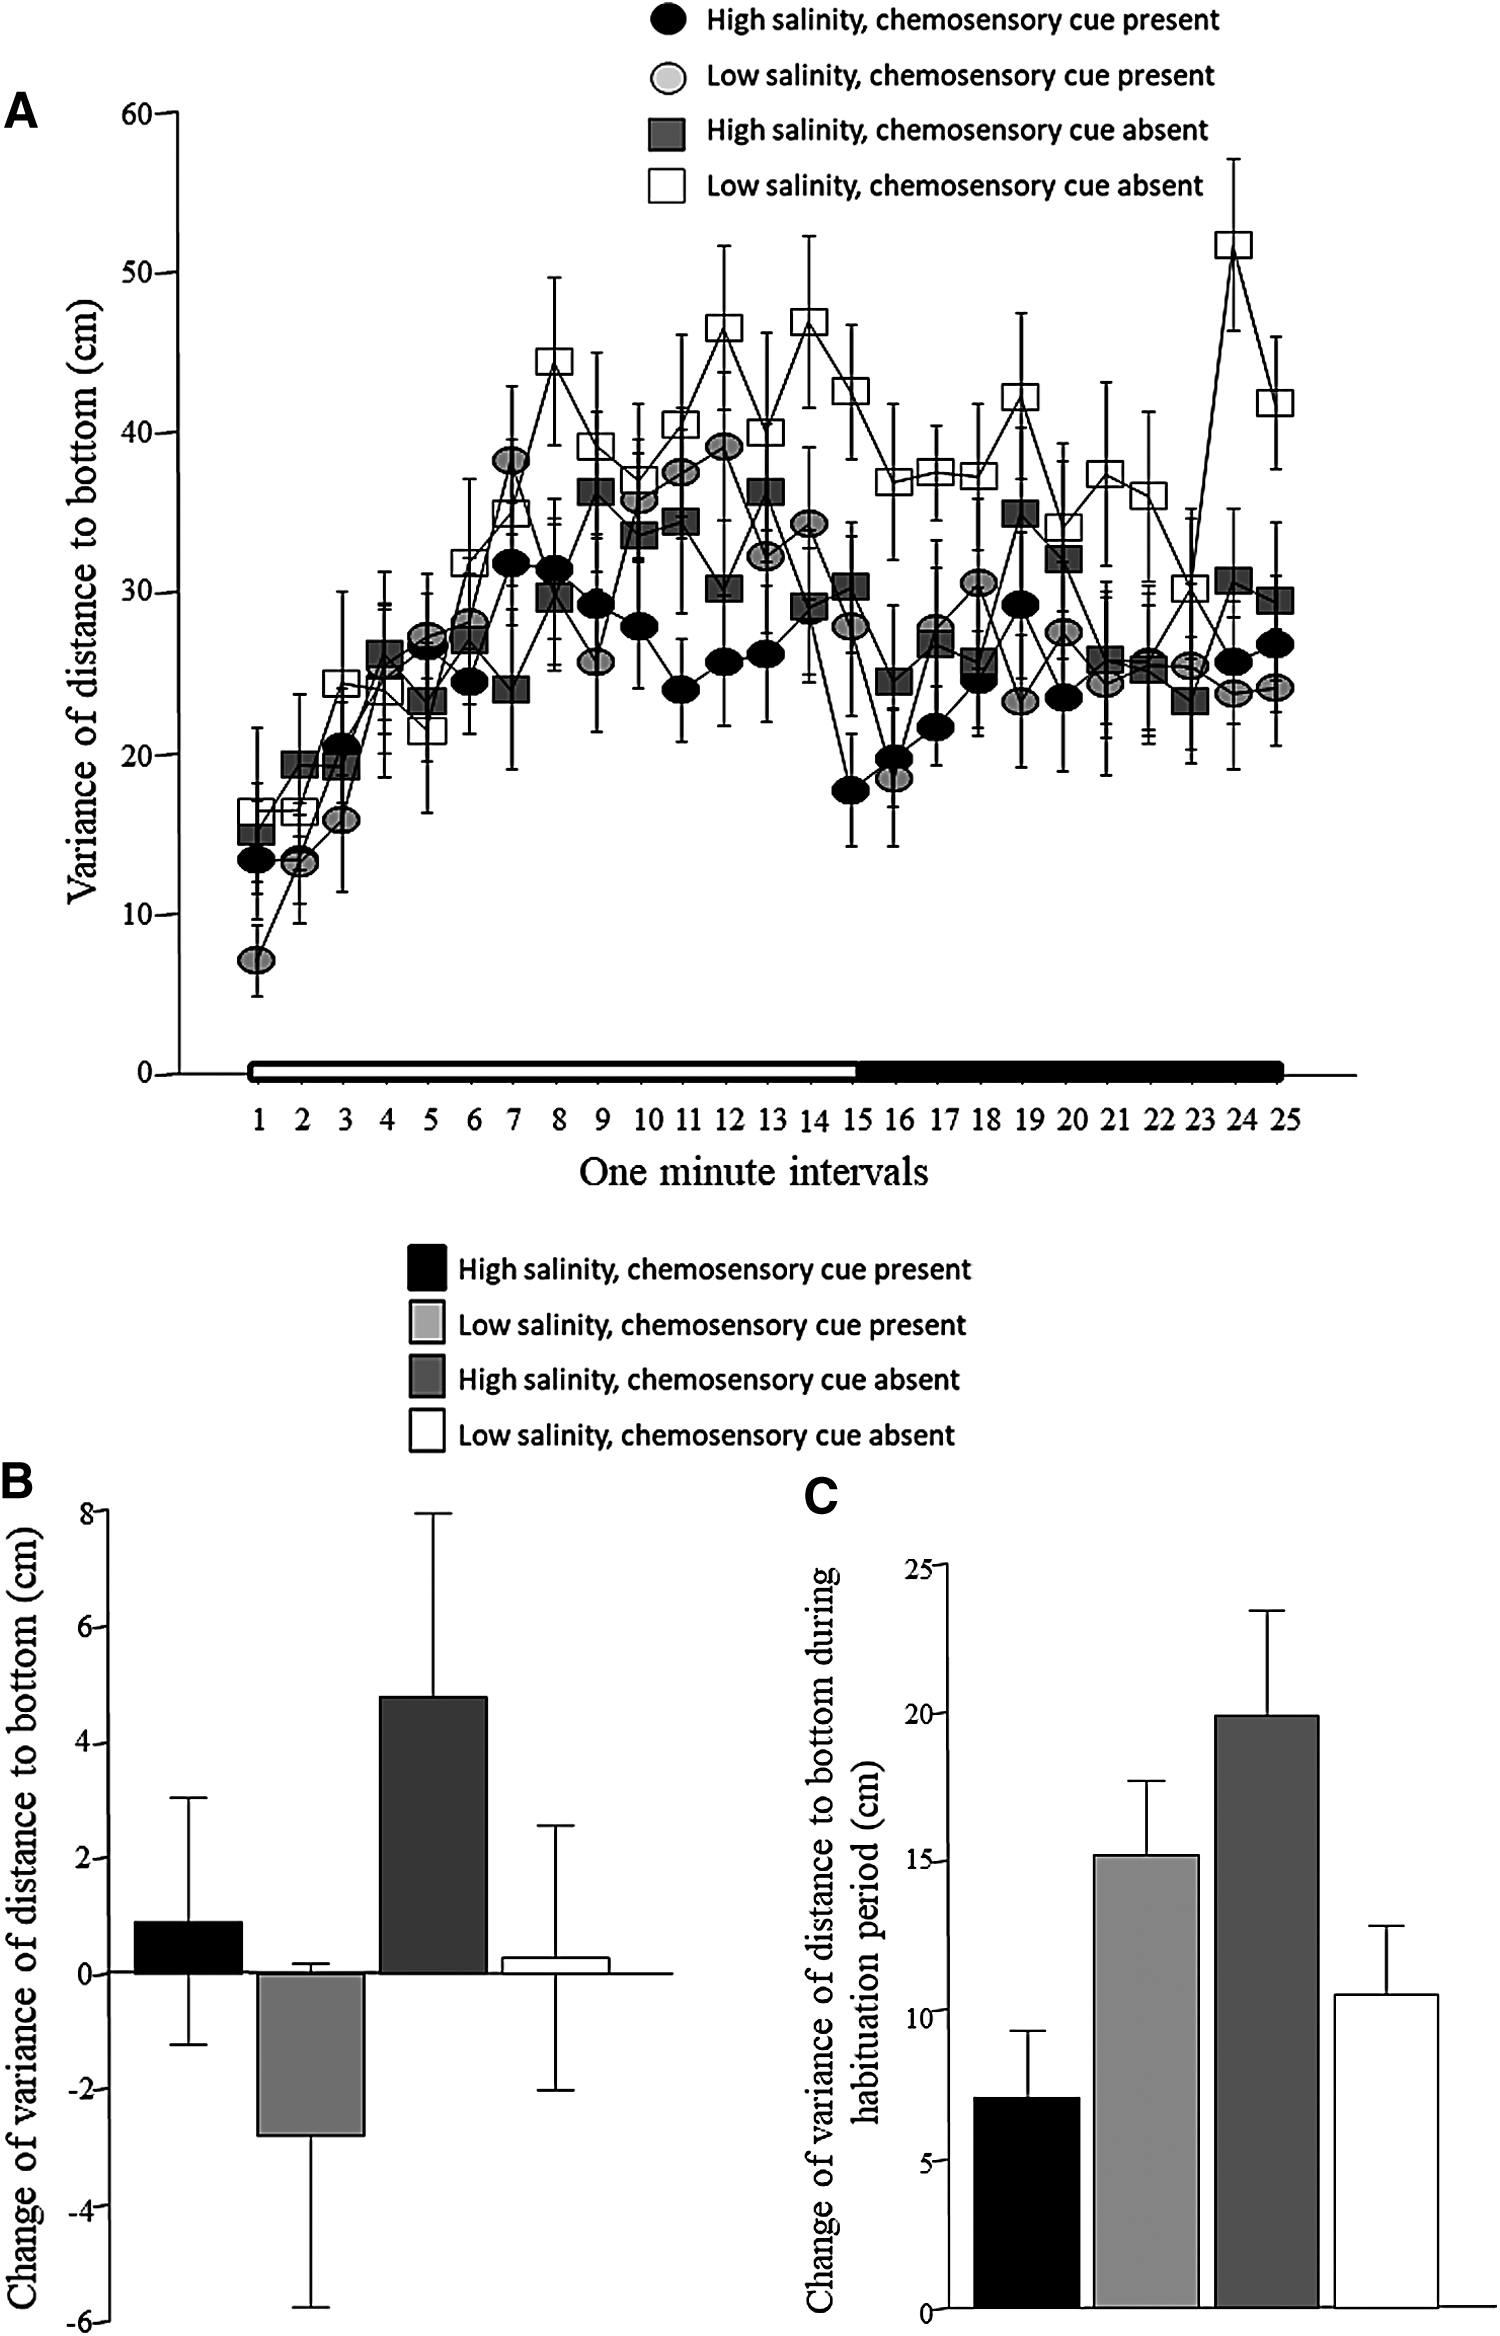
Intraindividual variance of distance to bottom.
F values, degrees of freedom, and p-values are shown. Significant results are highlighted by dark gray background and bold font.
Absolute turn angle
Absolute turn angle (Fig. 5A) appeared to be somewhat elevated during the first 5 min of the recording session, after which it declined and remained at a relatively low value throughout the recording session, that is, without being much affected by the presentation of the conspecific images after the 15th min. Figure 5A also shows an apparent difference between the two groups of fish exposed to water with chemosensory cues present versus the other two that had water with chemosensory cues absent, the latter showing higher turn angle compared with the former. These observations were confirmed by repeated measures ANOVA, which detected a significant interval effect, a significant chemosensory cue effect, a significant interval × salinity interaction, while finding the effect of salinity and the other interaction terms nonsignificant (Table 1). Figure 5B shows the change of turn angle from habituation to the stimulus presentation period calculated as described above. The results depicted on this figure as well as the ANOVA results show that this change did not significantly differ across the four groups, that is, both main factors and the interaction between them were found to be nonsignificant (Table 2). The temporal trajectory seen in Figure 5A shows elevated turn angle during the first 5 min of the recording session. Thus, as explained above, we calculated the difference between the performance of fish during the first 5 and the subsequent 10 min of the habituation session. The results shown in Figure 5C demonstrate that experimental zebrafish in three treatment groups reduced their turn angle between the first 5 and the subsequent 10-min-long habituation period (negative values). ANOVA detected no significant main effects or interaction between these factors (Table 3)
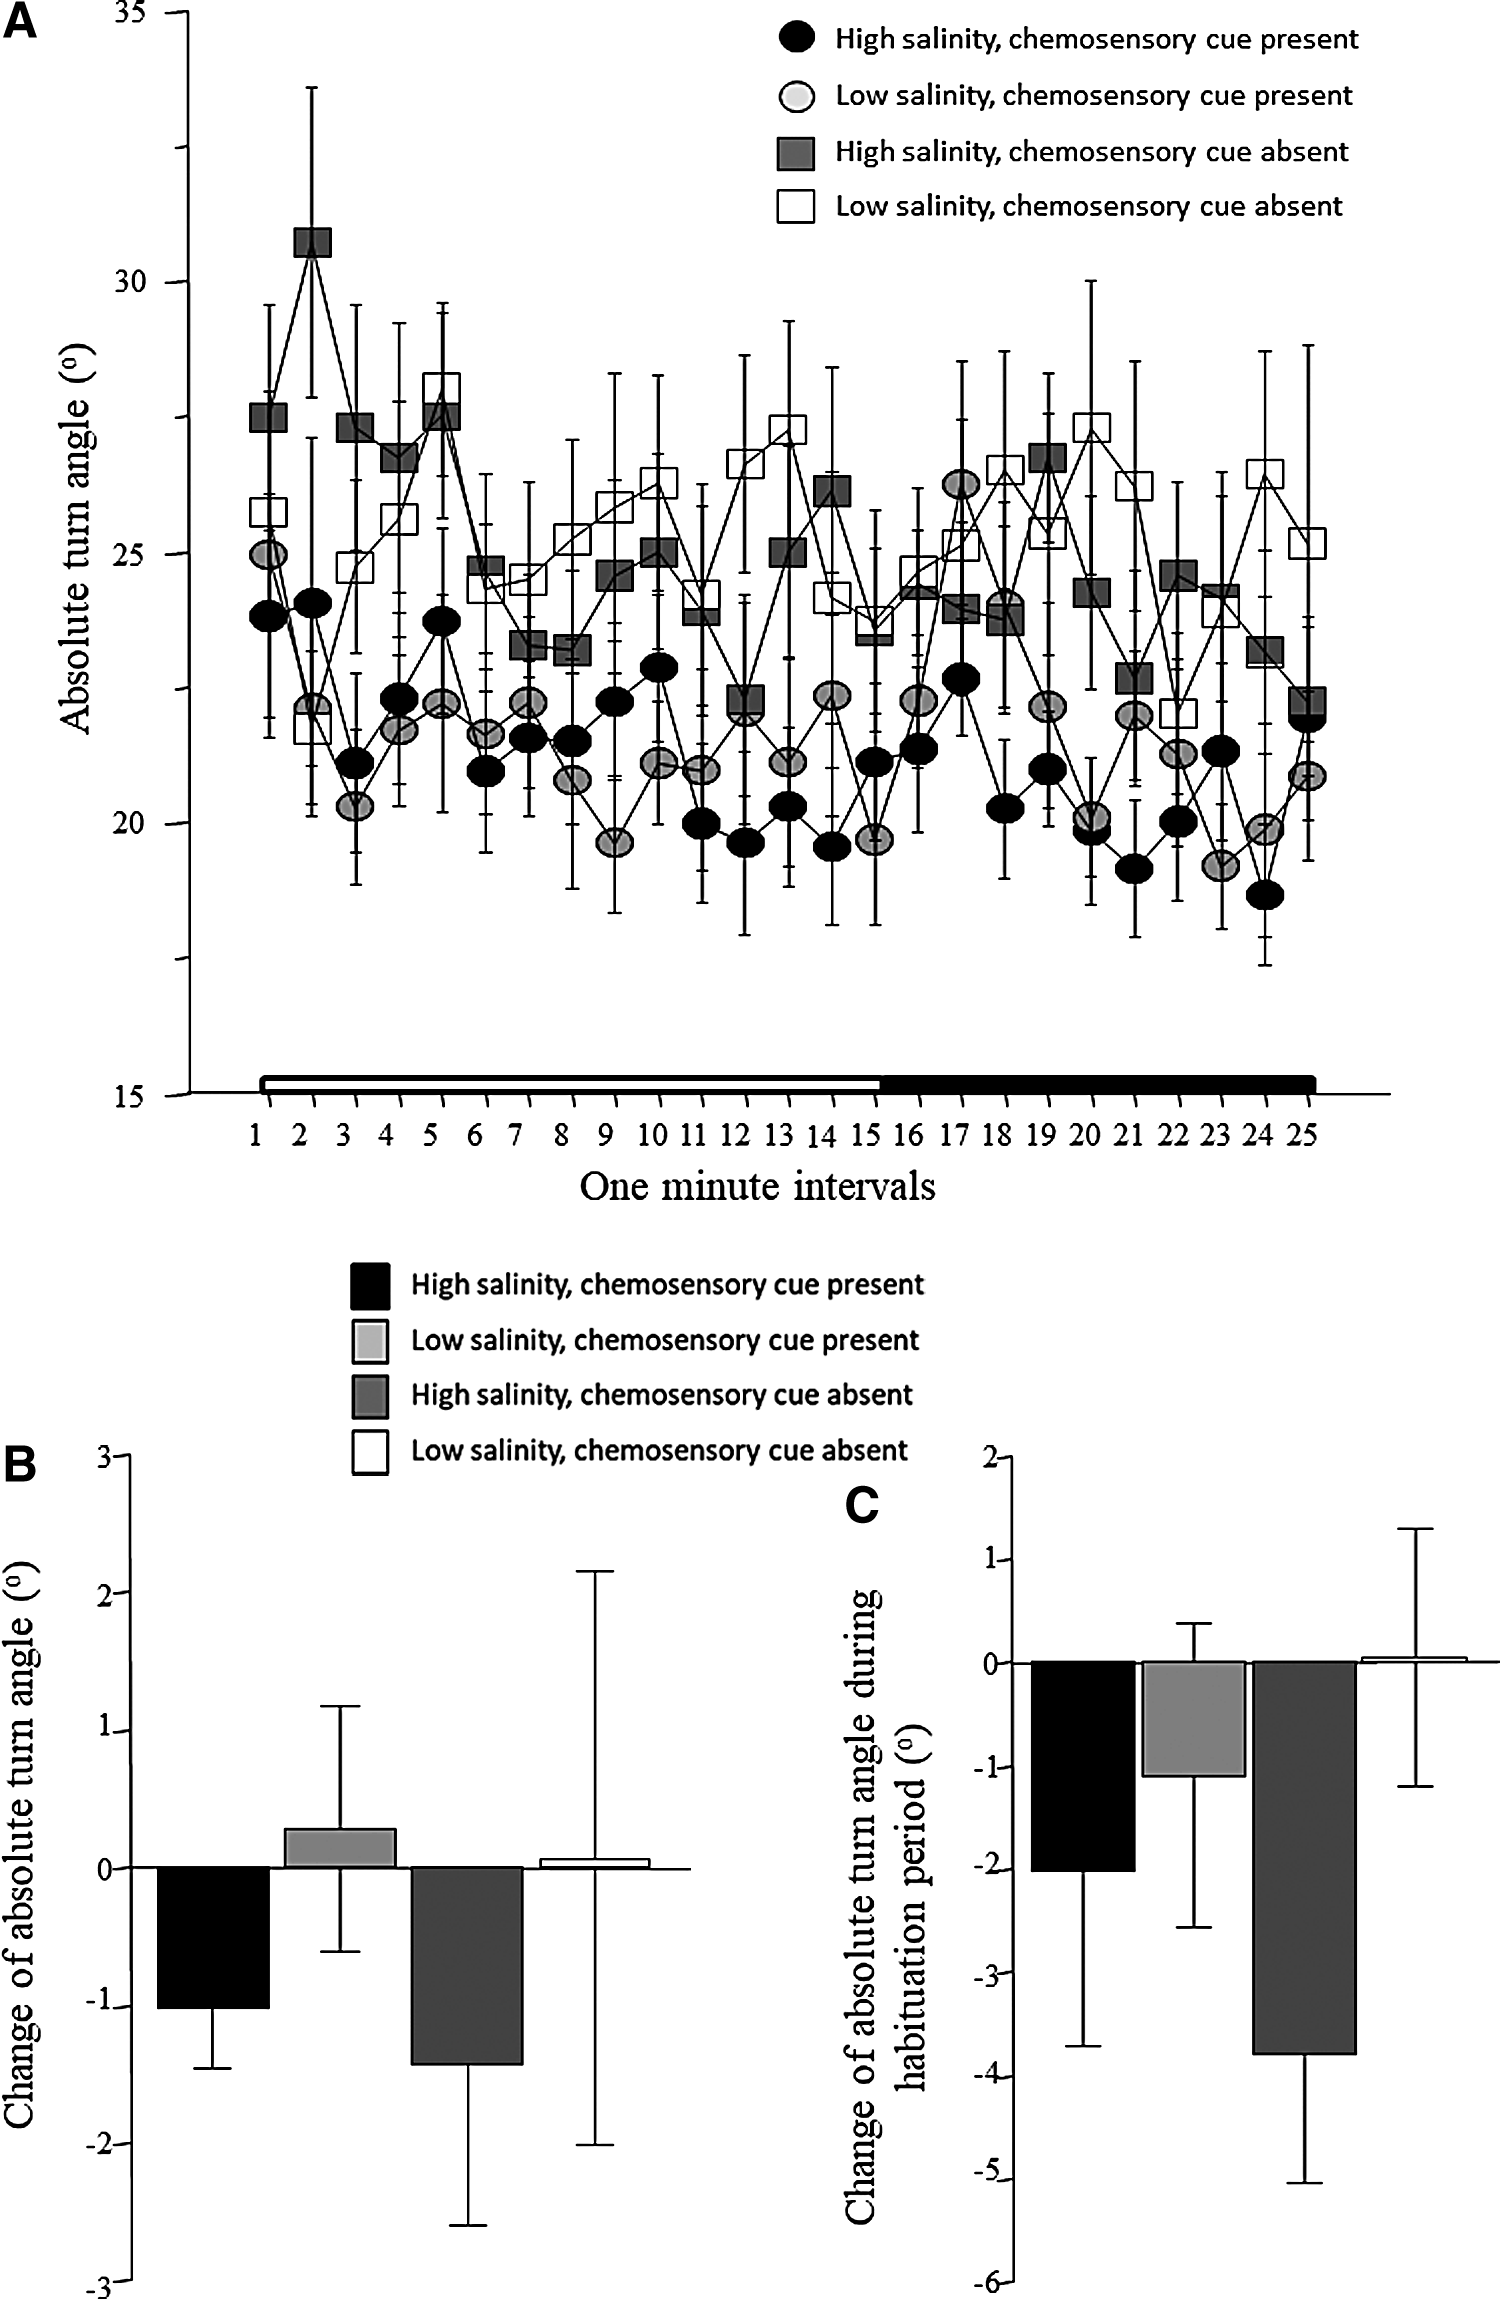
Absolute turn angle.
Intraindividual variance of absolute turn angle
The intraindividual variance of absolute turn angle is shown plotted as a function of 1-min intervals in Figure 6A. The results appear quite similar to what we found for turn angle itself, in that, variance of turn angle appears higher at the beginning of the session and declines as the session progresses. However, apart from some fluctuation of values, there is no clear difference among the treatment groups. These observations are supported by the results of ANOVA, which found the effect of interval significant, but other main effects or interaction terms were all found nonsignificant (Table 1). Although the change of variance of turn angle between the habituation and stimulus presentation periods appear to show treatment group-specific responses (Fig. 6B), ANOVA did not find the main effects or the interaction term significant (Table 2). Similar to absolute turn angle, the variance of absolute turn angle too appeared to show somewhat elevated values during the first few minutes of the recording session. Thus, as for absolute turn angle, we calculated the change between the first 5 min and the subsequent 10 min (Fig. 6C). Although fish of some treatment groups appear to show a more robust reduction of variance (negative values) than others, ANOVA found no significant main effects or interaction (Table 3).
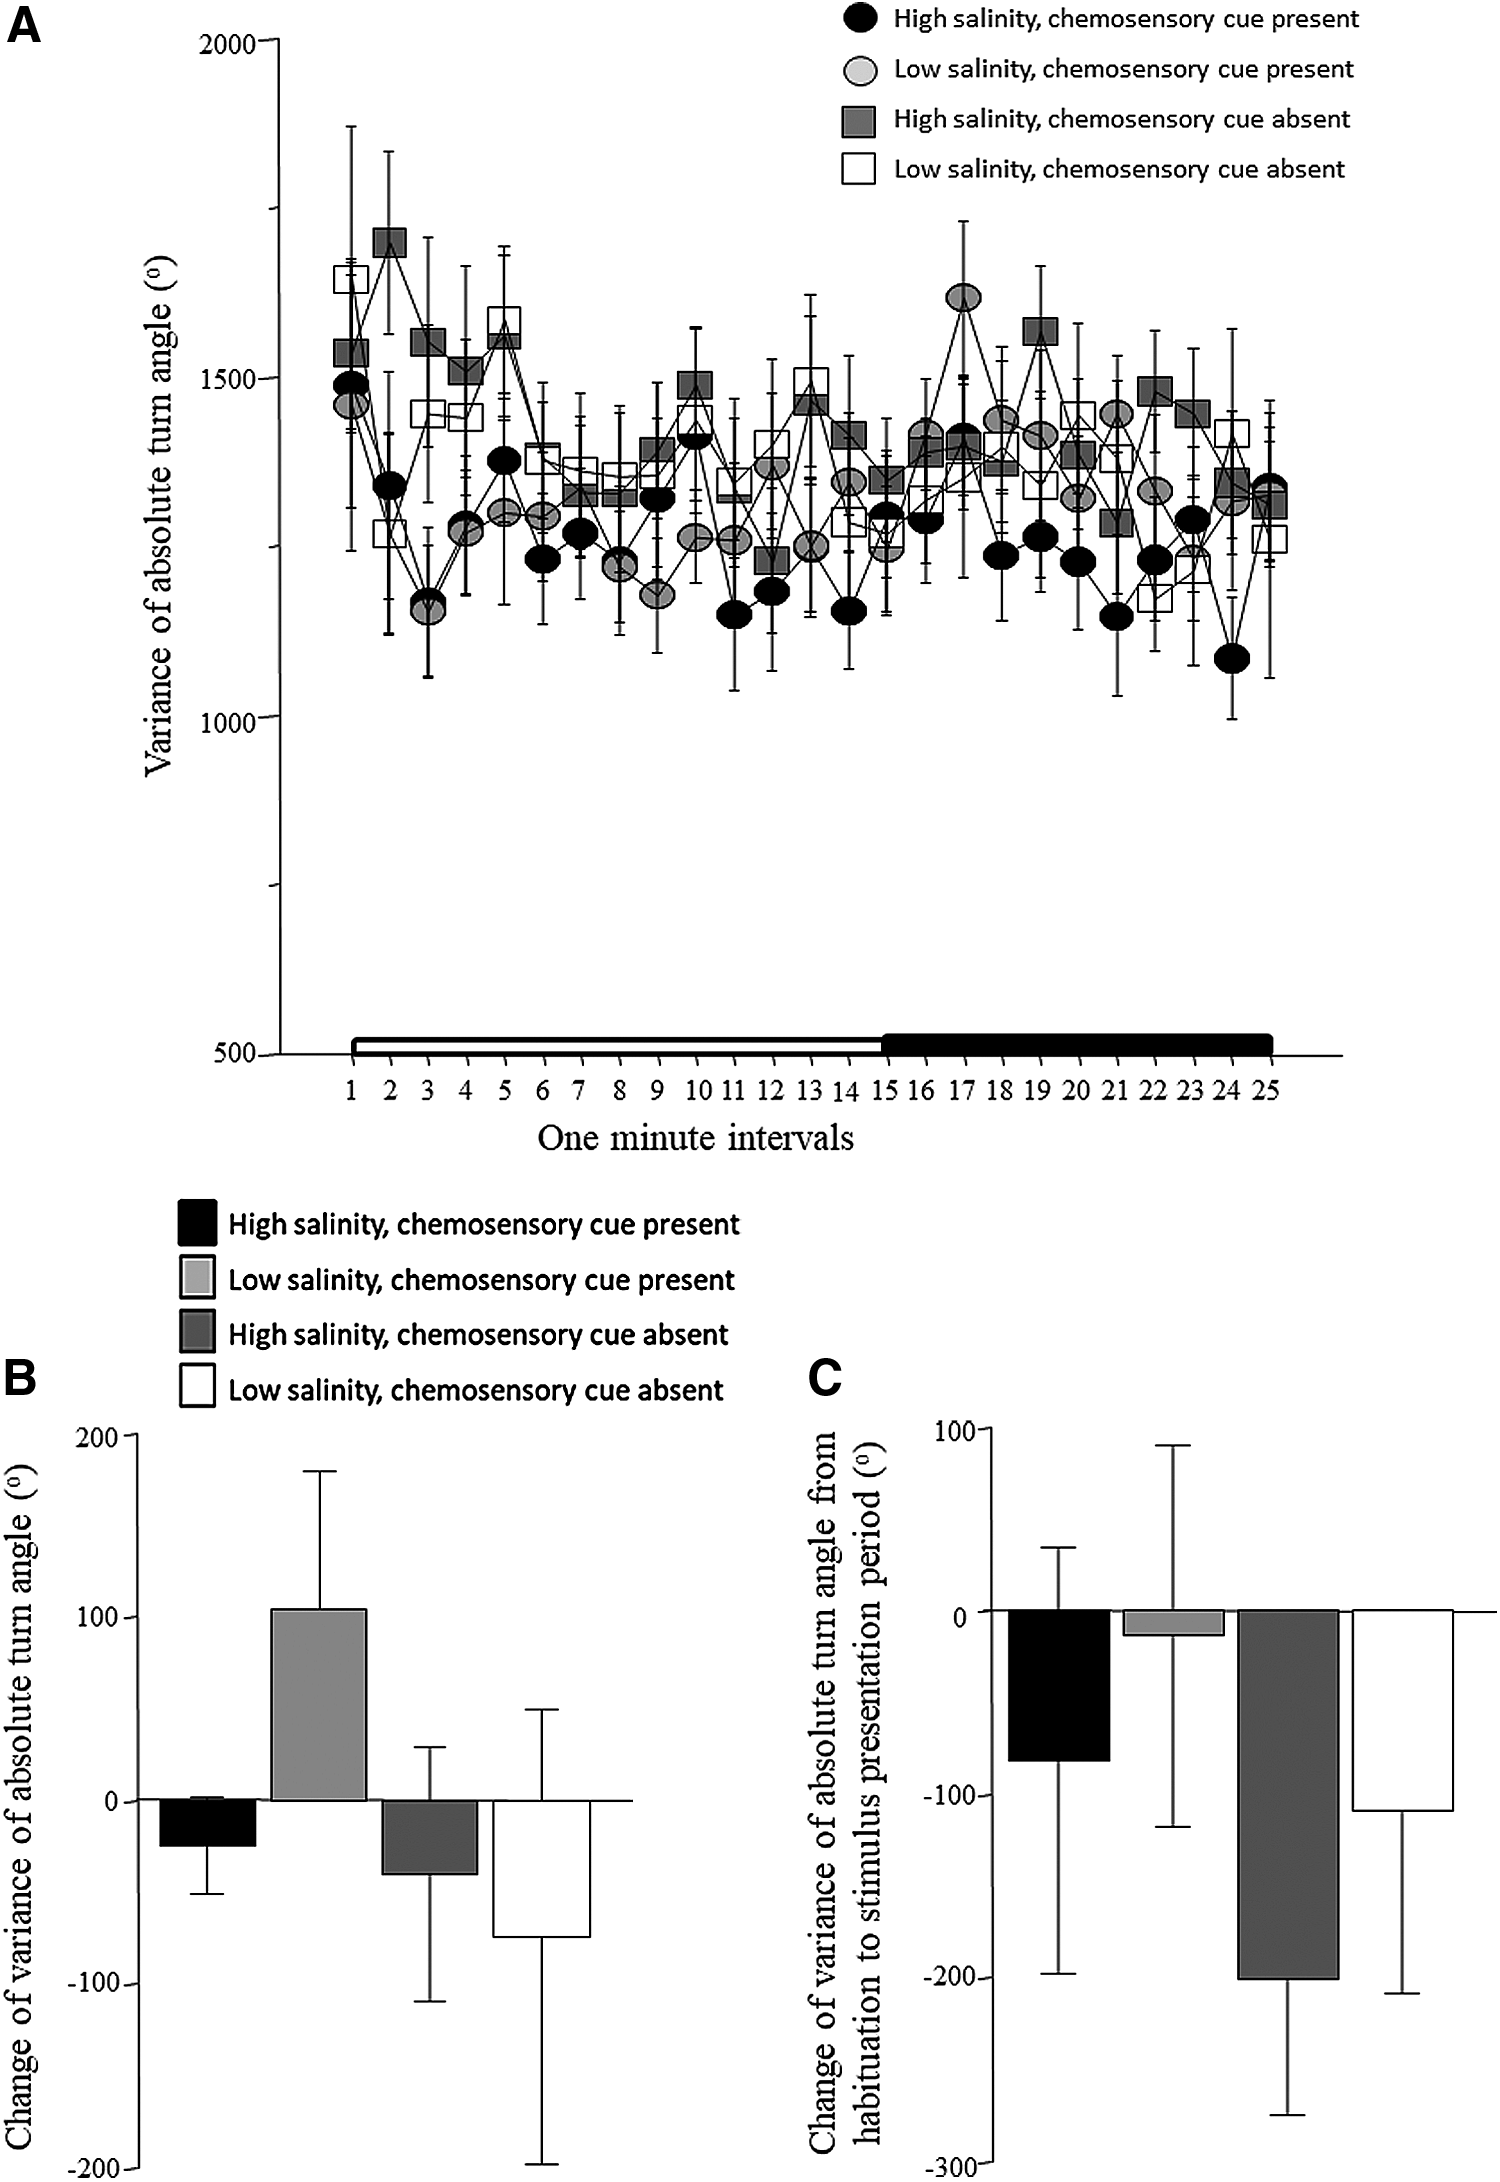
Intraindividual variance of absolute turn angle.
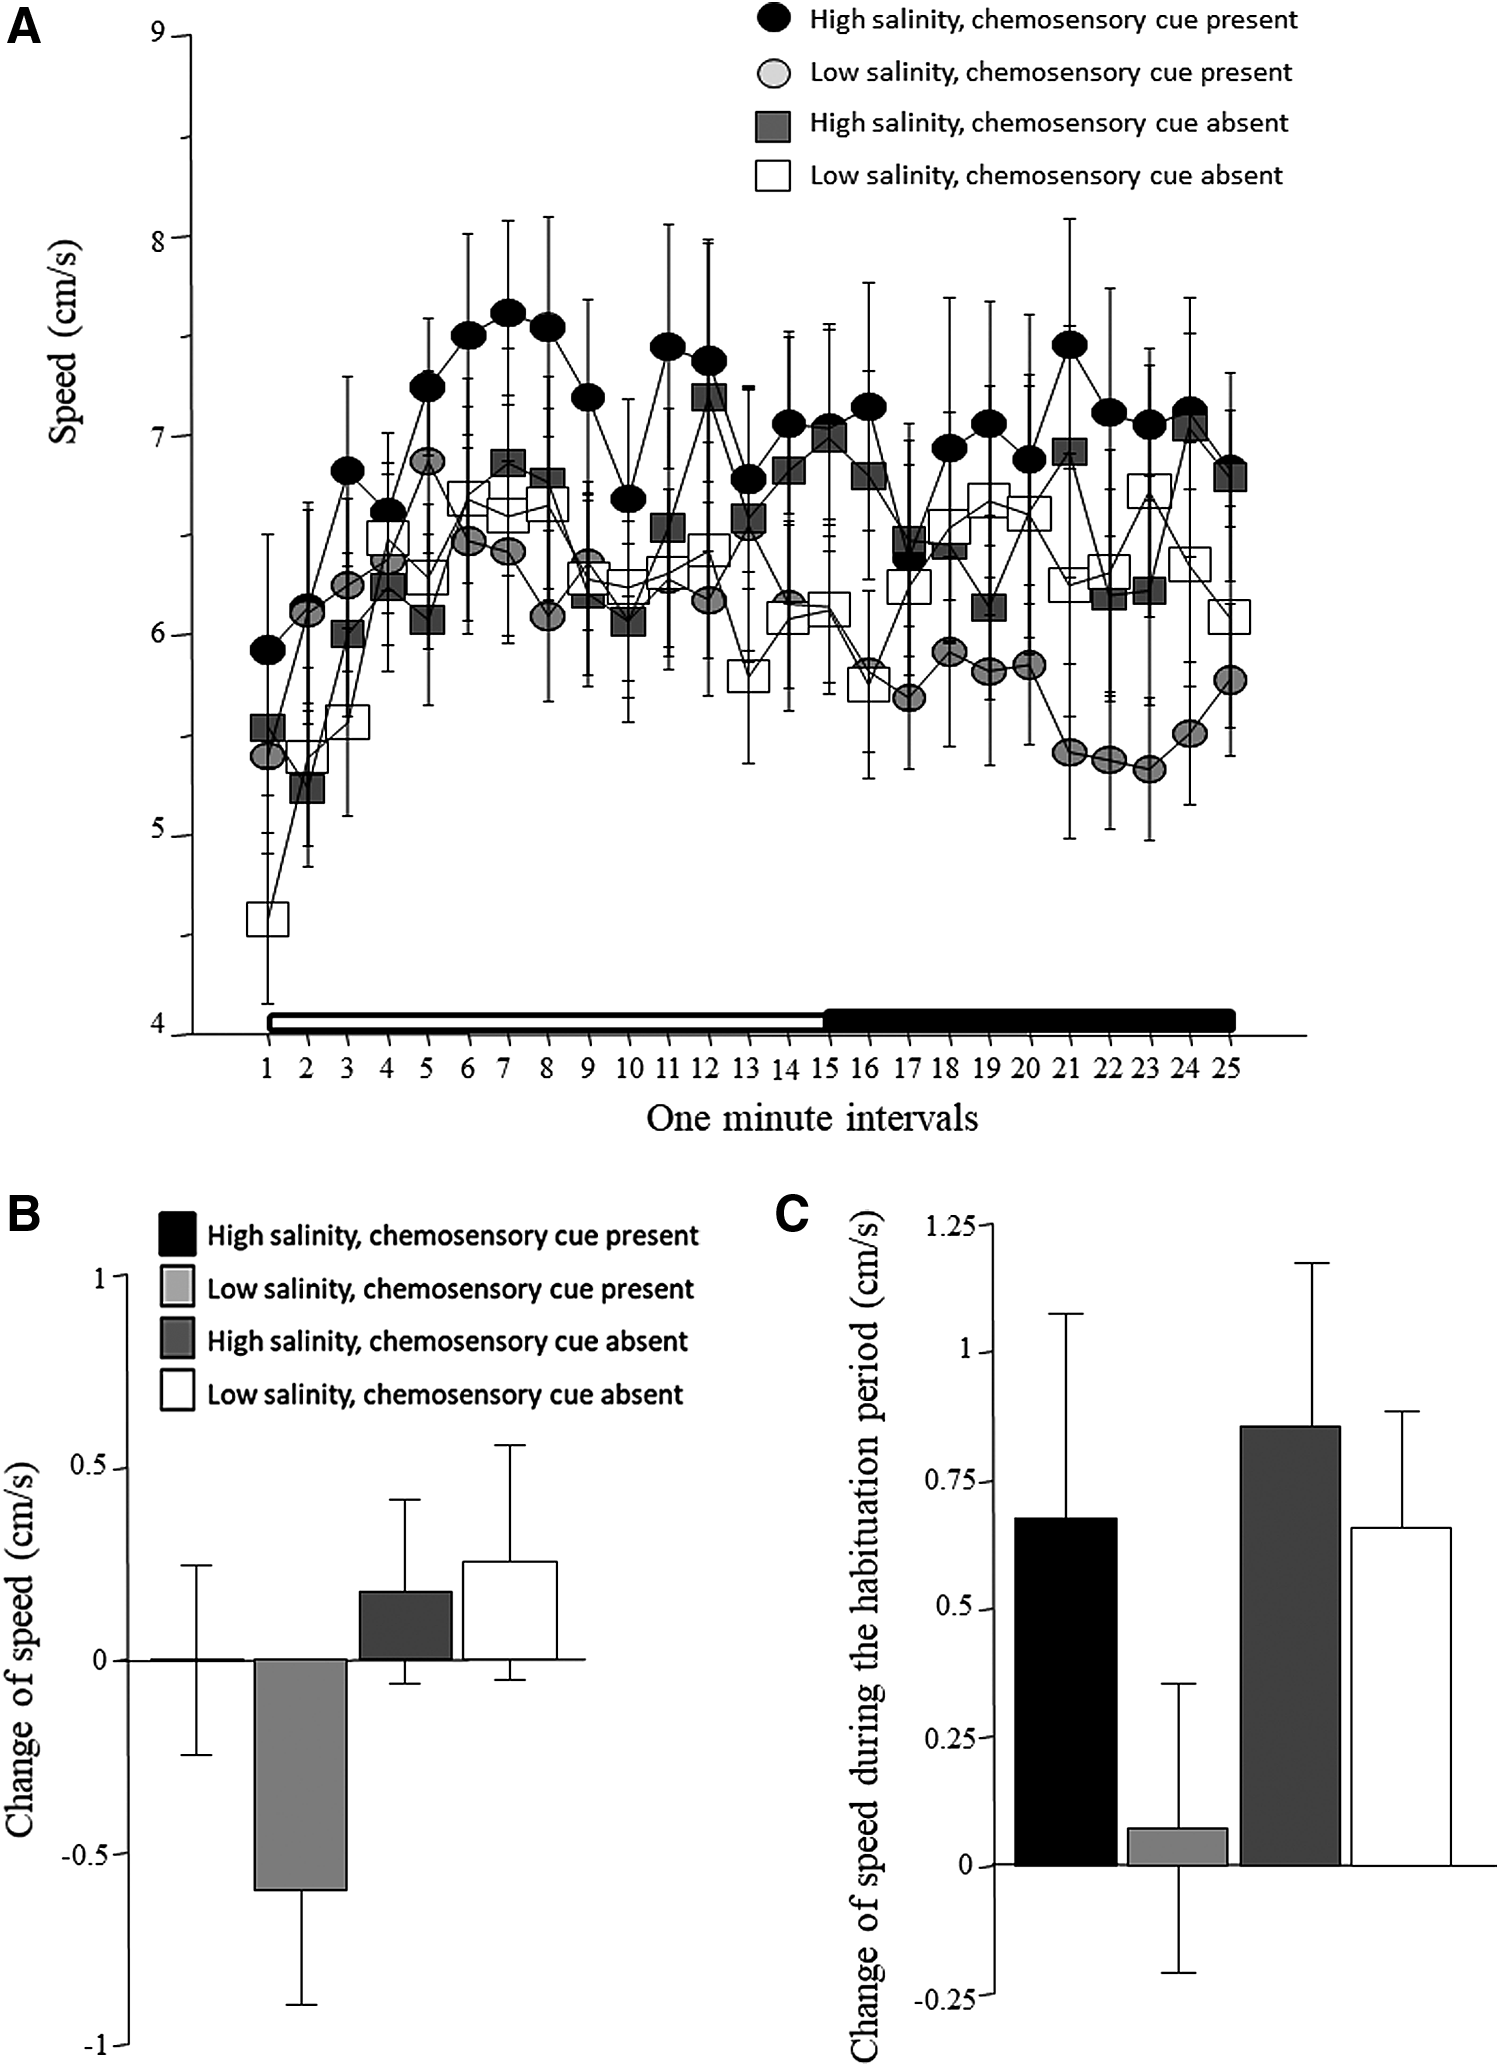
Speed
Speed, similarly to absolute turn angle, appeared to rapidly change (increase) during the first 5 min of the recording session, after which it remained seemingly unchanged (Fig. 7A). Although some variation from interval to interval is apparent, zebrafish of the four treatment groups do not seem to differ from each other. These observations were confirmed by ANOVA, which detected a significant interval effect, but found no other significant effects for main factors or interaction terms (Table 1). The change of speed between the habituation period to the stimulus presentation period is depicted in Figure 7B. Although fish of some groups appear to respond differently from others, ANOVA found no significant main effects or interaction (Table 2). Similarly, although fish exposed to low-salinity water with chemosensory cues presently appear not to change their speed between the first 5 min to the subsequent 10 min of the habituation session, while fish of the other three treatment groups do seem to increase their speed (Fig. 7C), ANOVA did not find the effect of our main treatment factors or the interaction between them significant (Table 3).
Speed.
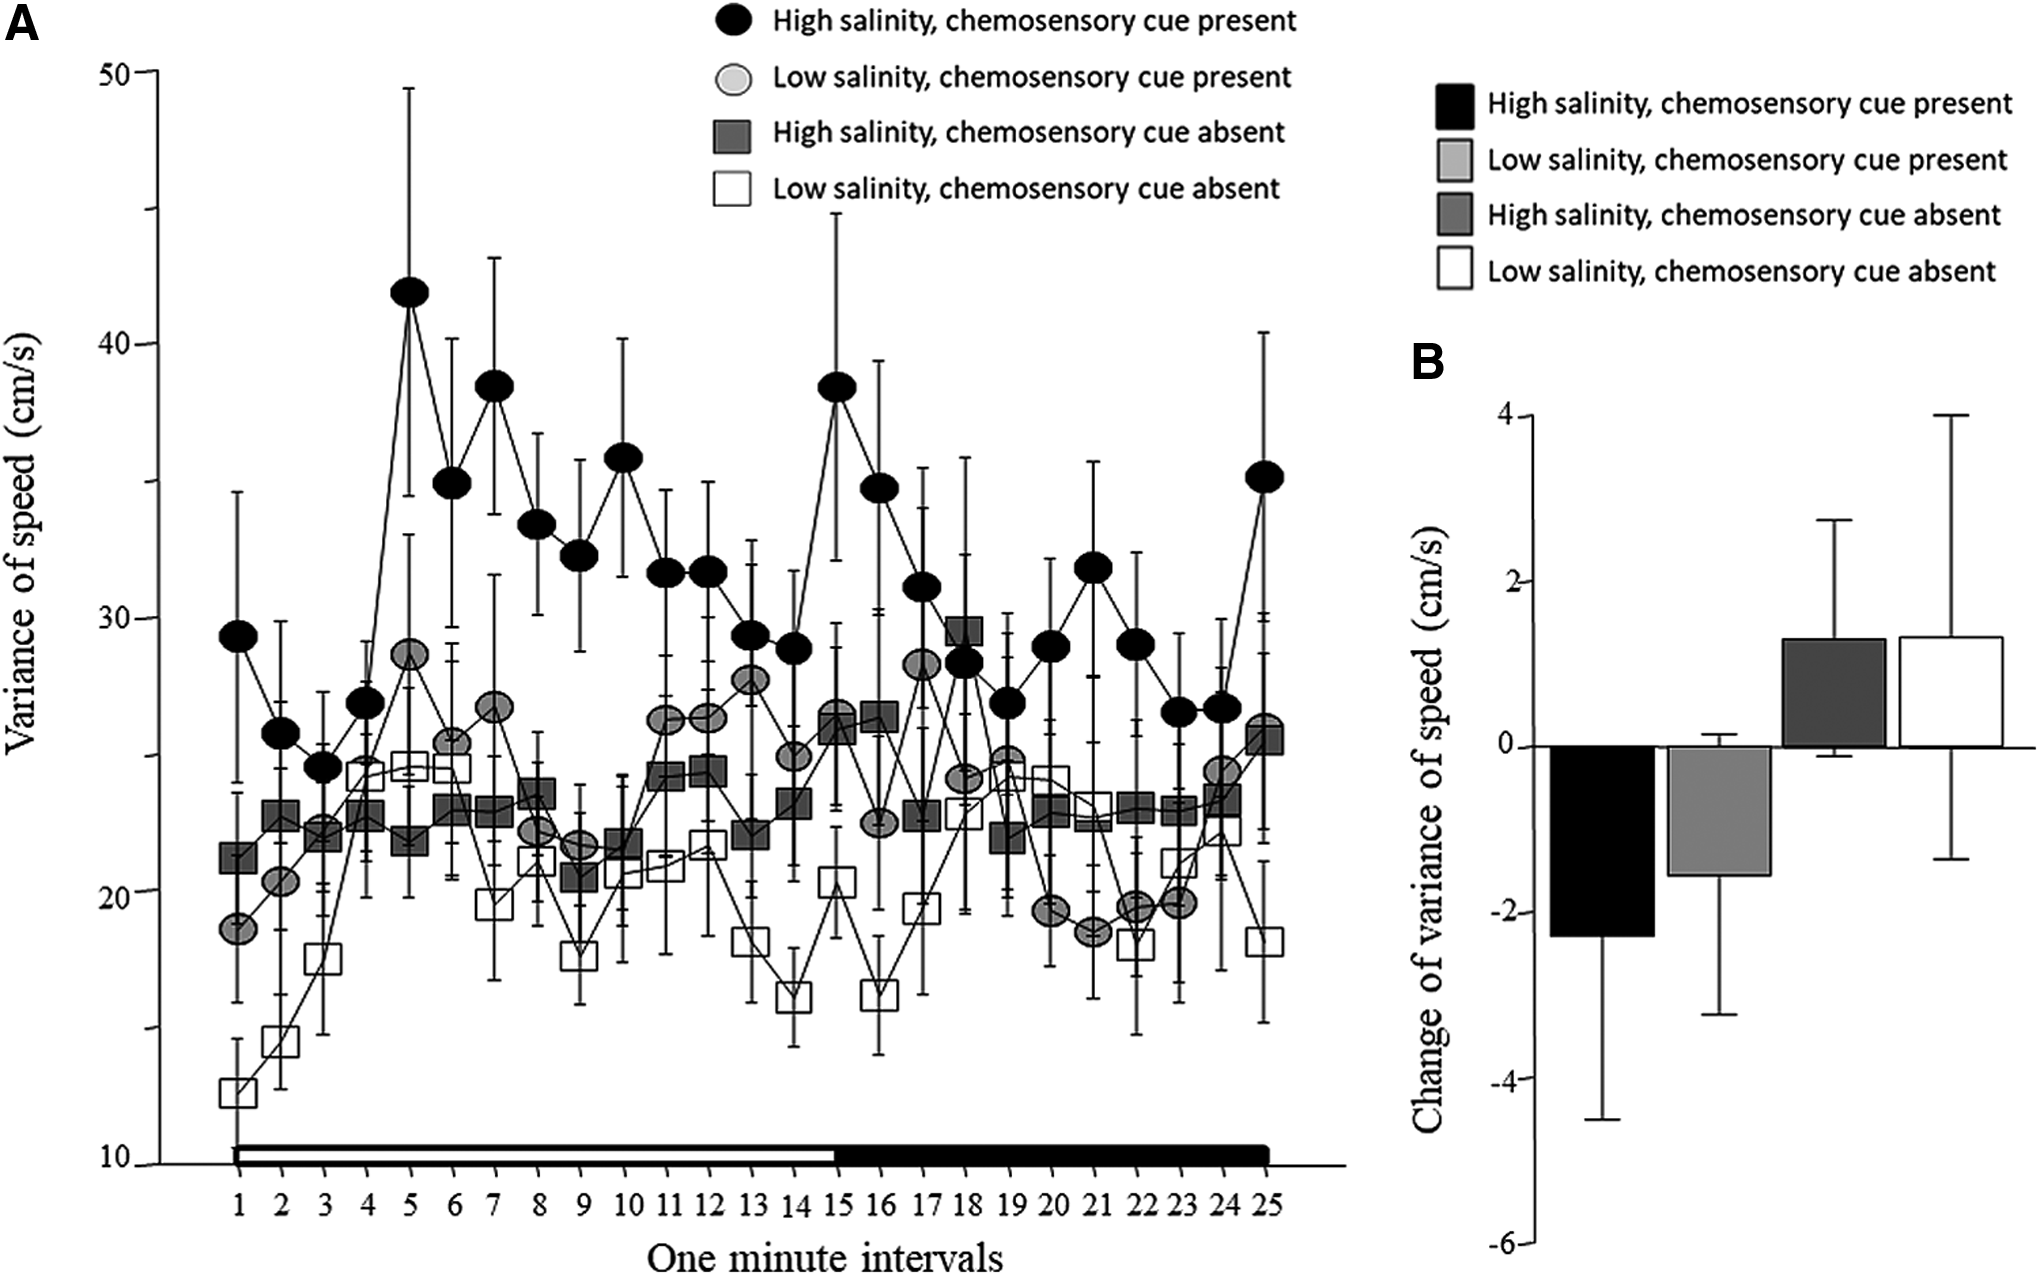
Intraindividual variance of speed
The variance of speed, that is, how inconsistently experimental zebrafish swam across the 1-min intervals of the recording session, is shown in Figure 8A. ANOVA revealed a significant interval effect, chemosensory cue effect, and salinity effect (Table 1). The interaction term interval × chemosensory cue was found to be borderline significant, but the rest of the interaction terms were all found to be nonsignificant (Table 1). The change of the variance of speed between the habituation period and stimulus period appears to differ between some of the treatment groups (Fig. 8B), but ANOVA found the effects of the main factors and the interaction between them to be nonsignificant (Table 2).
Intraindividual variance of speed.
Discussion
The question of replicability has become increasingly important in both animal 37 and human research.38,39 One reason why results of a number of studies could not be properly replicated is that factors that influence the results in these studies might not have been properly controlled. 28 Perhaps most problematic is the possibility that we may not even know about all factors that can potentially influence the outcome of our studies.
The zebrafish is becoming increasingly popular in a variety of subfields of biology, one of which is behavioral neuroscience.3,5,40,41 Behavior, the ultimate output of the most complex organ, the brain, is sensitive to numerous factors. On the one hand, this sensitivity represents an advantage, as it allows one to detect functional alterations of the brain induced by a variety of manipulations.5,42 On the other hand, it poses an important challenge: increased variability. Increased variability may manifest as elevated error variation when an environmental factor fluctuated without our control within a study, or as a difference in the mean of performance of the studied experimental subjects if the environmental factor differed between these studies. To avoid these issues, it is important to uncover and understand the effects of as many environmental factors that could influence results as possible. In the current study, we focused our attention to two such possible factors: the salinity of and chemosensory cues in the water in which zebrafish are kept.
Zebrafish are known to withstand a wide range of environmental conditions. For example, they have been shown to thrive in water of a broad salinity range in their natural habitat.43–45 Although zebrafish may be able to adapt to a wide range of salinity conditions, and even to rapid changes in salinity, these environmental factors may still significantly influence many aspects of their biology, including their brain function and thus behavior both in nature and in the laboratory. In addition, although unlikely to be an important factor in the natural environment of the zebrafish, the presence versus the absence of chemosensory cues may be another environmental condition one has to pay attention to in the laboratory, where the use of reverse osmosis filtered water, and thus complete removal of olfactory cues, is common practice. Our current results demonstrate that both of these factors, salinity and chemosensory cues, indeed affect behavior. Thus, controlling these factors and making sure they do not change within a study, or across studies, is important to reduce variability of results, and to increase replicability and reliability of findings.
Our study uncovered numerous differences in behavior between fish housed in high- or low-salinity water with or without chemosensory cues present (a summary of the behavioral changes induced by treatment factors or their interaction is given in Table 4). For example, we detected significant interactions between salinity and chemosensory cues: fish exposed to high-salinity water with chemosensory cues present increased the distance to the animated conspecific images (social avoidance), whereas fish exposed to low-salinity water with chemosensory cues present did the opposite, that is, reduced the distance (social preference), and fish of the low-salinity group without chemosensory cues did not respond to the images at all (social ignorance). This result, in general, is in line with the known effects of water conditions on anxiety-like 29 and shoaling responses, whose function is believed to be predator avoidance.13–15,46
Behaviors are listed for which significant main effects and/or interaction terms were revealed.
Interval × salinity-dependent effect of chemosensory cues was also uncovered in vertical exploration, as fish exposed to high salinity with chemosensory cues absent showed increasing vertical exploration with time, whereas fish of the other groups showed less robust or opposite responses. Other examples of interacting effects of main factors are the salinity × interval-dependent change we found in variance of distance to stimulus screen and in absolute turn angle. Notably, the latter behavior was also affected by chemosensory cues.
On the other hand, some behaviors showed no such complex interaction-related effects, nevertheless, were found to be significantly affected by some treatment factors. Among them is variance of absolute turn angle and speed, both of which were affected by interval, as well as variance of speed, which was affected by all main factors (interval, salinity, and chemosensory cues), but without any interactions between or among these factors. Another example is distance to bottom, which was affected by interval as well as chemosensory cues. This latter finding is also noteworthy because distance to bottom has been interpreted as a measure of anxiety in fish,47–49 and others have already implicated the effect of water conditions on this behavioral response.28,29
The interpretation of these changes is complex both from a behavioral as well as a mechanistic standpoint. Briefly, we do not know enough to understand how and why these changes occurred, and through what mechanisms these environmental factors influenced the behavior and brain function of zebrafish. For example, salinity may alter a number of homeostatic processes that can have direct or indirect effects on brain function and thus behavior. Salinity has been found to affect growth hormone and insulin-like growth factor expression in the naked carp, a cyprinid relative of zebrafish. 50 It has been found to affect the expression of numerous endocrine genes in zebrafish. 51 Furthermore, prolactin receptor signaling was found to mediate the osmotic response of embryonic zebrafish, again raising the possibility that salinity may have significant effects on a variety of neurohormonal responses. 52
The mechanisms through which chemosensory cues may exert their effects on the zebrafish brain are practically unknown, but may be even more complex than those related to osmoregulation, that is, salinity of the water in which zebrafish are kept.53,54 Complications may arise as a result of the complexity of the biological mechanisms, but also because of the varied and potentially large number of olfactory and chemosensory cues that may be perceived by the zebrafish. In our article, we assumed that the main difference between the two conditions, chemosensory cues present and absent, is that the former contained cues excreted by conspecifics that swam in the water before the experimental fish were exposed to it. However, this water may also contain numerous other olfactory or chemosensory cues that originate from the food given to prior occupants of the water, and/or from the microorganisms that lived in this water.
In summary, likely the effects of salinity and chemosensory cues are complex, yet we have extremely limited understanding of the nature and underlying mechanisms of these effects. Nevertheless, results of our current study, together with those published in other pioneering reports 28 , Levin et al. 2 suggest that seemingly trivial environmental factors, such as salinity and the presence versus absence of chemosensory cues, may significantly affect brain function and behavior of zebrafish. The rapidly evolving sophisticated genetic and neurobiological tools designed for the zebrafish require increasingly more sensitive behavioral paradigms. For this reason, it is also increasingly important to know how different environmental factors or conditions may affect the brain and behavior of the zebrafish. The current article demonstrates that salinity and chemosensory cues are among environmental factors to which the experimenter must pay attention. We argue that detailed, systematic, and parametric analyses of the effects of these factors are warranted.
Footnotes
Acknowledgment
R.G. is funded by NSERC (Canada) grant no. 311637.
Disclosure Statement
No competing financial interests exist.