
Abstract
Abstract
We intended to perform optical and structural measurements on larval zebrafish eyes at 5 days post fertilization, that is, the earliest age at which zebrafish show visually guided behavior. However, excised larval crystalline lenses deteriorated quickly if immersed in a medium that gives good results with adult lenses from a variety of fish species. We suspected that the larvae have body fluids of lower osmolality and tested a medium with 240 mOsm, which is 75% of the established adult value of 320 mOsm. The optical quality of freshly excised and immersed lenses was used to judge the osmotic matches. In addition, we tested how well the shape of the eye is preserved in fixatives of different osmolalities. In both cases, 240 mOsm produced the best results. Immersed lenses performed better and the fixed eyes had a more natural shape. Our findings indicate that zebrafish body fluids have lower osmolality in larvae than in adults. This is probably due to an unfavorable body surface-to-volume ratio and incompletely developed regulatory mechanisms. Body fluid osmolality deviating from the adult value has to be taken into account in optical and histological work.
Introduction
F
Knowing the position of the lens and the shape of the eye is necessary, but insufficient, for understanding the optical performance of an eye. It is essential to know the lens' optics to investigate the eye's ability to form a sharp image. Measurement of the optical properties of lenses poses many challenges and some of the lens's features are inaccessible for direct measurement, such that modeling has to be used instead. Modeling enables one to study features of the optical properties of lenses, lens plasticity, and eye development that cannot be studied by other means.6–8
To create realistic models useful for studying eye performance, we wanted to do measurements on larval fish, which possess among the smallest vertebrate eyes and lenses. The aim was to directly measure the optics and physical dimensions of larval eyes to investigate whether the eyes of such small animals can form well-focused images early in development. We chose zebrafish (Danio rerio) because of their small size, easy access and rapid development. Zebrafish have functional lenses 3 days postfertilization (dpf) 9 and capture prey when the larvae start to swim at 5 dpf. Initially, we investigated extracted lenses immersed in a well-established, standard solution that produces reliable results in vitro with lenses of adult fish of various species (modified H10 solution).10–12 However, this immersion medium caused rapid optical deterioration of the larval lenses.
Freshwater fish larvae, having an unfavorable body surface-to-volume ratio, may be unable to maintain high, adult-level body fluid osmolality in a medium of considerably lower osmolality. In consequence, body fluid osmolality may be lower in larvae than in adults. Improper osmolality has a deleterious effect on biological tissues13–15 and for that reason, we suspected that an imbalance in tonicity had the destructive effect on larval lenses that we had observed. Lower osmolality has been used in some studies on zebrafish larvae, but no justification or reference has been provided.16,17 Most authors assume that adults and larvae share the same osmolality of body fluids.18–20
In the eye, the lens is immersed in aqueous humor, which is similar to the interstitial fluid. 21 Therefore, an excised and immersed crystalline lens can be used as a tool to judge the osmotic match between the immersion medium and the body fluids of the animal. Such relationship exists in adult fish. 10 However, even in an osmotically perfectly matched immersion medium, the optical quality of the crystalline lens deteriorates to some degree. 10 We therefore monitored the rate and final degree of optical deterioration to determine the quality of the osmotic match between the immersion medium and the body fluids.
In addition, we fixed whole zebrafish larvae (5 dpf) in fixatives of different osmolalities and compared the shapes of the fixed eyes with living eyes. We compared the textbook osmolality for adult fish (320 mOsm)18,20 and solutions with 75% of that value (240 mOsm). This osmotic concentration was chosen based on earlier, preliminary observations. The results show that the lower osmolality was better in both the optical experiments and in preserving eye shape during fixation. This indicates that zebrafish larvae indeed have body fluids of lower osmolality than adults do.
Materials and Methods
Animals
Hatched zebrafish larvae (4 dpf) were obtained from the Biomedical Center of Lund University and experiments were performed at 5 dpf when larval zebrafish initiate exogenous feeding. All procedures were in accordance with Swedish and EU legislation regulating the use of animals for scientific purposes and sanctioned by the Malmö/Lund ethics committee.
Osmotic concentration (osmolarity vs. osmolality)
All measurements of osmotic concentration were performed with The Advanced Micro Osmometer, model 3300 (Advanced Instruments, Inc.). When “mOsm” is used in this study, it means milliosmoles per kilogram of solvent (osmolality). In case of small osmotic concentrations, such as in this study, the difference between osmolarity (osmoles per liter of solution) and osmolality is negligible.
Lens deterioration measurements
Measurements were performed in trials consisting of two osmolalities: 240 and 320 mOsm. The order of osmolalities for each trial was chosen randomly. After sacrificing a zebrafish larva by decapitation, its head was moved to a container with an immersion medium (modified H10; Refs.10,22–25) of the tested osmolality and the lens (diameter ∼100 μm) was excised from one eye. Only one lens was used from each larva to minimize the time between sacrificing the fish and the start of the measurement.
The excised lens was placed on a microscopy glass slide with a copper grid used in transmission electron microscopy (Ted Pella, Inc.). The size of the openings of the grid was approximately twice the diameter of the lens, so that its movements were restricted. The lens was at all times immersed in a drop of immersion medium. A plastic tube was placed over the lens and sealed with petroleum jelly. This provided a water-tight seal and did not influence the osmolality of the immersion medium. The cylinder with the lens inside was filled with the tested immersion medium. The glass slide with lens, cylinder, and immersion medium was then moved to the measurement setup (Fig. 1A).
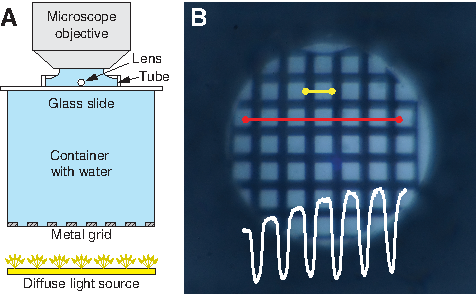
The glass slide was placed on a cylindrical, water-filled acrylic container that served as a distance element (80 mm) to another grid (5 mm openings) used as a visual pattern at the bottom of the cylinder. This grid was diffusely illuminated from beneath. The microscope had a water immersion objective that was lowered into the immersion medium above the lens. Then, the microscope was focused on the image of the grid formed by the larval zebrafish lens. The lens was discarded if the image was not sharp. In case of good image quality (Fig. 1B), a series of 90 micrographs (every 10 s for 15 min) was recorded. The time elapsed between eye dissection (i.e., exposure of the lens to the immersion medium) and the first micrograph captured was noted. The temperature was constant at 22°C during the course of the experiment.
Micrographs and data analysis
The micrograph sets of 90 frames were analyzed with a custom-written program (MATLAB; MathWorks, Inc.). For each set of frames, two pairs of points were selected on the first micrograph. The first pair marked a line along which intensity values were extracted from each frame within the set. The line crossed a maximal number of perpendicularly oriented bars of the imaged pattern (Fig. 1B, long red line). As a result, an intensity profile (IP) of a square-like function (Fig. 1B, white overlay) was extracted from each frame. The second pair of points indicated one period of the pattern (stretching in the micrograph over one bar and one window of the grid pattern) and was used as a base for low-pass filtering (Fig. 1B, short yellow line). In some cases, slight movement of the measured lens during the 15 min of recording shifted the created image. In such a case, it was necessary to redefine the measurement line such that it properly crossed the bars of the pattern on all frames, producing a useful IP for each frame.
The IPs of all frames within a set were analyzed by a fast Fourier transform (FFT). For each frame, the program identified the spatial frequency in the micrograph corresponding to the spatial frequency of the grid pattern by low-pass filtering and derived the intensity amplitude at this frequency. This amplitude indicated how much contrast the fish lens was able to transfer for that particular frequency. The decrease in contrast over time was used as a measure of lens deterioration and was calculated from the set of frames from each lens (further referred to as “amplitude profile”).
The amplitude profiles of all lenses (Fig. 2A) were aligned along the time scale with exposure of the lens to the immersion medium as the common starting point (Fig. 2B). In the next step, the amplitude profiles were cropped along the time scale such that all data sets had a data point for each frame left in the analysis (Fig. 2C). Finally, each amplitude profile was normalized to 100%, which indicated the quality of the best frame in a set (Fig. 3). This normalization of the signals allowed for conversion from the amplitude of a spatial frequency to image quality because there is a direct link between the two quantities (i.e., the optical transfer function 26 ). The amplitude profiles therefore describe relative image quality over time and are a measure of how well the fish lens performed in the chosen osmolality.
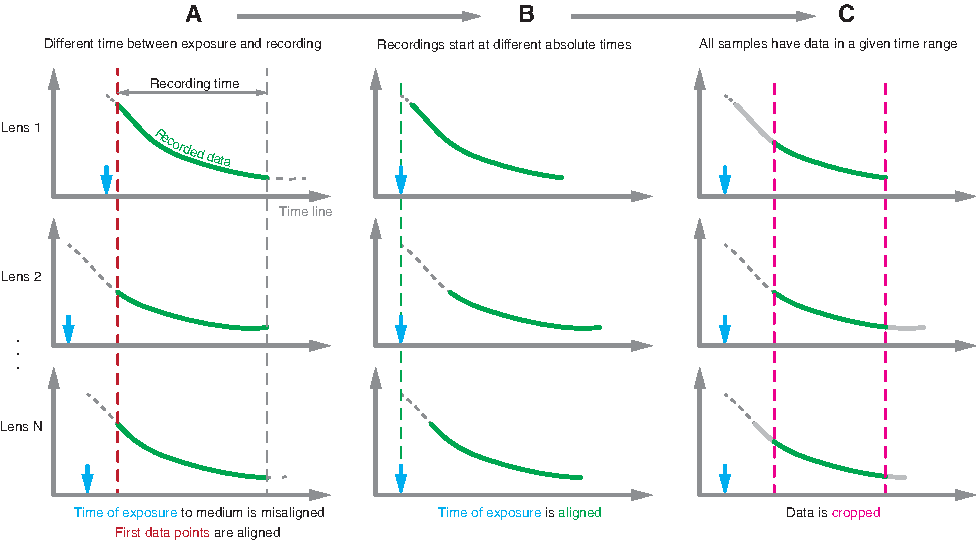
Schematic of data analysis.
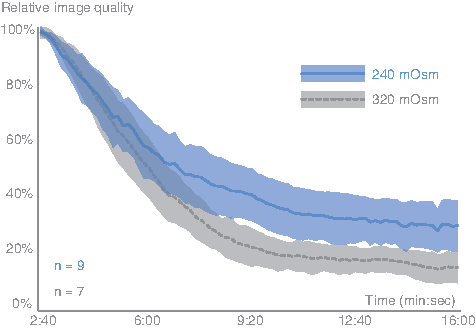
Influence of osmolality on image quality over time. Blue: 240 mOsm in the immersion medium (n = 9), gray: 320 mOsm (n = 7). Shaded areas around the curves are 95% confidence intervals. Relative image quality of larval fish lenses (5 dpf) deteriorated less and at a slower rate if the lenses were immersed in a solution of 240 mOsm instead of the adult standard of 320 mOsm. Note that the time scale does not start at zero, which was the moment the eye was pierced. The time window was chosen such that there were data points from all lenses at all time points.
The profiles of relative image quality were averaged for each osmolality group (240 mOsm: n = 9, 320 mOsm: n = 7) (Fig. 3). The statistical analysis was done in IBM SPSS Statistics (Version 21). The Repeated Measure General Linear Model was used with time as a within-subjects factor (the data from each frame was used as a separate time point) and osmolality of the immersion medium as a between-subjects factor.
Fixation and sample processing
Three fixatives were prepared for this study. In two of them, we adjusted osmolality to 240 and 320 mOsm (F-240 and F-320, respectively). The third one was Karnovsky fixative (F-K), 27 a fixative commonly used in histology. A comprehensive overview on fixatives and their osmolalities was beyond the scope of this study. Distilled water, Sørensen sodium phosphate buffer, 28 and 25% Glutaraldehyde (GA) were mixed to achieve 1% GA in a 0.05 M buffer (Table 1). This fixative had an osmolality of about 240 mOsm (Table 1). Sucrose was added to increase osmolality to about 320 mOsm, which yielded the F-320 fixative. F-K contained paraformaldehyde (PFA) in addition and had final concentrations of 2.5% GA and 2% PFA in 0.1 M buffer.
GA, glutaraldehyde; PFA, paraformaldehyde; SB, Sørensen sodium phosphate buffer.
In each fixative, six larval fish were fixed in a volume of 5 mL for 3 h in 4°C, exceeding the recommended minimum volume and time.29,30 After fixation, the samples were dehydrated and embedded in epoxy (R1031 AGAR 100 Resin Kit, Agar Scientific, Stansted, Essex). Three micrometer sections were prepared with a microtome (11800 Pyramitome; LKB Bromma, Sweden), stained with Richardson solution, 31 and mounted on glass slides to be viewed under a light microscope.
Retina measurements
The thickness of the retina was measured along the optical axis of the eye from the light microscopy micrographs of sections through the center of the eye. One-way analysis of variance (ANOVA) was performed using SPSS with the fixative type as a grouping factor. After the null hypothesis (all groups are the same) had been rejected, t-tests were performed between all possible pairs of groups.
Results
Lens deterioration
Figure 3 illustrates that lenses immersed in a medium of 240 mOsm decayed optically at a slower rate and stabilized at higher quality level (30% vs. 15%) than lenses immersed in a 320 mOsm medium. A medium of even lower osmolality (180 mOsm) was also tested, but the deterioration was too rapid for any measurements. Statistical analysis showed that time was not the only factor causing the quality of the lenses to deteriorate. There also was a significant effect of osmolality on each individual lens (within-subjects effect, p = 0.048). Most importantly, there was a significant effect of osmolality on the shape of the relative image quality profiles (quadratic effects, p = 0.049).
Fixation
Photographs of typical sections through the center of the eye, indicated by the optic nerve, are shown in Figure 4. The most notable difference between the samples is in the shape of the cornea. It is smooth and spherical as in a living animal after fixation in F-240 (Fig. 4A). Fixation in F-320 resulted in a somewhat folded cornea (Fig. 4B). The cornea collapsed completely onto the lens and iris in F-K (Fig. 4C). Likewise, the thickness of the fixed retina decreased with increasing osmolality of the fixative (Fig. 4; F-240: 86 ± 3 μm, F-320: 72 ± 3 μm, F-K: 61 ± 3 μm). The null hypothesis of the ANOVA was rejected with p << 0.001 and the t-tests showed significant (p << 0.001) differences between all possible pairs of groups (fixatives).
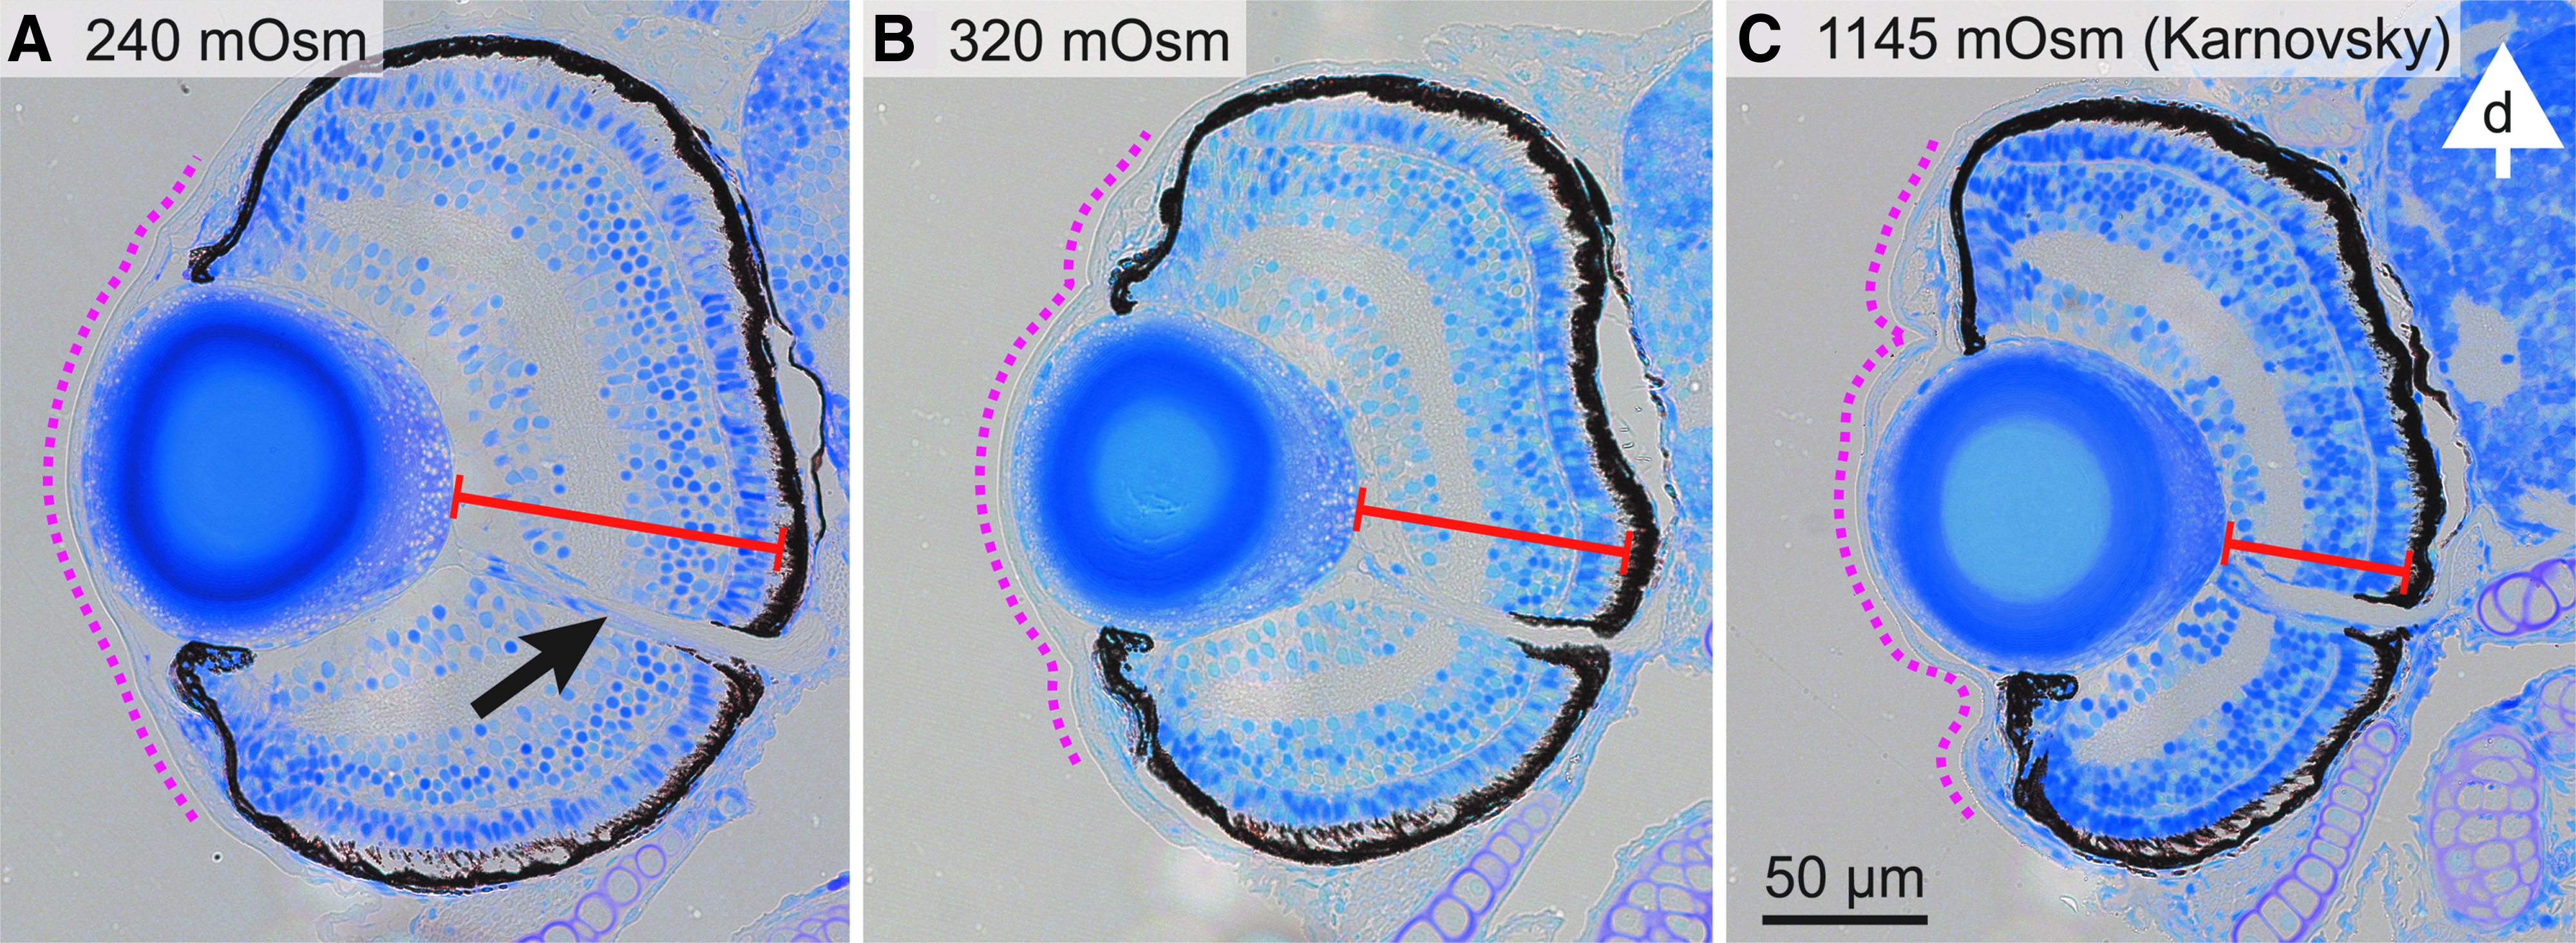
Sections of larval eyes fixed in solutions of different osmolalities. Sections are along a transverse plane of the animal and include the optic nerve (black arrow). The white arrow indicates the dorsal direction, and the scale bar applies to all images. Note the shape of the cornea (dotted line) and the thickness of the retina (solid red line). In
Discussion
Our findings suggest that zebrafish larvae have lower osmotic concentration in their body fluids than adult fish. We achieved a considerable improvement in the results of optical measurements on larval lenses and in the fixation of larval eyes by lowering the osmolality of the immersion medium and the fixative, respectively, below the value suitable for adult fish of various species.
Direct measurement of the osmotic concentration of larval body fluids is unrealistic due to the small sizes of the animals. Larval zebrafish eyes are so small (∼300 μm in diameter) that they hardly have any aqueous and vitreous bodies that can be extracted for measurement. Existing techniques of direct osmolality measurement in larvae 32 are either unreliable or require blood samples as small as few tens of nanoliters, which are prone to evaporation and contamination. We therefore propose an alternative approach using the effect of the immersion medium on the optical quality of excised crystalline lenses. The ability of the lens to transfer contrast can be quantified and the optical transfer function links contrast in the image to the quality of the lens. 26 Results from such an indirect method used on adult fish are consistent with direct measurement of the vitreous body in an osmometer. 10
A complication in such indirect measurement is that even the best immersion medium cannot sustain the lens in the same way as an intact eye. Consequently, time itself has a negative effect on the optical quality of the excised lens. Some initial deterioration occurs also in less sensitive, adult lenses. 10 Osmolality matches were therefore evaluated by using the speed of the initial deterioration and the final quality level at which the lens stabilized. We applied FFT to improve the precision of our contrast measurements because the method evaluates contrast in the IP as a whole rather than only between two arbitrarily selected points, and therefore is robust against uneven lighting conditions (visible in Fig. 1B).
Larval lenses immersed in a medium of 240 mOsm deteriorated at a slower rate and stabilized at a higher quality level than lenses immersed in 320 mOsm (Fig. 3). The quality of a crystalline lens is critically dependent on the distribution of refractive index inside the lens, 6 which in turn is a function of the distributions of proteins and water.33,34 Any change in the composition inside the lens, especially in its periphery, influences the optical properties of the lens. 5 Immersion in a medium of too high osmolality quickly destroys the optimal refractive index distribution and thus the optical quality of the lens because of water migrating out of the lens. Note that osmolality of the immersion medium was increased with only one reagent (sucrose); so we cannot exclude effects other than those caused by osmolality. However, sucrose is often used in histology for adjusting osmolality with no or little effects on other parameters 35 and the series of fixations in fixatives of different osmolalities gave the effects expected from the lens immersion experiments (Fig. 4).
Immersion in 240 mOsm produced good results for lenses from zebrafish larvae at 5 dpf, but the optimal value can be expected to be different in other age groups. The body surface-to-volume ratio becomes more favorable with growth36,37 because body volume increases faster than the surface area. In addition, the regulatory systems are not yet fully functional at 5 dpf. For example, zebrafish relies only on pronephros from 3 dpf 38 until 7 dpf when they start using their gills for osmoregulation. 17 It was beyond the scope of our study to investigate the gradual change from low osmolality in larvae to the adult value of 320 mOsm.18,20,39 Although 320 mOsm has produced good results in both freshwater and marine adult fish of various species,10,12,40 newly hatched larvae may start at a different osmolality.
Osmotic mismatches can cause artifacts in histology. Loqman et al. 14 showed that osmolality has a stronger effect on the quality of fixation than the concentration of the fixative. They concluded that osmolality-induced changes in the tissue occur at a faster rate than fixation, such that an osmotically mismatched fixative preserves the sample in an already altered state. We observed this effect in larvae fixed in F-320 and F-K. The commonly used F-K has an osmotic concentration over four times too high for 5 dpf zebrafish larvae and, in consequence, the fixed eyes were heavily deformed. This phenomenon can be observed in many studies involving fixed larval eyes.41–45 Effects of osmolality mismatch may be weaker in other types of tissue, for example, hard or dry tissue.
We obtained good results with 240 mOsm in zebrafish at the age of 5 dpf in both of our dissimilar experiments. Therefore, we conclude that the body fluids of zebrafish larvae are lower in osmolality than the adult value of 320 mOsm and this may also be true in other species. The change in osmolality of the body fluids from larval stages to adulthood has to be taken into account in work on fish crystalline lenses and for optimal fixation of whole fish eyes.
Footnotes
Acknowledgments
This work was supported by the Knut and Alice Wallenberg Foundation (KAW 2011.0062). The authors are grateful to Eva Landgren for preparing sections, Carina Rasmussen for general laboratory help and fruitful discussions about fixatives, Atticus Pinzón-Rodríguez for valuable feedback on figure design, and Jessica Abbott for statistical advice. Our gratitude goes to Cynthia Tedore for correcting the English of the article.
Disclosure Statement
No competing financial interests exist.