
Abstract
Abstract
Sprint performance is important ecologically and physiologically, and it can influence fitness by determining outcomes of predator–prey relationships, for example, and it can confer substantial human health benefits. In this article we test whether zebrafish (Danio rerio) are a suitable model to test hypotheses about the effects and consequences of sprint exercise training, and the physiological underpinnings of sprint performance. We show that stage 3 c-starts that capture the initial escape response of fish lasting <1 s were repeatable within individuals. In addition, somewhat longer constant acceleration protocols lasting 10 s (U10s) or 30 s (U30s) were highly repeatable within individuals over 3, 6, and 23 days. C-starts within individuals were not correlated with either U10s or U30s, indicating that these measures reflect different physiological aspects of sprinting. Stage 3 c-starts and U10s responded positively to sprint exercise training. Our exercise training protocol (5 × 10 s sprints with 5-min rest periods on 4 days per week for 3 weeks) was based on the human sporting literature, and together, our results indicate that zebrafish are a good model to assess the physiological and behavioral consequences of sprint exercise training.
Introduction
Sprint performance is important ecologically because it can affect fitness by influencing behavioral interactions, competition, and predator–prey relationships. 1 Sprint exercise training is also a dominant training mode among human athletes, and sprint training can lead to significant health benefits among humans. 2 A robust model for sprint exercise training is therefore essential to understand the physiological underpinnings of sprint performance and sprint training. In this article, we test whether different sprint performance measures are consistent and repeatable within individual zebrafish (Danio rerio), and whether zebrafish respond positively to sprint exercise training so that the species could be used for future investigations of the ecology and physiology of sprint performance. The advantages of a zebrafish model are their low cost, easy maintenance, and tractability, combined with recent insights that the species shows very similar physiological profiles to other vertebrates such as humans and rodents.3,4 Zebrafish are also an established aerobic exercise model,5,6 and it would be advantageous if the species could also be used as a sprint exercise model.
A sprint is defined as a rapid acceleration from a stationary position or low-velocity movement to maximal velocity over a short period7,8 that lasts somewhere between 1 and 30 s.7,9,10 Sprint and endurance exercise are distinct physiologically because the greater force required for sprint performance leads to increased recruitment of large (fast) motor units that are characterized by high force production, low fatigue resistance, and anaerobic ATP supply.11–14 Zebrafish axial muscle comprises slow, red muscle fibers at the lateral periphery (adaxial) and white, fast fibers at the center of the tail. 5 C-starts are commonly measured as a proxy for sprint performance in fish. C-starts are extremely short (<1 s) and represent the initial movement of an induced escape response 15 that is ecologically relevant 16 but does not necessarily capture sprint performance. In addition, chases and escapes often last longer than the very short c-start. 17 The swimming after the initial escape response is somewhat longer in duration and may better approximate sprint performance. 18 In constant acceleration tests, fish are typically introduced into a swimming flume and flow speed is increased at a steady rate until fish can no longer hold their position in the water column. 19 In the literature, these tests usually extend over several minutes, so that they represent a mixture between sprint and endurance exercise. Note, however, that the length of exercise that constitutes anaerobic sprint performance or aerobic endurance performance depends on oxygen delivery dynamics and can therefore differ between species and vary with body mass. 20
Our aim was to provide more finely tuned measures of sprint performance in zebrafish lasting from c-starts up to 30 s in length, and to test whether these different sprint performance measures respond to sprint exercise training. Hence, we measured repeatability within individuals of c-starts and of performance in two constant acceleration protocols lasting 10 and 30 s. We used a sprint exercise training program based on the human sporting literature to assess the effect of sprint exercise training on the different measures of sprint performance to determine whether zebrafish could be used as a sprint exercise model for future studies.
Materials and Methods
Study animals
All animal handling and experimental procedures were conducted with the approval of the University of Sydney Animal Ethics Committee (approval number: 2016/982).
Adult short-fin zebrafish, D. rerio, were purchased from a commercial supplier (Livefish, Bundaberg, Australia) and kept individually in perforated 1 L plastic containers to enable tracking of individuals. Individual containers were submerged in larger tanks (645 × 423 × 276 mm; 10 containers per tank) of dechlorinated water, and the perforations in the containers permitted water flow, and chemical and visual contact between individuals. Each tank contained an air filter connected to an air pump (AC-9908; Resun, China), and a 30% water change was done once a week. Water in the holding tanks and during all experiments was kept at 23°C (±0.5°C) using submersible heaters (200 W; AquaWorld, Australia). Fish were fed fish food flakes (Wardley Total Tropical Flake Blend; Hartz Mountain Company, Secaucus, NJ) until satiation once daily, and were exposed to a 12-h light:12-h dark light cycle. All fish were kept under these conditions for at least 1 week before experiments, and during experimental treatments.
All experimental fish were weighed on an electronic balance (Navigator NV; Ohaus), and we photographed each fish (with an Exilim EX-ZR200A, USA camera; Casio, Dover, NJ) to determine standard length in Tracker Video Analysis and Modeling Tool 4.01 (Open Source Physics, www.opensourcephysics.org).
Sprint swimming performance
We determined c-starts of fish as the initial movement of an induced escape response. 15 During c-starts, the body bends into a “c” shape before forward propulsion, and we analyzed three stages according to the definitions given in Domenici and Blake 15 : stage 1 is defined as the preparatory stroke from a stationary position until the maximum bend of the body into a “c”; stage 2 is the propulsive stroke starting at the completion of stage 1 to the most extreme bending of the body into the opposite direction, and stage 3 is defined as the coasting after completion of stage 2 until the start of the next stroke to a maximum of 10 frames (0.083 s). The mean ± standard error (SE) duration of stage 1 was 0.014 ± 0.00059 s and of stage 2 it was 0.024 ± 0.0014 s. We analyzed the maximum speed of stage 3, and given the short durations of stages 1 and 2 we analyzed the average speed for these stages. 21
Fish were introduced into a plastic tray (405 × 600 mm) filled with water to a depth of 25 mm. A camera (Exilim EX-ZR200A; Casio) was used to film fish from above at 120 frames s−1, and a submerged 300 mm ruler was used as a scale. When stationary, fish were lightly tapped on the tail with a paint brush to elicit an escape response. The ensuing escape responses were analyzed in Tracker Video Analysis and Modeling software (4.01, Open Source Physics, www.opensourcephysics.org) using the fish center of mass as the tracking point. The center of mass was defined as the location at 0.35 body lengths from the tip of the snout. 22 For each fish, four consecutive escape responses were analyzed, and the fastest speed was used in the analysis. In the analysis, we only used escape responses when fish were not impeded by the edge of the tank.
We designed two new methods to measure sprint swimming performance lasting longer that a c-start: accelerated sprint (U10s; 10 s) and critical sprint speed (U30s; 30 s). In the literature, 23 sprints are defined as lasting up to 30 s, so that c-starts only represent the very short end of the spectrum. We therefore devised U10s and U30s to test sprint responses within the full range of the literature definition. Both tests were conducted in cylindrical, Blazka-style swimming flumes (21 mm diameter × 150 mm length). Each flume was fitted tightly over the intake end of a submersible pumps (12V DC, iL500; Rule, Hertfordshire, United Kingdom). Between the intake of the pump and the swimming section of the flume, we fitted a fine, elastic nylon mesh net that caught fish and prevented injury when animals fell back in the water current at high flow velocities. We adjusted flow through the flumes by changing the voltage input into the pumps with a DC-regulated power supply (NP9615; Manson Engineering Industrial, Hong Kong). A flow meter (DigiFlow 6710M; Savant Electronics, Taichung, Taiwan) fitted to the outlet of the pump measured flow velocity in real time. A bundle of hollow straws at the intake end of the flume helped maintain laminar flow. The flume and pump assembly were placed into a tank (650 × 420 × 280 mm) filled with aged, dechlorinated water for sprint tests.
The U10s test is a constant acceleration test, where fish were introduced into the flume and swam at an initial flow rate of 0.05 m s−1 for 30 s. After that, the U10s test started and water flow was continuously increased by an average of 0.05 m s−1 every 1 s until fish could no longer maintain their position in the water column and fell back against the mesh net. Trials lasted ∼10 s. We recorded the maximum flow speed a fish achieved while still holding its position in the water column as the maximum sprint performance.
U30s was designed as a longer test of ∼30 s, which is at the upper end of sprint performance. To determine U30s, fish started at an initial flow rate of 0.38 m s−1, and water flow was incrementally increased by 0.05 m s−1 every 10 s (Ti, time interval) until fish fell back against the mesh net. Trials lasted 30 s on average. We used the same calculations as for critical sustained swimming speed 24 to determine U30s. Hence, the final velocity reached (Uf), time swum at the final velocity (Tf), and the fasted velocity increment completed (Uc) were recorded and used to calculate U30s (m s−1) = Uc + Tf/Ti × Uf.
Repeatability of sprint swimming performance
We determined the repeatability of c-starts, U10s, and U30s performance in N = 25 fish (mean length ± SE = 33.6 ± 0.41 mm, mean mass = 0.55 ± 0.021 g). Each fish performed each test three times, after an initial trial (day 0) we repeated measures 3 days later (day 3) and 6 days later (day 6). Trials were staggered so that each fish performed one trial (c-start, U10s or U30s) per day. We also measured longer term repeatability after 23 days in the control fish used for the exercise training experiment (N = 18 fish; see Sprint exercise training section for details), which were different from the 25 fish used previously.
Sprint exercise training
We split 40 fish into a sprint exercise training or a control treatment (N = 18 for the control, nontrained group, and N = 22 for the trained group), and treatments were dispersed across four tanks each. Sprint exercise training consisted of five repetitions of the U10s protocol separated by 5-min rest intervals during which fish remained in the flume but with no water flow. We chose to separate each repetition of U10s by 5-min rest intervals because this protocol was effective at increasing performance and eliciting biochemical responses in human skeletal muscle.23,25 Sprint exercise training was conducted 4 days a week for 3 weeks. During a week, fish trained for 2 consecutive days followed by 1 rest day, then 2 more days of exercise training followed by 2 rest days. Fish from the control treatment remained in housing tanks for 3 weeks. We measured the initial (0 weeks) and final (3 weeks) c-start, U10s, and U30s performance of each individual from both treatments to determine whether differences between treatments existed before starting the exercise training, and whether duration in captivity and sprint exercise had an effect on performance. As above, one performance measurement was conducted for each individual per day. At the end of the exercise training period, the mean (±SE) length of control fish was 28.9 ± 0.33 mm with mean mass of 0.50 ± 0.019 g, and exercise-trained fish were 28.7 ± 0.42 cm with mean mass of 0.50 ± 0.019 g.
Metabolic enzyme assays
We assessed whether exercise training affected muscle metabolic capacities of fish by measuring (in N = 18 fish per exercise training and control treatments) activities of lactate dehydrogenase (LDH), creatine kinase (CK), and citrate synthase (CS). After sprint exercise training treatments were completed, fish were anesthetized (in Aqui-S, Lower Hutt, New Zealand) and euthanized by decapitation. Back and tail skeletal muscle was extracted, skinned, immediately transferred to liquid nitrogen, and stored at −80°C. Muscle samples were homogenized (in a TissueLyser LT; Qiagen, Venlo, the Netherlands) in 9 volumes RIPA buffer (20 mM Tris-Cl pH 7.5, 150 mM sodium chloride, 1 mM EDTA, 1 mM EGTA, 1% NP40, 1% sodium deoxycholate) and protease inhibitor cocktail (cOmplete, EDTA-free; Roche Life Sciences, Germany) solution. Homogenates were diluted to 1:20 for measurements of LDH and CS activities, and to 1:1000 for measurements of CK activity. Following published protocols 26 we measured enzyme activities at 23°C using a ultraviolet/visible spectrophotometer (Ultrospec 2100 Pro; Biochrom, Cambridge, United Kingdom) with a temperature-controlled cuvette holder.
Statistical analyses
We tested repeatability of the different sprint performance measures within individuals using the rptR package 27 in R that uses mixed-effect models to test for the variance explained by within- and between-subject effects. Statistical significance of repeatability was tested by permutation tests, 27 and we report the repeatability, R, and permutational p-values. Note that rptR calculated repeatability across days 0, 3, and 6 simultaneously, and we ran a separate analysis for the 23-day comparison because we used different fish for this experiment. We determined whether stage 3 c-starts, U10s, and U30s measured on day 0 were correlated using a permutational analysis of covariance in the R package lmPerm. 28
We used two-factor permutational analyses in lmPerm 28 to compare control and exercise-trained fish (factor = training) before and after 3 weeks of training (factor = time). Similarly, we used permutational analyses to analyze the time course of changes in U10s in response to training using time (week 0–3) as the single factor. We used individual fish id as random factor, and we followed significant result with simple post hoc permutational comparisons of mean values. Enzyme activities were compared between control and exercise-trained fish after 3 weeks of training using permutational analyses.
We present sprint swimming performance normalized to body length (BL s−1), but used absolute performance (in m s−1) in the analyses with length as covariate. Enzyme activity is given as micromole of substrate converted into product per minute per gram of wet tissue.
Results
Repeatability and correlation of sprint performance measures
The speed of c-starts at stage 1 was not repeatable within individuals after 3 and 6 days (repeatability R = 0.12, p = 0.15; Fig. 1A), but it was repeatable in our second data set after 23 days (R = 0.62, p = 0.002). Similarly, during stage 2 speed was not repeatable after 3 and 6 days (R = 0.075, p = 0.25) but it was after 23 days (R = 0.46, p = 0.017; Fig. 1B). Stage 3 was repeatable at a one-tailed probability (R = 0.17, p = 0.068) between days 3 and 6, and it was repeatable after 23 days (R = 0.41, p = 0.036; Fig. 1C).

Repeatability of sprint performance. Initial (day 0) stage 1
Both U30s (Fig. 1D) and U10s (Fig. 1E) were significantly repeatable after 3 and 6 days (R = 0.73, p < 0.001, and R = 0.42, p < 0.001, for U30s and U10s, respectively). Similarly, U30s and U10s were significantly repeatable after 23 days (R = 0.51, p < 0.01 and r = 0.74, p < 0.001, respectively; Fig. 1D, E).
Stage 3 c-starts were not correlated with either U30s (p = 0.15; Fig. 2A) or U10s (p = 0.98; Fig. 2B), but U10s and U30s were correlated (p = 0.0024; Fig. 2C).

Association between different measures of sprint performance. Stage 3 c-start, Asprint, and Usprint were measured in the same individuals (N = 43) on separate days. C-starts were not correlated with either Usprint
Sprint exercise training
Exercise training for 3 weeks did not increase speed during c-start stage 1 (time: p = 0.087, training; p = 0.82, time × training interaction: p = 0.24; Fig. 3A) compared with controls. However, exercise training increased speed of stage 2 (time × training interaction: p = 0.028; Fig. 3B) and stage 3 c-starts (time × training interaction: p = 0.0018; Fig. 3C).
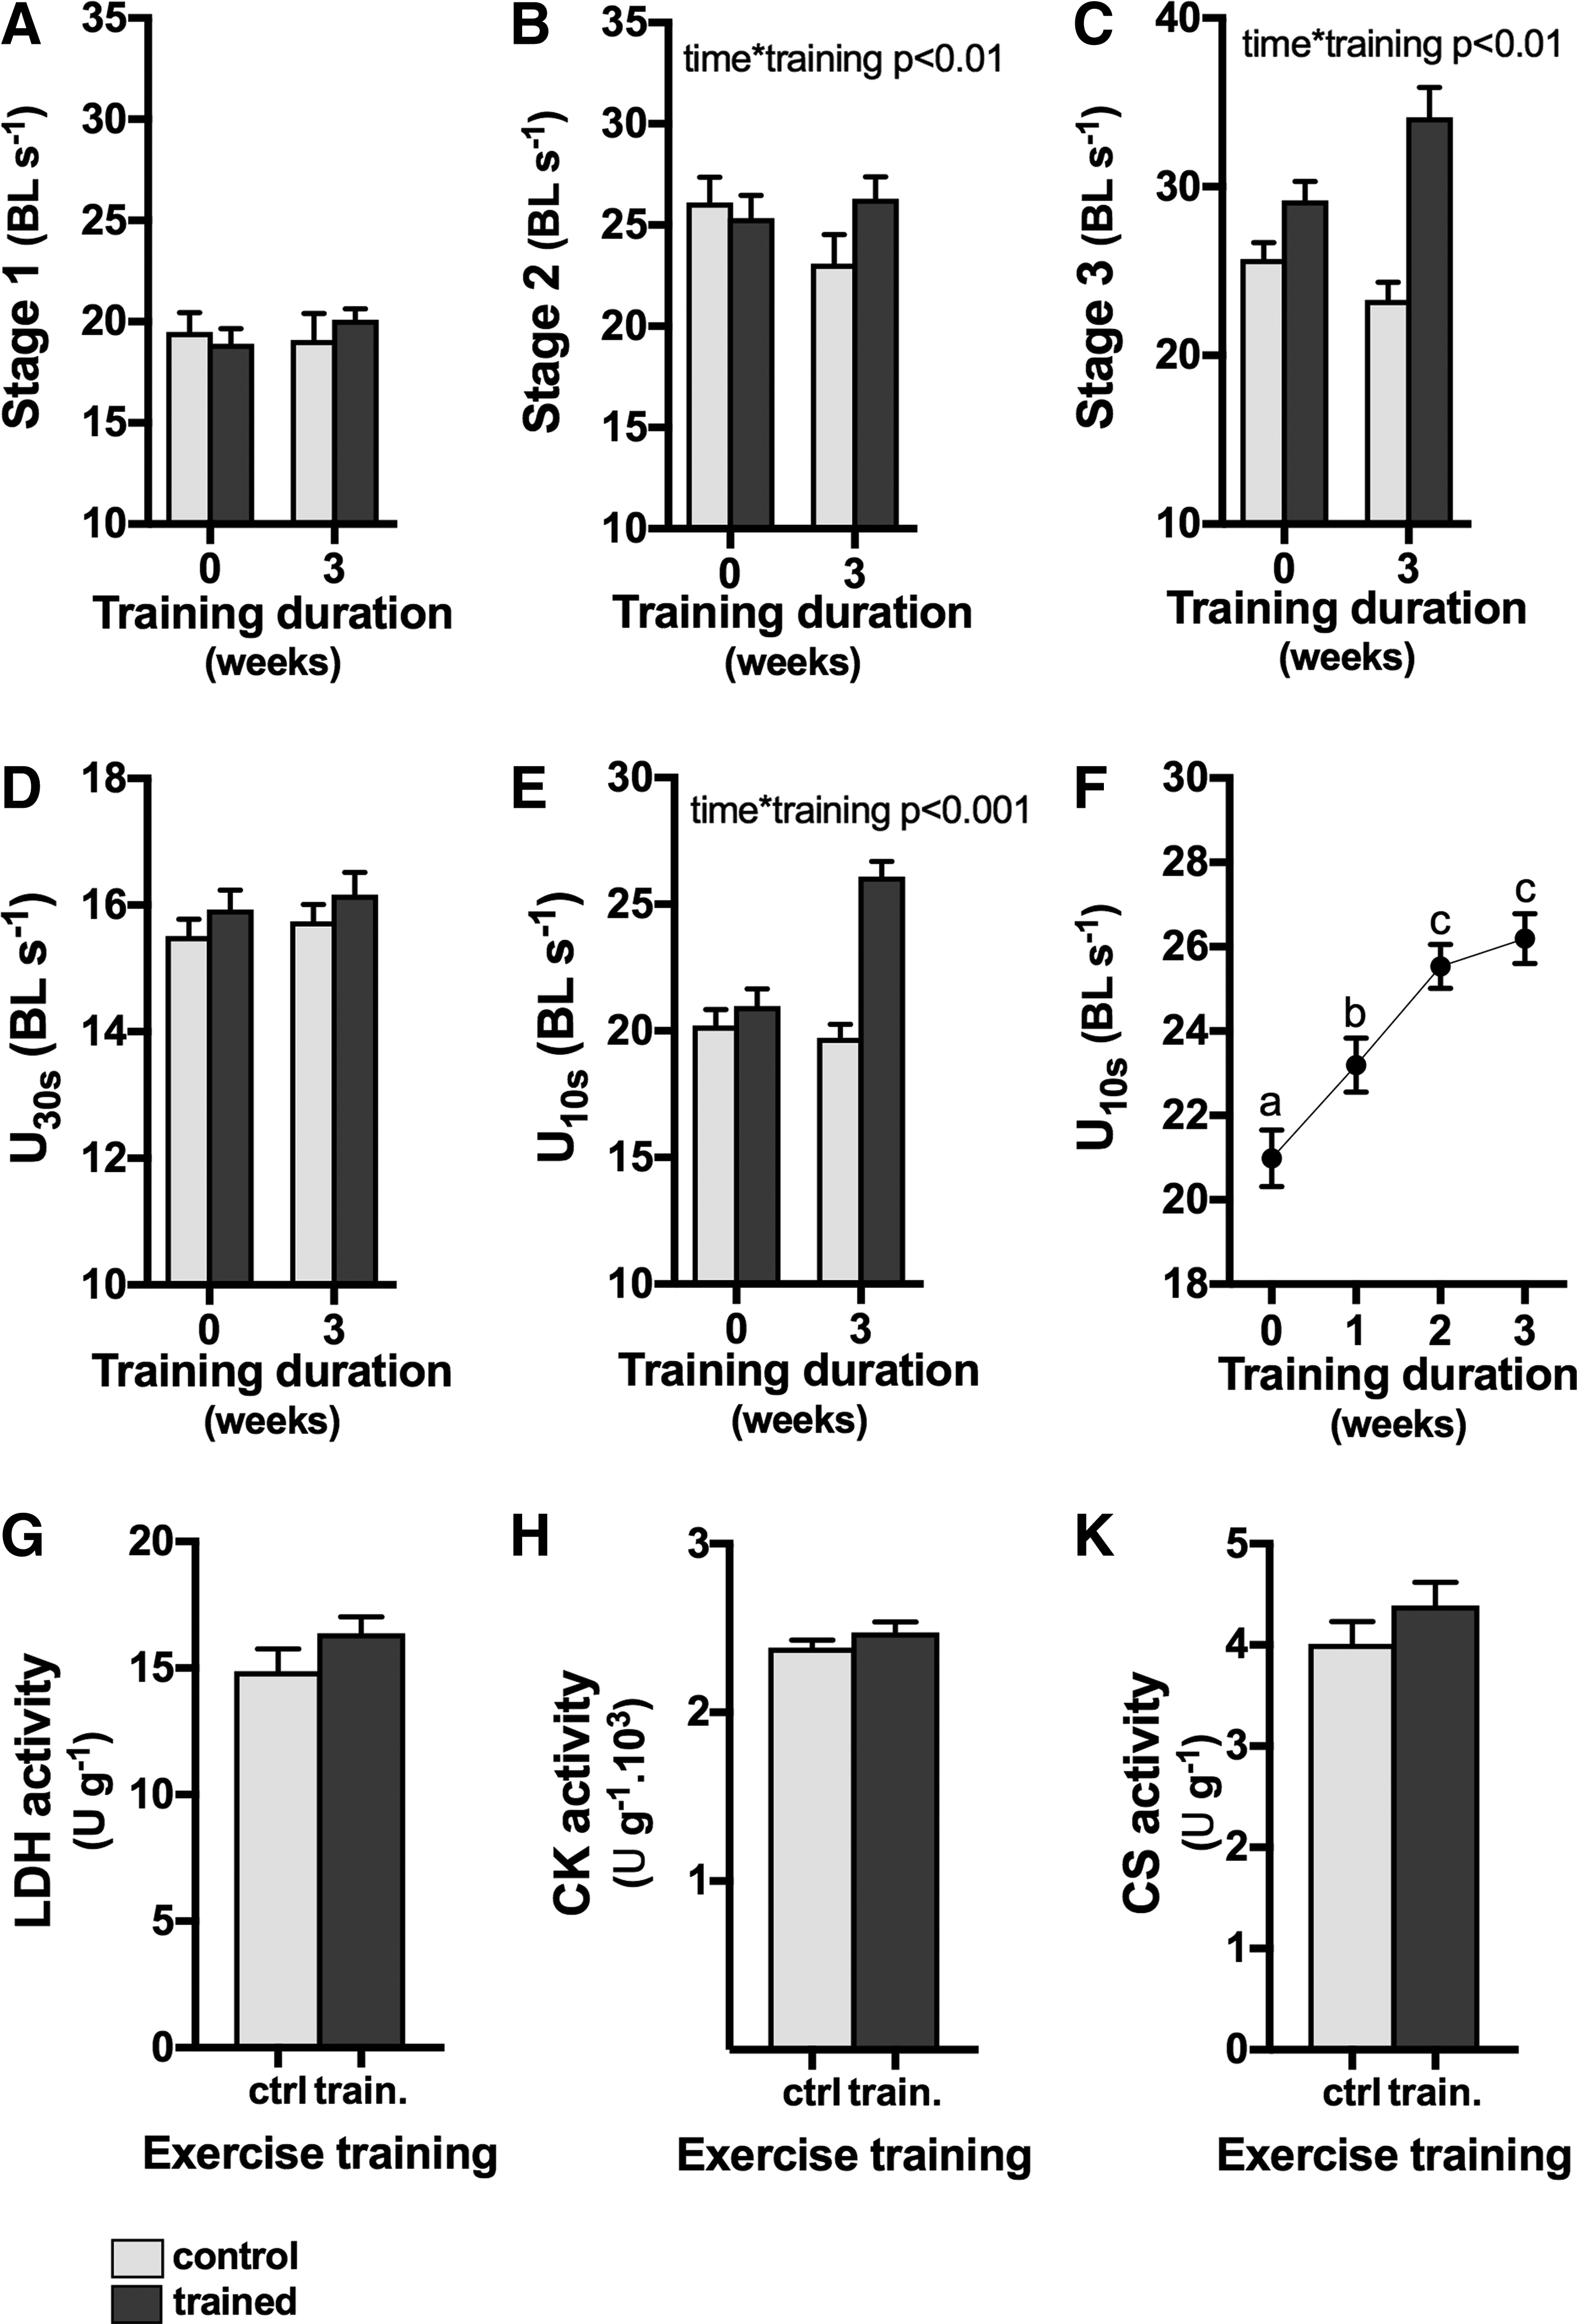
Effects of sprint exercise training. Three weeks of sprint exercise training (trained, dark grey bars; nontrained control, light grey bars) increased stage 2 and stage 3 c-start
Exercise training had no effect on U30s performance (all main effects and interaction p > 0.12; Fig. 3D), but U10s performance increased significantly after exercise training (time × training interaction: p < 0.0001; Fig. 3E). U10s increased significantly over the first 2 weeks of exercise training (p < 0.0001; Fig. 3F), but there were no further significant increases in U10s between weeks 2 and 3 of exercise training (p = 0.27; Fig. 3F).
Three weeks of the sprint exercise protocol had no significant effect on activities of LDH (Fig. 3E, p = 0.112), CK (Fig. 3F, p = 0.152), and CS (Fig. 3G, p = 0.136).
Discussion
We compared sprint performance measures of different durations to determine their suitability to measure responses to sprint exercise training protocols. We found that very short (<1 s) c-starts and 10 s sprints (U10s) were both repeatable and responded positively to exercise training. These measures are therefore suitable to assess the efficacy of sprint exercise protocols. Our sprint exercise protocol was based on the human exercise literature, and together our results indicate that zebrafish are a good model to assess the physiological and behavioral consequences of sprint exercise training.
Repeatability reflects consistent phenotypic variation among individuals within populations, 29 which is essential to assess environmental effects on sprint performance, for example. Among c-start measures, our data indicate that stage 3 is more suitable than stages 1 and 2. The inconsistency of repeatability among the different stages of fast starts may be owing to differences between individuals in the perception of a threat and hence motivation to escape. Escape speed was repeatable in stickleback 30 and at least under some circumstances in guppies, 21 but neither of these studies analyzed the different stages of c-starts explicitly, but approximated different stages by time estimates. Stages 1 and 2 were repeatable in damselfish 31 only when measured 15-min apart, which is likely to be too short to reflect consistent phenotypic traits within individuals. In European sea bass, the speed during the first 58 ms during an escape response was repeatable over 30 days. 32 Sprint speed was repeatable when measured in a “drag-strip” set-up, 10 but the resolution of the measurement of speed is relatively low in this set-up and may not capture the maximal speed achieved. Both U30s and U10s were repeatable in the short and long term, and are therefore suitable measures to capture differences in sprint performance between individuals. Stage 3 c-starts were not correlated with either U30s or U10s, indicating that c-starts reflect different physiological components of sprint performance than U10s and U30s, and that the measures are not interchangeable. Their much shorter duration may mean that c-starts are constrained by different mechanisms such as ryanodine receptor activity or different motor unit recruitment,12,18 and reflect different metabolic demands and supply. 33
Our sprint exercise training protocol was based on human exercise trials where it elicited increases in sprint performance,23,25 and our results indicate that sprint performance in zebrafish responds similarly to sprint training as humans do. In contrast, c-starts of rainbow trout did not respond to sprint training. 34 Our data add to the growing consensus in the literature that zebrafish are a good physiological model for mammals such as humans.4,6 Interestingly, c-starts and U10s responded to exercise training, indicating that there is a common mechanistic basis such as a shift toward fast myosin heavy chains and increased calcium cycling capacity to promote force production. 26 The lack of response of U30s to sprint exercise training indicates that the training regime did not stimulate the underlying mechanisms sufficiently to increase performance. The length (∼30 s) of U30s is similar to a Wingate test, 35 and it is possible that in zebrafish at this duration of exercise there is already a substantial contribution from slow muscle fibers that did not respond to the sprint training. The correlation between U10s and U30s, however, indicates that the two measures of performance share some common underlying mechanisms.
Three weeks of the sprint exercise protocol had no significant effect on activities of metabolic enzymes, indicating that the exercise regime did not perturb metabolism sufficiently to elicit compensatory responses. In contrast, 3 weeks of endurance training increased the activity of citrate synthase. 36 These results are not entirely surprising because metabolic responses to sprint training are inconsistent between individuals, and vary with sprint training protocol and recovery periods. 25 It is likely that changes in myosin heavy chain composition and calcium cycling promoted the positive training effect over the first 2 weeks of sprint exercise training, 26 and that the capacity for ATP supply is less of a constraint and possibly slower to change in response to exercise training. 25 However, CK activity was higher in nontrained zebrafish with high sprint capacity compared with individuals with low sprint capacity, 26 indicating that there may be a genetic component to the phenotype that does not respond to training.
In summary, zebrafish responded positively to sprint exercise training and are therefore a promising model for ecological and physiological studies. C-starts are an important response in predator–prey interactions. 16 However, escapes and chases often last much longer than a c-start,1,17 which makes our U10s protocol an ecologically important measure. The duration of U10s also reflects human sporting events and training programs (e.g., 80–100 m sprints). The sustained exercise response of zebrafish is very similar to that of mammals. 6 In the light of our data, the next step now would be to test whether the underlying mechanisms mediating responses to sprint training are similar among vertebrates.
Footnotes
Acknowledgment
This research was supported by Australian Research Council Discovery Grant DP160102260 to F.S.
Disclosure Statement
No competing financial interests exist.