
Abstract
Abstract
Diet modulates the gut microbiota and is one of the main factors promoting obesity and overweight. In the present study, we investigated the effect of a high-fat diet (HFD) on the gut microbiota of the zebrafish (Danio rerio). Fish were separated into three groups and fed in different regimes: low fat, high fat, and high fat overfed; the experiments were performed on males and females separately. We analyzed more than 2.6 million sequences of variable region V3 of the 16S rRNA gene generated by the Illumina Miniseq platform, clustered to 97% similarity with vsearch and classified with the EzBioCloud database. The weight gain, condition factor (K), and body mass index were calculated as indicators of obesity. Multivariate analysis (PERMANOVA and ANOSIM) and diversity indices (Shannon and Dominance) revealed that overfeeding a HFD disturbs the gut microbiota differently in males and females suggesting that sex is a significant factor (p < 0.05) for the composition of the gut microbiota of zebrafish. The results also indicate that a HFD provided in a basal caloric regime does not promote obesity or alterations in the gut microbiota.
Introduction
The intestinal microbiota is now considered another component of the body, which has a diversity of genes at least 100 times greater than the rest of the body 1 due to the fact that it is composed of trillions of microorganisms. 2 In recent years, several studies have found that these microorganisms play an important role in the health of the host. 3 Diseases related to the immune system, such as autoimmune diabetes (type 1), 4 some types of cancer, 5 kidney disease, 6 liver disease, 7 gastrointestinal disorder, 2 and obesity 8 have been related to the intestinal microbiota. It is well known that the relationship between the immune system and the host is bilateral and this relationship allows alterations in the intestinal microbiota to be associated with the pathogenesis that compromises health. 9
There are different factors that can cause alterations in the gut microbiota, as the environment of the host, 10 the lifestyle, 11 and the use of antibiotics 12 ; however, the diet is the most important modulating factor due to the ability of the microbiota to adapt to the eating habits. 13 Even in organisms of the same species, environment, diet, and health are the main factors involved in the composition of the gut microbiota, however, other factors, such as sex, 14 should also be considered. Even if sex per se is not the main variation factor of the intestinal microbiota, it must be studied due to the effect generated by the interaction with the other factors. 15
Microorganisms can influence the energy balance of the host; it has been shown that certain groups of bacteria induce the deposition and adsorption of fatty acids in the intestinal epithelium. 16 In some cases, bacterial species added to the diet as a probiotic have shown a beneficial effect in regulating the expression of genes related to the glucose and lipid metabolism to attenuate obesity.17,18 The consumption of high-fat diet (HFD) is considered one of the main factors that contribute to the development of obesity 19 and changes in the composition of the gut microbiota, 20 such as the reduction of abundance and diversity. 21 The zebrafish (Danio rerio) is considered a good model organism for the study of metabolic diseases, 22 and because it shares obesity-related pathophysiological gene pathways with mammals, it is very useful for the analysis of the relationship between diet, obesity, and intestinal microbiota.23,24 In zebrafish, a relationship between fat levels in the diet and the composition of the intestinal microbiota in different stages of development has been demonstrated23,25 and a recent study has reported that a HFD has an impact on metabolic and immunological functions. 26 Overfeeding has become a problem because it promotes weight gain 27 and is one of the main causes of obesity. 28 It has been reported in different species of vertebrates that in overfed organisms the intestinal bacterial composition is affected and the bacterial diversity is reduced. 29 Moreover, individuals with a low bacterial richness, gain weight more quickly over time, 30 demonstrating that a bilateral relationship exists between diet and the gut microbiota. Thus, the purpose of this study was to determine sex-specific alterations of the intestinal microbiota of the zebrafish induced by overfeeding of a HFD.
Materials and Methods
Animals, experimental design, and diets
Fully grown mature male and female adults (3.5 mpf) of wild-type zebrafish were obtained from a local pet store and maintained as previously described. 31 Fish were acclimatized to laboratory conditions (27.5°C ± 1°C under 12-h light/12-h dark period) during 2 weeks and fed with a commercial diet (Tetramin® Tropical Flakes) consisting of 46% crude protein, 11% crude fat, 3% crude fiber, and 6% moisture. The experimental diets were formulated to be isoproteic 32 and to contain two fat levels, 8% and 24% (Table 1). Diet formulation was performed according to Hernández et al. 33 Briefly, all the dry ingredients of the experimental diets were weighed, combined, and thoroughly mixed to homogeneity in a Hobart-type mixer. Oil was then added and thoroughly mixed for 5 min. The feed was manufactured by extrusion processing using a double screw (Brabender TSI 20/40). The pellets were reduced to a size of ∼125–250 μm using sieves to remove fine particles. The pellets were stored at 4°C in labeled, sealed containers.
Ingredient and Proximate Composition of the Experimental Diets for the Zebrafish (Danio rerio)
Premium-grade fish meal was obtained from Selecta de Guaymas, S.A. de C.V. Guaymas, Sonora, Mexico.
Droguería Cosmopolita, S.A. de C.V. México, D.F., Mexico.
Supplied by BASF Mexicana S.A. de C.V.
DSM Nutritional Products Mexico S.A. de C.V., El Salto, Jalisco, Mexico.
Sigma-Aldrich Chemical, S.A. de C.V. Toluca, Mexico State, Mexico.
Mean ± SD, number of determinations = 3.
Nitrogen-free extract (including fiber) = 100−(% protein+% lipid+% ash).
Gross energy (kJ g−1) was calculated according to the physiological fuel values of protein, 20.93 kJ g−1; lipids, 37.68 kJ g−1; and nitrogen-free extract, 16.75 kJ g−1.
The fish were randomly distributed in three treatments and fed with two different diets, low-fat (LF) and high-fat (HF), and another group was overfed (HFO) with the HFD. Males and females were kept in separate tanks and homogeneous groups were created according to fish weight. Each treatment consisted of four tanks (two tanks per each sex) with 10 fish per tank. The tanks were maintained in a water recirculation system containing a mechanical filter with a cellulose mesh, a chemical filter with activated carbon, and an ultraviolet light sterilizer. Before the experiment, the tanks were cleaned with soap and water, thoroughly rinsed, and dried with a cellulose paper towel. During the experiment, each tank was cleaned with soap and water at least once a week; meanwhile, the fish were carefully transferred to another clean tank. Twenty percent of the total water was exchanged daily with filtered and sterile water. Feces and other debris were removed daily by siphoning. The water temperature was maintained at 27.5°C, salinity = 0.51 g/L ± 0.04, and pH = 7.35 ± 0.18. LF and HF treatments were fed two times per day at a basal regime of 1.7% body weight (BW) (7.5 mg food/fish/day for males and 10 mg food/fish/day for females) without caloric restriction. 24 The HFO group were fed three times per day at an overfeeding regime of 8.5% BW (38.5 and 50 mg food/fish/day for males and females, respectively) to promote diet-induced obesity. 24 This feeding protocol was maintained for 8 weeks. The food intake was estimated by quantifying the food before and after feeding. After feeding, the remaining food was siphoned out, filtered, dried, and weighed.
Sampling and DNA extraction
The condition factor (K) is commonly used to investigate growth patterns, whereas the body mass index (BMI) is mainly used to determine overweight and obesity. Both indices use a relationship between weight and length, and can indirectly and imperfectly determine the body fat and health.34,35 After the feeding protocol, the weight and length of each fish were registered. Weight gain, condition factor (K), and BMI were calculated according to the following formulas:
Fish were aseptically dissected and the whole intestine, including its content, were collected in individual tubes with ethanol 96% and preserved at −40°C. DNA was isolated using a modified CTAB method, 36 and DNA quality and concentration were measured in a DeNovix® DS-11 spectrophotometer.
DNA sequencing
Preparation of libraries for sequencing was done following the Illumina 16S Metagenomic Sequencing Library Preparation protocol (part # 15044223 Rev. B); briefly, PCR amplification of the V3 variable region of the 16S rRNA gene was amplified with universal primers 37 (lowercase) with Illumina adapters (uppercase): 16S-V3_338f (TCG TCG GCA GCG TCA GAT GTG TAT AAG AGA CAG acy cct acg ggr ggc agc ag) and 16S-V3_533r (GTC TCG TGG GCT CGG AGA TGT GTA TAA GAG ACA G tta ccg cgg ctg ctg gca c). The amplification protocol was one cycle at 95°C/3 min, followed by 30 cycles of 95°C/30 s, 60°C/30 s, and 72°C/30 s, and a final cycle of 72°C/5 min. PCR amplicons were purified with AMPure XP magnetic beads and then Illumina indices were added for each sample in a second PCR at 95°C/3 min, followed by eight cycles of 95°C/30 s, 55°C/30 s, and 72°C/30 s, and a final cycle of 72°C/5 min, followed by a second cleanup with beads.
Final PCR amplicons were quantified with the Broad-Range dDNA Quantification Assay Kit (Thermo Scientific) for the Qubit fluorometer, and an equimolar pool was prepared. This pool was quantified with the HS assay for the Qubit, and adjusted to 4 nM for further denaturalization, dilution to 2 pM, and sequencing in a Mid-output flow cell (300 cycles, 2 × 150 pair-end library) in an Illumina MiniSeq.
Bioinformatic analysis
FASTQ sequences were processed with our metagenomic pipeline (https://github.com/GenomicaMicrob/metagenomic_pipeline); first, files were processed with the pair-end_cleaner v.0.9.9 pipeline (https://github.com/GenomicaMicrob/pair-end_cleaner): bases with a Phred quality lower than Q20 and ambiguous bases (n's) were deleted, short reads were removed (<140 bases), and they were also trimmed to no more than 150 bases with CUTADAPT. 38 Remaining pair-end sequences were assembled with PEAR (https://sco.h-its.org/exelixis/web/software/pear/doc.html) for a minimum assembly length of 170 bases, a maximum of 250 bases, and a minimum overlap of 10 bases. Resulting sequences were converted to FASTA format. Chimera sequences were removed with the chimera_detector v.0.1.1 pipeline (https://github.com/GenomicaMicrob/chimera_detector); clean sequences were compared with the SILVA 39 v.1.28 database with vsearch 40 v.2.7.1 (—uchime_ref), those sequences that had a match (by 97% similarity) in the database, were not considered a chimera. Clean and chimera-free sequences were classified with the mg_classifier v.1.7.0 pipeline (https://github.com/GenomicaMicrob/mg_classifier); sequences were clustered to 97% similarity with vsearch v.2.7.1 (—cluster_fast), centroid sequences of each cluster were classified also with vsearch v.2.7.1 (—usearch_global) by matching to the EzBioCloud 41 database v.1.5 based on the prokaryotic taxonomic level thresholds proposed by Yarza. 42
Statistical analyses
Results were expressed as the mean ± standard deviation (SD). Differences between the food intake, condition factor K, and BMI were determined by one-way ANOVA followed by the Tukey's test. Weight analysis was calculated separated for males and females due to differences in mean weight between sexes. Differences were considered significant when p < 0.05. Statistical analysis and graph construction was performed using GraphPad Prism 7 (GraphPad Software). Univariate statistical analysis of bacterial community was performed using STAMP.
43
Diversity index and multivariate statistics were calculated using PAST3.
44
The Shannon index was calculated according to the following formula:
Where:
H = Shannon diversity index; pi = proportion of the population made up of species i; s = number of species in a sample.
Results
Survival, food intake, and growth performance
Fish survival was 100% in all tanks except for one tank of the HFO treatment (male), where survival rate was 80%, even so, no significant differences were found. Food intake rate in basal regime (LF and HF) groups was 100% during the 8 weeks of the experiment. Overfed groups consumed 79%–82% (male) and 80%–5% (female) of the added food steadily during the first 6 weeks, but during the final 2 weeks the food intake rate decreased significantly (p < 0.05) in both males and females to 48% and 64%, respectively (Fig. 1A). The absolute values of consumption are shown in the Supplementary Table S1.
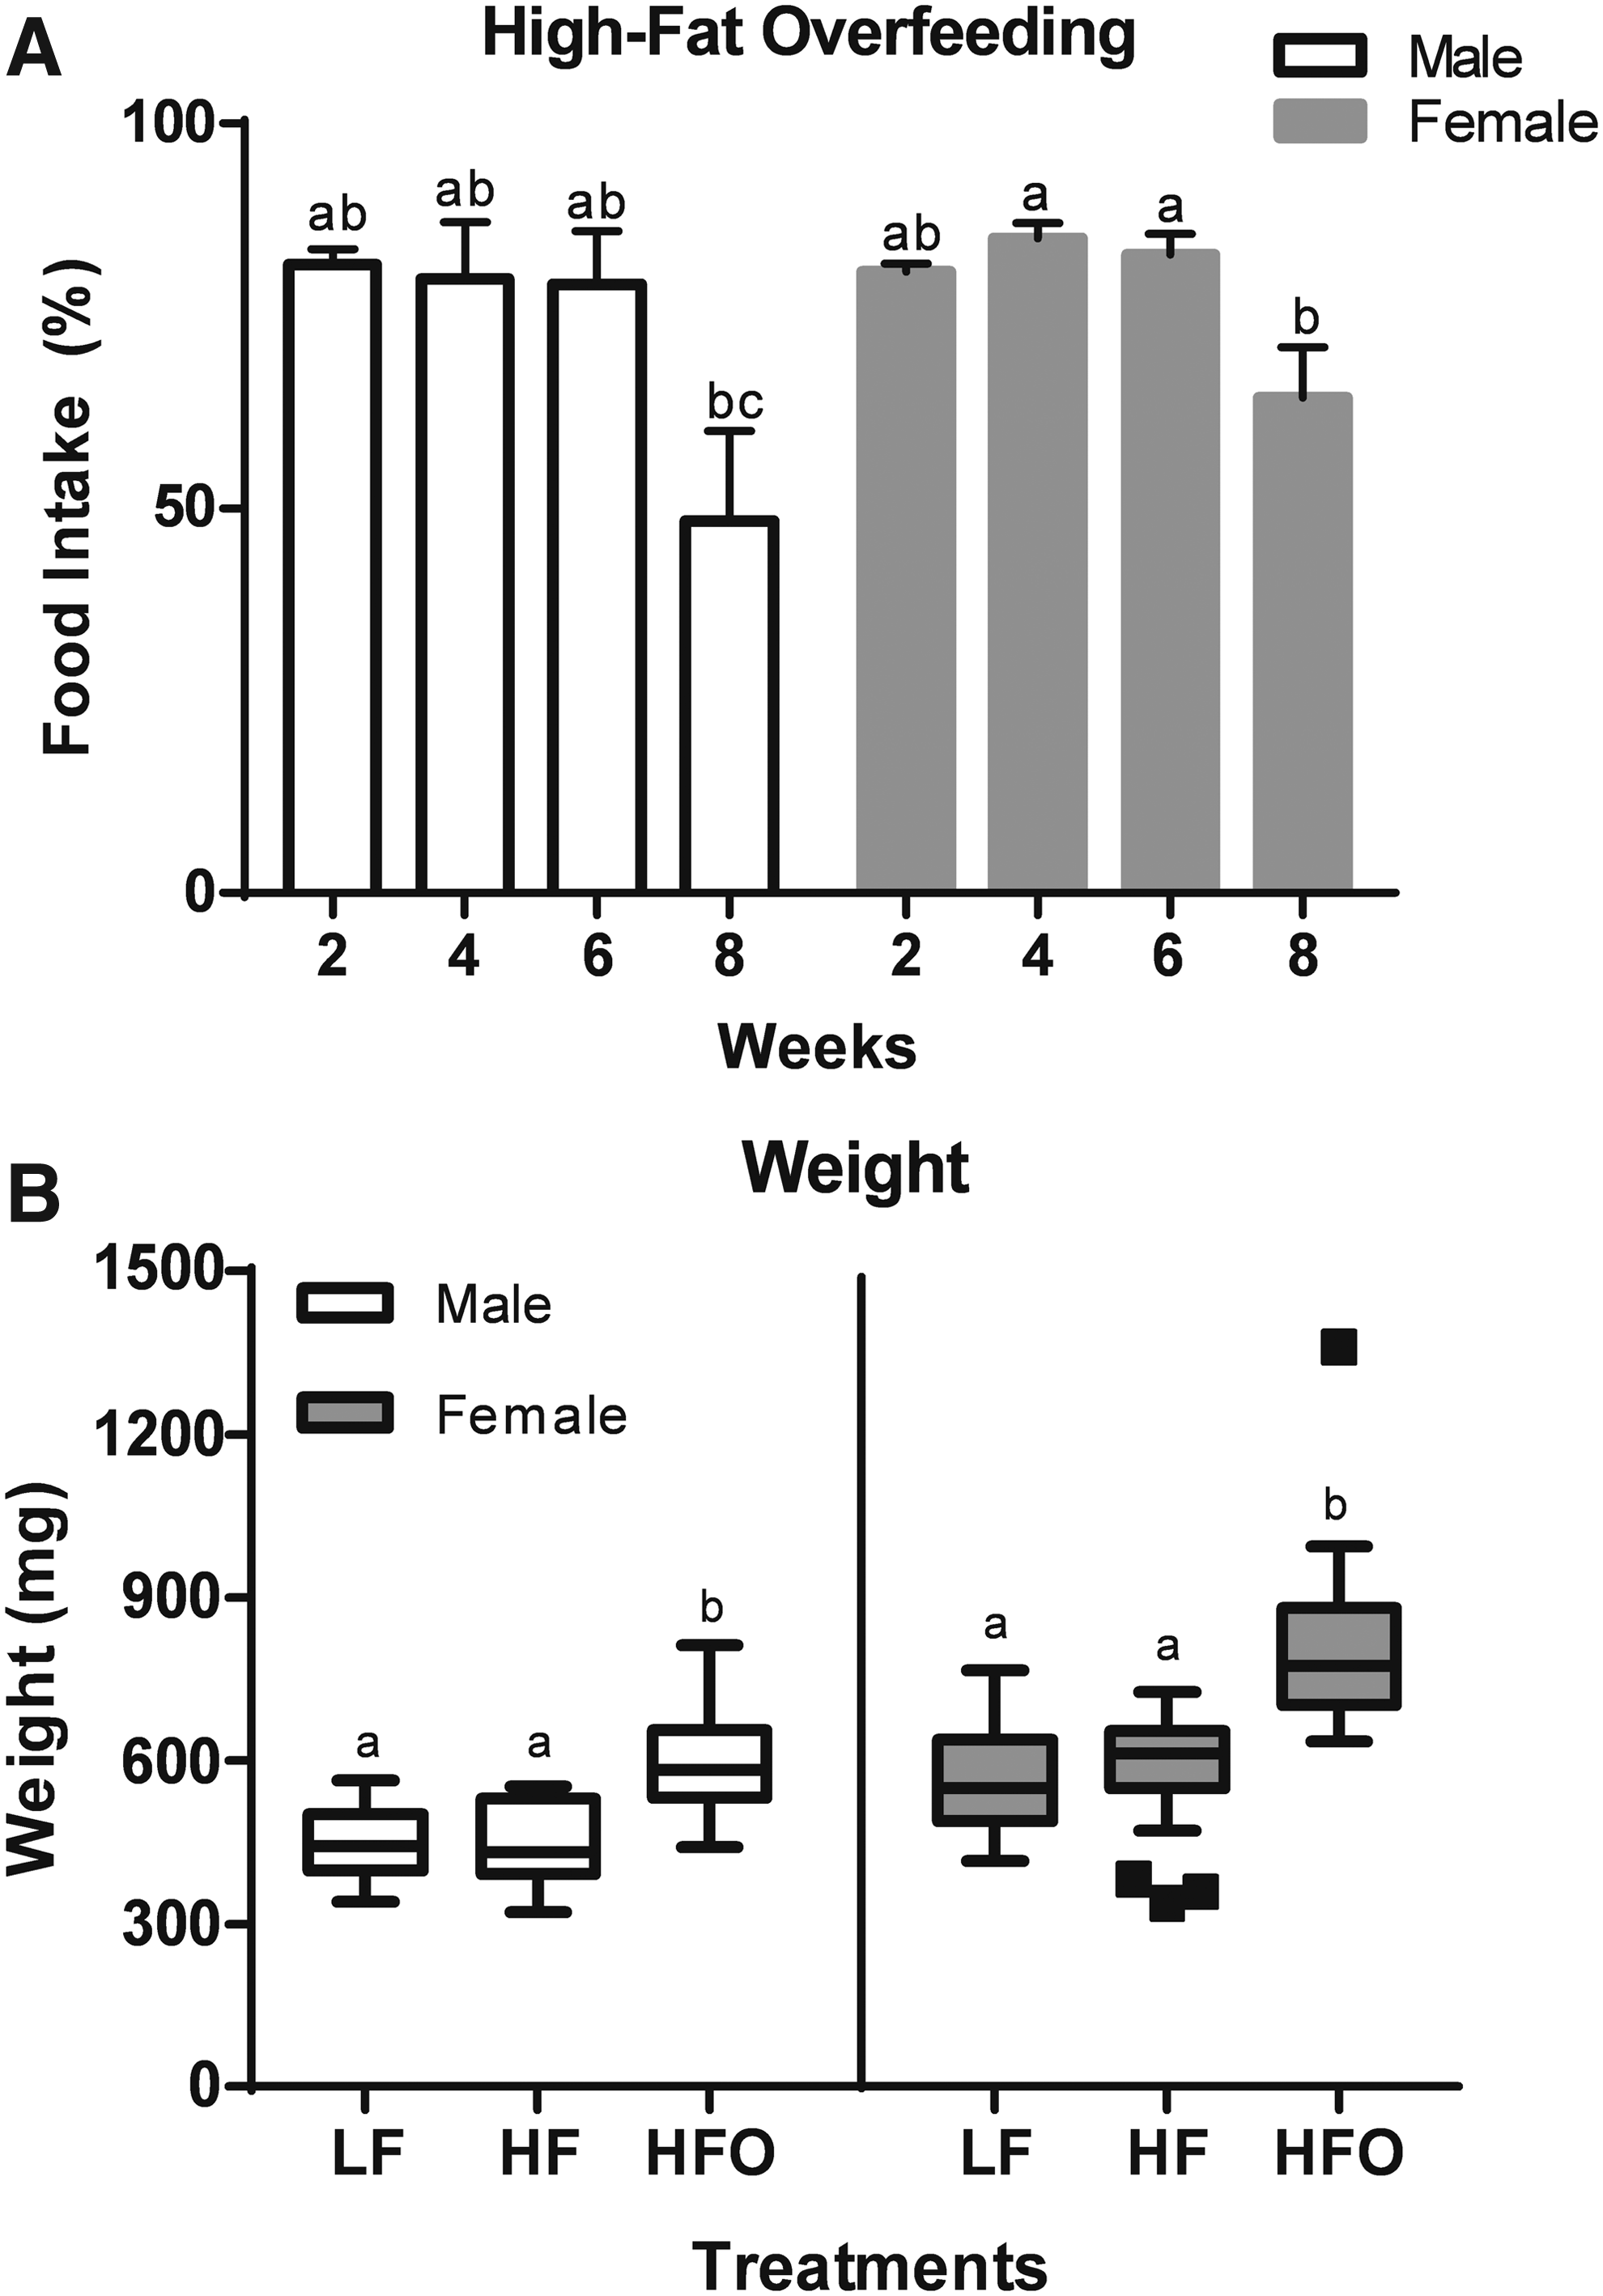
Food intake evolution of overfed fish with a HF diet for 8 weeks in males and females
Zebrafish fed with a basal regime (LF and HF) did not show significant differences in final weight, but those overfed (HFO) showed a significant increase (p < 0.05) in weight regardless of sex. Average weight of males at the basal regime (LF and HF) was 442 and 448 mg, respectively, whereas the HFO group showed a weight of 592 mg; females showed the same growth pattern with 560, 586, and 808 mg, respectively (Fig. 1B).
Only HFO fish showed a significant growth, the weight gain rate was 38.0% and 40.1% for male and female zebrafish, respectively, whereas the groups at a basal regime showed minimal growth (3.0% to 3.5%), even females of the low-fat (LF) treatment presented a negative growth (−1.8%). Similarly, the condition factor (K) and BMI were significantly higher (p < 0.05) in the overfed group (HFO, Fig. 2).
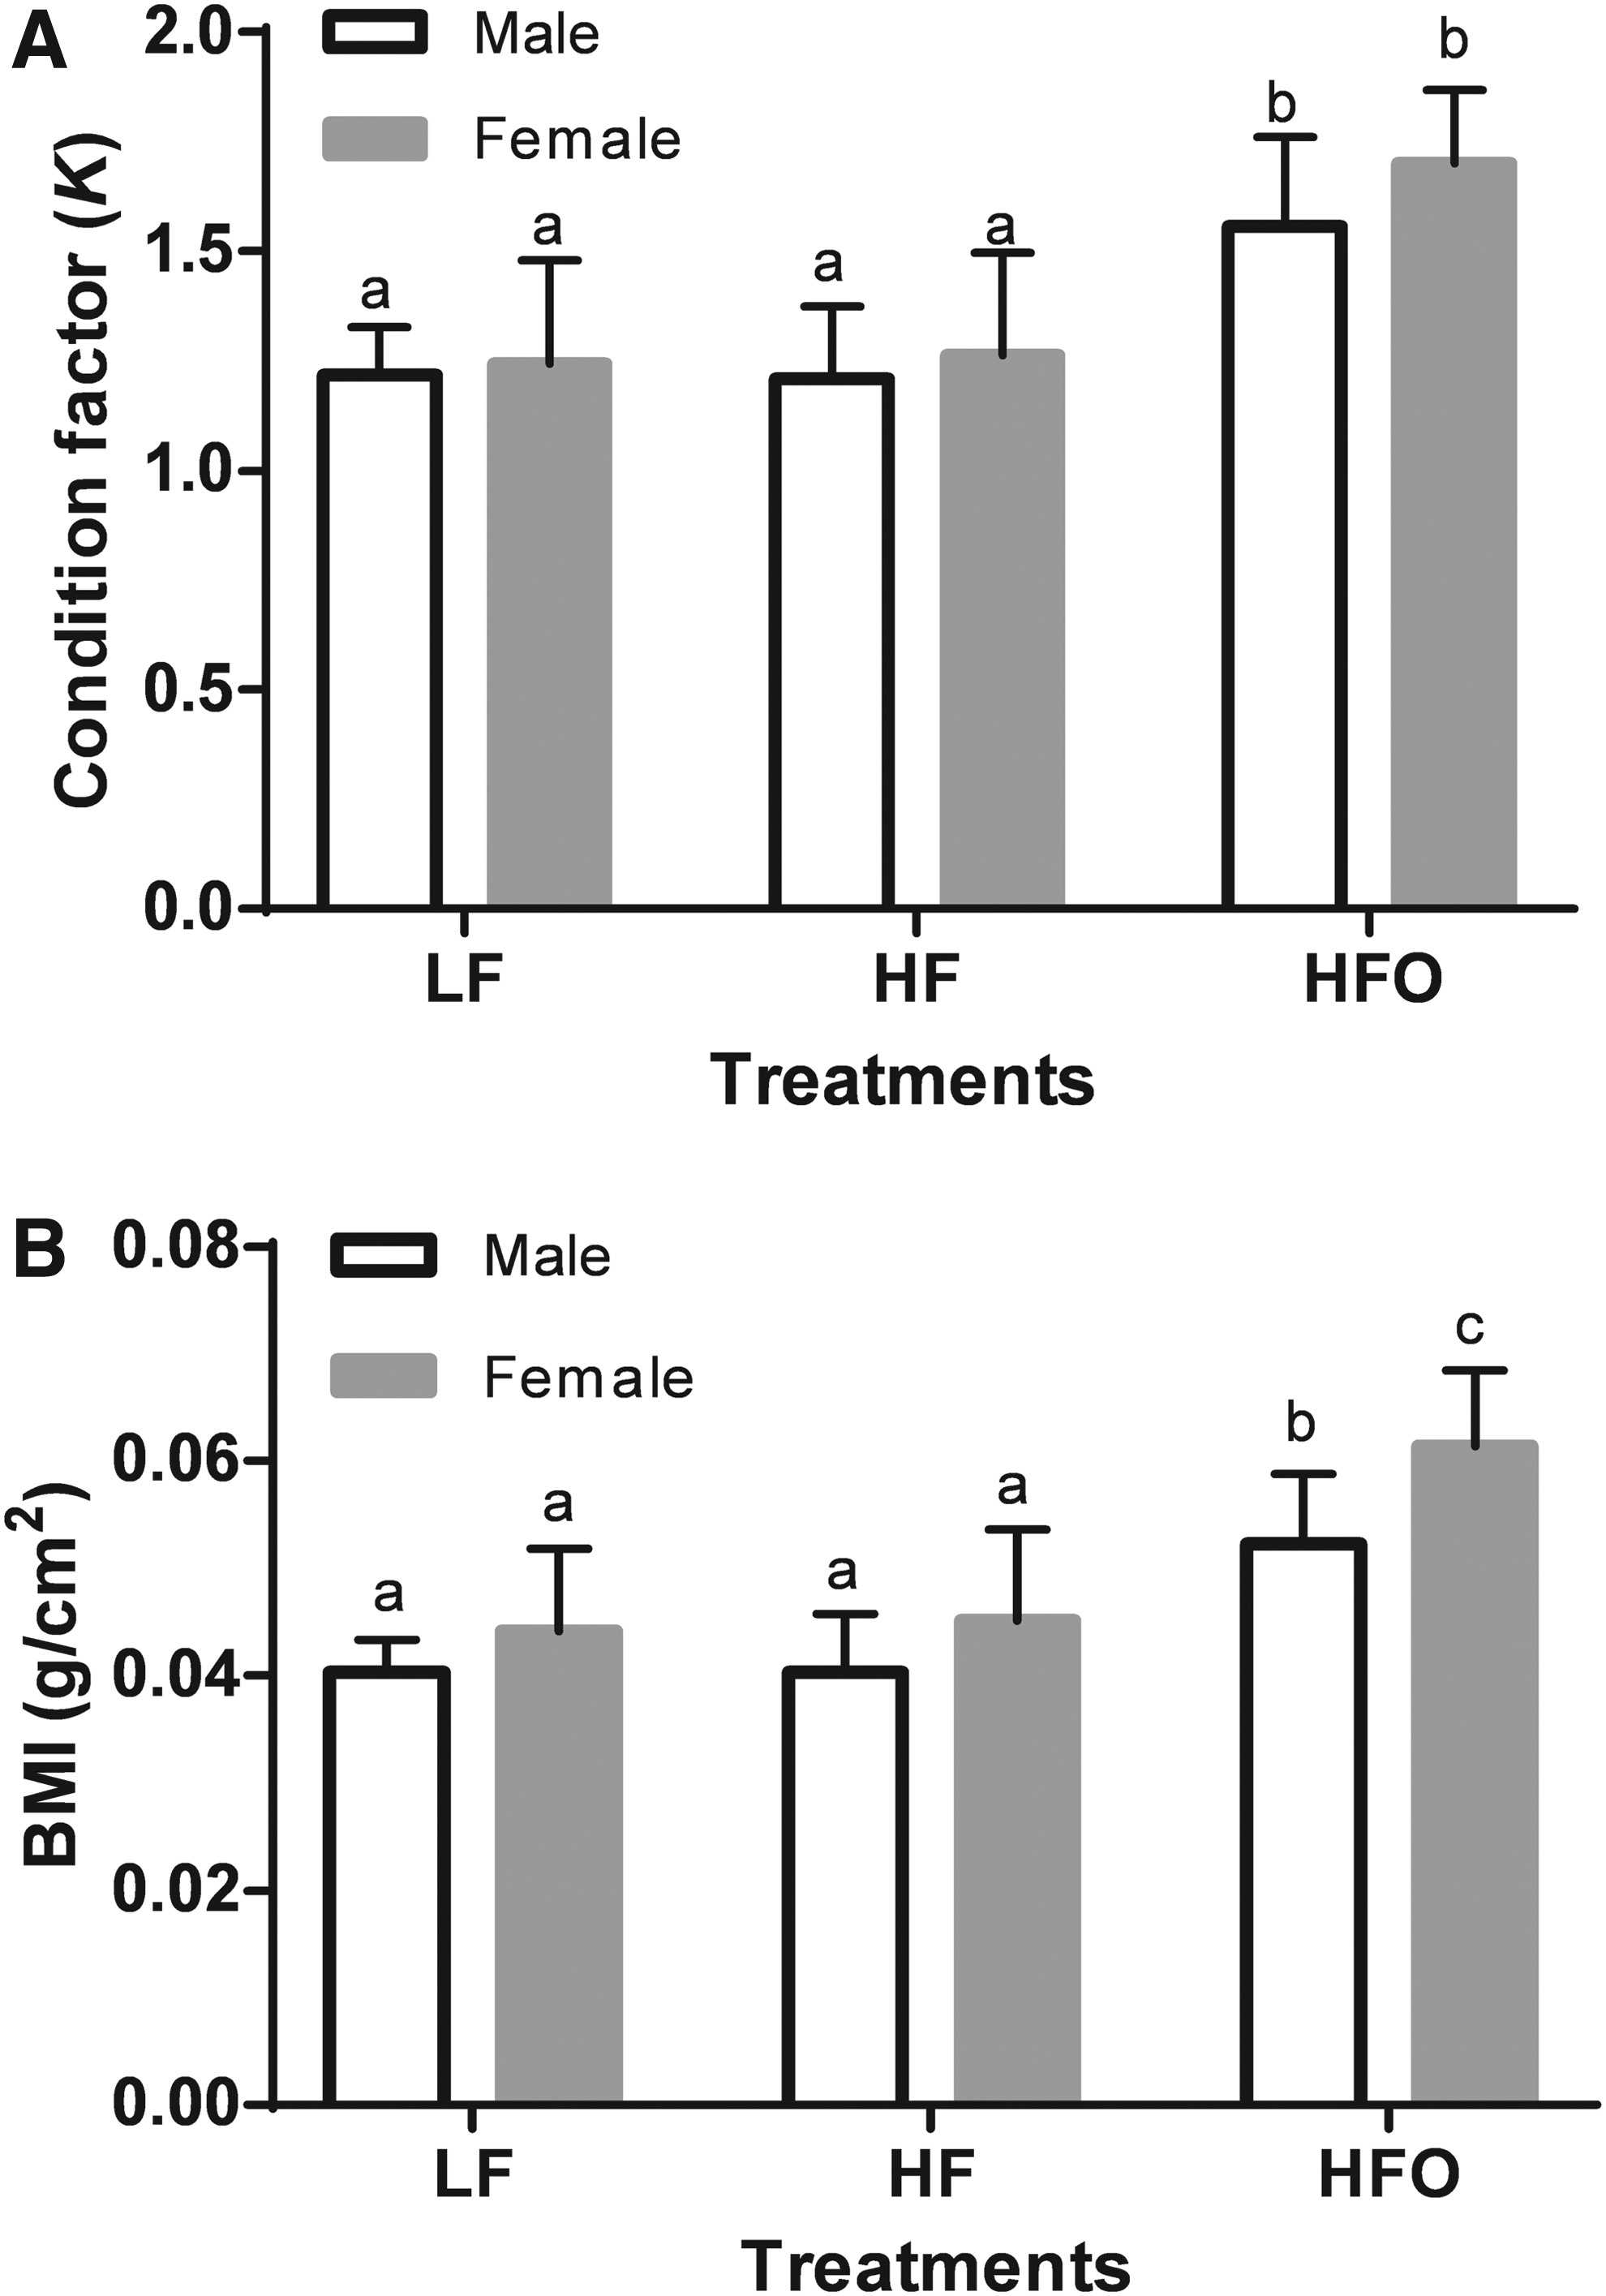
Effect on the condition factor
Sequencing and diversity
All the sequencing libraries (from all 70 samples) generated more than 5 million raw FASTQ sequences, once the Q-score was <20, chimeric and eukaryota sequences were excluded, 2.68 million of clean and high-quality bacterial sequences were classified with the EzBioCloud database. In general, male and female samples obtained the same number of sequences (1.3 million) distributed within treatments. The female groups obtained a high number of assigned operational taxonomic units (OTUs) compared with the male groups, 1242 and 1064, respectively (Table 2).
Summary of Illumina Sequencing Read Analysis: Total Sequences, Observed Species (OTUs), Average Taxa Assigned (Sample), Shannon and Dominance Indices; Values Are Represented in Mean ± SD (n = 2 in Each Group; Only in Female LF and HF Groups n = 11)
OTU, operational taxonomic unit.
Shannon's bacterial diversity index varied between HF and HFO females from 1.83 to 2.20, respectively; contrary to these results, males from the HFO group obtained the lowest value and HF the highest (1.58 and 2.28 for HFO and HF, respectively). Dominance index suggests that a HFD promotes the prevalence of some bacterial groups only in the HFO regime, as shown in the male groups, where LF and HF obtained 0.29 and 0.28, respectively; meanwhile the HFO obtained 0.38. However, this trend was not observed in females where the dominance indices were equivalent (0.34–0.35, Table 2). No significant differences in diversity were detected.
Gut bacterial composition of zebrafish at basal and overfeeding regimes
In general, more than 95% of the sequences were assigned to five bacterial classes, Alphaprotebacteria, Betaproteobacteria, Gammaproteobacteria (phylum Proteobacteria), Clostridia (Firmicutes), and Mollicutes (Tenericutes); these taxa were detected in all treatments. Gammaproteobacteria was the most representative taxon accounting for more than 67% of the total sequences classified; Gammaproteobacteria was the only bacterial class present in every intestinal sample analyzed (Fig. 3).
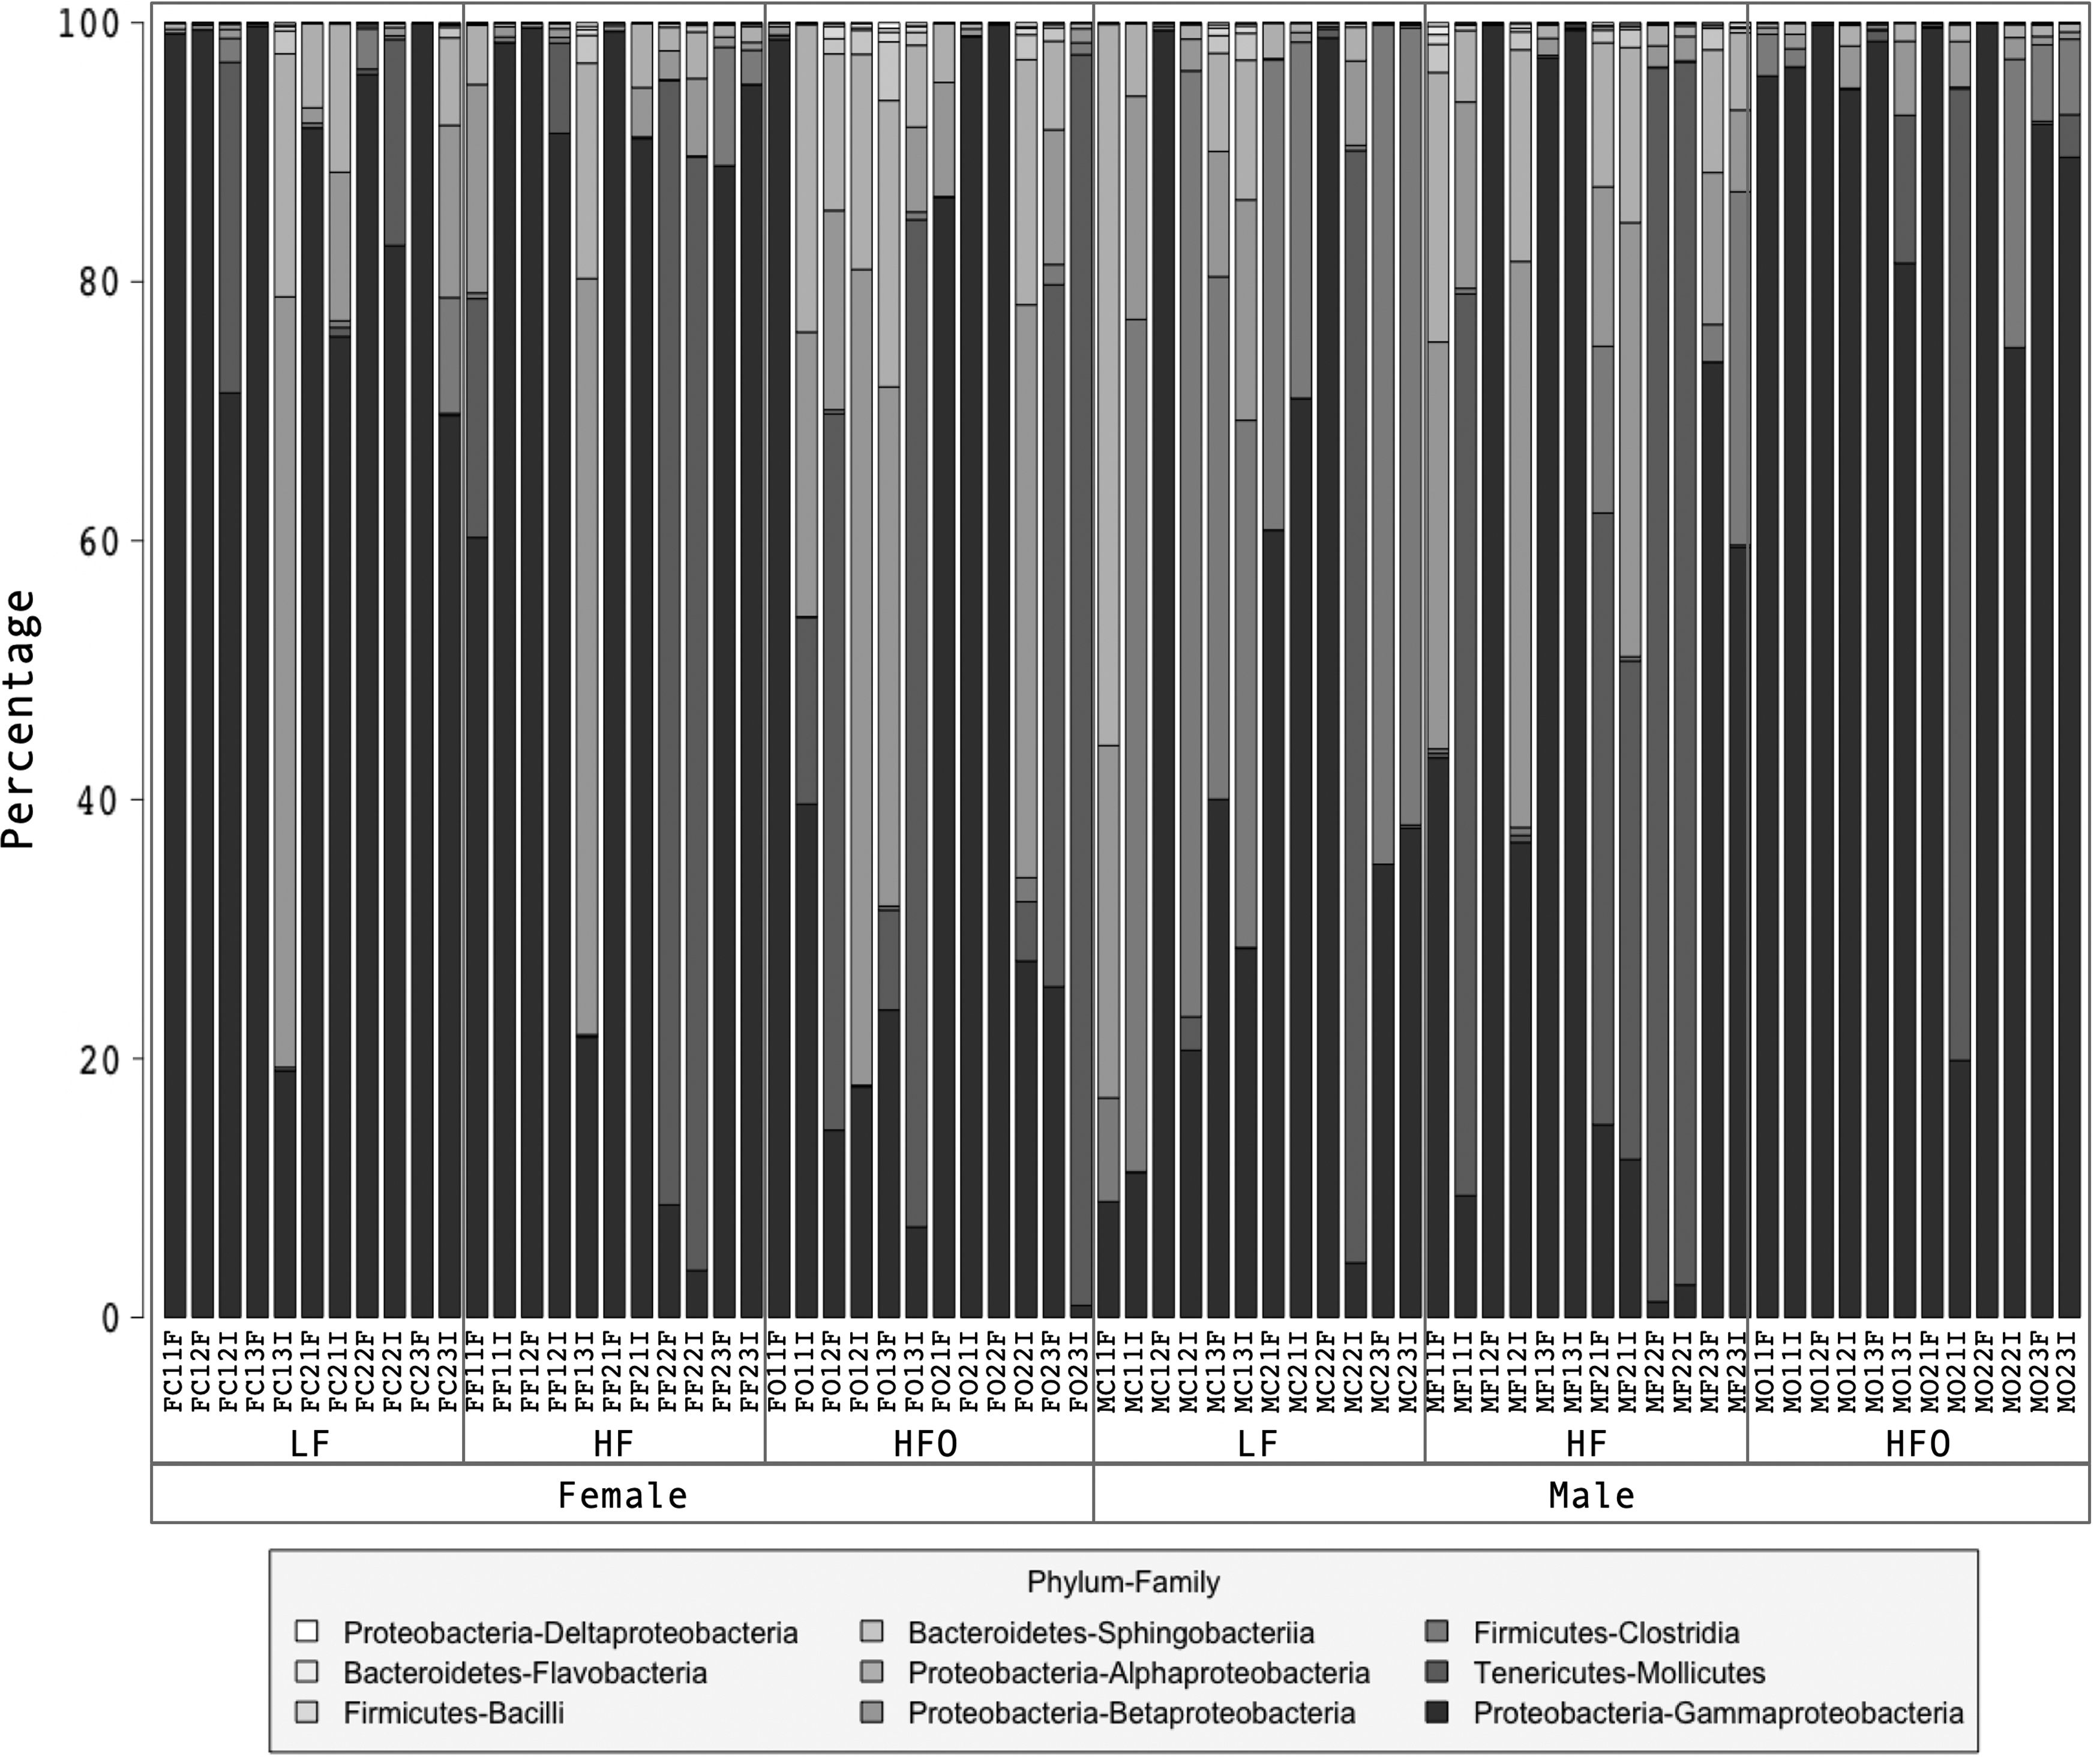
Gut bacterial composition in male and female zebrafish under HFO, LF basal regime, and HF basal regime. The stacked bar chart represents in bacterial phyla and classes.
At the genus level, 802 OTUs were found in all samples, the most representative genera were, in order of decreasing magnitude, Aeromonas, Plesiomonas (both Gammaproteobacteria), Rombutsia (Clostridia), Mycoplasma (Mollicutes), and Paraburkholderia (Betaproteobacteria). These five taxa represented 70% of total sequences (Table 3, Supplementary Fig. S1, Supplementary Table S2). Twenty percent of the total sequences could not be assigned to any known genus. At the family and class taxonomic levels, unclassified sequences were lower, 2.5% and less than 0.001%, respectively.
Top Ten Abundant Genera in Male and Female Zebrafish Under High-Fat Overfeeding, Low-Fat Basal Regime, and High-Fat Basal Regime
Unclassified group was included as a taxon.
In general, a greater number of bacterial genera were detected in the intestines of female zebrafish: 333 for LF, 422 for HF, and 459 for HFO; whereas in males 328, 405, and 272 could be classified, respectively. These values coincide with the diversity indices, and thus, a higher gut bacterial richness in female fish was found. In both males and females, at least 30% of the total genera detected are shared between all groups (30.9% and 33.6%, respectively). Moreover, the most abundant genera (Table 3) were detected in both female and male groups. Unique genera, those detected in only one group, are mainly minority taxa with proportions lower than 0.01% (Fig. 4).
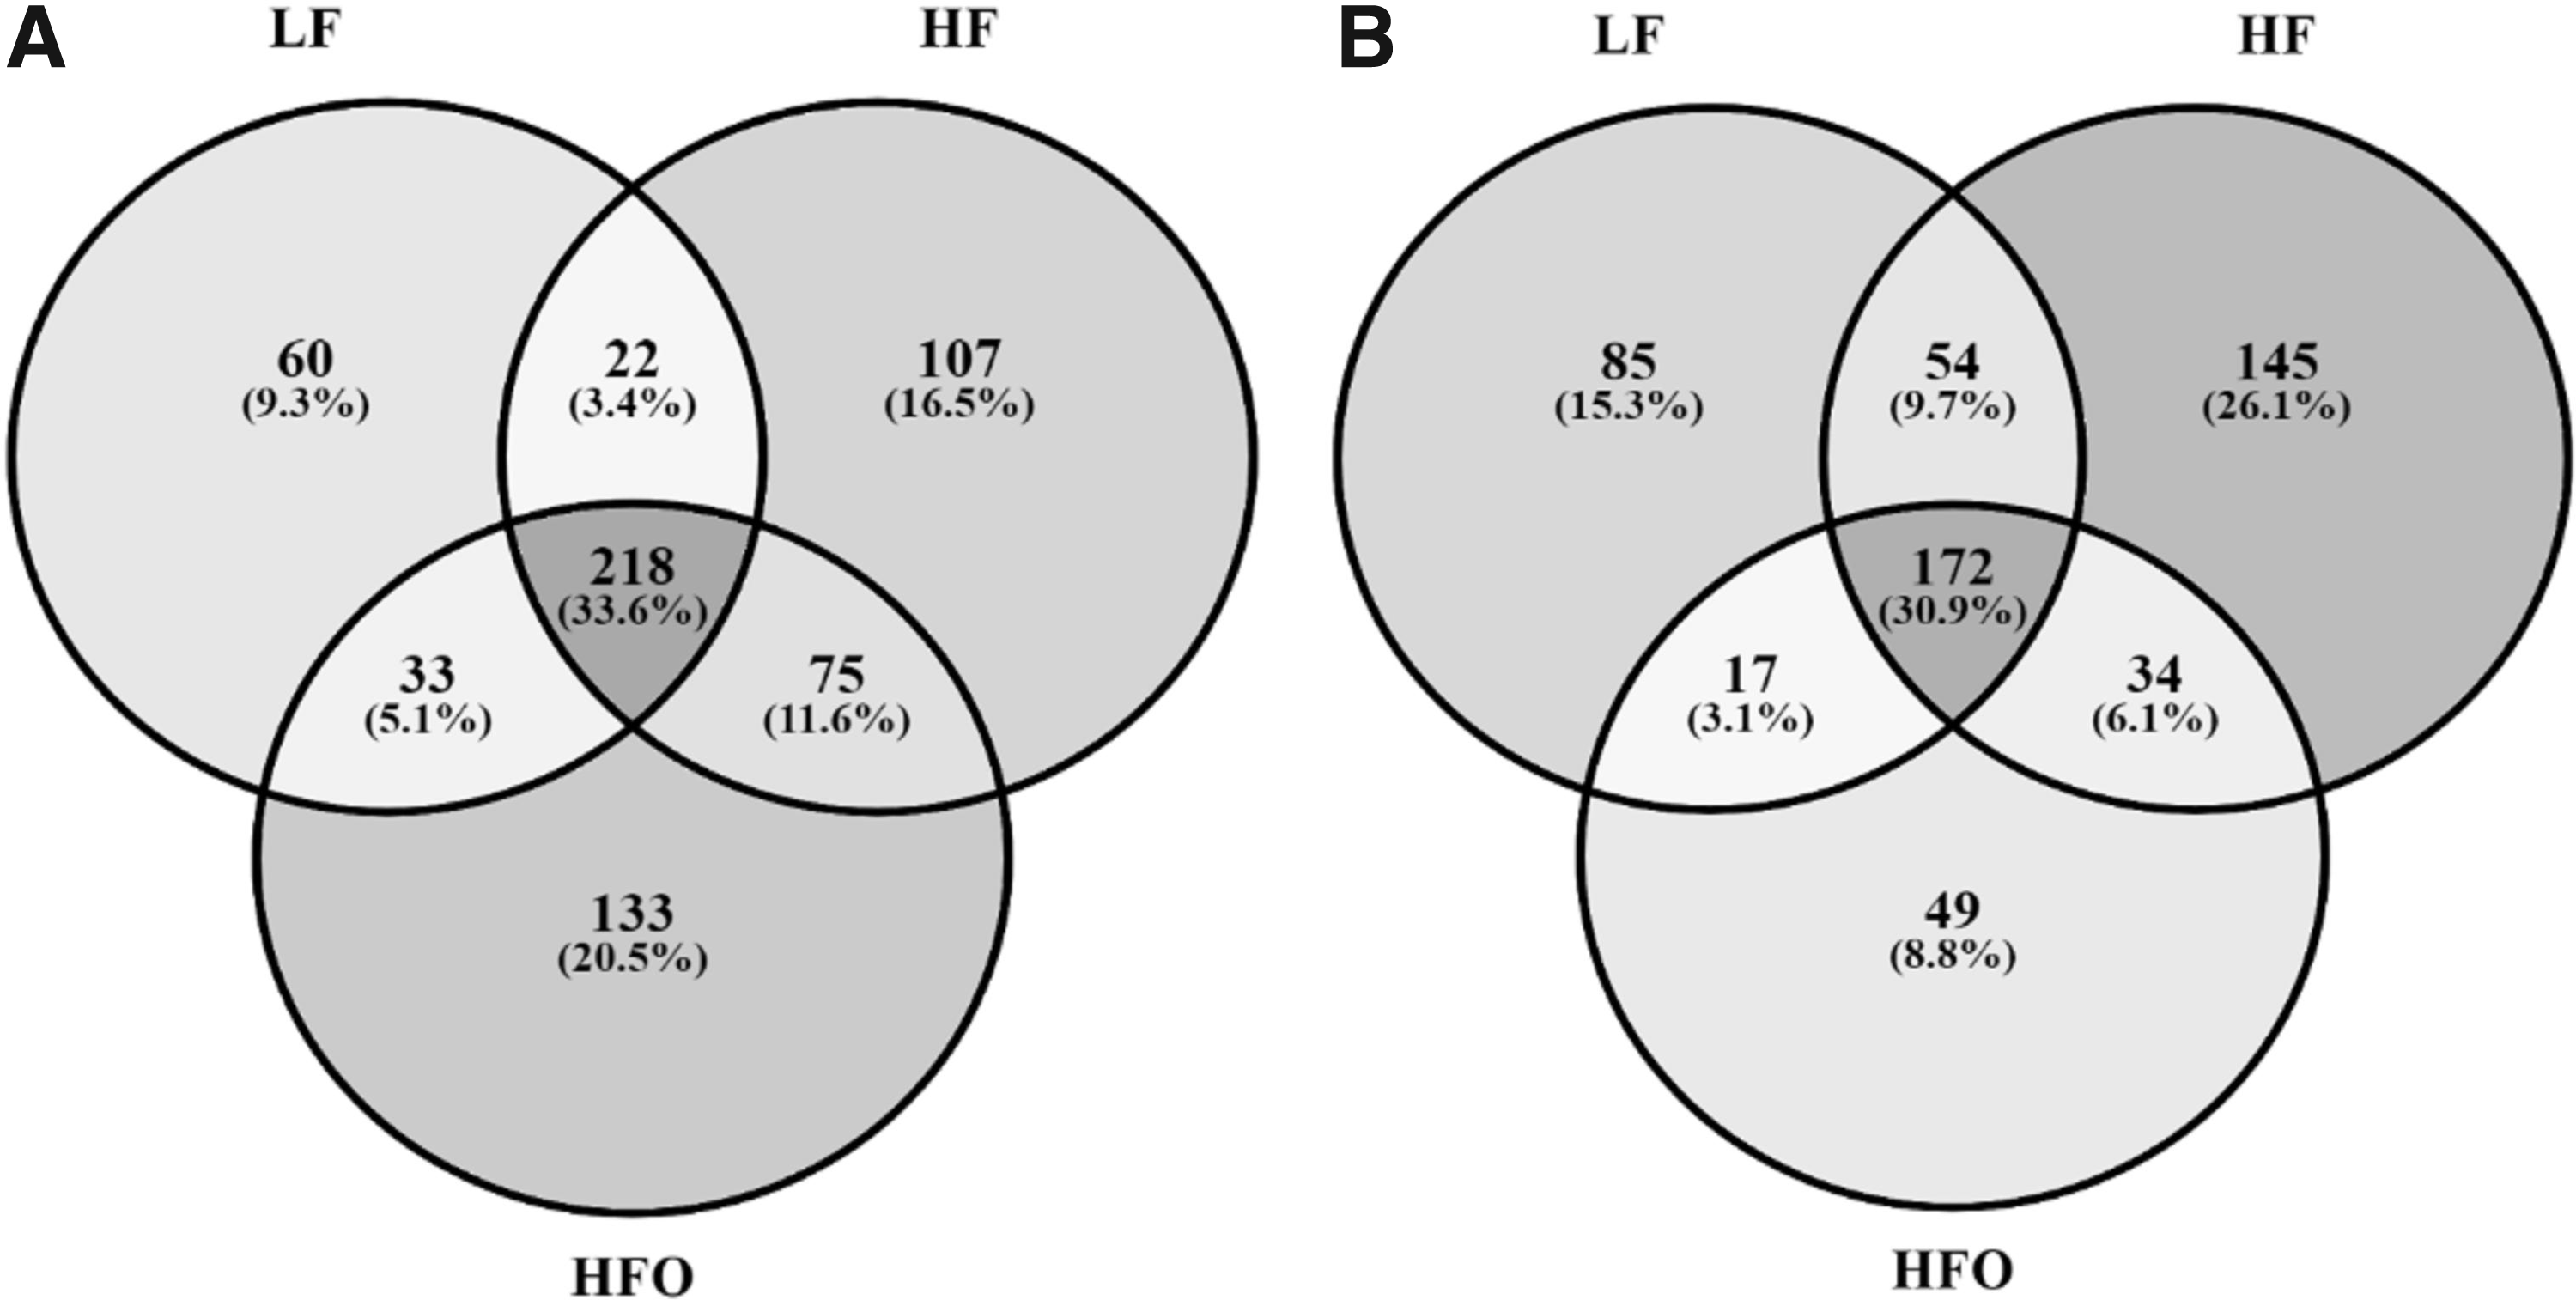
Shared bacterial genera in the intestine of male
Effect of overfeeding a HFD in the intestinal bacterial microbiota
The diversity and abundance of microbiota were significantly different between sexes in the zebrafish analyzed. Therefore, it is possible that this variable or the interaction with other variables are generating a significant effect on the variation of the data. All samples (male and female) were tested in a two-way (sex and diet) permutational multivariate analysis of variance (PERMANOVA), which determined that sex (variable) and interaction promoted a significant effect on data variation (p < 0.05). Based on this test, the diversity indices, and the abundance results, the tests to evaluate the diet effect, were performed separately by sex (Supplementary Table S3).
Males
To compare and detect differences in the bacterial community composition, groups were tested by One-Way Analysis of Similarity (ANOSIM), based on Bray–Curtis distances at the taxonomic class level. ANOSIM test detected a significant dissimilarity between the groups at the basal regimen (LF and HF) against the HFO group; R = 0.22 and 0.18, p < 0.03 and 0.01, respectively. No significant differences between basal groups were detected (Supplementary Table S4). SIMPER analysis detected that the taxa, which contributed mostly to the dissimilarity, were in descending order, Gammaproteobacteria, Clostridia, and Mollicutes between LF versus HFO, and Gammaproteobacteria, Mollicutes, and Betaproteobacteria between HF versus HFO (Supplementary Table S5). Exploratory principal component analysis was performed to detect the effect and correlation of the variables (taxa) on sample distribution (Fig. 5). Mostly, HFO samples were grouped with high similarity, due to the high abundance of Gammaproteobacteria; which explains the high dominance and low diversity of this group (Table 2).
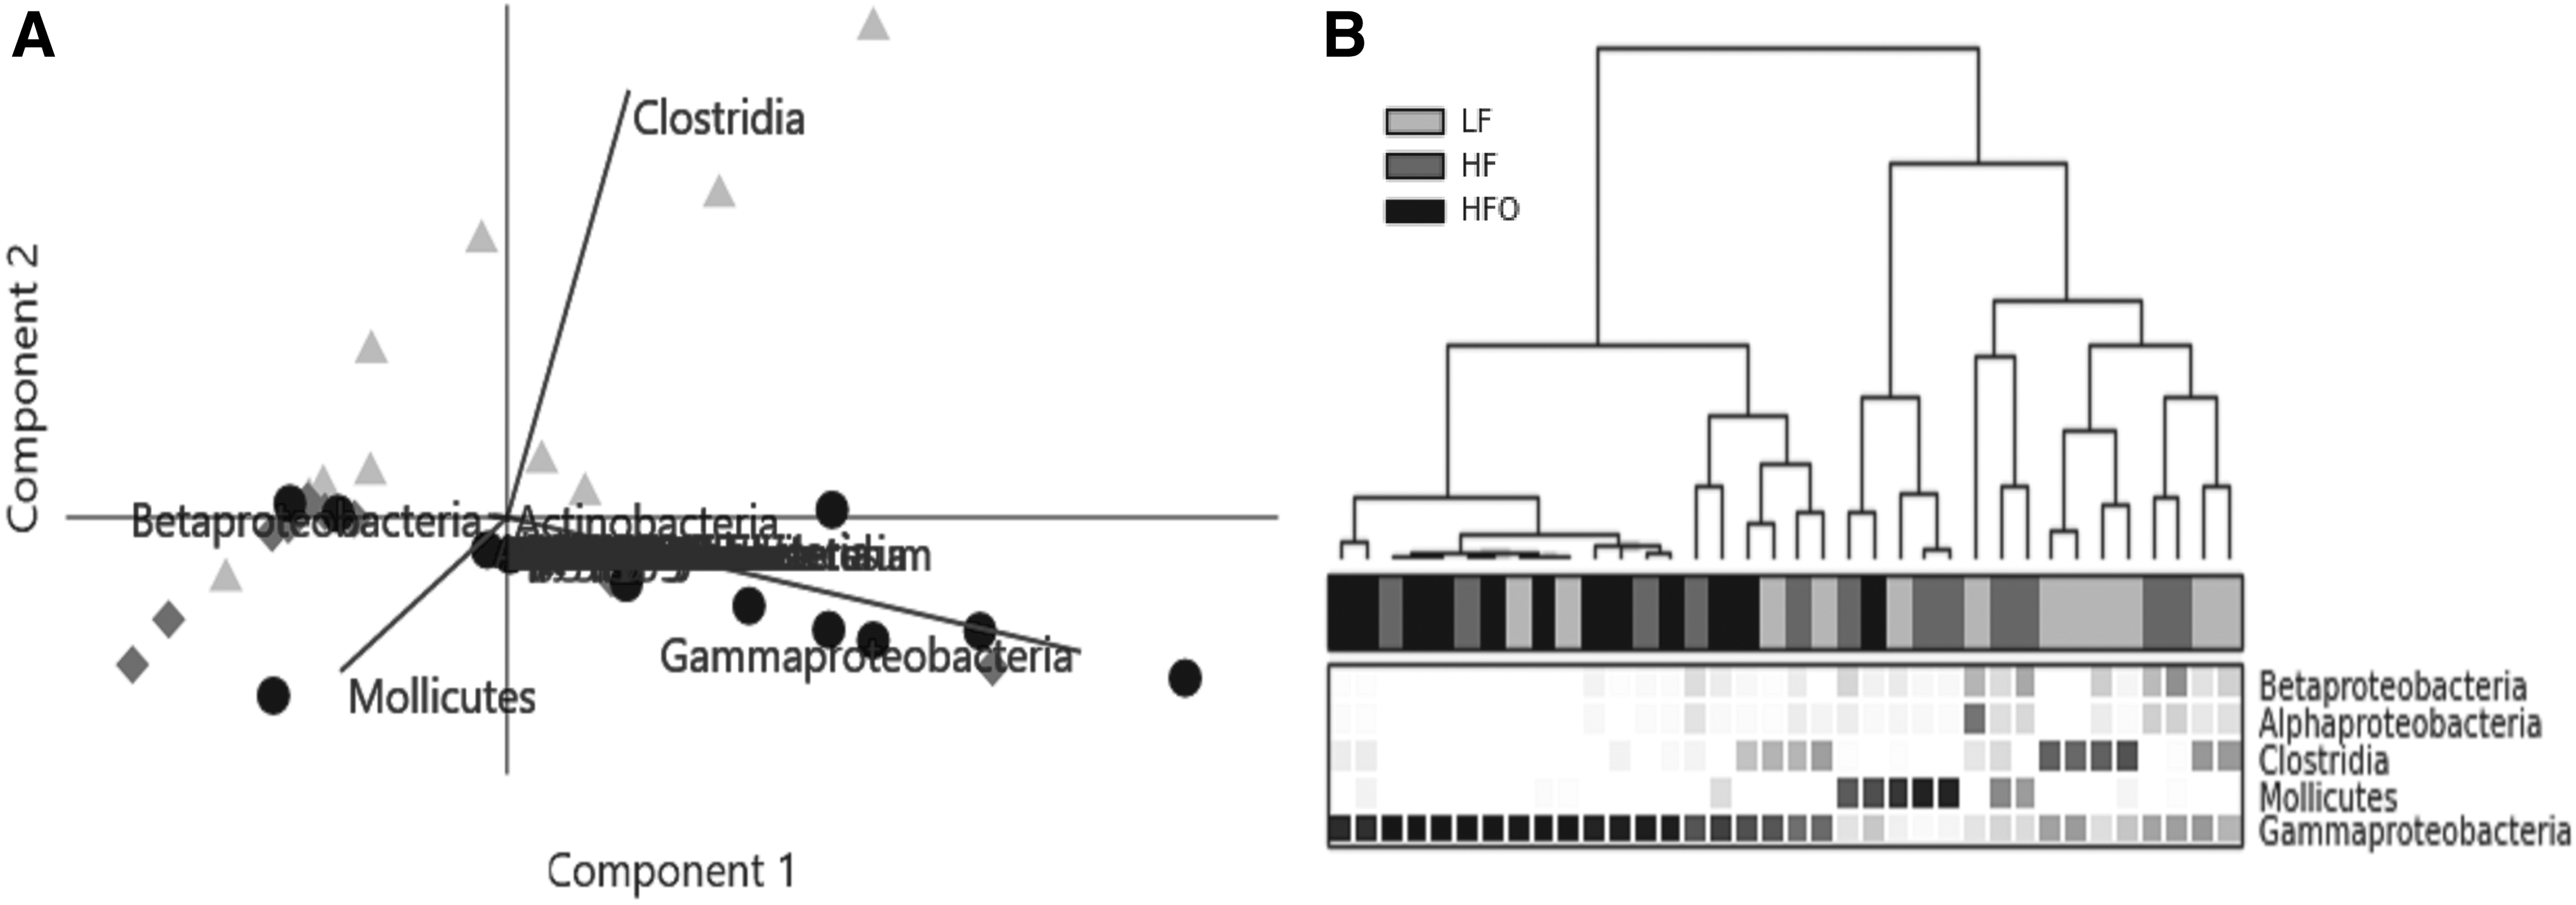
Exploratory analysis of gut bacterial composition in zebrafish (male) in the HFO, LF, and HF regimes. Two-dimensional PCA biplots
Analysis of variance was done to detect significant changes in the proportions of taxa. A one-way PERMANOVA ratified the results of analysis of similarity (ANOSIM), detecting significant differences between groups; p < 0.01 and 0.05 between LF versus HFO and HF versus HFO, respectively (Supplementary Table S6). To identify which taxa presented significant differences by effect of the diet, all representative taxa (mean proportion above 1%, Supplementary Table S2) were tested by analysis of variance (Kruskal–Wallis); additionally, Storey's FDR correction was used to control the false discovery rate. 45 Only five taxa were detected as significantly different. Phylum Bacteroidetes was detected at higher proportion in HF against HFO (p < 0.02), as well as Firmicutes, which presented a higher proportion in LF against HF and HFO (p < 0. 001, in both); on the contrary, Proteobacteria was detected at higher proportion in HFO against LF (p < 0.05), as shown in Supplementary Table S7. The classes Gammaproteobacteria and Clostridia presented significant differences (p = 0.032 and 0.025, respectively); Tukey–Kramer post hoc-identified pairs of groups may differ from each other (p < 0.05). Overfed zebrafish (HFO) presented a significantly higher mean proportion in Gammaproteobacteria compared against the basal groups (LF and HF). Clostridia obtained a higher mean proportion in zebrafish fed under LF diet, as shown in Figure 6. Statistical analyses were tested for all taxa, but only significant differences were detected at the phylum and class levels (Supplementary Table S7).
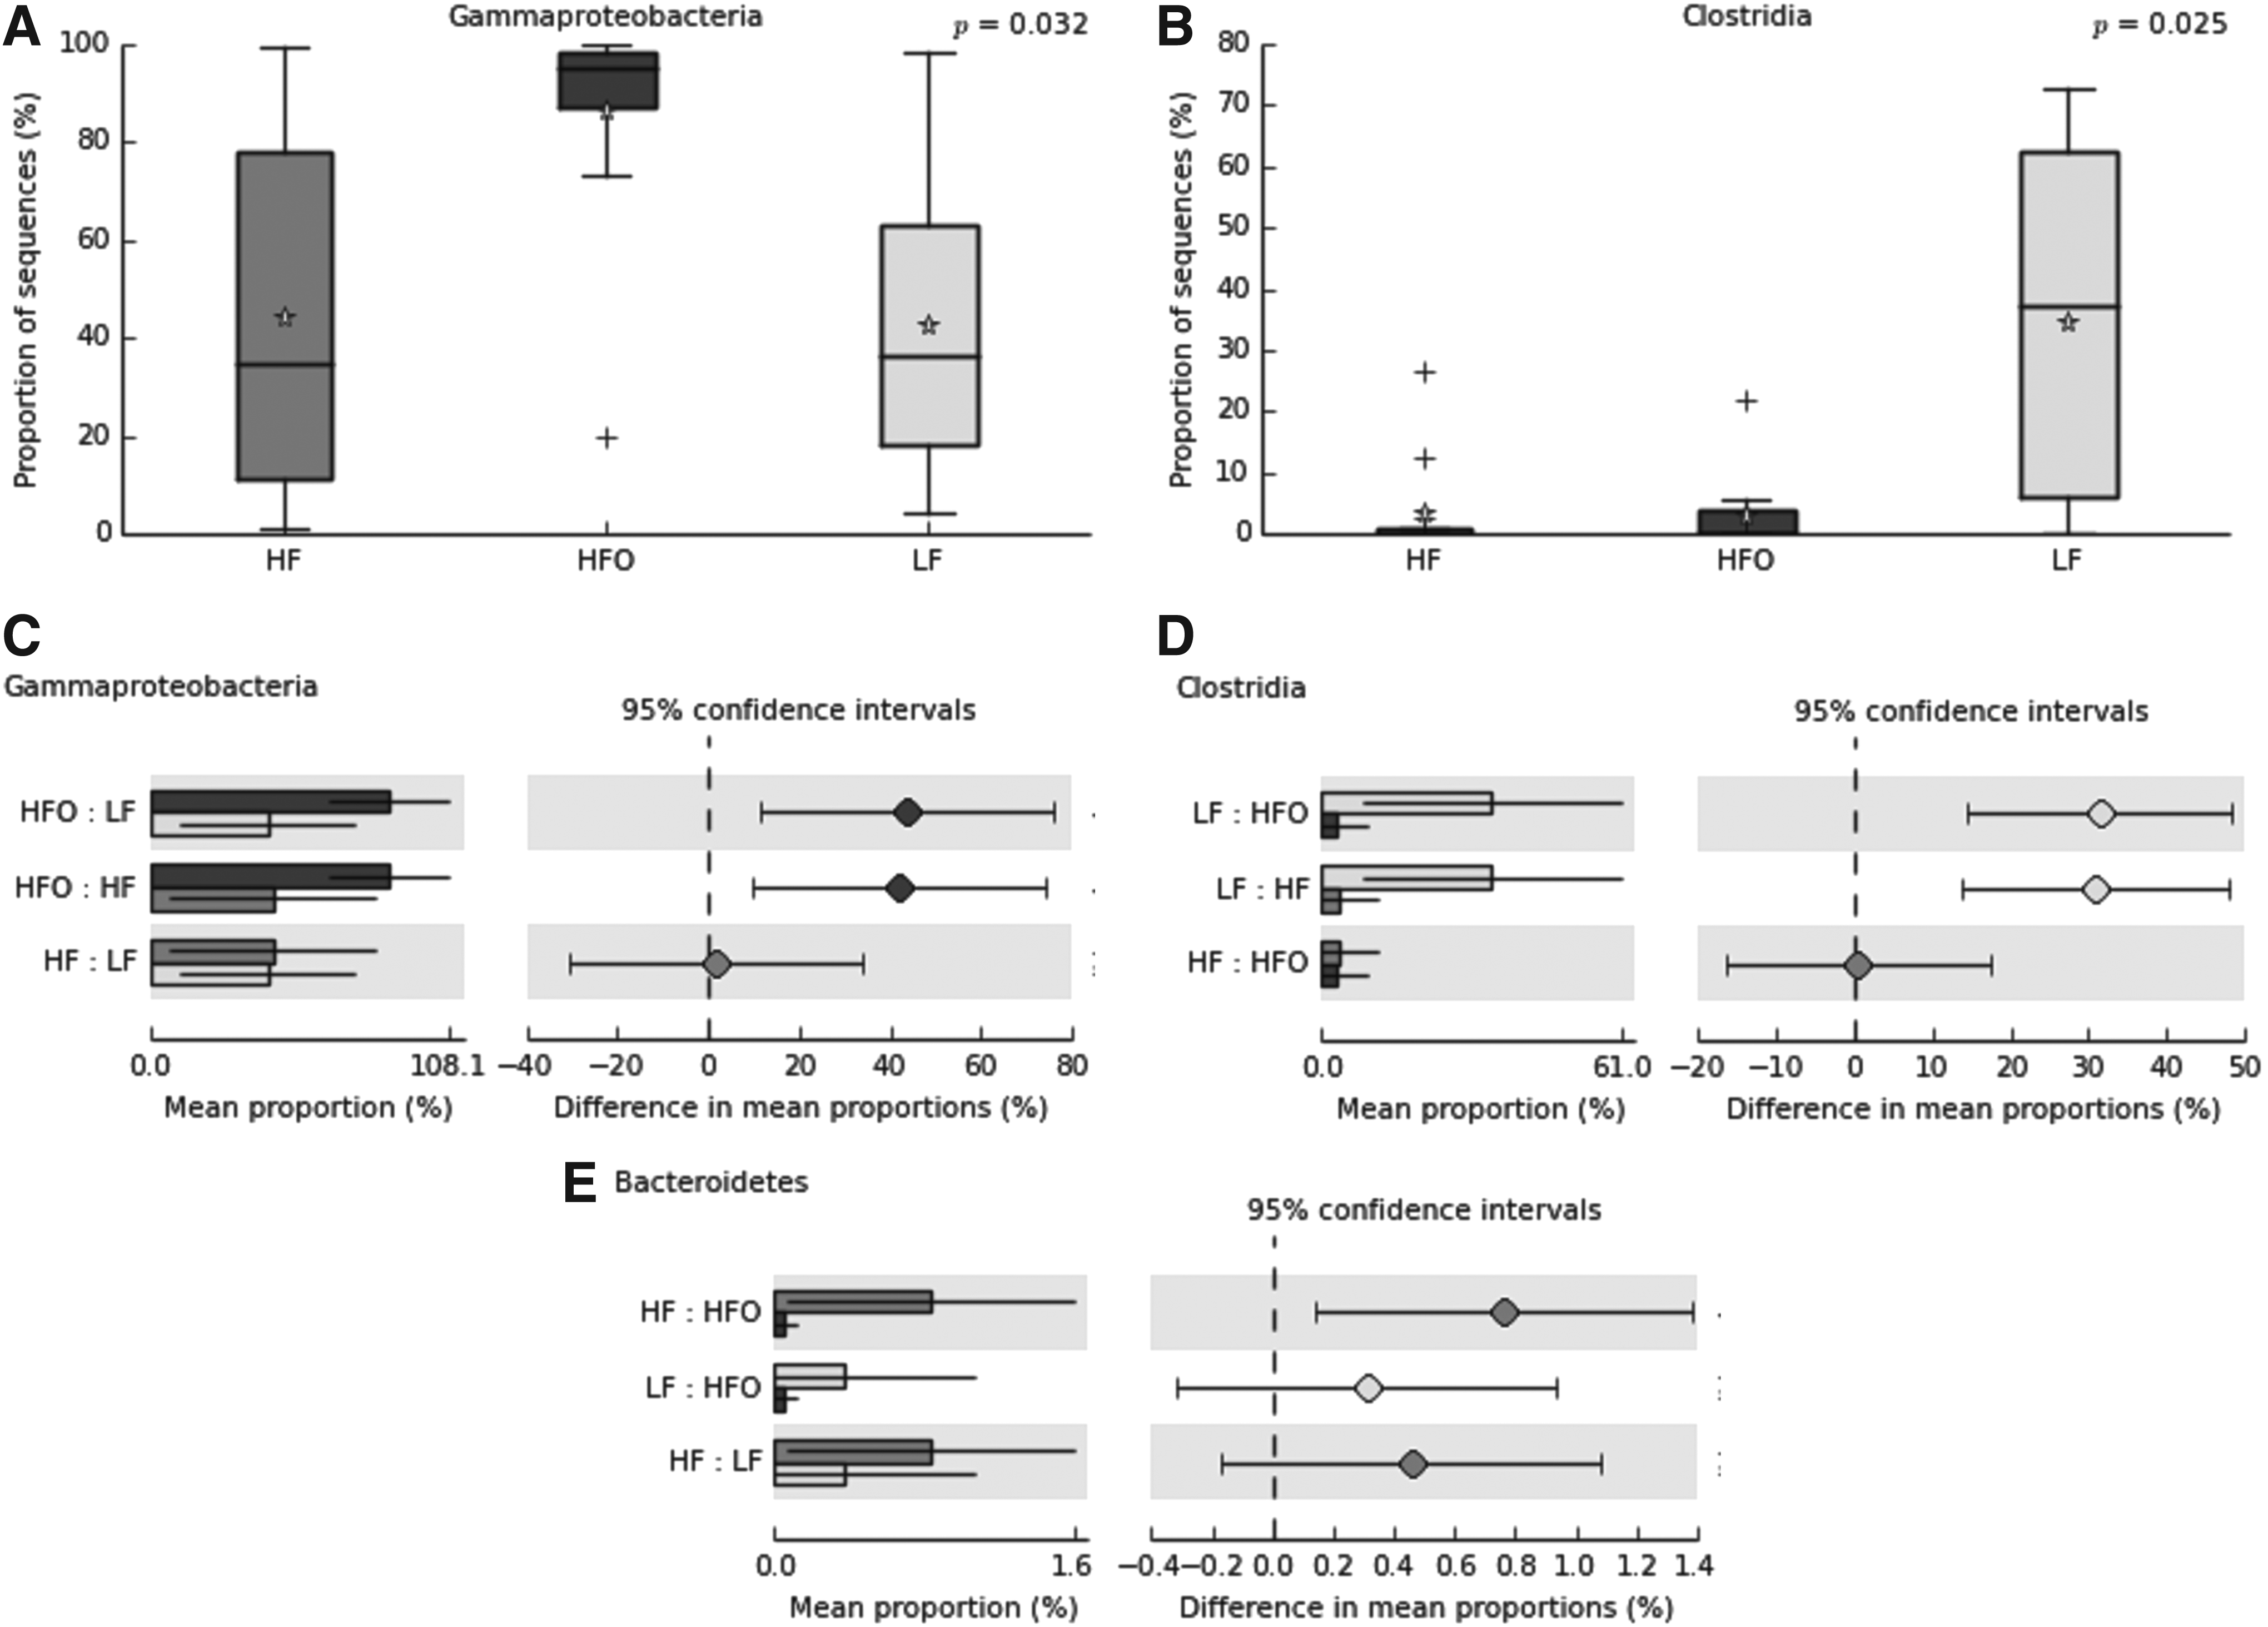
Box plot showing the distribution in the proportion of Gammaproteobacteria
Females
Contrary to results obtained in male zebrafish, ANOSIM confirmed no significant dissimilarity between the treatments R = 0.04, p = 0.12; indicating that the variation within and between the groups was uniform and the bacterial community proportions were similar. Moreover, a close similarity was detected on basal groups (LF and HF) R = −0.04 (Supplementary Table S8). Nevertheless, SIMPER analysis was performed to detect the most variable taxa, these were in descending order, Gammaproteobacteria, Mollicutes, Betaproteobacteria, and Alphaproteobacteria (Supplementary Table S9). Due to the low diversity of Clostridia in the gut of female zebrafish, the contribution of this taxon to dissimilarity was minimal. Nevertheless, exploratory tests were performed (Fig. 7). PERNOVA did not detect significant differences between female zebrafish treatments. Even so, univariate analysis detected that one group, Enterobacteriales (order of Gammaproteobacteria) presented higher abundance in LF against HFO (Fig. 8).
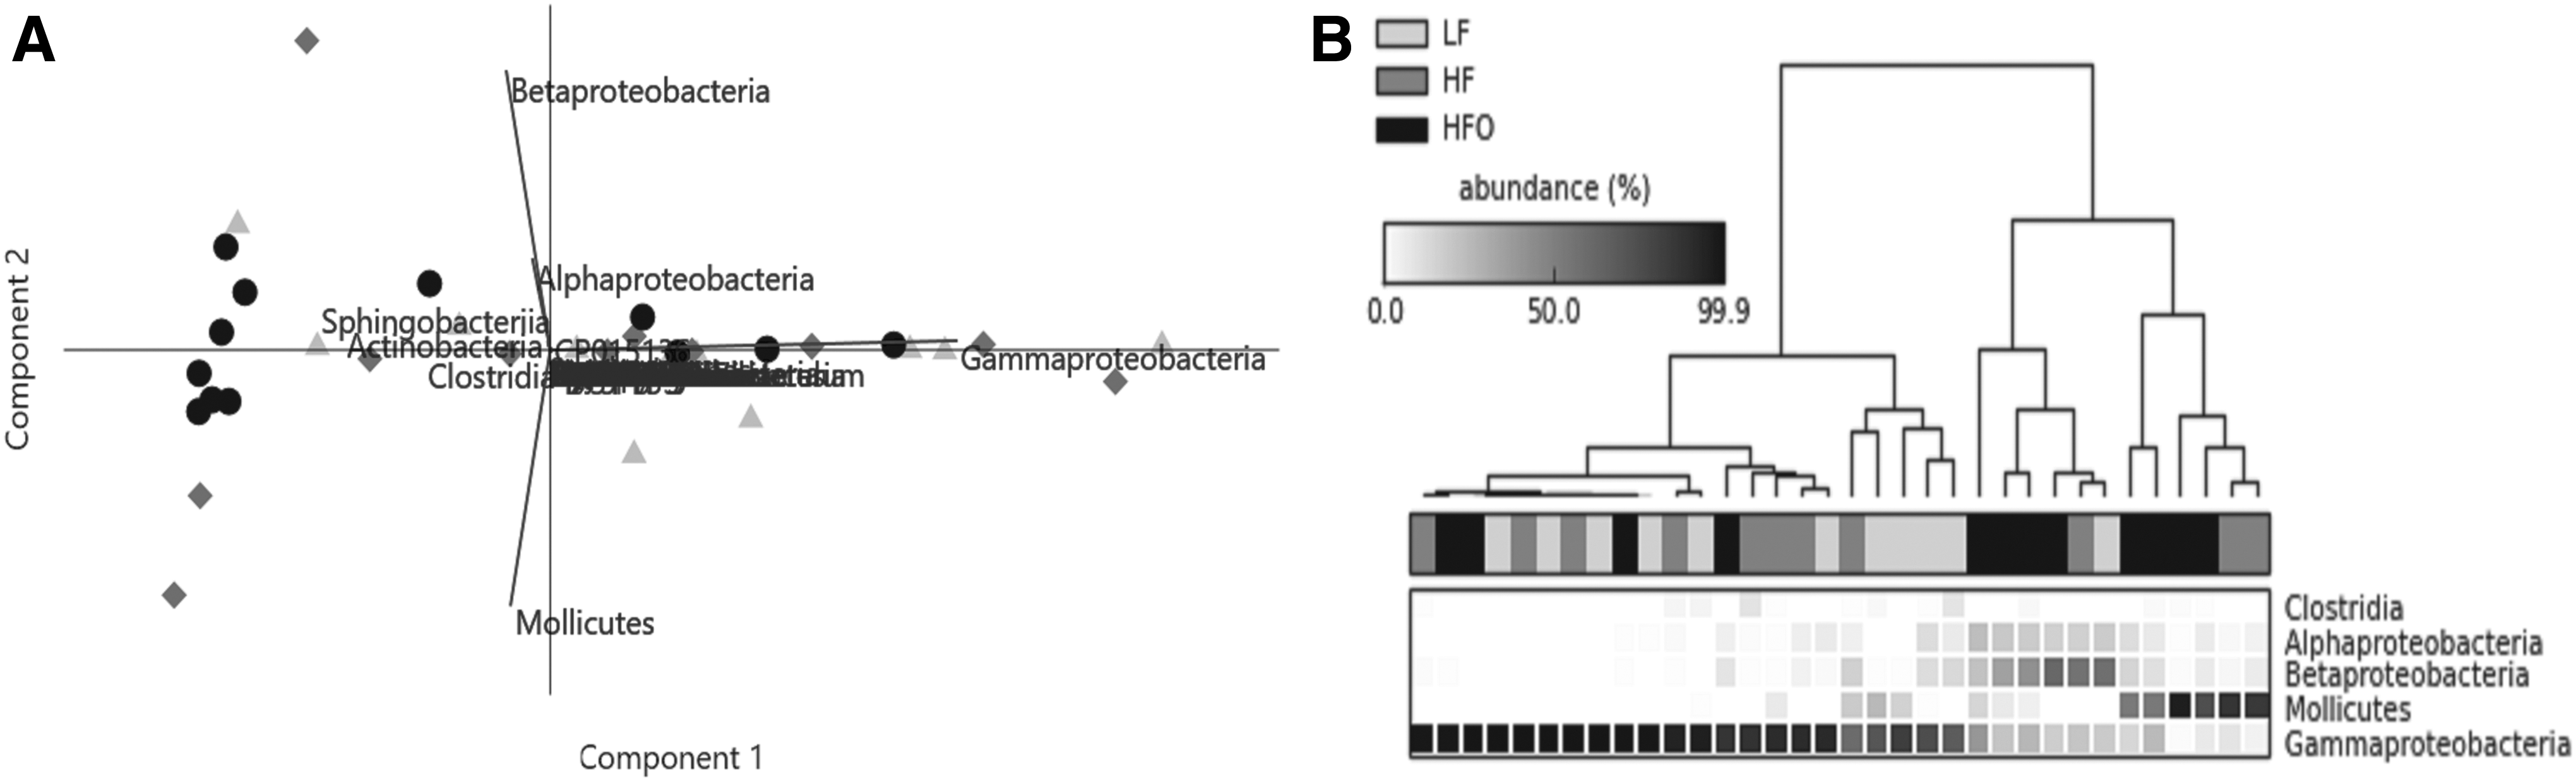
Exploratory analysis of gut bacterial composition in zebrafish (female) under HFO, LF basal regime, and HF basal regime. Two-dimensional PCA biplots
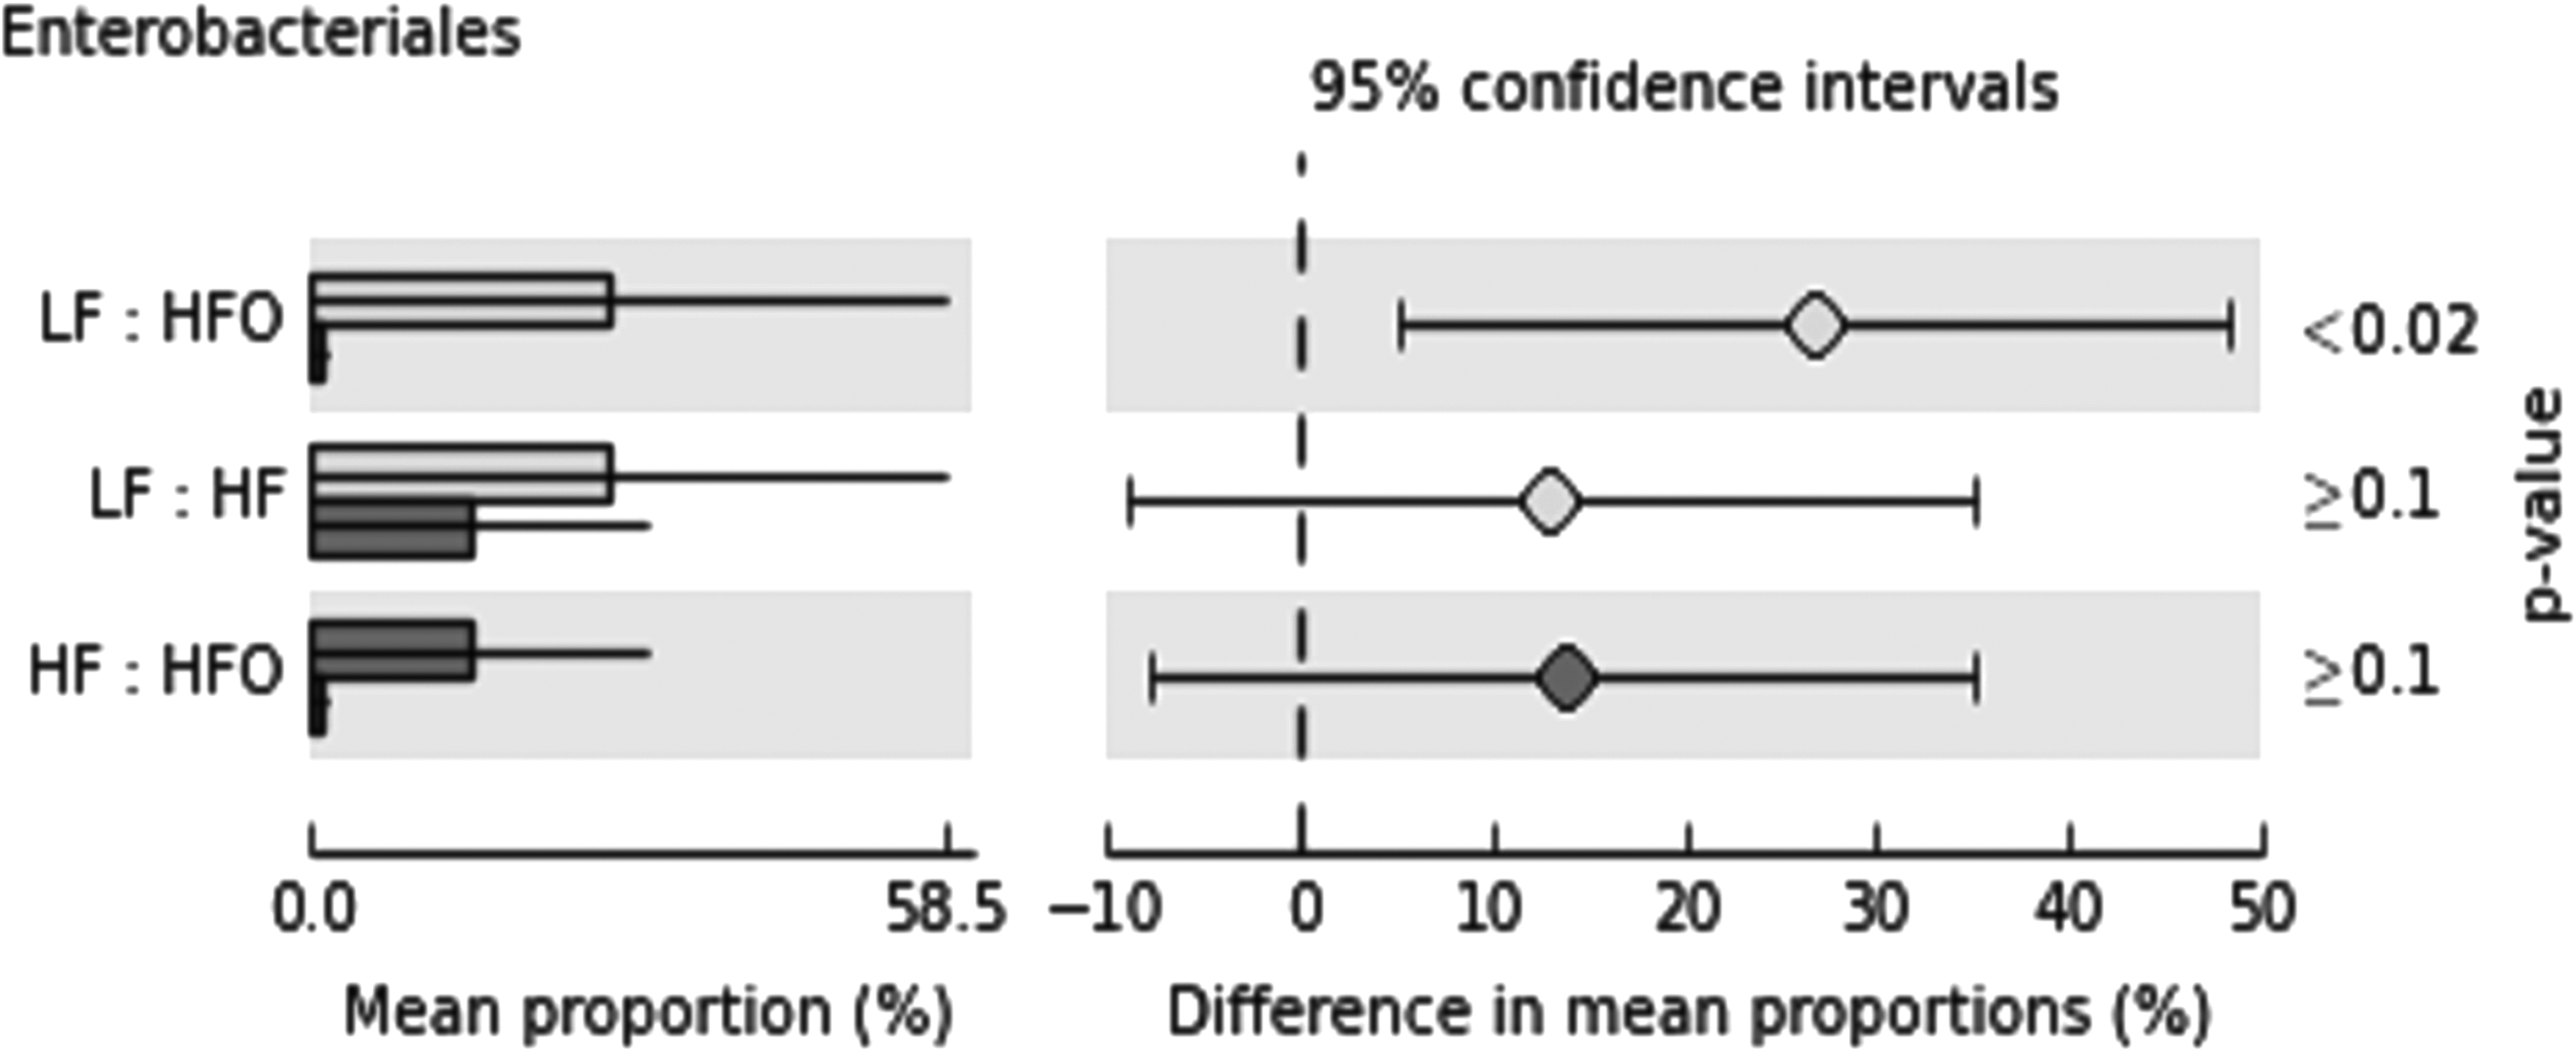
Post hoc plots indicating the mean proportion of sequences within each group and the difference in mean proportions (p < 0.05); Enterobacteriales (Class: Gammaproteobacteria).
Discussion
Obesity and overweight are two of the main problems affecting the human population worldwide. These conditions have been identified as factors influencing the increase of chronic diseases and disorders that can lead to death. Obesity is the result of an imbalance of energy that leads to the accumulation of fat in the body promoting an excessive increase in body mass. Among the main risk factors for obesity are genetic, socioeconomic, environmental, and those related to individual behavior, such as the diet.46,47 Due to recent studies, where a relationship between intestinal microbiota and diet has been established,23,29,48,49 it is important to understand the dynamics of bacterial communities and their role in metabolic health. So, we evaluated the effect of a HF diet provided under an overfed regime using the zebrafish as a model.
As expected, fish of the LF and HF treatments consumed 100% of the food supplied. According to our results of consumption and weight (Fig. 1 and Supplementary Table S1) the amount of food used in this study as a basal diet (≈1.7% of BW) can be used as a maintenance diet that satisfies the caloric requirements of zebrafish without increasing body weight. This value coincides with that reported in other studies, which mentions that amounts of <0.5% BW create a caloric restriction in the zebrafish, 24 whereas amounts of >2.4% BW can be considered excessive. 50 In this study, HFO groups consumed a quantity of food greater than >2.4% BW throughout the experiment; ensuring an overfeeding regime (Fig. 1A). In consequence, HFO groups presented a significant increase in body mass compared with LF and HF; for both males and females (Fig. 1B).
In general, the K value indicates that zebrafish fed a basal diet (LF and HF) can be considered healthy in terms of weight/length ratio. The female zebrafish presented a slightly higher K value than the male zebrafish, and it has been reported that this growth pattern is normal for this species. 51 K and BMI indices suggest that a HFD and overfeeding can promote obesity. The overfed groups (HFO) showed K and BMI values significantly higher than the basal-fed groups (LF and HF). Similar results have been reported in an early stage of development 24 and in adult zebrafish26,52; in both cases, fish considered obese showed a BMI higher than 0.05 (g/cm 2 ). In this work, HFO male and female fish presented BMI values of 0.052 (g/cm 2 ) and 0.061 (g/cm 2 ), respectively; consequently, we can infer that HFO zebrafish became obese at the end of the experiment.
The effect of obesity induced by overfeeding on the specific diversity of the intestinal bacterial community was evaluated by calculating the Shannon index. 53 Previous studies have reported that intestinal bacterial diversity is significantly reduced with the increase of dietary fat, between 5% and 15%. 23 It has been also shown that bacterial diversity is reduced in organisms that suffer from obesity54,55 as well as in organisms with a disorder or disease related to the digestive system.56–58 In this experiment, HFO males showed a lower Shannon index (1.58 ± 0.29) compared with the LF and HF groups with similar values (2.12 ± 0.75 and 2.28 ± 1.04, respectively) but the dominance was higher in HFO males than in the other two groups (Table 2). These results suggest an alteration of intestinal bacterial diversity in males caused by induced obesity by overfed HFD. Contrary to the diversity observed in HFP males, HFO females showed a higher Shannon index (2.20 ± 1.21) than LF and HF females (1.91 ± 0.59 and 1.83 ± 0.64; respectively), but the dominance was similar among them (Table 2).
Sequencing data suggest that Proteobacteria, Firmicutes, and Tenericutes were the dominant phyla in the gut of adult zebrafish. Other studies have also reported Proteobacteria as the predominant phyla in the gut of zebrafish at embryo, juvenile, and adult stages16,18,59; even in other fish and shrimp species.10,49,60–62 In all treatments, Aeromonas (Gammaproteobacteria) was the most abundant genus, except in male LF, where Romboutsia was the most abundant (Table 3). Similar results have been reported in other studies, where the Aeromonadaceae family was detected in the gut of zebrafish at the embryo, juvenile, and adult stages. 63 Moreover, some of the representative genera detected in this study, Aeromonas, Pseudomonas, Plesiomonas, and Shewanella have been detected as the most abundant genera and could be considered as part of core gut microbiota of zebrafish. 59 Possibly the colonization by genera of the Gammaproteobacteria class in the zebrafish gut can be explained because this is one of the most abundant groups in aquatic environments 64 ; additionally, it has already been reported that these taxa are present in the surrounding water in experiments with zebrafish. 16
In males, Proteobacteria and Gammaproteobacteria showed significantly higher proportions in HFO compared with LF and HF (Fig. 6A). It has been proposed that a higher prevalence of Proteobacteria is a possible signal of an imbalance of the intestinal microbiota (dysbiosis) that can lead to disease; increases in this phylum have been reported in mammals with metabolic disorders, such as genetically- and diet-induced obesity, T2DM, intestinal inflammation, and colorectal cancer. 65
In zebrafish, decreases in the abundance of Proteobacteria in organisms that were treated with probiotics (Lactobacillus rhamnosus) have been reported, and showed a decrease in appetite, blood glucose, cholesterol, triacylglycerides (TAG), and the expression of genes involved in the synthesis of TAG and phospholipids (dgat2 and agpat4, respectively), and increased expression of the leptin gene that promotes satiety.17,18,66
Bacteroidetes was detected in a fewer proportion in the HFO group, but only significant differences were detected (p < 0.05) with the HF group (Fig. 6E); this coincides with studies that report significant decreases of Bacteroidetes in obese people compared with lean people and people after a diet therapy. 67 Similarly, it was reported that the abundance of Bacteroidetes in the cecal microbiota of mice with genetically induced obesity (ob/ob) was significantly reduced. 68 The proportion of Bacteroidetes in HF males was higher than in LF males (p < 0.1, Supplementary Table S9); this coincides with other results reported in zebrafish, where a correlation between dietary fat levels and abundance of Bacteroidetes was observed. 25 It has also been reported that the significant increase of Bacteroidetes in zebrafish fed a fat-enriched diet is correlated with a certain degree of inflammation and an increase in goblet cells responsible for regulating the production of intestinal mucus. 20
Mammalian studies have shown a relationship between obesity and consumption of HFD with an increased number of Firmicutes,68,69 but recent studies in mice showed that animals fed with a HFD and with a greater weight gain showed a 17% decrease in this phylum. 66 Moreover, studies in zebrafish treated with probiotics (L. rhamnosus) showed a greater abundance of Firmicutes with a lower expression of the npy gene and therefore a lower intake of food and blood glucose compared with the control group. 18 This coincides with the results obtained in this study; the abundance of Firmicutes was the lowest in the HFO group, getting significant differences with the LF group (Supplementary Table S7). In several studies, especially with mammals, the proportion of Firmicutes/Bacteroidetes is used as an indicator of dysbiosis related to metabolic problems.14,66,70 Similarly, zebrafish have shown lower proportions of Firmicutes when fed a fat-enriched diet with respect to a control. 20 It is possible that in aquatic animals, it could be more appropriate to consider the proportions of Proteobacteria, because this taxon is the most abundant in the intestine of numerous aquatic organisms, also, is one of the most responsive groups to the modifications of microbiota when health is affected.
In female zebrafish, the composition of the bacterial community was different from males. Two-way PERMANOVA (Supplementary Table S3) suggests that most of the variations of the gut microbiota in this experiment is given by the interaction of the variables (diet and sex), and for this reason, a different response was obtained in the female gut microbiota composition (and diversity) by effect of the diet, with respect to males. It has been reported that the microbiota in mice is different in healthy males and females, and these differences caused different metabolic responses when the animals were treated with a streptozotocin-HFD (STZ-HFD) to induce nonalcoholic steatohepatitis–hepatocellular carcinoma. Consequently, a significant loss of diversity (Simpson index) was observed only in male mice with respect to the control. Moreover, the authors reported that tumor-suppressive miRNAs were significantly lower in STZ-HFD mice versus control, but males showed significantly lower levels than females. 14 Similarly, we observed a lower Shannon index and a higher dominance in HFO males versus HFO females (Table 2). Significant differences were detected in the composition of the bacterial community between HFO males versus HF and LF males, but not in the female groups (only Enterobacteriales). In zebrafish, the culturable gut microbiota between males and females was compared and the results did not reveal significant differences related to sex. 71 A more recent study reported that zebrafish exposure to silver nanoparticles promotes a sex-dependent effect on gut microbiota affecting the richness and diversity of intestinal bacterial community in males but not in females. 72 The authors state that sex-dependent response may be due to the fact that male and female zebrafish harbor different gut bacterial communities.
It has been previously shown that the effect of the diet on composition and bacterial diversity depends largely on sex-specific interactions, and sex hormones seem to be responsible (at least in part) for the differentiation of the bacterial communities between males and females. Nonetheless, the mechanisms, paths, and other factors remain unknown. 73 We speculate that the zebrafish reproductive functions (or reproductive cycles) affect the microbiota, because the caloric demand that requires the production of eggs is higher than in males, eggs contain a large amount of lipids, and their biomass can exceed 29% BW of female zebrafish unlike the testis that only represents less than 2% BW of male zebrafish. 26 Despite the reports revealing sex-dependent effects affecting the gut microbiota, a comparison of the gut microbiota between males and females before the experiment would have provided more arguments to determine whether a high fat overfeeding regime alters the gut microbiota in a sex-specific manner.
Conclusion
We have shown that a HFD fed at a basal regime did not alter the intestinal microbiota in male and female zebrafish; however, overfeeding did cause a dysbiosis altering the diversity and composition of the intestinal microbiota in a sex-specific manner. In this particular case, sex was a determining variable in the microbiota response to a HFD.
Footnotes
References
Supplementary Material
Please find the following supplemental material available below.
For Open Access articles published under a Creative Commons License, all supplemental material carries the same license as the article it is associated with.
For non-Open Access articles published, all supplemental material carries a non-exclusive license, and permission requests for re-use of supplemental material or any part of supplemental material shall be sent directly to the copyright owner as specified in the copyright notice associated with the article.