
Abstract
Abstract
Zebrafish embryos and larvae have become popular vertebrate models because their body walls are transparent, which enables live imaging of target organs using fluorescent protein transgenes or dye staining. Software packages for the quantification of these fluorescent signals are available from both commercial and noncommercial sources; however, their algorithms are complicated and their resources (code) have mostly not been openly shared. In this study, we developed a simple and robust open-source software tool named “ZF-Mapper” for the quantification of the fluorescence intensity of each pixel in zebrafish images with batch image file processing capability. Using this software, we can evaluate the three-dimensional (3D) distribution of fluorescence intensity among zebrafish cells by analyzing each image pixel. We tested ZF-Mapper for the analysis of zebrafish with macrophage-specific enhanced green fluorescent protein (EGFP) and obtained results that were equivalent to those acquired using the conventional image analysis software ImageJ. We further applied ZF-Mapper to the analysis of zebrafish with cancer cell xenografts and quantified the amount of implanted melanoma cells labeled with a tdTomato red fluorescent protein in the whole body and the tail region. In addition, by combining ZF-Mapper with R freeware, we created an interactive 3D scatter plot of the fluorescence intensities of macrophage-EGFPs in zebrafish. In summary, we developed the Python-based freeware ZF-Mapper for the quantification of fluorescent signals in multiple zebrafish images, which enables fluorescence-based zebrafish screening. We provide the source code and the executable application software for Windows (.exe) and macOS (.app).
Introduction
Because zebrafish (Danio rerio) possess physiological and genetic similarities to humans and have high fecundity, they have increasingly been recognized as an important animal model in various scientific fields. In particular, owing to the transparency of their body wall at an early life stage (∼1 month postfertilization), transgenic zebrafish that are expressing fluorescent proteins (tissue-specific or censoring constructs) have been developed and utilized for chemical screening in drug discovery and toxicity testing.
Such approaches have collectively been termed “zebrafish screening.” For the evaluation of phenotypic changes in fluorescent dye-labeled zebrafish, the most frequently used software packages include ImageJ with several kinds of macros 1 and other commercial pipelines provided by microscope manufacturers, 2 which enable batch image analysis in a high-throughput manner. These software packages are useful for zebrafish screening; however, some problems remain regarding the quantification of fluorescent signals in individual fish. For example, ImageJ, which is a Java-based freeware program, has high flexibility regarding the custom design of analysis algorithms (“macros”) for particular research modalities and is becoming the most popular image analysis software, not only for zebrafish but for all medical and biological fields. 3 However, the procedure for making ImageJ macros is complicated and requires extensive labor by a professional programmer. Furthermore, ImageJ macros are usually specific for a single purpose and cannot be easily generalized.
Several commercial software packages coupled with fluorescence microscopes or high-content imagers have been utilized for zebrafish image analysis. We previously used the MetaXpress software package (Molecular Devices, Sunnyvale, CA) for cancer-xenograft zebrafish screening. 4 This software provides simple, powerful, and robust analyses suitable for zebrafish screening, but the analysis pipeline creation is not free and the license fee is expensive, which prevents universal access to such software. Recently, Cabezas-Sainz et al. developed the image analysis software “ZFtool” for use with cancer xenograft zebrafish. 5 Although the authors have not published ZFtool as open-source software, their algorithm to omit autofluorescence is very interesting. The threshold used for the fluorescent signal in ZFtool is reasonable and the software evaluates the number of implanted cancer cells in the fluorescence-positive area, not by the fluorescence intensity. The drawback to this approach is that area analysis only provides two-dimensional information about the images, whereas intensity analysis can provide three-dimensional (3D) data.
In this study, we developed a simple and robust software program named ZF-Mapper for the quantification of the fluorescence intensity of each pixel in target images. We have opened the source code of the software (Python) and the executable application software for Windows (.exe) and macOS (.app).
Materials and Methods
ZF-Mapper
ZF-Mapper was first written in Python and then transferred to executable application software for Windows (.exe) and macOS (.app). The Python code is shown and described as follows:
img_tiff = (img_tiff/256).astype(‘uint8’) …..(1)
data = {‘x’: [], ‘y’: [], ‘r’: [], ‘g’: [], ‘b’: [],} …..(2)
pix = img_tiff.ravel()
rs, gs, bs = pix[0::3], pix[1::3], pix[2::3] …..(3)
valid_pix = np.array(range(gs.shape[0]))[gs > threshold] …..(4)
data[‘y’] = valid_pix//img_tiff.shape[1]
data[‘x’] = valid_pix%img_tiff.shape[1]
data[‘r’] = rs[valid_pix]
data[‘g’] = gs[valid_pix]
data[‘b’] = bs[valid_pix]…..(5)
xmin_tiff = data[‘x’].min()
ymin_tiff = data[‘y’][data[‘x’] = = xmin_tiff].min()…..(6)
data[‘x’] = data[‘x’] - xmin_tiff
data[‘y’] = data[‘y’] - ymin_tiff…..(7)
df_tiff = pd.DataFrame(data)…..(8)
df_tiff[[‘x’, ‘y’, ‘g’]].to_csv(‘result.csv’, index = False, sep = ‘,’)…..(9)
Converts the image depth to 8-bit if the processing time of ZF-Mapper is too long (optional).
Prepares the array for restoring the results of the analysis. The parameters “x” and “y” are the horizontal and vertical values of the analyzed image, respectively. The parameters “r,” “g,” and “b” are the values of the red, green, and blue fluorescence channels, respectively. When the image depth is 8-bit, the ranges of “r” and “g” are both between 0 and 256.
Divides the red green blue (RGB) image data into three channels.
Loads the positions of the valid pixels that satisfy the conditions for analysis.
Extracts the pixel information that was loaded in (4).
Takes the minimum and maximum values from the pixels that were gathered in (5) for normalization.
Normalizes the data.
Forms the data frame.
Outputs the results as a comma separated values (CSV) file.
The ZF-Mapper software (Windows or macOS version) can be downloaded from https://github.com/YShimada0419/ZF-Mapper.
Zebrafish
Zebrafish were maintained in our facility according to the standard operational guidelines. For macrophage imaging based on an enhanced green fluorescent protein (EGFP), we used Tg (mpeg1:EGFP). 6 For the cancer xenograft study, we used Tg (kdrl:EGFP). 7 To establish cancer xenografts, we implanted tdTomato-labeled human melanoma A375 cells into the duct of Cuvier of 48 h postfertilized Tg (kdrl:EGFP) embryos according to the previously described methods.8,9 For fluorescent bead injection, we injected green fluorescent silica particles, silicastar-greenF (Micromod Partikeltechnologie GmbH, Rostock, Germany), into yolk sacs of 48 hours postfertilization (hpf) AB embryos using a FemtoJet injector (Eppendorf, Hamburg, Germany). All the animal procedures were approved by the Ethics Committee of Mie University, were performed according to the Japanese animal welfare regulation “Act on Welfare and Management of Animals” (Ministry of Environment of Japan), and complied with international guidelines.
Image capture
Zebrafish images were captured using an all-in-one fluorescence microscope (BZ-X710; Keyence, Osaka, Japan) equipped with a Nikon CFI 60 Series infinite optical system and 2.83 million-pixel monochrome charge-coupled device (CCD) camera (output signal is 14 bit). The conditions for image capture are described as follows:
Four-time objective lens with 10-times eyepiece (40-times).
High-resolution mode (1920 × 1440).
Exposure time; brightfield: 1/7500 s, geen fluorescent protein (GFP: Ex 470/40, Em 525/50): 2 s, tetramethyl rhodamine iso-thiocyanate (TRITC: Ex 545/25, Em 605/70): 2 s.
The zebrafish were oriented laterally in either a right- or left-headed manner.
For imaging, zebrafish were anesthetized with 0.003% tricaine (MS222; Sigma-Aldrich, St. Louis, MO). If we found fluorescent debris in captured images, we simply deleted the area containing the debris.
Anticancer drug treatment of xenograft zebrafish
For anticancer drug treatment, each A375 xenograft at 72 hpf (day 1) was transferred into a single well of a 96-well plate (ZFplate; Hashimoto Electric Industry, Mie, Japan) and an image was captured using the BZ-X710 fluorescent microscope (Keyence). Then, the xenografts were treated with anticancer drugs for 3 days and the image was captured again. Images were analyzed using ZF-Mapper and we calculated the ratio of second (day 4; 3 days after drug treatment) and first (day 1; just before drug treatment) fluorescence intensities, according to our previous studies (2). We used vinblastine sulfate (Sigma-Aldrich), cisplatin (Sigma-Aldrich), and sorafenib (Santa-Cruz Biotechnology, Santa Cruz, CA).
Fluorescent quantification using ImageJ (with macro)
After running ImageJ (version 1.52c) with the macro described as follows, we measured the EGFP-positive area and fluorescence intensity of tg (mpeg1:EGFP) zebrafish. The ImageJ macro for selecting the EGFP-positive area was saved as “startup macro.text” in the ImageJ macro folder.
macro “pre-mpeg-egfp [g]”{
run(“RGB Color”);
run(“8-bit”);
setAutoThreshold();
setThreshold(20, 255);
}
To run the “startup macro,” press the “G” key after importing an image.
To avoid the inappropriate quantification of autofluorescence in the yolk sac, which increased with the number of days postfertilization, we set the threshold value relatively high (>20).
Production of a 3D scatter plot from the ZF-Mapper output using R software
To create a 3D scatter plot from the ZF-Mapper output, the rgl and plot3D packages of R software were used. The R code is shown and described as follows:
X<- read.table (“C:/Users/Desktop/image01_out threshold20.csv,”head) …..(1)
library (rgl) …..(2)
plot3d (x = X$x, y = X$y, z = X$g, type = “p,” col = “green,” xlim = c(1, 2000), ylim = c(−1000, 1000)) …..(3)
bg3d(“darkgray”) …..(4)
writeWebGL(width = 700, height = 700) …..(5)
Specifies the ZF-mapper output file (e.g., image01_out threshold20.csv) to be read.
If the rgl package was not installed, this code installs it from CRAN (https://cran.r-project.org/).
The color of the spot (col) and the lengths of the X (xlim) and Y (ylim) axes can be changed.
The background color of the whole graph can be changed.
Outputs a 3D scatter plot in WebGL format.
Results and Discussion
ZF-Mapper
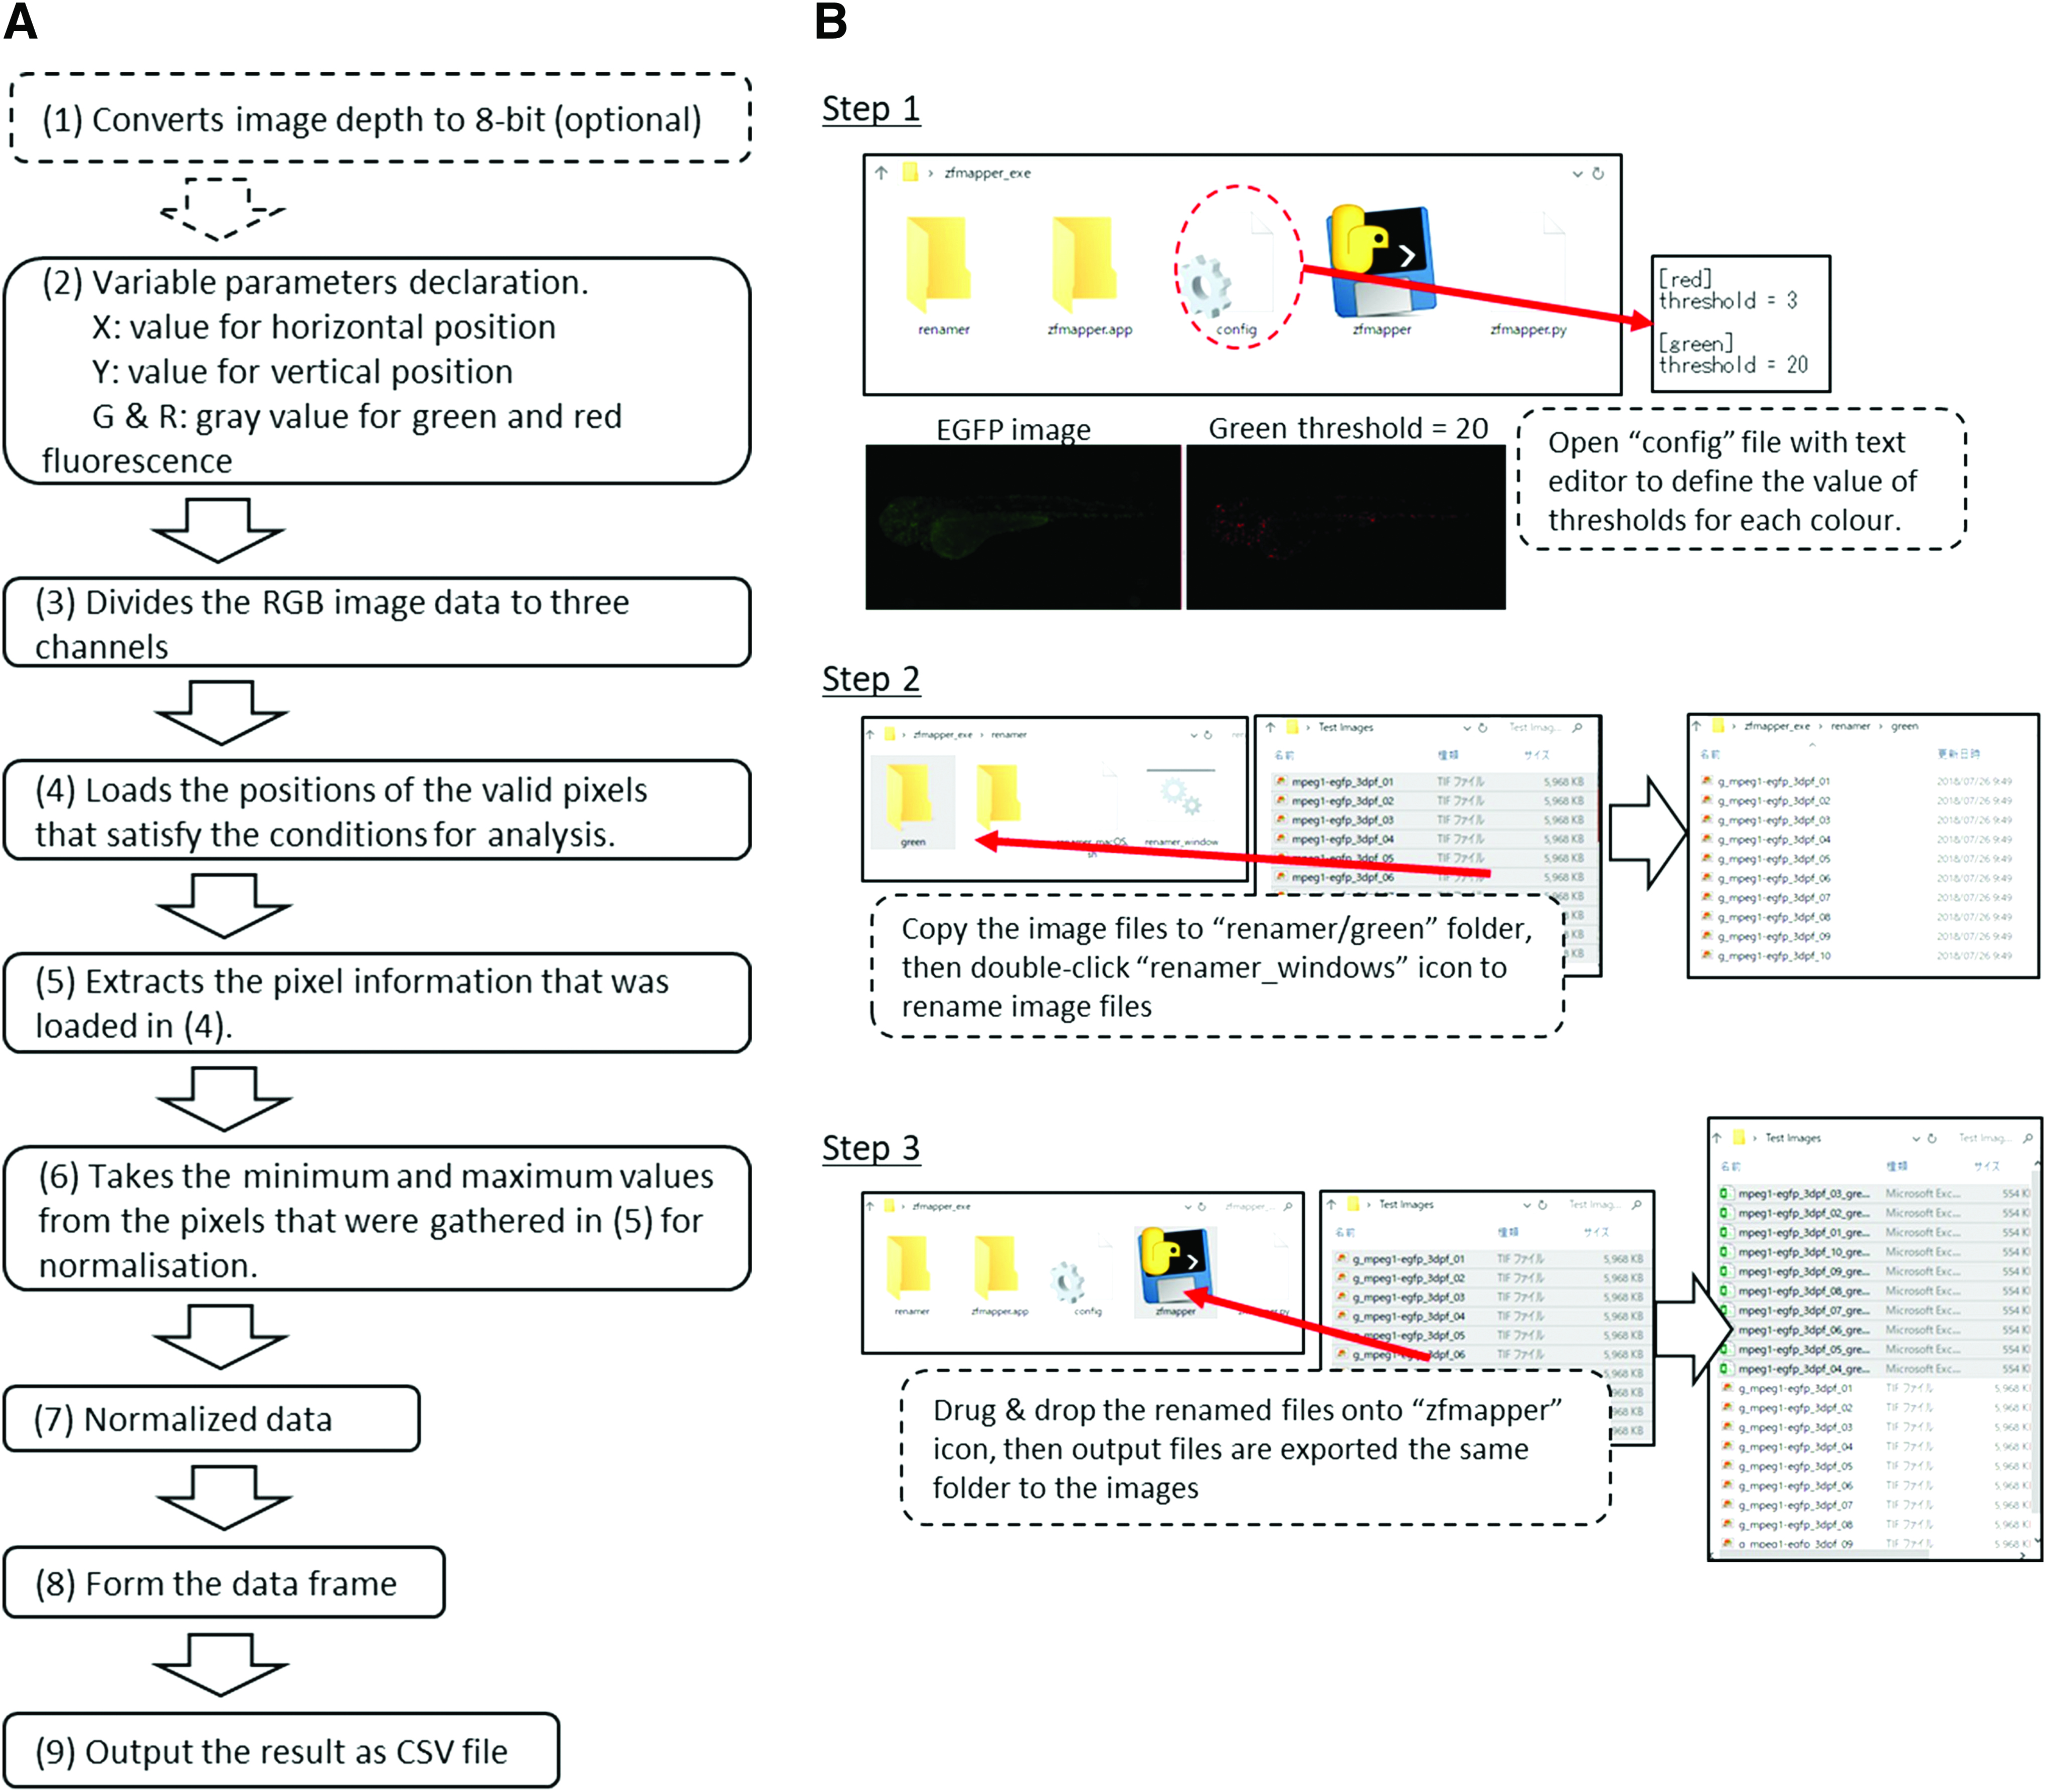
Figure 1A shows an algorithm of the ZF-Mapper software. The details are described in the Materials and Methods section. In the output file, “X” and “Y” indicate the h>orizontal and vertical positions of the image and originate from the left edge and the vertical centre of each zebrafish, respectively. “G” and “R” indicate the intensities of green and red fluorescence, respectively, in each pixel. Figure 1B shows how to use ZF-Mapper. First (step 1), we decided the threshold value for each fluorescence channel and changed the names of image files to add the prefix “g_” or “r_” for green or red fluorescence, respectively. We also used batch renamer software after copying the images into the green or red folder (step 2). Finally (step 3), by “dragging and dropping” the multiple renamed images onto the ZF-Mapper icon, we retrieved the fluorescent intensities (G or R) of each image with positional information denoted by the X and Y values. Supplementary Movies show how ZF-Mapper works in Windows (Supplementary Movie S1) and macOS (Supplementary Movie S2).
Overview of the ZF-Mapper software.
Comparison between ImageJ and ZF-Mapper quantification
We first validated ZF-Mapper quantification using fluorescent bead injection into zebrafish embryos. We injected green fluorescent beads into 24 hpf yolk sacs in a volume-dependent manner and quantified fluorescence intensities using ZF-Mapper. As shown in Figure 2A, the results of ZF-Mapper are parallel to the volume of injected fluorescent bead intensities. Next, to compare ZF-Mapper with the conventional image analysis software ImageJ, we quantified the total fluorescence of zebrafish expressing macrophage-specific EGFP, tg (mpeg1:EGFP), at the developmental stage of 2–6 days postfertilization. We set the threshold to a grayscale intensity value of 20 to avoid the inappropriate measurement of autofluorescence in the yolk sac in both the ImageJ and ZF-Mapper analyses. It should be noted that even with this relatively high threshold, we could not exclude the yolk sac-derived autofluorescence in some of the 6 days postfertilization larvae (Fig. 2B). The changes in macrophage fluorescence over time in the whole fish were similar between ZF-Mapper and ImageJ (Fig. 2C); however, the deviation of each time-point in the ZF-Mapper data was smaller than that in the ImageJ data. We assumed that the deviation was smaller because ZF-Mapper quantifies the fluorescence value (grayscale intensity) of each pixel in the whole image, and consequently the individual differences among the quantified values were less than those in ImageJ.

ZF-Mapper analysis of zebrafish expressing macrophage-specific EGFP.
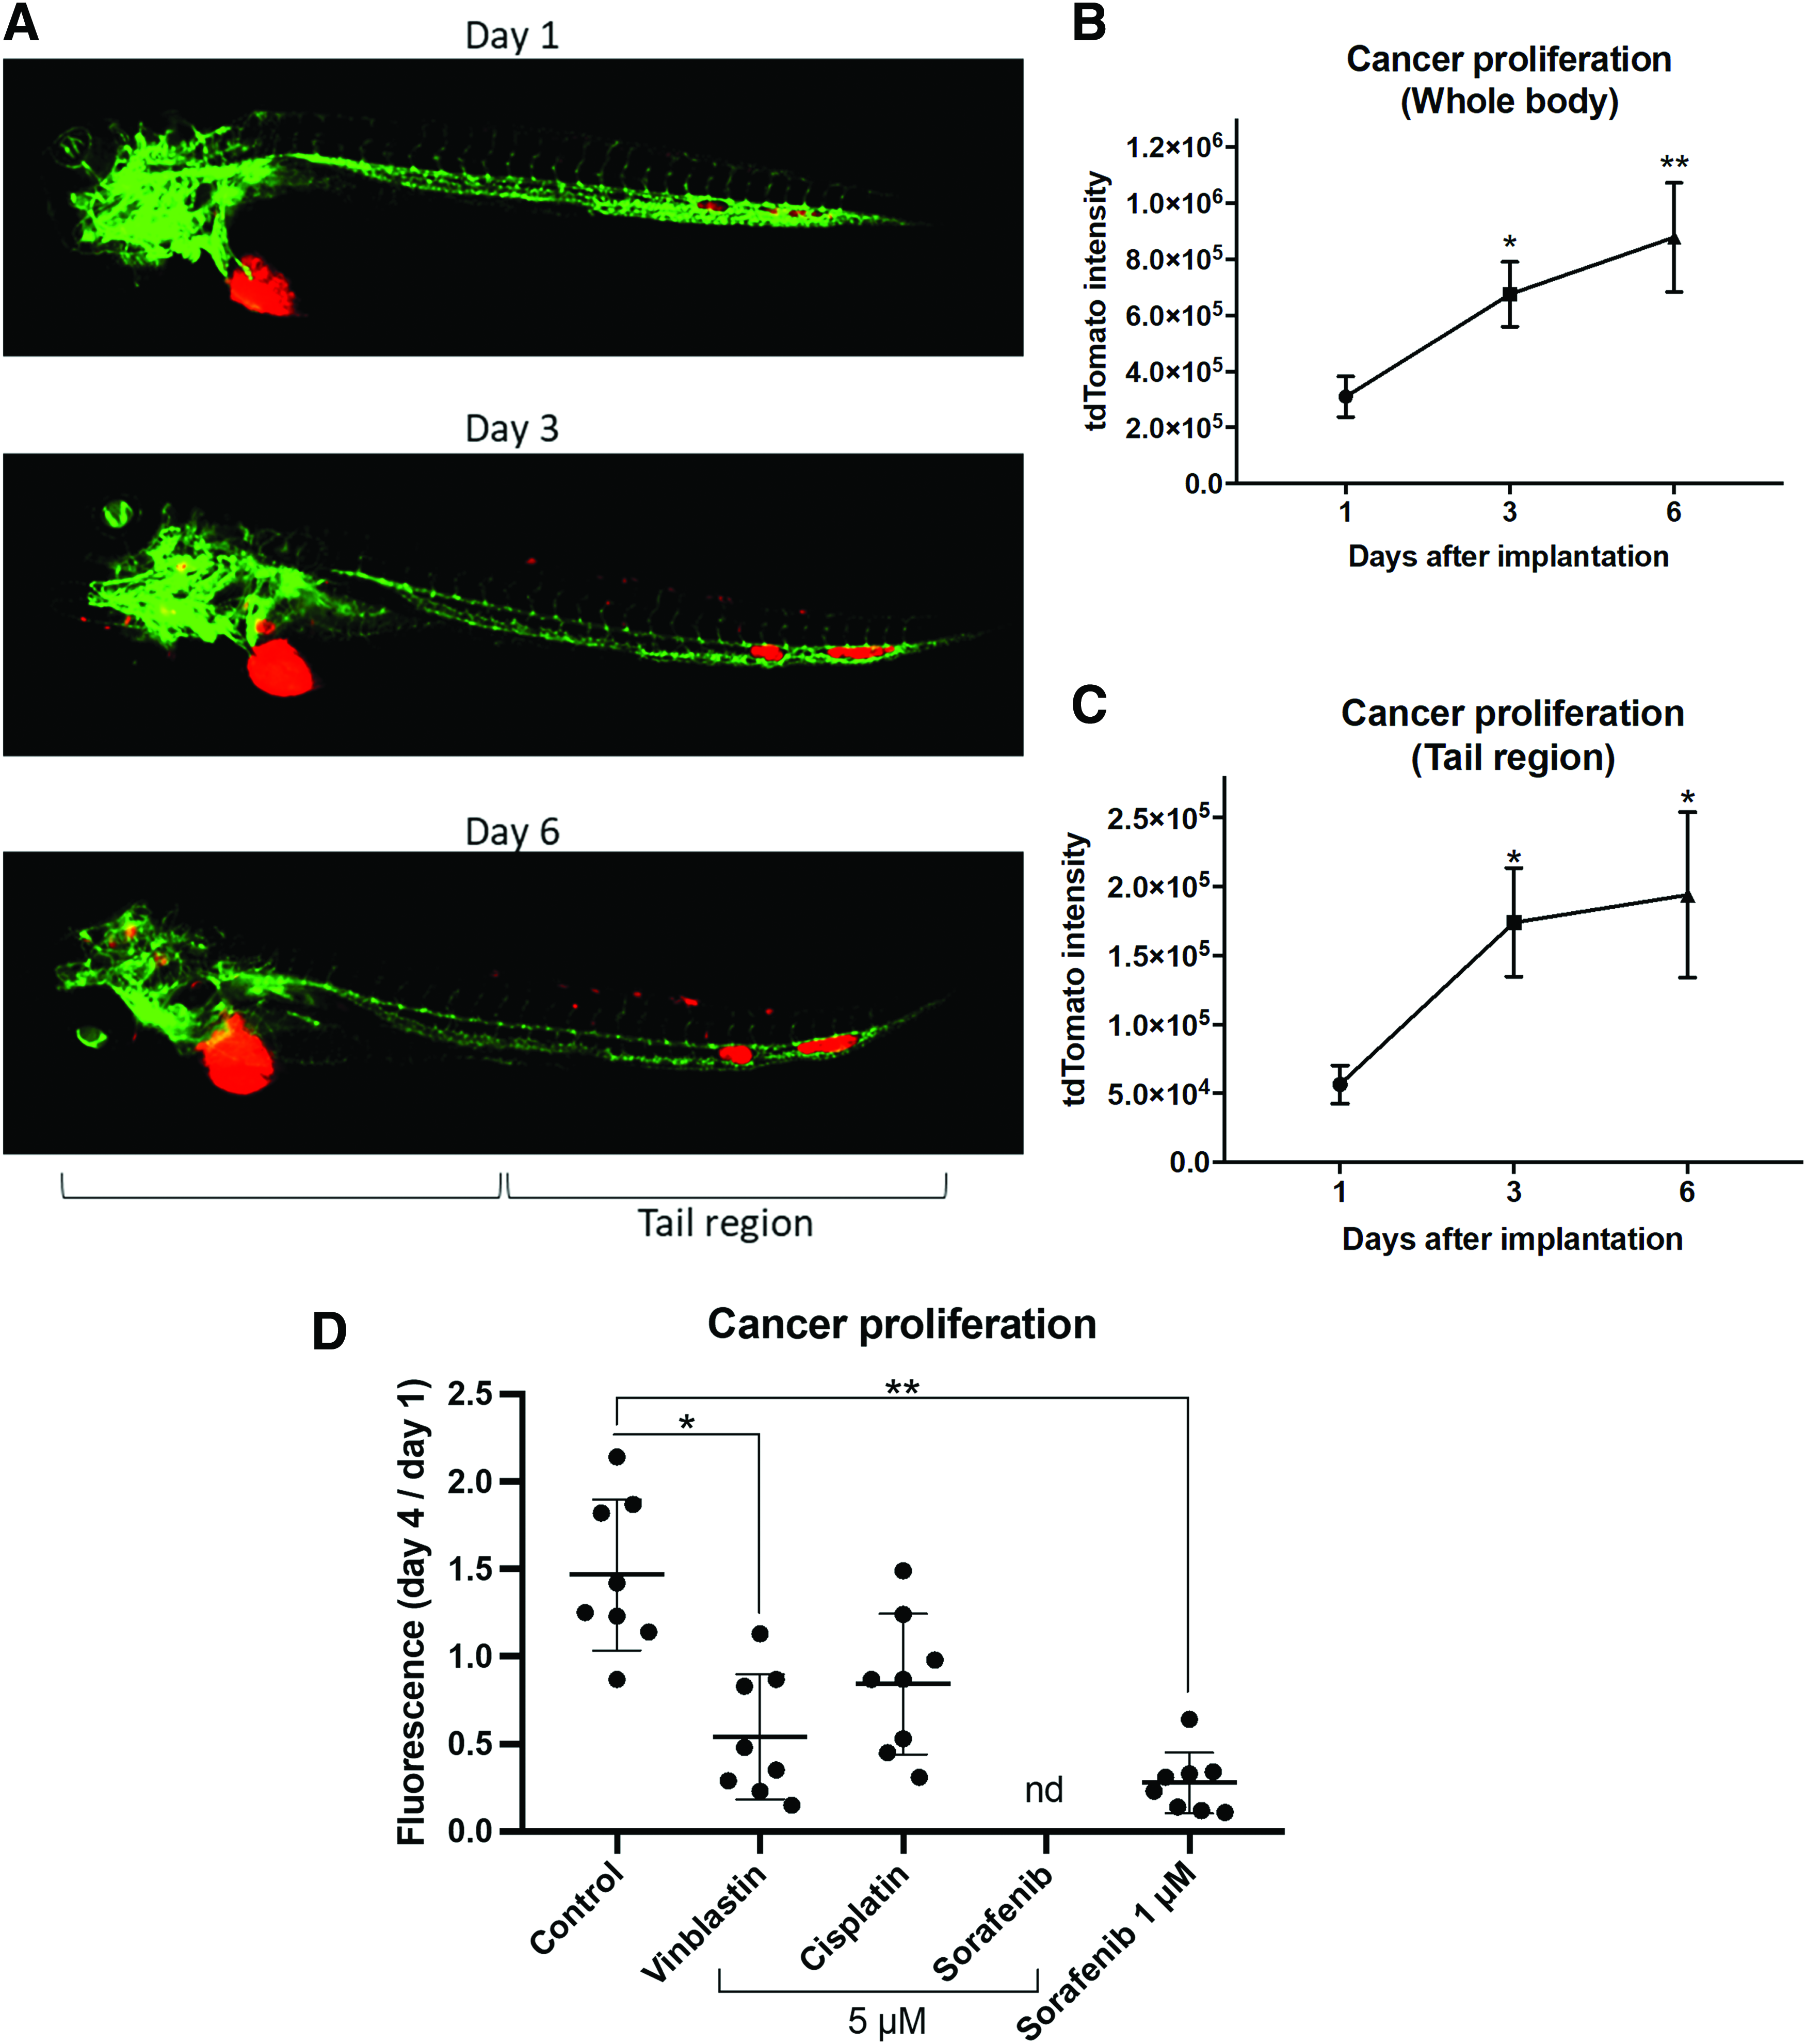
Next, we used ZF-Mapper to analyze the fluorescent images of cancer xenograft zebrafish. We implanted human melanoma cells labeled with the tdTomato fluorescent protein into 48 hpf zebrafish. As shown in Figure 3A, the number of implanted melanoma cells increased over time, and we quantified the tdTomato intensities in the whole larvae using ZF-Mapper (Fig. 3B). The tdTomato fluorescence signal gradually increased over time, indicating that the total number of implanted cancer cells increased. We also calculated the tdTomato signal intensities in the posterior half of the zebrafish, that is, the tail region (Fig. 3C). In contrast to the results from the analyses of the whole body (Fig. 3B), the number of cancer cells in the tail region did not increase from day 3 to day 6. This may be because the proliferative capability of the implanted cells was lower owing to the limited space in the tail region. We also performed anticancer drug treatments (vinblastine, cisplatin, and sorafenib) on A375 melanoma xenografts and quantified the tdTomato signals in melanomas to create a ratio of 24 to 96 hours postinjection (hpi) using ZF-Mapper. As shown in Figure 3D, ZF-Mapper analysis can be applied for zebrafish screening.
ZF-Mapper analysis for cancer xenograft zebrafish.
3D modeling from ZF-Mapper output
We constructed a 3D scatter plot from the ZF-Mapper output data, in which the Z-axis indicated the fluorescence intensity, using the R freeware program. The details are described in the Materials and Methods section. We chose the “rgl” package for making the scatter plot and the “WebGL” package for the construction of interactive images. Other packages, such as “scatterplot3D” and “animation,” could be used instead. We tested 3D modeling for the macrophage-specific EGFP zebrafish (Fig. 4). The output of a WebGL file is suitable for interactive 3D modeling (Supplementary Data).

Construction of a 3D fluorescence intensity model from the ZF-Mapper data.
Conclusion
We developed a fluorescence quantification program ZF-Mapper for zebrafish research. ZF-Mapper enables the batch analysis of fluorescence intensity for each position (X and Y) in fluorescent images of fish. Compared with ImageJ, ZF-Mapper has several advantages (Table 1) offering reproducible results for every researcher, which are suitable for phenotype-driven zebrafish screening. It is easy to use (image files can simply be dragged and dropped onto the ZF-Mapper icon), and the output data can be exported as general CSV files that are suitable for subsequent analyses, such as area-dependent analyses and the production of a 3D scatter plot. We further expect that ZF-Mapper will be modified by other researchers to create software for other applications, such as cell analysis.
Comparison Between ZF-Mapper and ImageJ
CSV, comma separated values.
Footnotes
Acknowledgments
This study was supported by KAKENHI. The authors thank Ms. Rie Ikeyama for her secretarial assistance and Ms. Masako Inoue for breeding zebrafish. We also thank Editage for English language editing.
Disclosure Statement
D.S. is an employee of RT Corporation, which is a robotics company. Y.N. is the CEO of RT Corporation. The other authors declare no conflict of interest directly relevant to the content of this article.
References
Supplementary Material
Please find the following supplemental material available below.
For Open Access articles published under a Creative Commons License, all supplemental material carries the same license as the article it is associated with.
For non-Open Access articles published, all supplemental material carries a non-exclusive license, and permission requests for re-use of supplemental material or any part of supplemental material shall be sent directly to the copyright owner as specified in the copyright notice associated with the article.