




Abstract
Stromal interaction molecules (STIMs) are endoplasmic reticulum-resident proteins that regulate Ca2+ homeostasis and signaling by store-operated calcium entry (SOCE). The different properties and functions of STIM1 and STIM2 have been described mostly based on work in vitro. STIM2 knockout mice do not survive until adulthood. Therefore, we generated and characterized stim2a and stim2b double-knockout zebrafish. The (stim2a;stim2b)−/− zebrafish did not have any apparent morphological phenotype. However, RNA sequencing revealed 1424 differentially expressed genes. One of the most upregulated genes was annexin A3a, which is a marker of activated microglia. This corresponded well to an increase in Neutral Red staining in the in vivo imaging of the (stim2a;stim2b)−/− zebrafish brain. The lack of Stim2 decreased zebrafish survival under low oxygen conditions. Behavioral tests, such as the visual-motor response test and dark-light preference test, indicated that (stim2a;stim2b)−/− larvae might have problems with vision. This was consistent with the downregulation of many genes that are related to light perception. The periodic acid-Schiff staining of retina sections from adult zebrafish revealed alterations of the stratum pigmentosum, suggesting the involvement of a Stim2-dependent process in visual perception. Altogether, these data reveal new functions for Stim2 in the nervous system.
Introduction
Calcium ions (
Upon calcium store depletion, STIM1 oligomerizes and translocates toward the plasma membrane, where it activates Orais.9–11 STIMs also interact with other channels, including transient receptor potential channel 3 (TRPC3),12,13 α-amino-3-hydroxy-5-methyl-4-isoxazolepropionic acid receptors, 14 and N-methyl-D-aspartate receptors (NMDARs), 15 and inhibit voltage-gated Ca2+ channels (VGCCs). 16 Our group was one of the first to prove the existence of a SOCE-like process in neurons, which was based on STIM-Orai interactions.17,18
STIM and Orai proteins are expressed in the human, murine,18–22 and zebrafish 23 brains. STIM2 is expressed at levels that are comparable to STIM1 in the human brain and is the major isoform in the murine central nervous system, especially in the hippocampus. 22 In the zebrafish brain, the dominant form is Stim2b. 23 Our group also demonstrated that both STIM proteins interact and form complexes with Orai in neurons, 17 providing evidence of interactions between endogenous STIM1 and endogenous Orai. 24 We also showed that in rat cortical neurons, STIM2, but not STIM1, senses and reacts to a small decrease in Ca2+ levels in the ER. 17
Mammalian cells and mice were used to identify the role of STIMs in the nervous system, in which one or both Stim genes were inactivated. Stim2 knockout mice survive only a few weeks after birth 25 and exhibit pronounced cognitive deficits. 26 However, Stim2−/− mice were notably protected from neurological damage in a model of focal cerebral ischemia. 26 Stim2 downregulation appeared to be protective against traumatic brain injury (TBI) in a murine model 27 and during glutamate stimulation-induced excitotoxicity, 28 a notable feature of TBI. Stim2 protein levels dramatically decreased in the hippocampus in presenilin-1-M146V knock-in mice, a model of familial Alzheimer's disease (fAD), and in cortical samples from sporadic AD (sAD) patients. 29
Because of early lethality in Stim2 knockout mice, it is difficult to investigate their behavior. The use of zebrafish (Danio rerio) with the knockout of stim2a or stim2b was not lethal, representing a valid alternative animal model. Although zebrafish are evolutionarily distant from humans, more than 70% of human genes have at least one zebrafish ortholog. 30 Zebrafish are often used as a model organism to study human diseases31–34 because of the ease of genetic manipulation in various transgenic lines, their transparent body, and their external development, which allows in vivo observations at both the cellular and organismal levels. SOCE is essential for proper cytokinesis in zebrafish, and TRPC1 is present at the sides of the cleavage furrow. 35 However, the role of Stim2 in Ca2+ signaling in the zebrafish brain has not been explored.
Abnormal behavior, such as an increase in thigmotaxis and hyperactivity, has been observed in single stim2a−/− and stim2b−/− mutants.36,37 A significantly higher average oscillation frequency of neuronal Ca2+ levels was observed in vivo in stim2a−/− and stim2b−/− larvae, indicating an increase in neuronal activity. Bulk RNA sequencing (RNA-seq) revealed significant alterations of the expression of genes that encode transcription factors and proteins that are involved in Ca2+ signaling in neurons, including metabotropic glutamate receptors.
Altogether, findings from these two studies suggest that the hyperactive-like phenotype of stim2a−/− and stim2b−/− zebrafish is caused by the dysregulation of Ca2+ homeostasis and signaling. Thus, this study sought to complement our previous work with single stim2a−/− and stim2b−/− mutants to provide a more complete picture of the role of Stim2 in the brain. We conducted several behavioral tests, evaluated gene expression, and performed histological staining and found that behavioral changes in (stim2a;stim2b)−/− double-knockout zebrafish may in fact reflect deficits in visual perception. Bulk RNA-seq identified candidate genes that could be responsible for these changes. We found that the lack of both forms of Stim2 affects not only gene expression but also the structure of the retina and sensitivity to hypoxia.
Materials and Methods
Statement of ethics
All experiments with larvae and adult fish were conducted according to the European Communities Council Directive (63/2010/EEC). All animals were maintained according to internal regulations in the Zebrafish Core Facility, a licensed breeding and research facility (PL14656251, registry of the District Veterinary Inspectorate in Warsaw; 064 and 051, registry of the Ministry of Science and Higher Education) at the International Institute of Molecular and Cell Biology in Warsaw.
Animal husbandry
(stim2a;stim2b)−/− double-knockout and their (stim2a;stim2b)+/+ siblings or AB line (in case of behavioral experiments) were used in the study. The experimental animals were maintained in the Zebrafish Core Facility according to standard protocols. 38 A maximum of 24 adult fish were kept per tank (3.5 L volume) with a zebrafish recirculating system and regular photoperiod (14-h light/10-h dark cycle) at 28.5°C. For the experiments, zebrafish embryos were obtained by random mating. The collected embryos were sorted in E3 water (2.48 mM NaCl, 0.164 mM CaCl2·2H2O, 0.09 mM KCl, and 0.428 mM MgCl2·6H2O) at a density of ∼50 embryos/Petri dish (10 cm) and kept in an incubator under standard conditions (28.5°C and normal 14 h light/10-h dark cycle) until the stage of development was reached for specific experiments.
Generation and genotyping of (stim2a;stim2b)−/− mutant zebrafish line
To create the (stim2a;stim2b)−/− double-knockout zebrafish line, stim2a−/− fish were outcrossed with the stim2b−/− line.36,37 Briefly, both stim2a−/− and stim2b−/− lines were created using CRISPR/Cas9 techniques. The stim2a−/− zebrafish line was created by introducing a 5 bp deletion in the 7th exon (Ensembl ID: ENSDART00000114097.4), which gives an early stop codon. The stim2b−/− zebrafish line was created by introducing a 4 nt insertion in exon 3 of stim2b (Ensembl ID: ENDART00000012089). Heterozygous fish of this F1 generation were then in-crossed. To identify homozygous (stim2a;stim2b)−/− fish in the F2 generation, stim2b−/− genotyping was first performed according to a previously set-up protocol using high-resolution melting (HRM) analysis. 37 From this HRM analysis, (stim2a;stim2b)+/+ and stim2b−/− fish were screened according to a previously set-up protocol for stim2a−/− fish. 36 (stim2a;stim2b)+/+ and (stim2a;stim2b)−/− fish were identified from this screening.
Behavioral experiments
The behavioral experiments were performed according to previously established protocols37,39–41 on 4 days postfertilization (dpf) larvae using the ZebraBox high-throughput monitoring system (ViewPoint) and EthoVision XT software (Noldus). Data from larvae that were inactive during the entire recording period (total distance <10 mm) were excluded from the analyses. For the open-field test, zebrafish larvae were transferred to a 12-well plate.
The test duration was 15 min, and the following parameters were analyzed: total distance travelled in either the border or central zones of the wells, 39 velocity, duration of movements in each area, and duration of immobility in each area. During the data analysis, a 15-min recording period was divided into three 5-min periods. A total of 32 (stim2a;stim2b)+/+ and 33 (stim2a;stim2b)−/− larvae were used. For the dark/light preference test, a 10-cm Petri dish was used, in which half of the dish was covered with a photographic filter. The sidewall of the Petri dish was covered with black vinyl tape to block light from any other source. Locomotor activity was recorded for 15 min.
To assess phototaxis, the mean total distance travelled and time spent in each part were calculated. The responses of larvae were divided according to the time spent in the light part: phototaxis >70%, scototaxis <30%, or no preference. A total of 10 (stim2a;stim2b)+/+ and 8 (stim2a;stim2b)−/− larvae were used in this test. The visual-motor response test was performed as described previously. 42 The larvae were placed in 24-well plates and acclimatized in the environment before the experiment. This test consisted of three phases that consisted of the following changes in lighting conditions: baseline (0–10 min, 0% light intensity), light (10–20 min, 70% light intensity [980 lux]), and dark (20–30 min, 0% light intensity). The mean total distance travelled (in millimeters) was analyzed independently for each of these phases. A total 36 (stim2a;stim2b)+/+ and 36 (stim2a;stim2b)−/− larvae were used in this test.
Quantitative real-time polymerase chain reaction gene expression analysis
A total of 15 zebrafish larvae (5 dpf) were pooled together to make one sample. The larvae were transferred to Qiazol (Qiagen, Hilden, Germany), and RNA was isolated as described previously. 43 Using the iScript cDNA Synthesis Kit (Bio-Rad, Hercules, CA, USA), RNA was converted into cDNA. Using FastStart Essential DNA Green Master (Roche; catalog No. 06402712001), quantitative polymerase chain reaction (qPCR) was performed in duplicate. SOCE gene expression was checked as previously described. 37 For the gene expression analysis, the CFX Connect real-time PCR (RT-PCR) Detection System (Bio-Rad) was used. The primer sequences that were used are shown in Table 1.
List of Primers Used in the Experiments
apoEb, apolipoprotein Eb; atg5, ATG5 autophagy related 5 homolog; atg7, ATG7 autophagy related 7 homolog; ikbkb, inhibitor of nuclear factor κB kinase subunit β; il1b, interleukin 1β; lgals3b, galectin 3 binding protein, tandem duplicate 1; tp53, tumor protein p53.
Bulk RNA sequencing
Total RNA was isolated for RNA-seq using the same protocol as for RNA isolation for the qPCR gene expression analysis. Thirty larvae were pooled together to comprise one RNA sample. The quality of RNA was checked by measuring absorbance at 260, 280, and 230 nm, and Bioanalyzer Nano RNA chip (Agilent, USA) analysis. Samples with 260/280 nm and 230/280 nm absorbance ratio >1.8 and RNA integrity number values >8 were used for further processing. 44 Total RNA was first digested by DNase I and purified using the RNA Clean and Concentrator Kit (ZYMO Research, Irvine, CA, USA) according to the manufacturer's recommendations.
Sequencing was then performed using the Illumina sequencing platform. The preparation of cDNA libraries and sequencing using next-generation sequencing (NGS NextSeq 500) were performed in cooperation with the Core Facility at the International Institute of Molecular and Cell Biology in Warsaw. The following sequencing parameters were applied: paired-end sequencing run type, 1 × 76 bp read length. This allowed ∼120–150 million reads per sample with a 76 bp length.
Transcriptome analysis
Raw RNA-seq data were converted to FASTQ format with bcl2fastq2 (version 2.17, Illumina), and FastQC (version 0.11.4; https://www.bioinformatics.babraham.ac.uk/projects/fastqc) was used to assess the quality of each sequencing run. The FASTQ files were deposited in the Sequence Read Archive (accession No. GSE219273). We then utilized the SQuIRE pipeline 45 for subsequent steps. Zebrafish genome danRer11 and the corresponding Ensembl-track gene and transcript annotations were downloaded from the University of California, Santa Cruz (https://genome.ucsc.edu/). 46 STAR version 2.5.3a, 47 StringTie version 1.3.3b, 48 and DESeq2 version 1.16.1 49 were used within the SQuIRE pipeline for read alignment, transcript assembly, and quantification for each replicate, and differential gene expression analysis between (stim2a;stim2b)−/− and (stim2a;stim2b)+/+ samples, respectively.
We used the principal component analysis (PCA) method from the scikit-learn library 50 for the PCA of gene expression data (transcripts per kilobase million) from all six replicates of the two conditions. We performed functional enrichment analysis separately for significantly upregulated and downregulated genes using gProfiler 51 in “ordered query” (by log2FoldChange and/or adjusted p-values) mode.
Hypoxia treatment and in vivo staining
E3 water where fish were kept in aquaria was treated with nitrogen to decrease the level of soluble oxygen from 8 to 1 mg/L. The concentration of dissolved oxygen was monitored using ProODO Optical Dissolved Oxygen Instrument. Next, 4 dpf larvae were transferred to containers that contained 20 mL of low oxygen E3 water and were tightly closed with parafilm and placed in an argon environment to maintain low oxygen conditions. After 12.5 h, the larvae were transferred to fresh normoxic E3 water, and the survival rate was calculated. After the next 15 h in normoxic E3 water, surviving larvae were collected and subjected to in vivo Acridine Orange (AO) staining and total RNA isolation for qPCR analysis.
Neutral Red (Sigma-Aldrich, St. Louis, MO, USA; catalog No. N7005) was prepared as a 2.5 mg/mL solution in water. Acridine Orange (Sigma-Aldrich; catalog No. A8097) was prepared as a 10 mg/mL stock solution. Neutral Red or AO (each at 1:1000 dilution) was added directly to the plates with live 5-day-old zebrafish larvae. After 1 h of incubation at 28°C in the dark, the medium was exchanged to fresh E3 three times over 15 min. The in vivo imaging of positive signals in the zebrafish brain was performed using a Zeiss Lightsheet Z.1 microscope (Zeiss, Germany; 20 × objective, numerical aperture = 1.0) and processed using ZEN software followed by analysis of fluorescence spots using Imaris Software.
Histology
Histological staining was performed according to a previous study. 34 Briefly, adult zebrafish were fixed in neutral buffered 4% formaldehyde solution (Sigma-Aldrich; catalog No. 47608-250ML-F), dehydrated in ethylene, and embedded in paraffin. Longitudinal and transverse 6 μm sections were cut using a Leica microtome (RM2265; Leica, Bensheim, Germany) and stained with standard hematoxylin and eosin. For glycogen, lipofuscin, and mucopolysaccharides, combined Alcian blue (AB) and periodic acid-Schiff (PAS) reactions were performed according to the manufacturer's instructions (Sigma-Aldrich). The microscopic analysis was performed using NIS Elements software and Nikon Ni-E with NIS Elements software.
Statistical analysis
Logarithmic (log2) fold changes were analyzed for the RNA-seq data. The RNA-seq data are expressed as the mean ± SEM if the log2-fold change was >2 and less than −2. The false discovery rate was used to estimate the statistical significance of gene expression using RNA-seq.
The analysis output from EthoVision was exported to Microsoft Excel files and analyzed using R 3.6.0 software. The data distribution was checked using the Shapiro-Wilk normality test. Data from the behavioral experiments were analyzed using paired or unpaired Wilcoxon rank-sum tests for comparisons between groups and the paired t-test for comparisons within groups. Two-way analysis of variance followed by the Tukey Honestly Significant post hoc test was used for comparisons of activity of larvae under different light conditions in the visual-motor response test. Adjusted values of p < 0.05 were considered statistically significant. The data are expressed as medians with Q1 and Q3 quartiles using box plots, and dots represent individual data points. The number of fish that were used in each experiment is indicated in the figure legends.
Results
General characterization of (stim2a;stim2b)−/− double-knockout zebrafish
To create (stim2a;stim2b)−/− double-knockout zebrafish, we crossed previously characterized stim2a−/− and stim2b−/− fish.36,37 Heterozygous fish of the F1 generation were in-crossed. To identify homozygous (stim2a;stim2b)−/− fish in the F2 generation, genotyping was first performed according to a previous protocol using HRM analysis to detect stim2b mutants and restrictive digestion to detect stim2a mutants. The presence of mutations in stim2a and stim2b was confirmed using Sanger sequencing and HRM (Supplementary Fig. S1). The genotype distribution was not different from the expected Mendelian distribution (data not shown). Adult (stim2;stim2b)−/− mutants were kept for 18 months and had similar morphology as (stim2a;stim2b)+/+ fish (Fig. 1A).
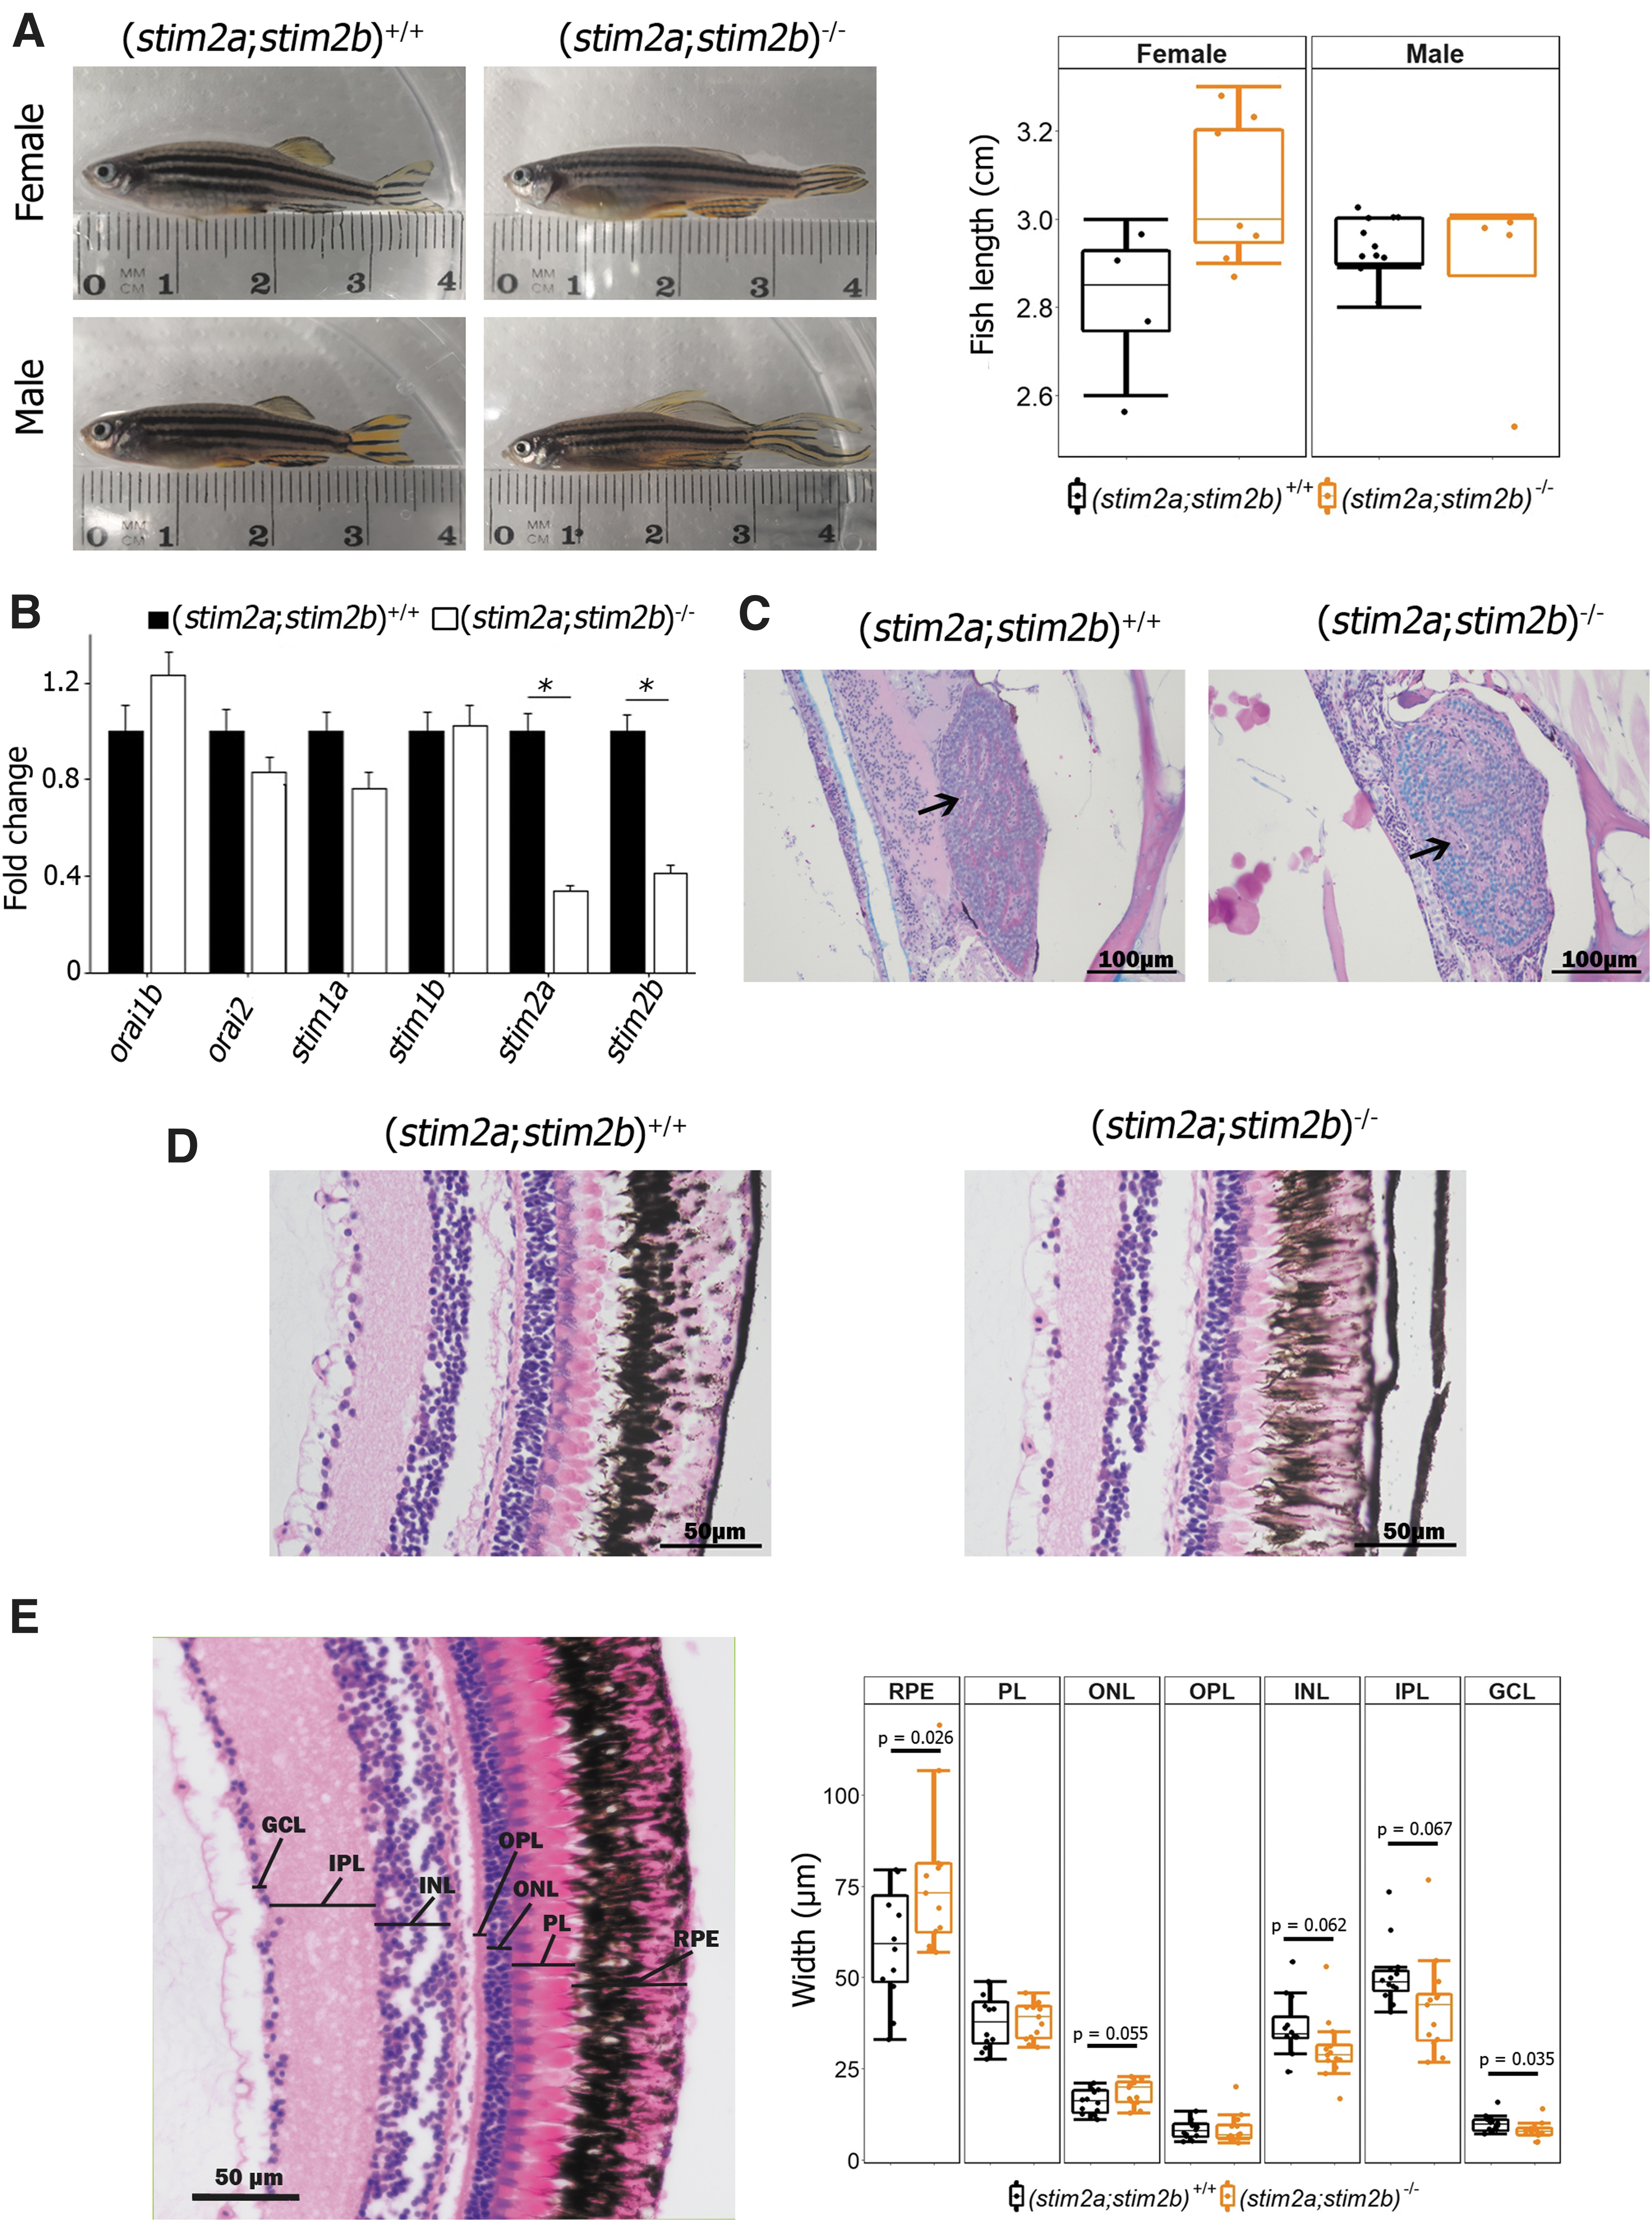
Characterization of (stim2a;stim2b)−/− zebrafish line.
Quantitative RT-PCR was performed to estimate expression levels of transcripts of SOCE components in (stim2a;stim2b)−/− fish. As expected, mRNA expression of the stim2a and stim2b genes was significantly downregulated (Fig. 1B). The histopathological analysis of adult (stim2a;stim2b)−/− fish showed no change in the brain (Supplementary Fig. S2A), but revealed abnormalities in other organs. The most noticeable abnormality was the low affinity of PAS in mutant hepatocytes and corpuscles of Stanius. The reduction of PAS staining in the liver suggested a decrease in the amount of glycogen (Supplementary Fig. S2B).
Corpuscles of Stannius in the kidneys, which are involved in Ca2+ regulation in fish, 52 exhibited disturbances in the sinusoid system and different affinity for AB and PAS (Fig. 1C) dyes, and the intensity of these changes varied individually. Furthermore, the pigmented epithelium layer of the retina in (stim2a;stim2b)−/− larvae had lower melanin content compared with (stim2a;stim2b)+/+ fish (Fig. 1D). To evaluate the change in width of retina layers, the images of adult (stim2a;stim2b)+/+ and (stim2a;stim2b)−/− fish retina sections were used.
The average width of the retinal pigmented epithelium (RPE) was significantly higher in mutants than in (stim2a;stim2b)+/+ adult fish. A similar trend was observed for the outer nuclear layer. On the other hand, ganglion cell layer (GCL) was thinner in (stim2a;stim2b)−/− fish (Fig. 1E). In addition, the same tendency was observed for inner nuclear layer and inner plexiform layer. No significant change in the width of retina layers was detected at the larval stage, but a tendency for thinner GCL in mutants was also detected (Supplementary Fig. S3).
Differential gene expression between (stim2a;stim2b)+/+ and (stim2a;stim2b)−/− double-knockout zebrafish established by next-generation RNA-seq
To gain broader insights into molecular changes that are caused by simultaneous stim2a and stim2b deletion, we searched for differentially expressed genes between (stim2a;stim2b)+/+ and (stim2a;stim2b)−/− 5 dpf larvae using RNA-seq. PCA revealed differences between (stim2a;stim2b)+/+ and (stim2a;stim2b)−/− samples (Fig. 2A), and 1424 genes were found to be differentially expressed in (stim2a;stim2b)−/− fish with at least a twofold change, suggesting that the lack of Stim2 has an effect on gene expression (Fig. 2B). The gene ontology analysis showed the downregulation of genes that are involved in several biological processes, mostly related to neurotransmission (Fig. 2C).

Differential gene expression established by RNA-sequencing analysis.
We identified the downregulation of genes that encode VGCCs and glutamatergic NMDA receptor and γ-aminobutyric acid (GABA)ergic receptor subunits. Interestingly, genes that are related to the sensory perception of light stimuli (Fig. 2C) were also downregulated in the mutants, including genes that encode β crystallins (crybb1, crybb1l1, and cryba1b), which are structural proteins involved in development and maintenance of the transparent lens, 53 and genes that are involved in phototransduction, such as opsins (opn4, opn4.1, opn4a, rgra, rgrb, rho, and rhol), rhodopsin kinase (grk1a), phosphodiesterase (pde6ha), cyclic guanosine monophosphate (cGMP)-gated cation channels (cnga1b, cngb1a, cngb1b, and cngb3.2), and metabotropic glutamate receptor 6 (grm6b).
Transcripts for several adhesion molecules that are responsible for maintaining the retina structure (pcdh15b, prph2b, rom1a, and rom1b) were also downregulated. Moreover, a transcription factor that is involved in eye development (crx) was downregulated (Fig. 2D). We did not identify the significant enrichment of any biological process that upregulated genes would be involved in. However, we identified annexin A3a, a microglial marker that belongs to several signaling pathways, as one of the most upregulated genes (Fig. 2B).
A similar upregulation of annexin A3a was observed in stim2a−/− and stim2b−/− single mutant zebrafish. Two other markers of microglia poised for inflammasome activation (fads2 and alox5ap), and three genes that encode NOD-like receptor proteins and NACHT-LRR-PYD-containing proteins, which are associated with inflammasome activation (nlrc6, nlrp16,and nlrc3l1), were significantly upregulated in (stim2a;stim2b)−/− zebrafish, whereas nlrc3l was moderately downregulated (Fig. 2D and Supplementary Fig. S4). The increase in annexin A3a expression corresponded to an increase in in vivo Neutral Red staining in the (stim2a;stim2b)−/− brain (Fig. 2E, F); however, more definitive experiment is needed to confirm the microglial character of observed phenomenon.
Differential effect of hypoxia on (stim2a;stim2b)+/+ and (stim2a;stim2b)−/− larvae
We investigated whether the previously reported resistance of Stim2 knockout mice to focal cerebral ischemia 26 can also be observed in (stim2a;stim2b)−/− mutants. We compared the survival of (stim2a;stim2b)+/+ and (stim2a;stim2b)−/− larvae in response to hypoxia and analyzed the number of brain cells that was stained with AO, an indicator of cell death. As shown in Figure 3A, the survival of (stim2a;stim2b)−/− larvae under hypoxic conditions was 49%, whereas the survival of (stim2a;stim2b)+/+ was 71%. Thus, the lack of Stim2 decreased the survival of larvae under low oxygen conditions.

Effect of hypoxia on survival, cell death, and gene expression in (stim2a;stim2b)+/+ and (stim2a;stim2b)−/− larvae.
The analysis of AO staining in vivo revealed that the number of AO-positive cells in the optic tectum (OT) was similar in both fish groups before hypoxia (Fig. 3B). After hypoxia, a significant increase in the number of AO-positive cells was observed in the OT in (stim2a;stim2b)+/+ larvae, whereas no such increase was observed in (stim2a;stim2b)−/− larvae. The number of apoptotic cells in the brain in hypoxic (stim2a;stim2b)+/+ fish was much higher than in the brain in the hypoxic mutant. Thus, hypoxia caused less cell death in the OT in the (stim2a;stim2b)−/− mutants than the (stim2a;stim2b)+/+ larvae.
Next, expression levels of selected genes that are related to cell death pathways were estimated by qPCR in the whole body in both groups of larvae. The expression of some of these genes varied between (stim2a;stim2b)+/+ and (stim2a;stim2b)−/− mutants, and some were affected by hypoxia. We did not observe significant changes in the expression of ATG5 autophagy related 5 homolog and ATG7 autophagy related 7 homolog. The expression of inhibitor of nuclear factor κB kinase subunit β (ikbkb) showed a trend to be increased by hypoxia in (stim2a;stim2b)+/+, but not in the mutant.
The ikbkb gene also had a tendency to be expressed at higher levels in the mutant than in (stim2a;stim2b)+/+ fish without treatment. Mutants showed also a tendency of decreased interleukin 1β without treatment, while hypoxia significantly increased its mRNA level, but only in (stim2a;stim2b)−/− larvae. In contrast, tumor protein p53 tends to be downregulated in untreated mutants, and hypoxia resulted in a tendency of decreased p53 expression in (stim2a;stim2b)+/+, but did not have an effect on the mutant (Fig. 3C).
Among the tested genes we analyzed the expression of galectin 3 binding protein, tandem duplicate 1 (lgals3bp), and apolipoprotein Eb (apoEb), which are microglial markers. We observed that lgals3bp levels of expression were significantly increased by hypoxia in the mutant, but did not have any effect on its expression in (stim2a;stim2b)+/+ fish (Fig. 3D). The apoEb gene expression has very low abundance in general and did not show any significant change.
Further studies are needed to clarify how the absence of Stim2a and Stim2b affects the response to stress conditions such as hypoxia.
(stim2a;stim2b)−/− knockout zebrafish exhibit deficits in visual perception
Next, we investigated whether the observed changes in gene expression result in abnormal behavior in the mutants. We first evaluated locomotor activity in (stim2a;stim2b)−/− larvae and found that they travelled very similar distances as the (stim2a;stim2b)+/+ (Fig. 4A). Other parameters, such as velocity, movement duration, and rapid movement duration, were unchanged between groups. However, the difference was apparent when zone preference was analyzed 37 (Fig. 4B–D).
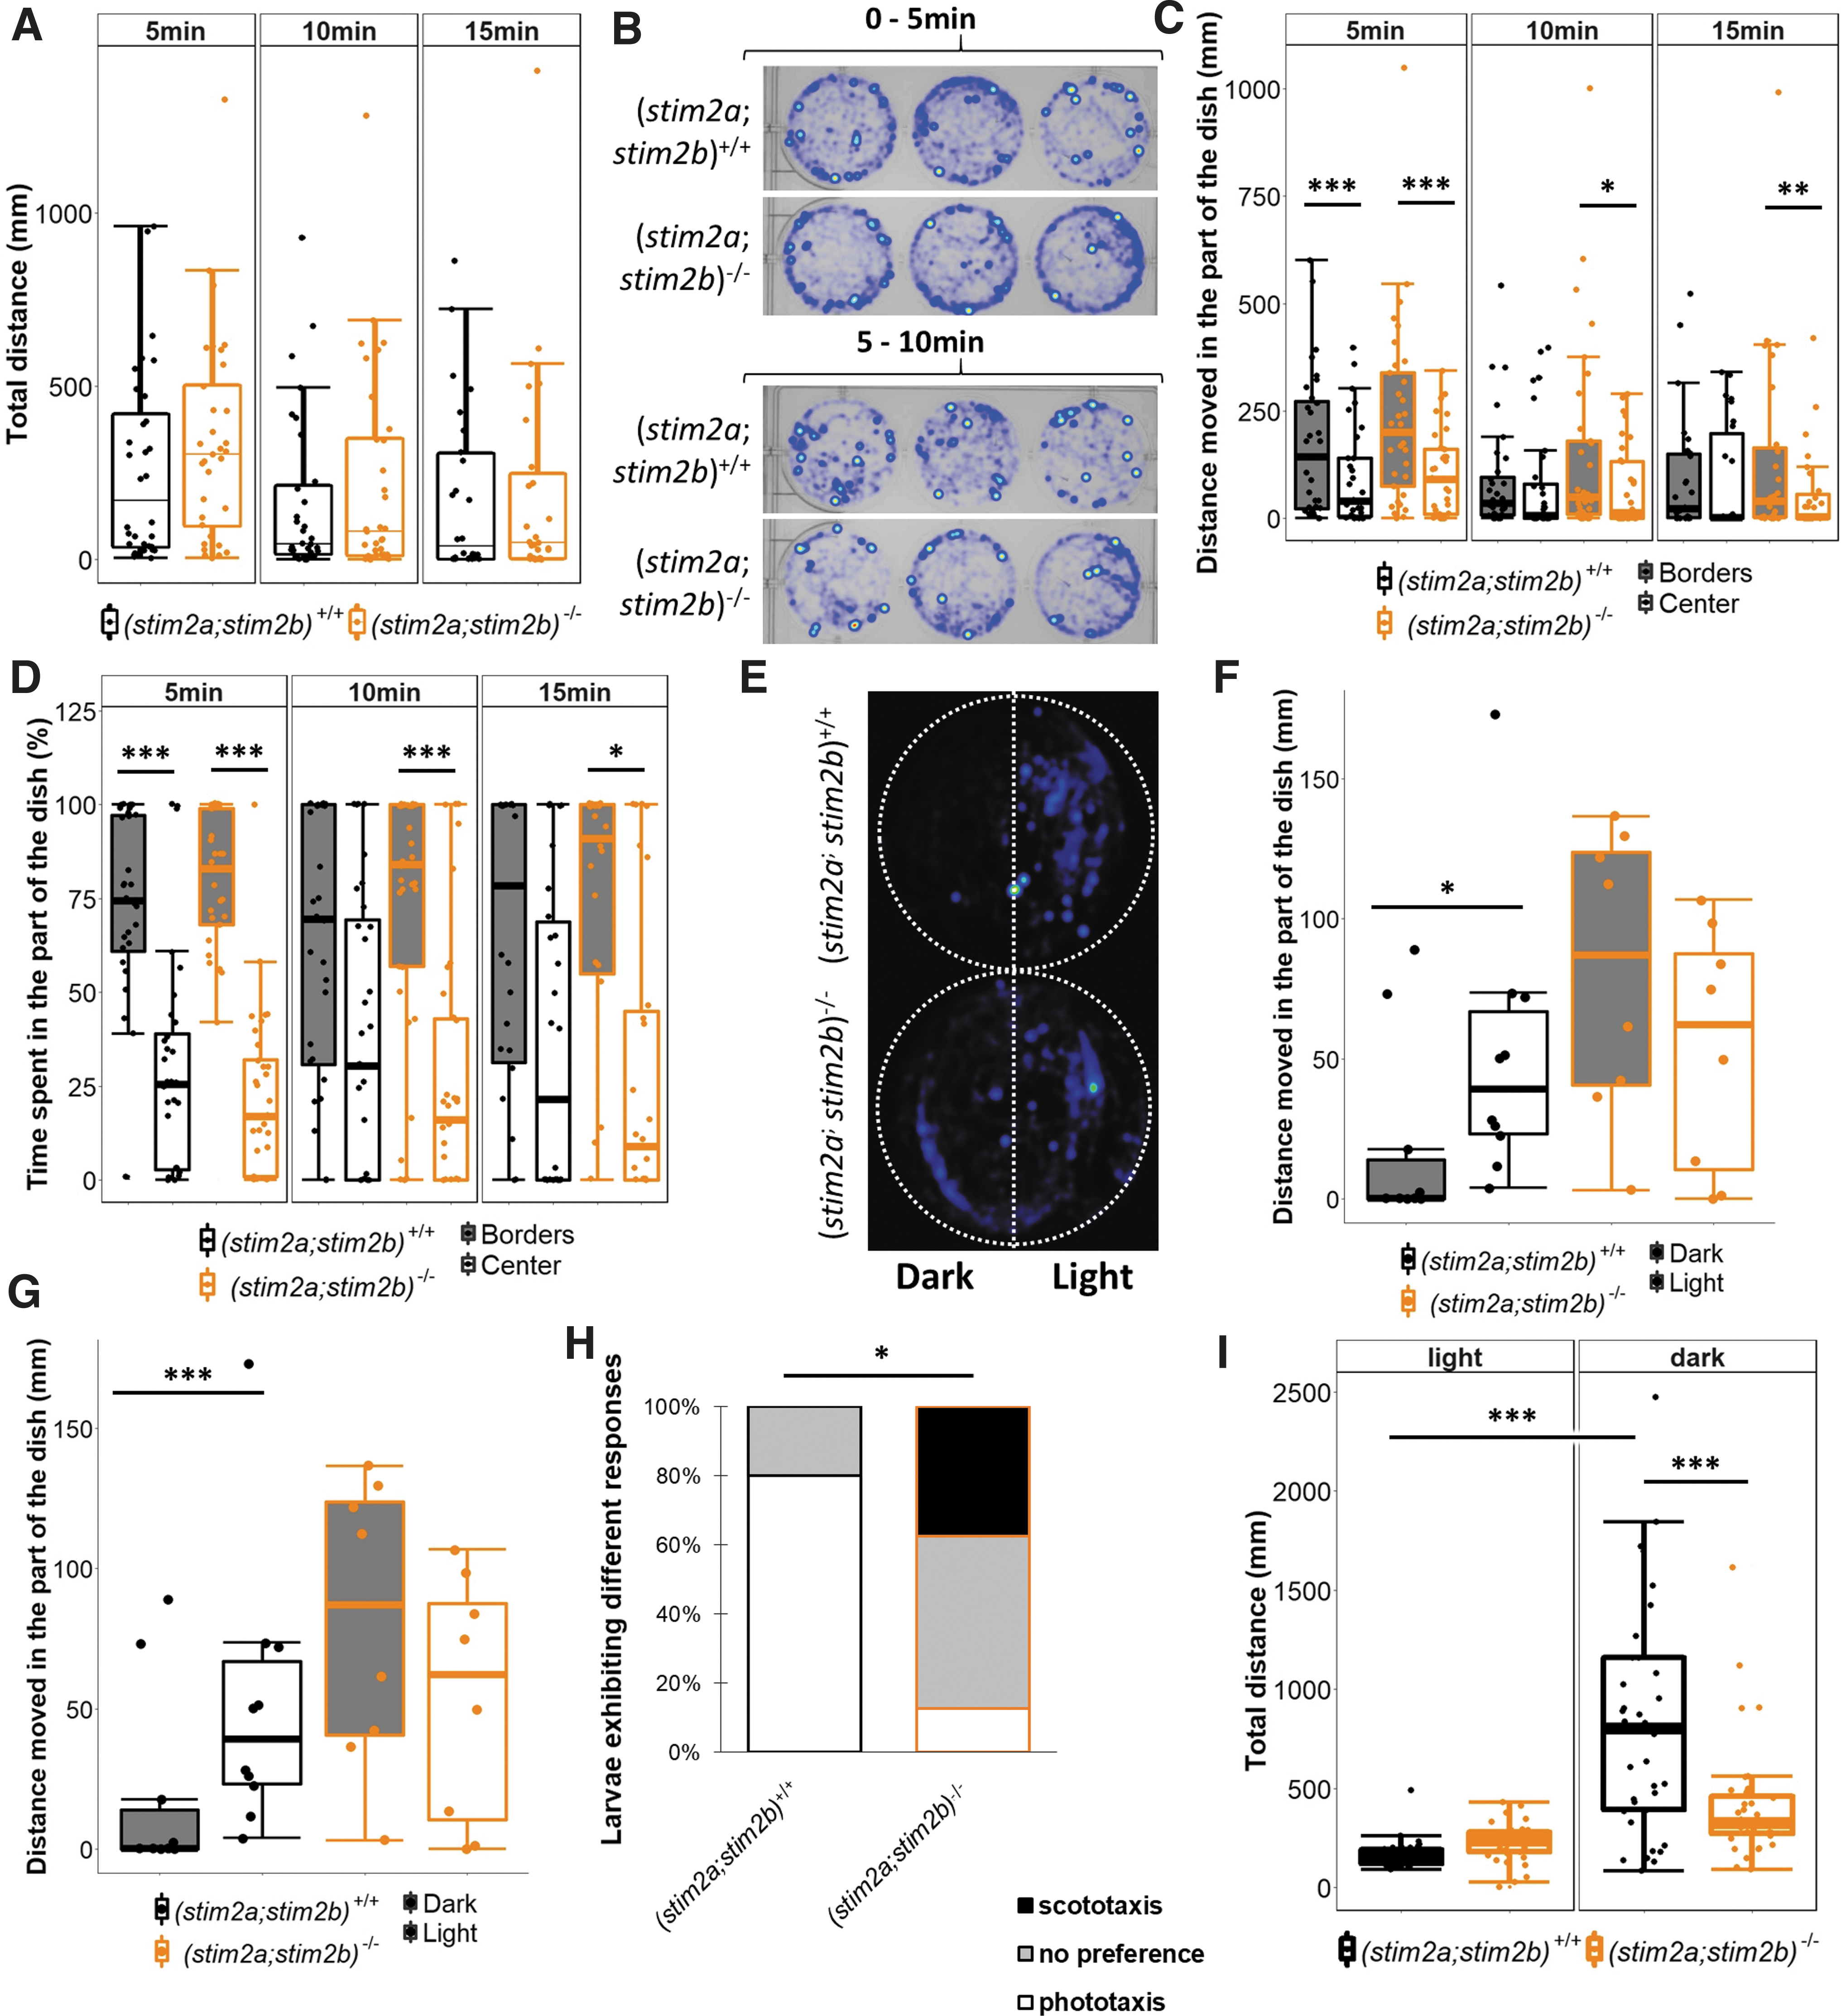
Mobility and thigmotaxis in (stim2a;stim2b)+/+ and (stim2a;stim2b)−/− 4 dpf larvae in the open-field test.
During the first 5 min, considered an acclimatization period, both (stim2a;stim2b)+/+ and (stim2a;stim2b)−/− larvae spent most of the time in proximity to the borders of the well, indicating similar thigmotactic behavior. However, although the mutants did not alter their swimming pattern during the next 5 min, the (stim2a;stim2b)+/+ began to spend more time in the central areas. In contrast, even during the subsequent 5 min (10–15-min period), the mutant fish did not explore the center of the well, in contrast to (stim2a;stim2b)+/+ larvae. This could indicate an increase in anxiety-like behavior in (stim2a;stim2b)−/− larvae, whereas their locomotor abilities were unchanged.
Apart from thigmotaxis, phototaxis is considered anxiety-related behavior in zebrafish larvae. To test phototaxis, we analyzed light preference in (stim2a;stim2b)−/− larvae as previously described.36,37,54 As expected, (stim2a;stim2b)+/+ larvae preferred to stay in the light part, covering a longer distance (Fig. 4E, F), and spent significantly more time in the light part than in the dark part of the dish (Fig. 4G).
In contrast, (stim2a;stim2b)−/− larvae did not avoid the dark part and covered a similar distance in the light part (Fig. 4E–G). Thus, although (stim2a;stim2b)+/+ fish exhibit clear phototaxis, (stim2a;stim2b)−/− larvae had either no preference or exhibited the opposite preference, namely scototaxis (Fig. 4H). These results do not support an increase in anxiety-like behavior as was suggested by the open-field results. In contrast, a disruption of phototaxis may be explained by problems with vision. This possibility is supported by the abnormal retina in the mutant and changes in the expression of genes that are related to visual perception.
To further test light perception in (stim2a;stim2b)−/− fish, we next analyzed the visual-motor response. Sudden changes in light evoke a startle response in zebrafish larvae, followed by long-lasting variations of motor activity. 42 When the light was turned on, (stim2a;stim2b)+/+ fish reacted with a startle response, followed by a decrease in mobility, and they exhibited an increase in mobility when the light was turned off (Fig. 4I). However, the behavior of (stim2a;stim2b)−/− larvae was different, in which they did not exhibit an increase in mobility after the light was turned off. In the dark, the mutants travelled a significantly shorter distance than (stim2a;stim2b)+/+ larvae. Altogether, these data indicate that the mutant fish had visual deficits.
Discussion
This study was a continuation of research on the role of Stim2. Our earlier work showed that Stim2 has a different function than Stim1. 17 We and others showed that STIMs participate in several pathologies. For example, we observed the disruption of SOCE and a reduction of STIM2, but not STIM1 levels in lymphocytes from patients with fAD. 55 We also described features of dysregulated SOCE in fresh lymphocytes from people with mild cognitive impairment and sAD. 56 Consistent with these observations, protein levels of STIM2 were significantly reduced in the hippocampus in presenilin-1-M146V KI mice, a model of fAD, and in cortical samples from sAD patients. 29 Moreover, changes in STIM2 expression in these mice correlated with morphological changes in dendritic spines, which depended on calmodulin-dependent kinase II. STIM2 overexpression may rescue these changes. 29 These observations implicate STIM2 as an important player in learning processes and the proper formation of neuronal networks.57,58
Despite these findings, however, the role of STIM2 in vivo is far from being understood. Stim2 knockout mice survive only a few weeks after birth.25,26 Thus, it is not possible to investigate long-term effects of systemic STIM2 knockout in rodents. Such animal models as zebrafish, which do not experience premature death and have rapid development, represent a valid alternative. There are two stim2 genes in zebrafish (stim2a and stim2b). According to the National Center for Biotechnology database, the Stim2b isoform shares 60% homology with the human STIM2 protein, and Stim2a shares 57% homology. Using a CRISPR/Cas9 genome editing system and subsequent breeding, we knocked out both the stim2a and stim2b genes in zebrafish to generate the (stim2a;stim2b)−/− line. These fish were fertile and could be analyzed at both the larval and adult stages. In this study, we compared selected features of mutant and (stim2a;stim2b)+/+ larvae and adult fish.
Stim2−/− mice exhibit cognitive impairment, 26 and Stim2 was shown to participate in the regulation of synaptic transmission and formation of dendritic spines.57,59 However, when STIM2 knockout is restricted to forebrain neurons, no alteration of spatial memory is observed in these animals, 59 but synaptic plasticity, including both long-term potentiation and long-term depression processes, is disturbed. 57 Our transcriptomic analysis also showed that the lack of Stim2 affected the expression of genes that are involved in neurotransmission and synapse assembly. For example, we found the downregulation of genes that encode NMDAR2 subunits, which are known to play a central role in synaptic plasticity 60 and were shown to interact with STIM2 in rat cortical neurons. 15
We also found the downregulation of several genes that encode VGCCs and GABAergic receptor subunits. Moreover, we detected the significant downregulation of npas4, which encodes an early-response transcription factor in both excitatory and inhibitory neurons.61,62 Interestingly, the expression of this transcription factor was shown to be regulated by Ca2+ ions.63–65 Thus, Stim2 may participate in the regulation of neurotransmission by affecting the expression of synapse components.
Neurons from Stim2−/− mice exhibit a significant increase in survival under hypoxic 26 and oxidative stress 27 conditions. In this study, in vivo AO staining was used to identify cells that died as a result of hypoxia. In the knockout zebrafish brain, we detected fewer AO-positive cells, indicating that the lack of Stim2 made the cells more resistant to death under hypoxic conditions. This is consistent with a previous study. 26 However, the survival rate of (stim2a;stim2b)−/− fish was reduced under hypoxic conditions. This may indicate that an increase in mortality in larvae without Stim2 is attributable to changes in organs other than the brain, especially the liver, kidney, and thyroid glands.
The most noticeable change in all these organs was the loss of PAS affinity. This reagent is commonly used as a glycoprotein marker, separately or in combination with the mucopolysaccharide dye AB. The observed decrease in affinity was likely the result of losing glycoproteins in the investigated tissue. The observed disruption of glycoproteins in different tissues and organs suggests that Stim2 not only affects molecular processes but also results in visible morphological alterations. In hepatocytes, glycogen plays a pivotal role in creating reserve material for energy transformation. The decrease in glycogen deposition may be the effect of glycogen synthase, which is regulated by Ca2+. 66
The analyses of mobility, thigmotaxis, visual-motor responses, and light preference indicated that (stim2a;stim2b)−/− larvae exhibit an increase in anxiety-like behavior, vision problems, or both. For example, (stim2a;stim2b)+/+ fish exhibited clear phototaxis, whereas the double knockouts exhibited either no preference or partial scototaxis. The mutants did not exhibit proper visual-motor responses, in which they did not exhibit an increase in mobility after switching the light off.
Consistent with these observations, the staining of eye sections indicated that the lack of Stim2 affected the structure of the retina. We observed changes in the width of RPE and GCLs, as well as a lower amount of melanin in retinal pigment epithelial cells. Melanin in these cells plays a protective role by absorbing excess light and preventing retina damage. 67 High Ca2+ levels were reported in these cells, and melanosomes appear to enable the storage of these ions. 68 Moreover, RNA-seq identified the differential expression of several genes that are related to eye structure, such as crystallins, and transcription factors that are involved in eye development. Notably, some murine Stim2 knockouts exhibit alterations of the vision system (http://www.informatics.jax.org/marker/phenotypes/MGI:2151156), including cataracts, which is linked with mutations of genes that encode crystallins. 69
To our knowledge, the potential role of Stim2 in vision processes has not been previously investigated, but the role of Ca2+ signaling is indispensable. An increase in intracellular Ca2+ levels was observed in lenses with cataracts, and SOCE was detected in lens epithelial cells 70 and retinal pigment epithelial cells, 71 where it is involved in cell proliferation and migration. 72 Proteins that participate in phototransduction, such as opsins, rhodopsin kinases, phosphodiesterase 6, and cGMP-activated cation channels, appeared to be downregulated in (stim2a;stim2b)−/− fish. Chronic increases or decreases in intracellular Ca2+ levels may result in photoreceptor cell death and retinal diseases,73–75 which may result in the infiltration of activated microglia.
We detected an increase in expression of the microglial marker anxa3a in (stim2a;stim2b)−/− fish. The higher expression of anxa3a, a marker of activated microglia, may underlie the observed behavioral vision problems and changes in retinal histological structure. These cells are resident tissue macrophages, and their role is to confer neuronal protection. Their greater number in knockout fish might explain the higher resistance of brain cells to hypoxia.
We previously showed that annexin A3 is a positive SOCE modulator that increases SOCE amplitude and potentiates Ca2+ release-activated Ca2+ currents. 76 Others have shown that SOCE blockers or the ablation of SOCE components (e.g., STIM1, STIM2, and Orai1) decrease microglia migration and phagocytosis. 77 We suggest that (stim2a;stim2b)−/− fish are a powerful new animal model to study the role of Stim2 in microglia-related processes. This is particularly interesting when considering the observed changes in visual perception. Microglia are key players in the healthy and diseased retina (reviewed in Rashid et al. 78 ), and their activation is considered a hallmark of many retinal diseases (reviewed in Rathnasamy et al. 79 ).
Conclusion
These data revealed potential new functions of Stim2, including actions on retina structure that affects vision, anxiety, and cellular sensitivity to hypoxia. Thus, our model raises the possibility of studying Stim2-dependent changes in microglia activity in visual perception and anxiety-related behaviors and its mechanisms of neuroprotection.
Footnotes
Acknowledgments
The authors acknowledge that some hypoxia data were included in the master thesis of D.B. (MSc Eng. in chemistry granted by Warsaw University of Technology on January 10, 2023, available online in Polish: https://apd.usos.pw.edu.pl/diplomas/51402/), and that in doctoral dissertation of R.K.G. (PhD in medical and health sciences granted by Medical University of Warsaw on January 19, 2022, available online in English:  ), the generation and genotyping of (stim2a;stim2b)−/− mutant zebrafish line and differential gene expression of SOCE proteins were described. We thank Dr. Tomasz Węgierski, head of the Microscopy and Cytometry Facility at the International Institute of Molecular and Cell Biology in Warsaw (IIMCB), for his help in establishing the method for AO staining analysis. Ms. Dominika Dubicka for administrative support, Katarzyna Misztal for running the sequencing experiments, the personnel at the Zebrafish Core Facility at the IIMCB for the maintenance of the fish lines, and Michael Arends for editing the article.
Authors' Contributions
Conceptualization; methodology; software; formal analysis; investigation; resources, J.K.; data curation, L.M., R.K.G., S.S.M., D.A.U., S.B., C.L.W., and I.W.; writing-original draft preparation, L.M., J.K., I.W., and R.K.G.; writing-review and editing, L.M., J.K., I.W., R.K.G., D.A.U., S.B., and S.S.M.; visualization, L.M., I.W., D.A.U., R.K.G, S.B., D.B., and S.S.M.; supervision, J.K.; project administration, J.K.; and funding acquisition, J.K. All authors read and agreed to the published version of the article.
Disclosure Statement
The authors declare no conflict of interest.
Funding Information
This research was funded by the National Science Centre (No. 2016/23/B/NZ3/03142) to J.K.
References
Supplementary Material
Please find the following supplemental material available below.
For Open Access articles published under a Creative Commons License, all supplemental material carries the same license as the article it is associated with.
For non-Open Access articles published, all supplemental material carries a non-exclusive license, and permission requests for re-use of supplemental material or any part of supplemental material shall be sent directly to the copyright owner as specified in the copyright notice associated with the article.
