




Abstract
The river basins of Brazil contain a highly diverse ichthyofauna of remarkable endemism, including several threatened species. Accordingly, Lignobrycon myersi is a fish species distributed only in a few rivers from the state of Bahia, northeastern Brazil. Since this species is classified as Near Threatened and is poorly studied, efforts to understand the genetic structure of populations and putative cryptic forms should help define efficient strategies of management and conservation. Herein, the molecular identification and the population genetic diversity of specimens of L. myersi across their range (Almada, Contas, and Cachoeira river basins) were assessed using mitochondrial markers (16S rDNA and D-Loop, respectively). The inferences based on phylogenetics, genetic distance, and species delimitation methods invariably identified all samples as L. myersi. In addition, sequencing of D-loop fragments revealed significant haplotype diversity and a considerable level of population genetic structure. Despite their geographic isolation, these data suggested that populations from Almada and Contas rivers represent a single evolutionary lineage that could be managed as a whole. In contrast, the population from Cachoeira River was highly differentiated from the others and should be managed separately as a unique and endemic unit, particularly focused on the conservation of native habitats.
Introduction
The coastal drainages in Eastern Brazil are characterized by overlooked biodiversity and high levels of endemism, particularly when it comes to fish species. 1 However, such richness has undergone a remarkable decline even before the formal description of some taxa.2,3 Actually, an assessment organized by the Chico Mendes Institute for Biodiversity Conservation (ICMBio) revealed that a plethora of freshwater species are already extinct at the regional level. 4
Lignobrycon myersi Miranda Ribeiro 1956 is an endemic fish from Eastern Atlantic hydrographic region and the only extant species in the genus, since the congeneric L. lignithicus is a fossil characid (30–25 mya) that has inhabited the Taubaté basin (Paraíba do Sul River system) in Southeastern Brazil. 5 The endemicity of L. myersi stands out because of their restricted range (estimated area of 15,000 km2) 6 in Almada, Cachoeira, and Contas river basins, highly impacted by human activities.7,8 Deforestation or land use change is probably the main threat to the biodiversity from these hydrographic systems. 8
Besides, the illegal trading of threatened fish species remains a common activity in local fish markets of southern Bahia, thus increasing their vulnerability to extinction. 7 Accordingly, L. myersi has recently been assessed as Near Threatened by International Union for Conservation of Nature and ICMBio. 6 The extensive reduction of local populations of L. myersi is a consequence of human activities and represents a broad trend in a myriad of fish species from several hydrographic basins in South America. 9
In this context, genetic tools are useful to (i) assess the loss of genetic diversity and the risk of populations and species to extinction 10 ; (ii) identify hybridization events 11 ; (iii) describe cryptic species and resolve taxonomic uncertainties 12 ; (iv) infer population structure 13 ; and (v) define management units for conservation or reintroduction. 9 Despite their potential insights, few genetic studies are available in L. myersi.7,14
In contrast, mitochondrial DNA (mtDNA) markers have been extensively used for the characterization of molecular diversity in animals for the past decades. 15 These markers are highly applied in conservation genetics, 9 molecular ecology, 16 phylogenetics, 17 population genetics, 13 species identification, and forensics. 7 Remarkably, analysis of the 5’ region of the cytochrome c oxidase I (COI) gene has become the state of the art of molecular barcoding in metazoans. 18
However, the 16S ribosomal RNA gene (16S rRNA) has also shown high accuracy in the molecular identification of different groups, including fishes.15,19 This noncoding gene shows high levels of sequence conservation and has proven to be suitable for the analysis of interspecific variation. 20 In contrast, the control region or D-loop is characterized by a high number of variable sites useful to assess intraspecific variation. 20 Indeed, haplotype analyses in D-loop sequences have been successfully used to address the evolutionary relationships among populations or subspecies in several fish groups.21–23
Therefore, conservation efforts have largely benefited from molecular analyses, particularly related to the accurate discrimination of threatened species and monitoring of genetic diversity within and among populations. 24 Thus, in this study, we aimed to identify specimens and assess the genetic diversity of L. myersi across their distribution range based on mtDNA markers. Therefore, we relied on the 16S rDNA sequences and phylogenetic, genetic distance, and distinct species molecular delimitation approaches to discriminate L. myersi from closely related groups (Triportheidae and Gasteropelecidae) and other characin species (Characidae).
This was the first report based on 16S rDNA amplicons as a taxonomic molecular characterization of L. myersi, being useful to test the effectiveness of 16S rRNA genes as a secondary DNA barcode. In turn, D-loop sequences of populations across the entire distribution of L. myersi were used to infer their levels of genetic variation and structure, including potential evolutionary units that require special attention in conservation.
Material and Methods
Biological material and DNA extraction
A total of 83 specimens of L. myersi were collected along Contas River (n = 62), Almada River (n = 15), and Cachoeira River (n = 6) basins (Table 1 and Fig. 1). After removing small fragments of muscle tissue for molecular analysis, the specimens were deposited in the fish collection of the National Institute of Atlantic Forest (INMA) in Santa Teresa, State of Espírito Santo (No. MBML6400).

Collection sites of Lignobrycon myersi
Number of Sampled Specimens and Sequenced Mitochondrial DNA Fragments of Lignobrycon myersi per Collection Site
Total DNA was isolated using the Wizard® Genomic DNA purification (Promega) kit following the manufacturer's instructions. The quality of the isolated DNA was determined by electrophoresis in 0.8% agarose gel stained with GelRed™ followed by visualization under UV light (L-PIX EX system—Loccus).
Amplification and sequencing of mtDNA fragments
The amplification of 16S rDNA and D-Loop sequences was accomplished through polymerase chain reaction (PCR) using the primers L1987/H2609 25 and H3010/L2910, 21 respectively.
The PCR conditions for both molecular markers were the same, comprising a final concentration of 1 × buffer, 0.8 μM of each primer, 0.2 mM of dNTP, 2 mM of MgCl2, 0.6 U of Taq DNA polymerase, 50 ng of template DNA, and ultrapure water to a final volume of 15 μL. The PCR cycles of 16S rDNA encompassed a first denaturation step at 95°C for 5 min; followed by 30 cycles at 94°C for 40 s, 52°C for 40 s, 72°C for 1 min; and final extension at 72°C for 7 min. The amplification reactions of D-loop comprised a first denaturation step at 95°C for 5 min, followed by 30 cycles at 94°C for 40 s, 58°C for 40 s, 72°C for 1 min, plus a final extension at 72°C for 7 min.
The sequencing reaction was carried out with the Big Dye Terminator kit v 3.1 Cycle Sequencing (Applied Biosystems/Life Technologies) to a final volume of 10 μL, using 2.0 μL of 5 × buffer, 0.5 μL of Big Dye mix, 1 μL of each primer (10 μM), 1 μL of PCR product, and 5.5 μL of ultrapure water. Sequencing was conducted in ABI 3500 XL Genetic Analyzer automatic sequencer (Applied Biosystems, USA).
The partial sequences of 16S rRNA and D-Loop were edited in the software BioEdit 7.2, 26 comprising 503 and 827 base pairs (bp), respectively (Table 1). Both 16S and D-Loop sequences were submitted to GenBank. Specimen codes and accession numbers are provided in Supplementary Table S1.
Molecular identification
A multiapproach strategy was carried out for the molecular identification of samples. First, the 16S rDNA fragments were BLASTed in NCBI database to compare them with other sequences available in GenBank (http://www.ncbi.nlm.nih.gov/). Second, we performed a Bayesian phylogenetic inference (hereafter referred to as BI) to test the effectiveness of the 16S rDNA in discriminating specimens of L. myersi from other closely related Characiformes.
To assemble the data set for BI, we searched 16S rDNA sequences available from species related to L. myersi (e.g., Triportheus spp.) and to Triportheidae (families Gasteropelecidae and Characidae). This survey was guided by a comprehensive phylogenetic analysis of characins 27 and a recent checklist of freshwater fish species of the State of Bahia, Northeastern Brazil. 28 We retrieved 53 sequences of 30 species representing 16 genera and 3 families (accession numbers are provided in the Supplementary Table S2).
To determine the 16S haplotype sequences from 83 specimens of L. myersi, we used the software Dnasp v 5.10. 29 Then, we aligned the final haplotypes (n = 6) with the 53 fragments retrieved from GenBank using ClustalW in BioEdit. 26 Based on the software Kakusan v. 4.0, 30 the best substitution model for this data set was GTR + G.
The BI was run in the public resource CIPRES Science Gateway V. 3.3 (https://www.phylo.org/) using MrBayes v. 3.2.2, 31 comprising 2 runs of 4 MCMC chains for 10,000,000 generations and a burn-in of 10%. The final BI tree was visualized and edited in FigTree v. 1.4.2. (http://tree.bio.ed.ac.uk/software/figtree) and edited in Adobe Photoshop CC v.14.0.
Third, considering that (i) the family Triportheidae comprises only two genera, Lignobrycon and Triportheus, (ii) Lignobrycon has only one extant species, and (iii) the only species of the genus Triportheus (and geographically close to L. myersi) occurring in the state of Bahia are Triportheus signatus and T. guentheri, we decided to analyze a concise data set comprising only 16S rDNA sequences of these taxa using genetic distance methods and molecular species delimitation algorithms.
The final alignment comprised 87 sequences of 16S rDNA of 505 bp. We estimated the intraspecific and interspecific genetic values based on the Kimura 2-parameter (K2P) model 32 in the software Mega v 10. 33 Then, we carried out another BI analysis, as previously described, based on the K80 + Gamma model. In addition, we performed distinct methods of molecular species delimitation according to widely used algorithms elsewhere.
The Automatic Barcode Gap Discover (ABGD) 34 was run online in the public online platform (http://wwwabi.snv.jussieu.fr/public/abgd/), using a pairwise distance matrix calculated using MEGA v. 10 as input. 33 The ABGD parameters were Pmin = 0.001; Pmax = 0.01; n = 20; Steps = 10; X = 1.5. Four other methods were also included using a subset of the data consisting of unique sequences for each haplotype.
Therefore, the Bayesian Poisson Tree Process (bPTP) 35 and the Phylogenetic Map (PhyloMap), 36 both available online (https://species.h-its.org/), were carried out using an ML tree built in RAxML-HPC BlackBox 8.2.10, available through the CIPRES portal. Finally, the single-rate PTP 35 and multi-rate PTP (mPTP) 37 were also carried out using an ML tree as input.
Population analyses
High-quality D-Loop fragments were obtained only for 25 out of the 83 specimens, despite successive PCR trials (Supplementary Table S1), whereas 16S sequences were successfully obtained from all samples. Therefore, the population analyses were carried out using only the D-Loop sequences, because they are regarded as an informative single-locus marker for this approach and a concatenated alignment (16S + D-Loop) would imply in an excess of missing data.
Moreover, despite the reduced number of sequences, we consider that the present data set is valid because this is the first assessment of the genetic diversity of L. myersi specimens throughout their entire range, including Cachoeira River basin, where this species was only recently reported.8,38
The number of variable sites (S), total number of mutations (Eta), as well as haplotype (h) and nucleotide (π) diversity indices were estimated from the D-loop region of mtDNA using the software Dnasp v 5.10. 29 Both Tajima's D 39 and Fu's Fs 40 statistics with 10,000 permutations were used to test for neutrality in the software Arlequin. 41 The genetic population structure was evaluated through Bayesian Analysis of Population Structure (BAPS), 42 which indicates the putative number of populations (k). The haplotype networks were constructed in PopArt v. 1.7 (http://popart.otago.ac.nz) based on the median-joining network. 43
The phylogenetic tree was constructed based on D-Loop haplotype sequences using the Bayesian inference method. The BI analysis was carried out through CIPRES Science Gateway V. 3.3 (https://www.phylo.org/) using MrBayes v. 3.2.231 and consisted of 2 runs of 4 MCMC chains for 10,000,000 generations with 10% of burn-in, using the HKY85 + Gamma model, previously defined in Kakusan v. 4.0. 30 Pairwise distances based on the K2P model were also estimated among populations using Mega v. 10. 33
The FST values were estimated by the analysis of molecular variance (AMOVA) using Arlequin. 41 The same software was used to calculate the pairwise FST values considering the populations from the three sampled river basins as distinct groups (see Results and Discussion section).
Results and Discussion
Molecular identification
A small portion of the 16S rRNA gene (505 bp) was sufficient to identify accurately the analyzed specimens, since all sequences presented 100% of genetic identity with a public sequence of L. myersi (voucher LBP8094-37519; Accession No. HQ171402.1). Furthermore, this marker also allowed differentiating L. myersi from several species of Characiformes, including closely related taxa, such as those from genus Triportheus.
Accordingly, the BI based on the 16S rDNA data set recovered well-defined terminal groups, placing all conspecific specimens into monophyletic clusters of DNA barcodes with high posterior probabilities (Fig. 2a). The same was true when we analyzed a data set with 16S barcodes of closely related species that are found in the same or nearby basins where L. myersi occurs (Fig. 2b).
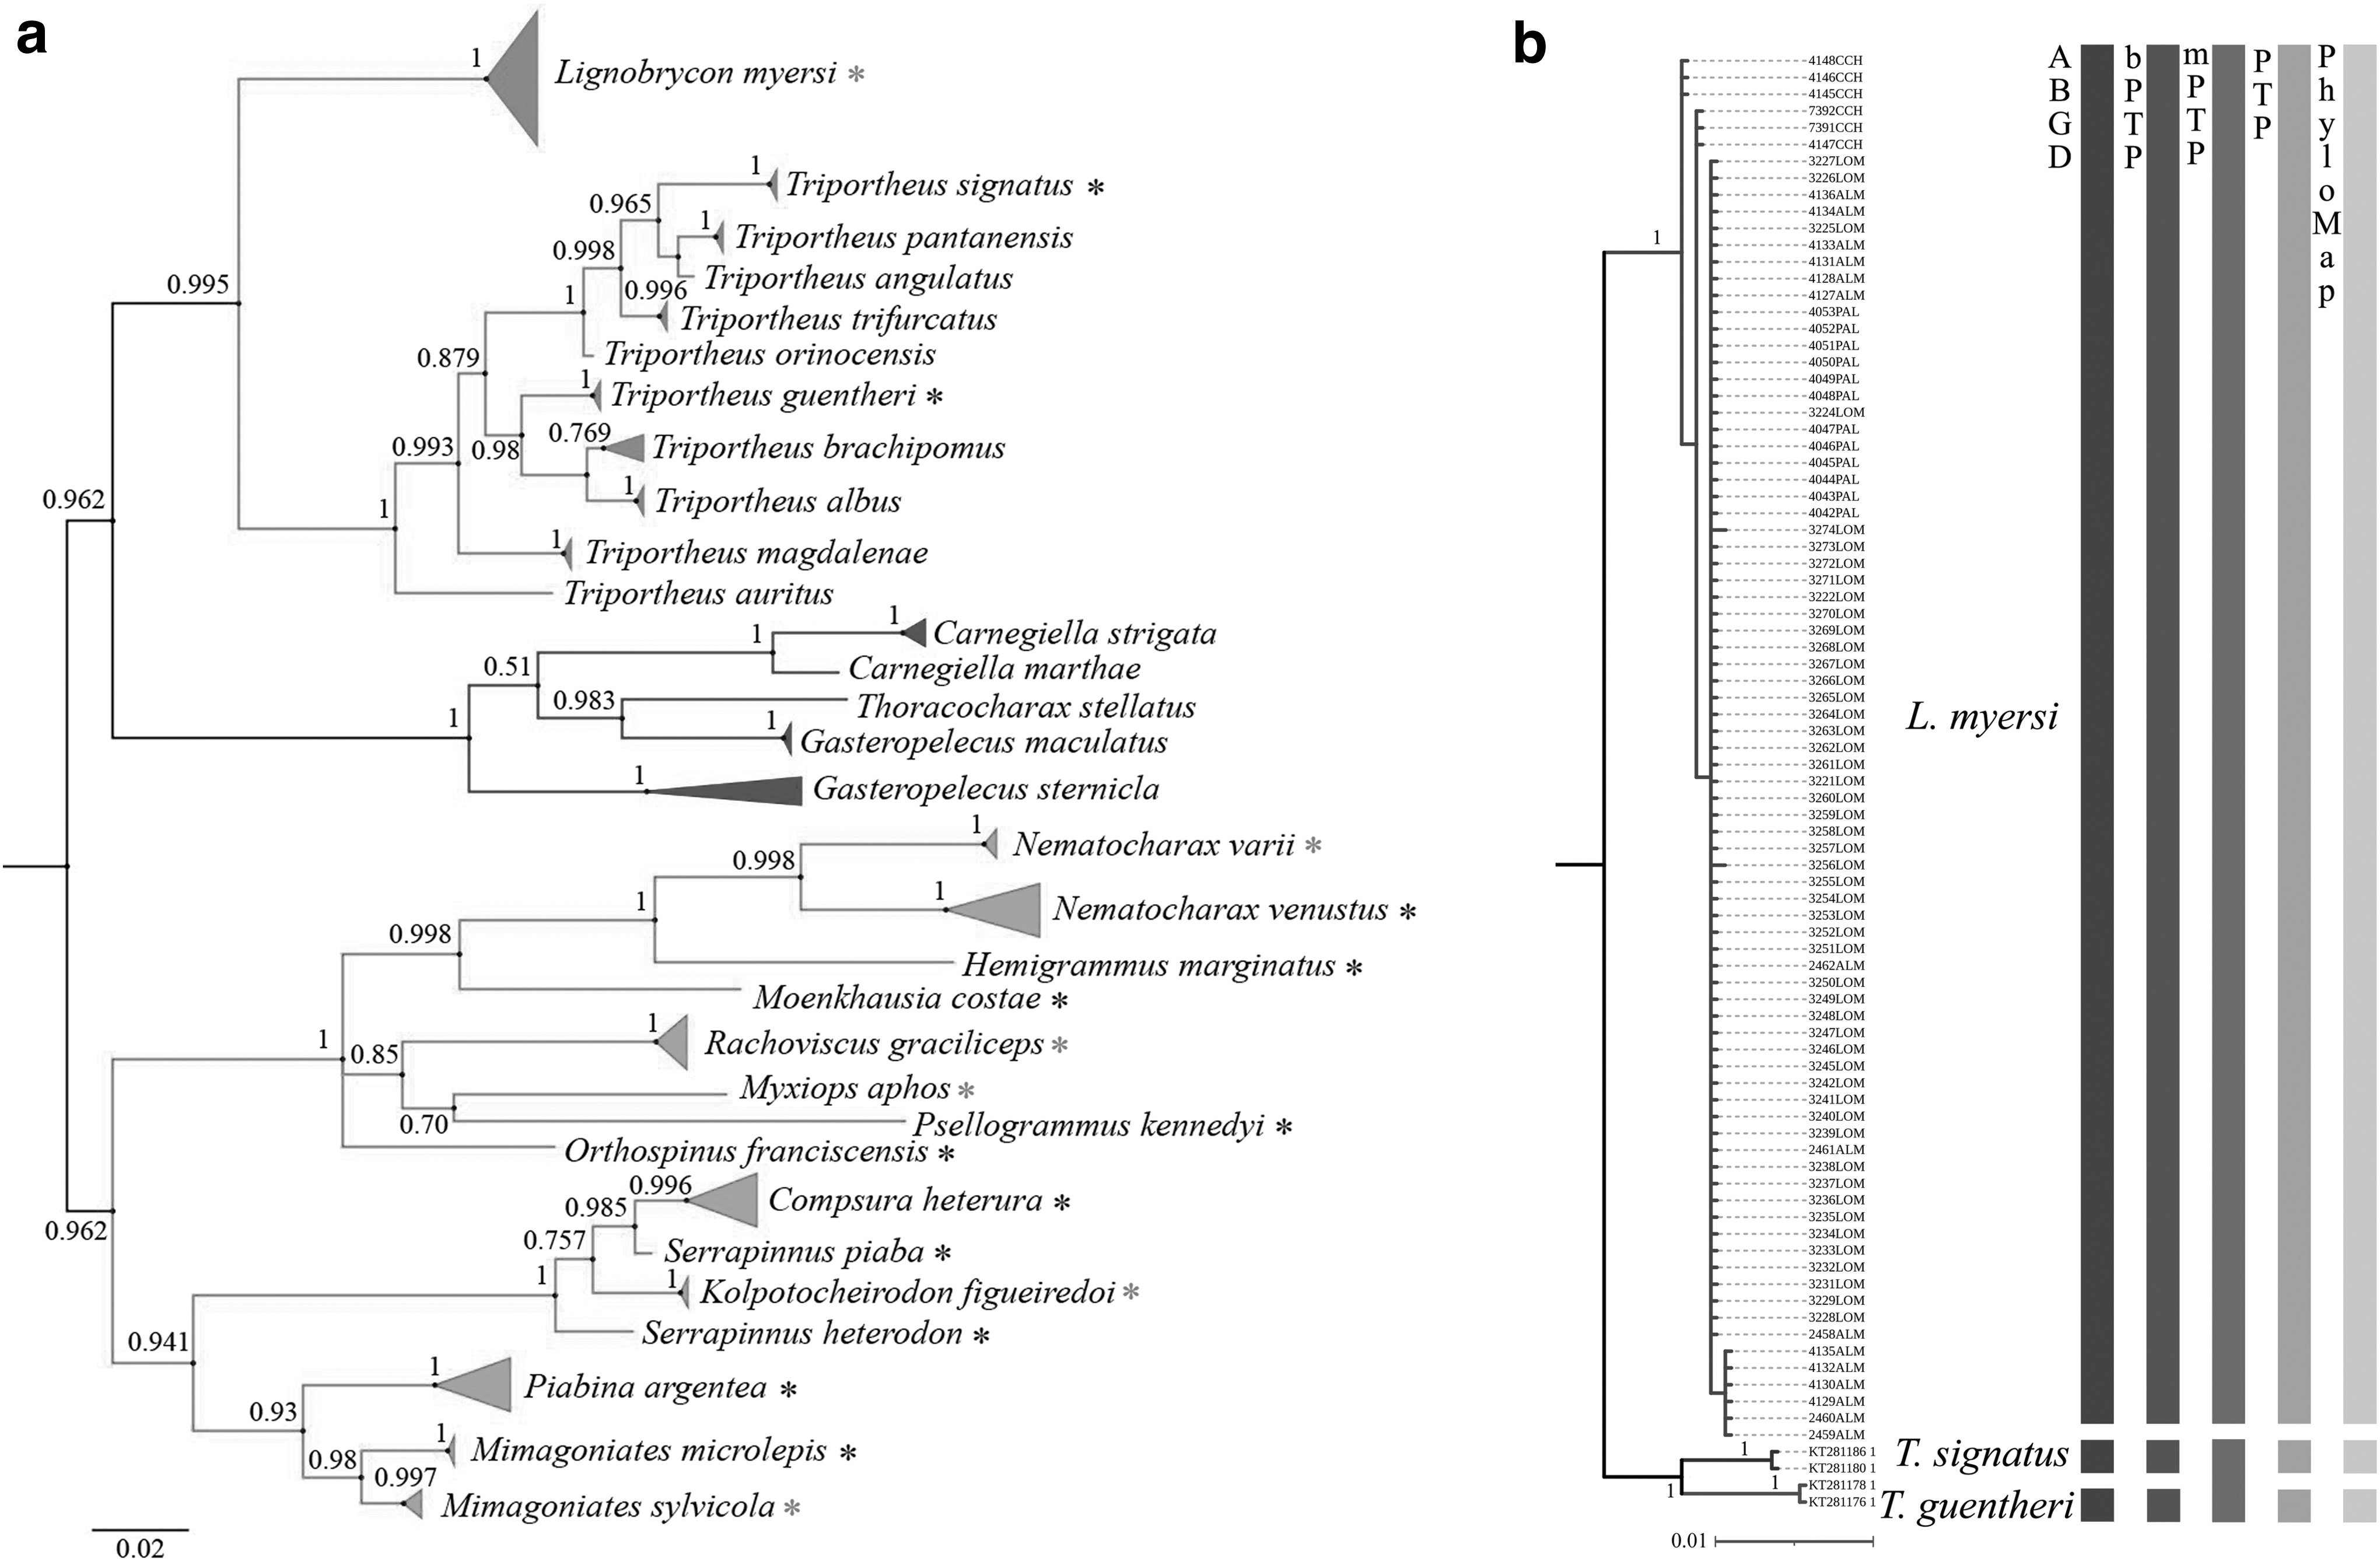
Phylogenetic tree based on BI analysis of 16S rDNA sequences of 31 species of Characiformes
In fact, whereas the intraspecific distance within and among populations of L. myersi ranged from 0% to 0.13% (mean of 0.07%) and from 0% to 0.4% (mean of 0.2%), respectively (Fig. 3a and Supplementary Table S3), the values of interspecific divergence were equal to 11% (L. myersi and T. signatus) and 10% (L. myersi and T. guentheri), thus clearly indicating a conspicuous barcoding gap between these related groups (Fig. 3b and Supplementary Table S4).
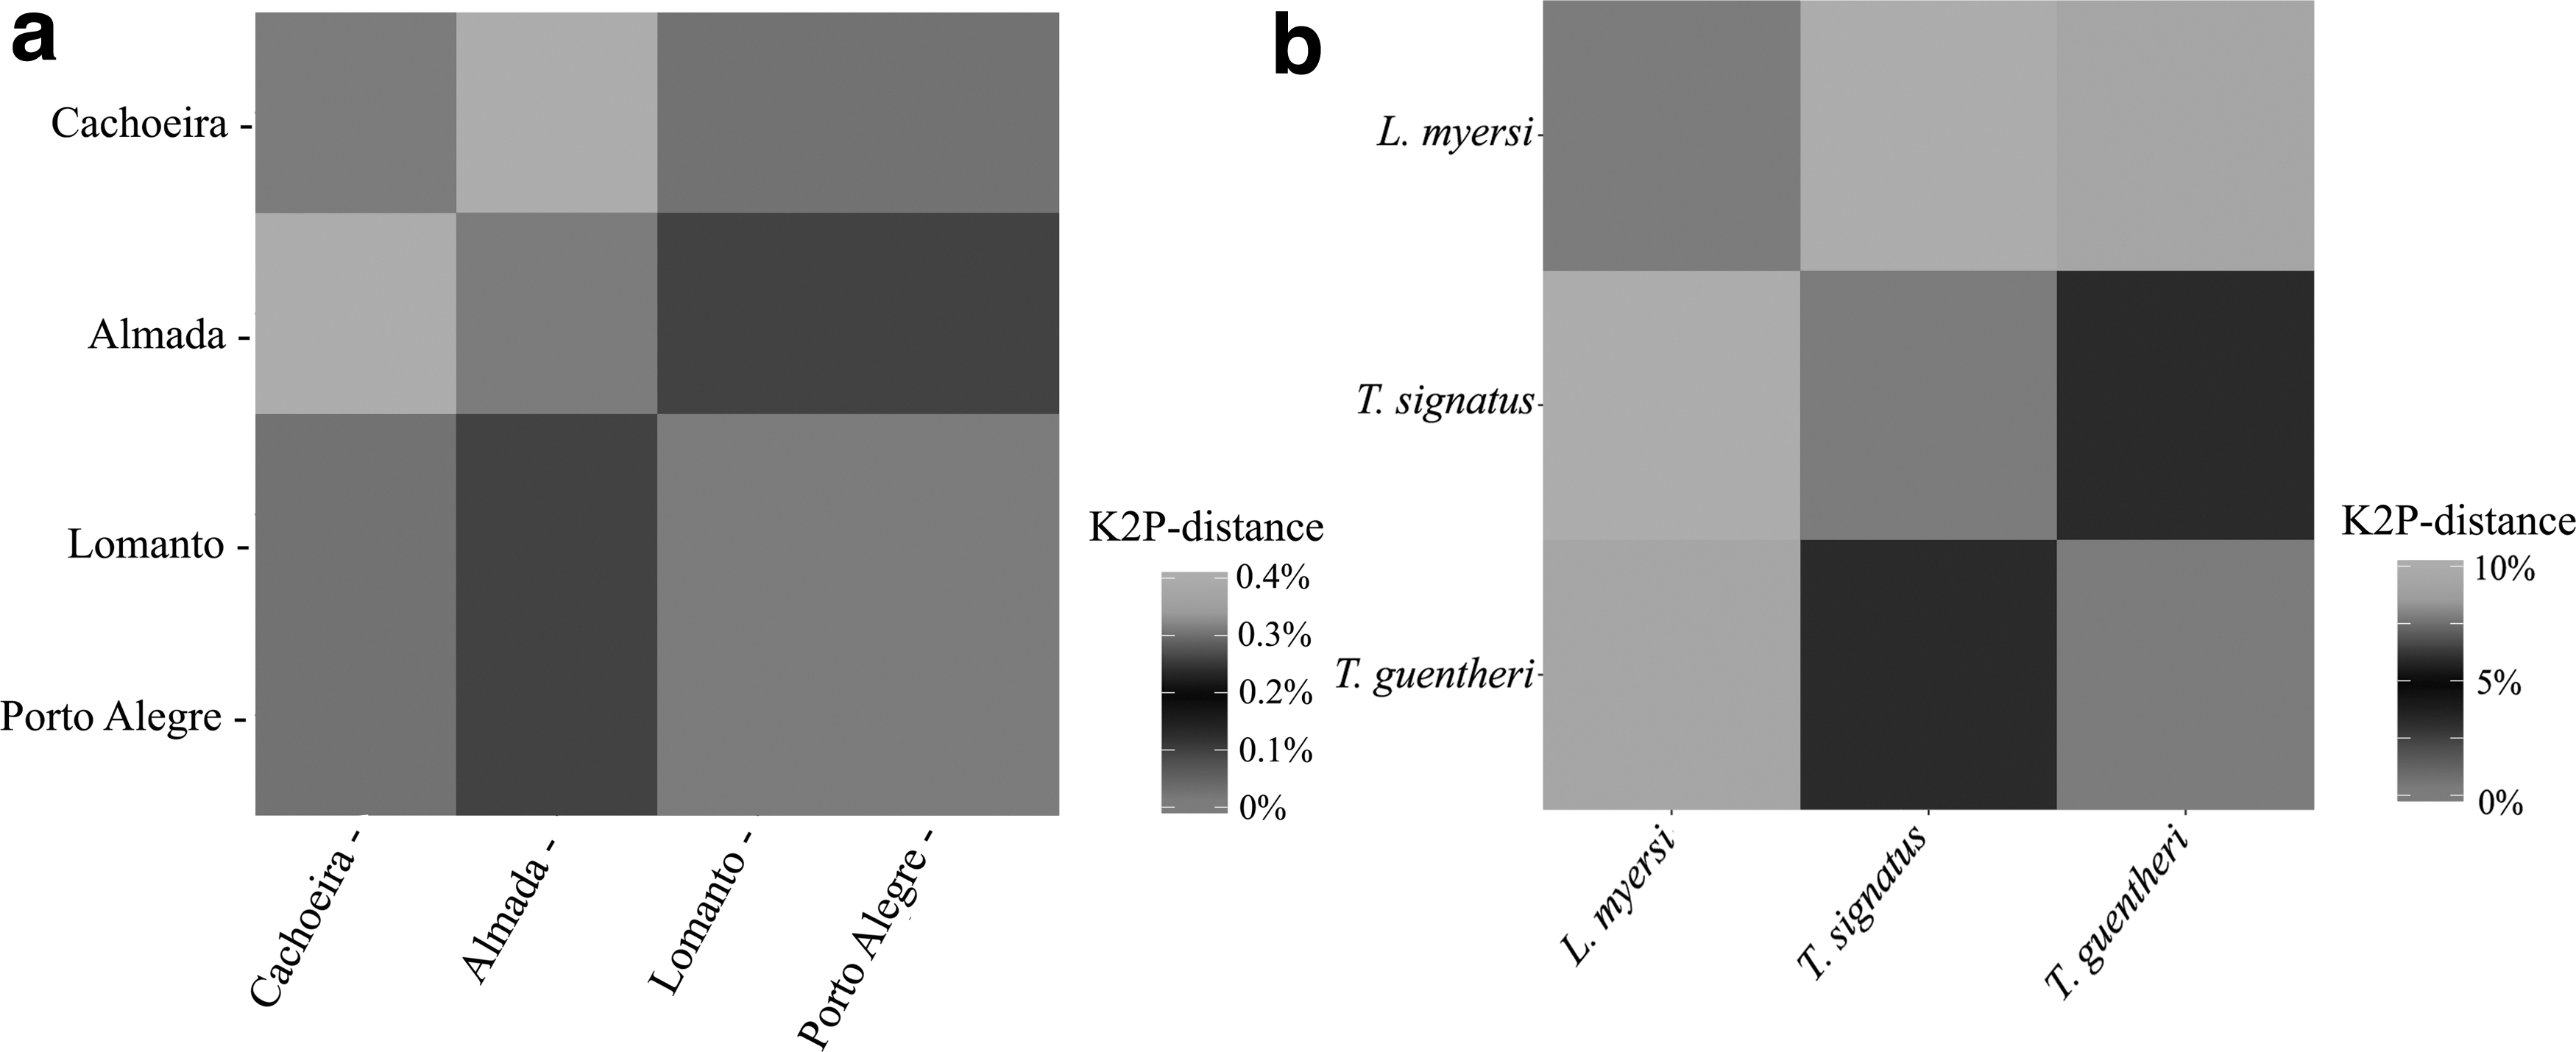
Heatmap illustrating the interpopulation
Recent studies have reported significant genetic distances in 16S rDNA fragments among fish species from distinct genera and families, whereas sequences of conspecific individuals usually show identity values from 98% to 100%, forming clades in phylogenetic inferences.19,44 Nevertheless, intraspecific distances above the threshold of 2%, usually suggested for species discrimination, have also been found in some neotropical fish taxa, indicating putative cases of misidentification or species complexes. 17
Considering that this is the first time that 16S amplicons were applied to the molecular identification of L. myersi specimens, we decided to run multiple species delimitation algorithms to confirm the effectiveness of the 16S rDNA as a potential barcoding tool for Neotropical fishes. Four of them (ABGD, bPTP, PhyloMap, and PTP) were congruent with the tree-based methods, invariably recovering three species in the data set (L. myersi and the outgroups T. guentheri and T. signatus; Fig. 2b).
The exception was the mPTP analysis that placed T. guentheri and T. signatus as a single species, but distinguished from L. myersi (Fig. 2b). As pointed out by Kapli et al., 37 this method usually outperforms the single PTP algorithm, providing accurate identification of taxa. However, sampling bias might result in distinct levels of intraspecific divergence and eventually hinder the precision of mPTP inferences. 37
Despite the aforementioned exception, the methods used in the molecular species identification reinforced that 16S rDNA sequences are suitable for discriminating evolutionary-related species. As a matter of fact, this mitochondrial gene has been referred to as a secondary barcode marker in different metazoan groups, 45 including fishes. 46 Therefore, this marker along with COI sequences has been used in the construction of barcoding libraries of threatened species, 19 identification of illegal trading, 47 or certification of processed fish products. 48
In this sense, 16S rDNA sequences represent an additional tool to validate the identification of L. myersi commercialized illegally in street markets, even under poor conditions of morphological analyses, as observed in southern Bahia. 7 This approach is able to provide reliable and fast inventories about the actual fishing pressures over threatened species, playing a major role in monitoring the vulnerability status and levels of exploitation in L. myersi.
Population analyses
The D-loop sequences obtained from 25 specimens of L. myersi comprised 827 bp, including 53 polymorphic sites and 55 mutations (Table 2). Twelve haplotypes were identified, while the overall haplotype (h) and nucleotide diversity (π) values were equal to 0.88 and 0.026, respectively (Table 2). The highest levels of genetic variation were detected in the populations from Cachoeira (h = 0.8670 π = 0.0065) and Almada (h = 0.8570, π = 0.0020) rivers (Table 2).
Genetic Diversity Parameters in Populations of Lignobrycon myersi Based on D-Loop Sequences
p ≤ 0.05.
π, nucleotide diversity; Eta, total number of mutations; h, haplotype diversity; H, number of haplotypes; N, number of individuals; ns, nonsignificant; S, number of variable sites.
The haplotype network revealed a remarkable genetic differentiation between the samples from Almada, Cachoeira, and Contas basins, since each population was characterized by unique haplotypes (Fig. 4a). This result diverges from previous COI data who reported high genetic diversity in samples from Contas River, possibly influenced by sample size. 7

Haplotype network based on D-Loop sequences from the populations of L. myersi along Cachoeira, Almada, and Contas River basins
Furthermore, the BAPS analysis also discriminated the populations into three genetic clusters corresponding to samples of L. myersi from each basin (Fig. 4b). The BI analysis based on haplotype sequences corroborated these findings (Fig. 4c) by recovering three monophyletic and high-supported clades, matching the clusters inferred by BAPS (Fig. 4c). Besides, the topology of BI tree also indicated that the samples from Contas and Almada river basins were more closely related to each other than to the population from Cachoeira River basin.
Accordingly, the mean interpopulation genetic distance was substantially higher when samples from Cachoeira River were compared with populations from either Contas or Almada rivers (Fig. 4d and Supplementary Table S5). This pattern has been repeatedly reported in phylogeographic studies on Neotropical fishes from this region, including both closely and distantly related groups such as Characiformes, Siluriformes, and Cichliformes.3,49,50 Therefore, the ichthyofauna from Cachoeira River basin should be emphasized in conservation policies, since this region seems to encompass several unique lineages that might be lost without proper management of this highly impacted river system.
The samples collected in two sites along Contas River were regarded as a single genetic group in further analyses, thus totaling three lineages representing each river basin (Contas, Almada, and Cachoeira). The AMOVA indicated that 89.82% of the genetic variation is distributed among groups (Table 3). A significant and high FST index (0.89; p < 0.0001) was observed among these lineages (Table 3), thereby revealing a remarkable population structure.
Analysis of Molecular Variance Within and Among Populations of Lignobrycon myersi from Three River Basins Based on D-Loop Sequences
p ≤ 0.0001.
d.f., degree of freedom.
In addition, all pairwise FST values were significant (p ≤ 0.01) and particularly high between the samples from Cachoeira and Almada basins (Table 4), as similarly observed in relation to pairwise K2P distances (Supplementary Table S6). This profile of genetic partition corroborates previous data based on COI in specimens of L. myersi collected along these localities. 7 It should be pointed out that 16S rDNA sequences also confirmed the highest genetic divergence between samples from Cachoeira and Almada rivers (Fig. 2b and Supplementary Table S3), even though this marker is usually regarded as relatively conserved among fishes. 51
Pairwise FS T (Below Diagonal) and Respective Significance Values (Above Diagonal) Between Samples of Lignobrycon myersi from Cachoeira, Almada, and Contas River Basins
Significance level = 0.01.
Such a remarkable genetic differentiation among fish lineages between Almada and Cachoeira river basins and the close similarity among samples from Contas and Almada rivers have also been reported in taxonomically distant species, such as representatives of Siluriformes. 3 This pattern contrasts with the geographical proximity (as short as 5 km in some points) between Almada and Cachoeira rivers, being another evidence of the complex biogeographical history of this region, reinforced by intricate and similar results even in phylogenetically distant groups.3,49,52
Therefore, conservation strategies of endemic fish species along these hydrographic systems should rely on detailed phylogeographic analyses to identify management units and avoid oversimplified inferences based only on present distribution and geographic distances.
Moreover, the specimens of L. myersi from Cachoeira River were collected along a potential hotspot of species richness and relatively preserved habitats from this basin. In fact, downstream sites along Cachoeira River present poor environmental conditions as a consequence of bioinvasions and pollution by untreated effluents.
In these degraded areas, both L. myersi and other endemic species have not been recorded. 8 Inasmuch as the only known population of L. myersi from Cachoeira River is highly genetically differentiated and distributed along a narrow area, conservation policies should consider this lineage as a single endangered stock and drive efforts to achieve the environmental recovery and mitigation of threats along this basin.
Conclusions
The 16S rDNA sequences proved to be highly informative to the molecular identification of L. myersi. Bayesian inference analyses and five species delimitation algorithms were congruent in distinguishing L. myersi from closely related species. Therefore, this mitochondrial marker could potentially be used as a secondary barcode in further studies in Neotropical ichthyofauna.
Molecular analysis based on D-Loop sequences showed a remarkable genetic structure between populations of Almada, Contas, and Cachoeira river basins, revealing the latter should be prioritized in conservation programs since it encompasses a highly vulnerable and differentiated lineage relative to other populations. Therefore, efforts should be directed to the maintenance of each lineage as separate evolutionary units, with particular emphasis on the environmental quality along the narrow occurrence range of L. myersi in Cachoeira River.
Footnotes
Acknowledgments
The authors are thankful to Alexandre Rodrigues, Silvia Brito, and Fabio Flores-Lopes for kindly providing specimens of Lignobrycon myersi from different localities; João Leno and Márcia Anjos for their assistance in collection and Sâmela Mendes for adding efforts in genetic analysis.
Authors' Contributions
All authors contributed to the study plan and experimental design. Material preparation and data collection were performed by L.d.S.O, J.d.A.B., and P.R.A.d.M.A. Data analyses were performed by L.d.S.O, J.d.A.B, and J.H.G. The first version of the article was written by L.d.S.O. and all authors commented on this draft. The final version was written by J.H.G. and revised by P.R.A.d.M.A. All authors read and approved the final article.
Data Availability
The data sets generated and analyzed in this study are available from the corresponding author upon reasonable request.
Disclosure Statement
No competing financial interests exist.
Funding Information
This study was funded by Fundação de Amparo à Pesquisa do Estado da Bahia (FAPESB) (Grant No. 011/2015) and Coordenação de Aperfeiçoamento de Pessoal de Nível Superior (CAPES) (financial code 001). Author L.d.S.O. has received research support from FAPESB.

References
Supplementary Material
Please find the following supplemental material available below.
For Open Access articles published under a Creative Commons License, all supplemental material carries the same license as the article it is associated with.
For non-Open Access articles published, all supplemental material carries a non-exclusive license, and permission requests for re-use of supplemental material or any part of supplemental material shall be sent directly to the copyright owner as specified in the copyright notice associated with the article.
