




Abstract
The marine medaka is emerging as a potential behavioral model organism for ocean studies, namely on marine ecotoxicology. However, not much is known on the behavior of the species and behavioral assays lack standardization. This study assesses the marine medaka as a potential model for chemical communication. We investigated how short exposure to visual and chemical cues mediated the stress response to social isolation with the light/dark preference test (LDPT) and the open field test (OFT). After a 5-day isolation period, and 1 h before testing, isolated fish were randomly assigned to one of four groups: (1) placed in visual contact with conspecifics; (2) exposed to a flow of holding water from a group of conspecifics; (3) exposed to both visual and chemical cues from conspecifics; or (4) not exposed to any stimuli (controls). During the LDPT, the distance traveled and transitions between zones were more pronounced in animals exposed to the conspecific's chemical stimuli. The time spent in each area did not differ between the groups, but a clear preference for the bright area in all animals indicates robust phototaxis. During the OFT, animals exposed only to chemical cues initially traveled more than those exposed to visual or both stimuli, and displayed lower thigmotaxis. Taken together, results show that chemical cues play a significant role in exploratory behavior in this species and confirm the LDPT and OFT as suitable tests for investigating chemical communication in this species.
Introduction
Chemical communication is the most ancient channel for information exchange. 1 The relevance of chemical communication in fish in comparison with other forms of communication varies according to the natural history of each species. 2 Of relevance, changes in the aquatic environment may disrupt chemical communication and these impacts may be less visible than others due to the “hidden” nature of chemical signals. Environmental models are projecting that greenhouse gas emissions—primarily carbon dioxide (CO2)—will cause ocean acidification in the near future, with a significant impact on marine life. 3 The change in ocean carbon chemistry has direct physiological implications,4,5 but the long-term impact of ocean acidification on fish behavior is debated.6,7 Especially, in fish, the acidification of aquatic environments may affect olfactory and chemical communication. 8
Since this system plays a significant role in many fish species, a disruption in normal behavior, including predation, reproduction, and social interaction, can be expected. 9 To a similar degree, chemical pollutants may also disrupt chemical communication in fish, which may impact their physiology and behavior. For example, heavy metals and combustion by-products can damage the olfactory organs or alter gene expression in zebrafish, thus reducing the response to odorants and inducing abnormal behaviors.10–14 However, we may not extrapolate behavioral responses to marine pollution and acidification from freshwater species, and a marine fish model akin to the freshwater zebrafish (Danio rerio) is still to be developed. Marine medaka (Oryzias melastigma) is a potential model organism for marine research,15,16 but behavioral studies have not been conducted systematically with this species.
In this study, we investigated for the first time in marine medaka, a social species, the role of olfactory and visual cues in the behavioral modulation following short-term social isolation. Group living provides a number of benefits to individuals, from increased protection from predators to increased foraging efficiency, to gaining reproductive benefits. 17 It can thus be predicted that in social species, social isolation will be a stressor that affects the physiology and behavior of individuals.
However, while the topic has been investigated to some extent in zebrafish,18,19 not much is known for other fish species. In particular, only a few studies have been carried out for marine species, such as in the Atlantic salmon (Salmo salar). 20 In the former study, social isolation momentarily decreased the willingness to interact with conspecifics, being suggested that size reduction of the cerebellar region could affect sensory inputs, movements, and cognitive functions, although the specific mechanisms remain unknown.
Under experimental conditions, serotonin, cortisol, and dopamine levels decreased in adult zebrafish after chronic social isolation (3–6 months), but serotonin levels increased after acute social isolation (24 h). 21 The same study also showed that chronic social isolation decreased thigmotaxis, while inducing hyperactivity, which reduced shoal cohesion. In another study, cortisol levels in isolated zebrafish (60 days) were lower after being chased with a net and higher after predator exposure, in comparison to group-housed animals. 22 Furthermore, zebrafish raised without social interaction displayed changes in brain activity in juvenile 23 and in larvae, 24 and changes in neuronal gene expression during larval and juvenile developmental stages. 25
Similarly, in the freshwater medaka Oryzias latipes, social isolation (2 weeks) decreased plasma cortisol and increased brain serotonin levels in males. 26 In turn, social cues (visual and olfactory) significantly reduced stress-related behaviors during isolation, and increased recovery time in zebrafish. 27 In O. latipes, a correlation was found between the antianxiety effects of diazepam and the lower tendency of isolated animals to swim closer to a mirrored image, which is interpreted as a shoaling behavior. 28 These studies suggest that social isolation affects physiology and behavior and that social cues and anxiogenic/anxiolytic drugs modulate the behavioral stress response.
Comparative studies between zebrafish and freshwater medaka reveal species-specific behavioral responses to social cues, which may be related to species adaptation. 29 In zebrafish, individuals used olfactory cues to reach the social stimuli. 30 Previous works in O. latipes reported visually mediated social behaviors. In this species, the motion information extracted from computer-generated visual cues induced shoaling behaviors. 31 The ability to perform individual recognition on the basis of visual features had the potential to modulate social interactions, 32 and visual familiarity influenced mating behaviors.33,34 Previous studies suggest a lesser development of olfactory sense in medaka species (microsmatic), especially in contrast to other species such as the macrosmatic zebrafish.29,35 Earlier research in O. latipes (wild type and laboratory strains) reported on the genetic evolution of olfactory receptors, 36 and comparative studies suggested that a lower number of functional genes correlated to lower olfaction ability. 37
Nevertheless, the relevance of olfactory cues for social interactions in medaka species requires further examination. For instance, social competition in O. latipes produces different hormonal responses in the olfactory bulb between dominant and subordinate males. 38 While complex social and shoaling behaviors are found in all medaka species, and mainly described in O. latipes, interspecies behavioral variability was observed between O. latipes, Oryzias dancena, Oryzias woworae, and Oryzias sinensis, 39 thus highlighting the necessity to study different species. Furthermore, physicochemical characteristics in freshwater or marine ecosystems can induce distinct behavioral impairments with regard to chemical cues. 40
The use of O. melastigma as a behavioral model organism is potentially significant to ocean studies for assessing the impact of global changes, such as ocean acidification, oxygen depletion, marine pollution, and temperature rise, on social behaviors in a marine environment. In particular, ocean acidification has been shown to interfere with chemical communication in fish41,42 and the marine medaka can provide a useful model to investigate the proximate mechanisms through which acidification disrupts chemical communication. We use social isolation as an ethological tool to test if indeed chemical cues from conspecifics modulate the behavioral response to this putative stressor, and compare this response to visual cues. In socially isolated zebrafish, visual stimuli alone (live conspecifics and animated images) induce behavioral and neurochemical responses.23,43
Also in zebrafish larvae, conspecific chemical and visual cues attenuate the oxytocinergic neural activity caused by social deprivation, which, in turn, negatively affect defensive and feeding behaviors. 24 As for the marine medaka, it is therefore important to investigate the role of intraspecific chemical communication in this species and establish behavioral endpoints to assess its disruption. We adapted two experimental designs from research with O. latipes and D. rerio: the light/dark preference test (LDPT) and the open field test (OFT). We used them as anxiety-like behavior tests 44 to measure the stress response to social isolation and contrasting social cues in marine medaka.
Overall, the study aims to contribute to the understanding of the role of chemical and visual cues for the modulation of stress caused by social isolation and to standardize and improve laboratory behavioral methods in O. melastigma. The experimental design assesses the importance of chemical communication in the marine medaka to evaluate its suitability as a behavioral model for marine ecotoxicology.
Materials and methods
Fish origin and maintenance
Adult marine medaka (4-month old) were obtained from lines kept in indoor facilities for several generations. The fish belonged to the same breeding population, obtained from an original stock kept at the Ocean University of China (Qingdao). Breeding and rearing followed standard procedures adapted from Murata and Kinoshita's protocols. 45 Larvae were selected from a cohort of individuals, which hatched on the same day, within a 3-h interval. Groups of 60 fish were housed in collective 5 L tanks until 14 dph and then transferred to 30 L tanks.
Controlled fluorescent light exposure (12-h light/12-h dark photoperiod, starting at 8:00 a.m.) was provided, and light intensity ranged between 600 and 700 lx, as measured at the surface of the water, with a digital luxmeter (Smart Sensor AS823). The average pH was 6.8 and the temperature was held constant at 27°C. Artificial seawater was prepared with formulated salt (Instant Ocean Reef Crystals at concentration of 30 ppt) and reverse osmosis filtered water. The fish were fed twice a day, with a dried brine shrimp diet (Ken's Premium Golden Pearls) in the morning and live brine shrimp (Wudi Haiji Aquatic) in the afternoon, with an 8-h interval.
All methods adhered to the ASAB/ABS “Guidelines for the treatment of animals in behavioral research and teaching.” 46 The methods and housing conditions followed the ethical guidelines enforced at the University of Saint Joseph and were approved by the Division of Animal Control and Inspection of the Civic and Municipal Affairs Bureau of Macao, license AL017/DICV/SIS/2016.
Social isolation
Naive adults (3-month old) with no apparent abnormality were selected from 60-fish groups (same cohort) and placed in social isolation. All individuals tested in this study were housed in separate 1 L glass tanks (80 × 80 × 200 mm), separated with white acrylic partitions, and kept in the same location for 5 days. The animals could not see each other during the isolation period. The fish were qualitatively similar in size and weight. We did not consider the sex of the animals.
Experimental procedure
One hour before the behavioral assays, isolated fish were allocated to one of four experimental groups (Fig. 1): (A) visual—fish were exposed to visual cues from four adjacent 1 L glass tanks containing two conspecifics each; (B) chemical—fish were exposed to a continuous flow of fish-holding water. In a separate 2 L glass tank, eight fish had been swimming in clean artificial seawater prepared, as previously described, for 1 h before the test. These fish were not in visual contact with the test subject and they remained inside the tank during the test. A flow of water of 5 mL/min was maintained with a peristaltic pump (Kamoer NKCP-B08B); (C) visual and chemical—the subjects were simultaneously exposed to visual and chemical stimuli, as previously described; and (D) control— fish were kept isolated until testing. Each fish was only tested once throughout the experiment.
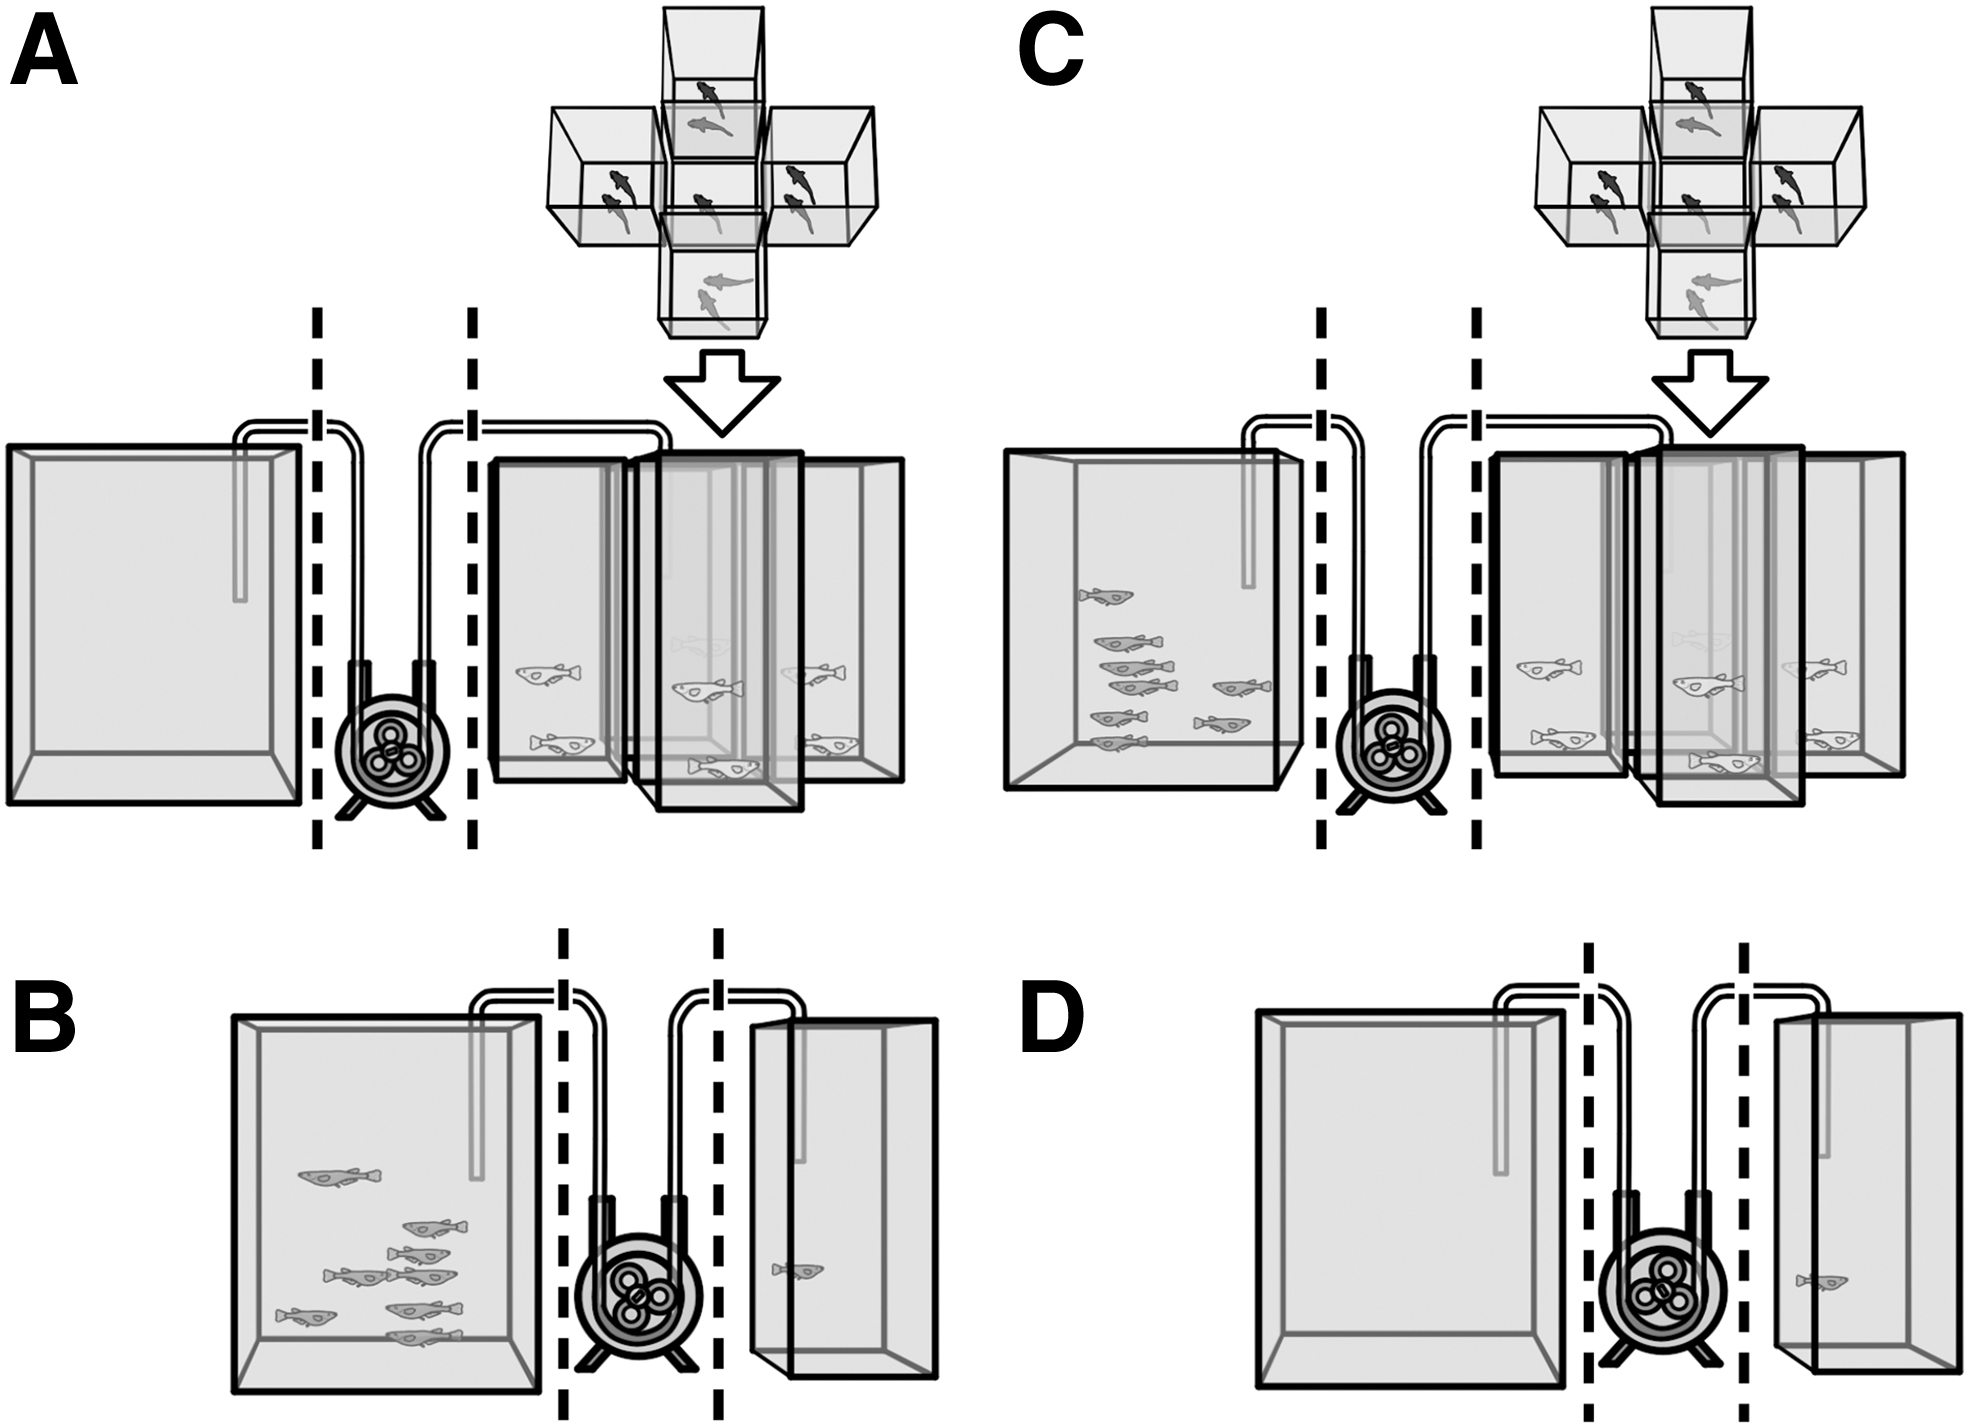
Experimental setup. After 5 days of social isolation, focal fish were exposed to
Animals and treatments were randomly selected before each test. The tests were carried out between 10:00 and 18:00 h and the order of treatments was randomized. The animals were not fed on the day of the experiment. All model animals for chemical and visual stimuli came from an independent group, but from the same cohort, similar in age and size.
Light/dark preference and OFT
We assessed the animals' preferences for bright or dark environments with LDPT. In zebrafish, the LDPT (initially proposed by Serra, Medalha, and Mattioli 47 ) has been commonly used to measure anxiety behaviors (see Maximino et al. for a validation and review) in zebrafish, 48 based on the natural avoidance of bright areas. The LDPT was also adapted to freshwater 49 and marine50,51 medaka species.
The LDPT (Fig. 2A) was carried out in a rectangular glass tank (W 100 × L 500 × H 200 mm). The height of the water column was 50 mm. The arena was equally divided into a “dark” zone and a “light” zone. The inner walls of the dark zone were covered with black opaque acrylic and those of the light zone with white opaque acrylic. Black infrared-transparent and clear acrylic panels were placed below the tank. The top of both zones of the apparatus was covered with black infrared-transparent material.
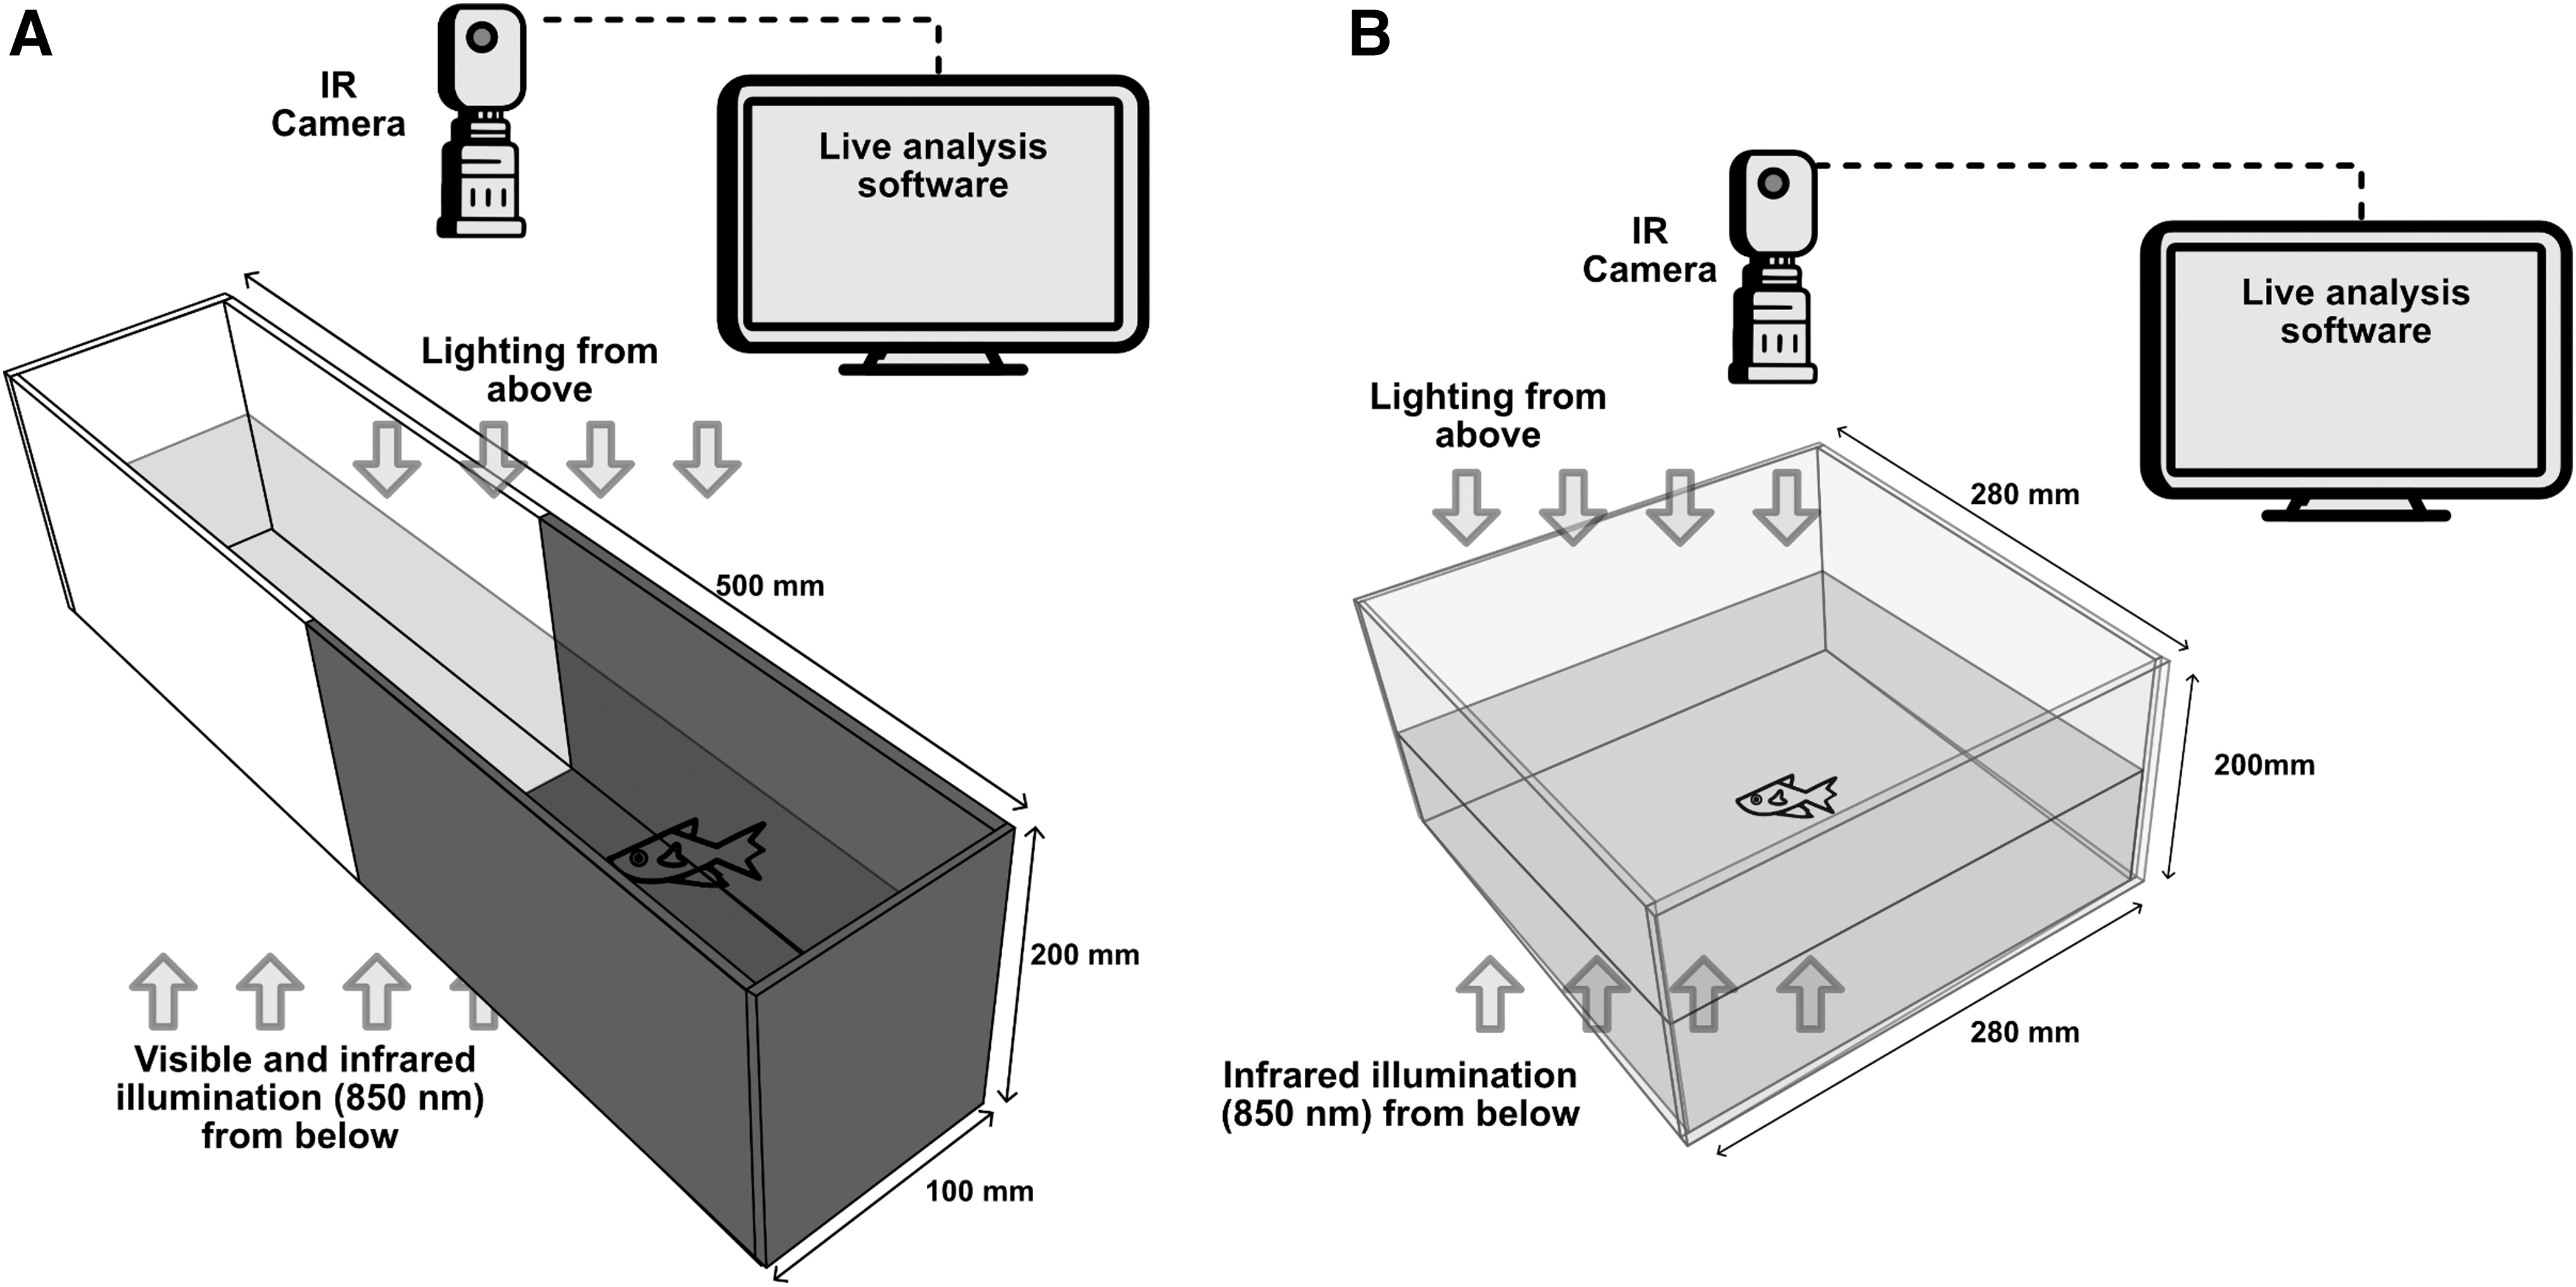
Apparatus for the LDPT
We placed the arena inside a recording box on a backlit table illuminated with infrared LEDs (850 nm) and white LED strips. The animals were transferred from the treatment tank to the LDPT tank with a small net and placed at the center of the tank. During a 5-min acclimation period, in darkness, the animals had access to both zones without any restriction. Then visible LED lights below the tank illuminated the arena (400 lx). Replicates with two arenas (1 fish each) were simultaneously recorded for 10 min after lights-on with a monochrome camera (Daheng MER-2000-19U3M, with CMOS sensor Sony IMX-183, 12 mm ZLKC lens, and Zomei 850 nm infrared pass filter), mounted on a vertical bar 50 cm above the middle of the box. Between 25 and 36 animals from each treatment were tested (control = 26; chemical = 28; visual = 36; and chemical and visual = 25).
We used the OFT to assess swimming behaviors in response to social isolation. In zebrafish, the OFT was adapted from behavioral rodent paradigms. 52 The test was also validated for O. latipes.53,54
The OFT (Fig. 2B) was carried out in a square clear acrylic tank (W 280 × L 280 × H 200 mm). The height of the water column was 50 mm. The outer walls were covered with white opaque foam material. The arena was placed inside a recording box on a backlit table illuminated (as described for the LDPT). The arena was covered with a board during a 5-min acclimation period, with fish individually introduced into the center of the tank and kept in darkness. Visible fluorescent light (400 lx) illuminated the arena from above after the removal of the cover. Replicates with two arenas (1 fish each) were recorded for 15 min after lights-on. Between 18 and 25 animals were tested for each treatment: (visual = 24; chemical = 23; chemical and visual = 25; and control = 18).
Each isolated animal was only tested once in either the LDPT or ODT.
Behavioral analysis
The behavioral response in the LDPT and OFT was quantified from video recordings with EthoVision XT 16 software (Noldus Information Technology, Wageningen, The Netherlands). For the LDPT, the time spent and the distance traveled in the dark and light compartments were calculated. For the OFT, the distance traveled, the time when the animal was not moving (freezing), and the time spent in the central area of the open field were estimated. The movement tracking started when the speed was above 1 cm/s and stopped when the speed was below 0.5 cm/s. We considered that the fish was inside the central area of the OFT when the distance to the walls of the tank was greater than one body length. The sampling rate for the video analysis was established at 4 fps for both tests.
For both tests, the distance traveled and time spent in each area were calculated for the total duration of the test and for 5-min time bins. Previous studies in zebrafish and medaka reported temporal differences in behavior in the OFT and LDPT for trial duration ranging between 5 and 30 min.49,55–57
For instance, in O. latipes, Lucon-Xiccato et al. noted an early increase in thigmotaxis during the OFT and decrease in the time spent in the bright area of the LDPT, with per-minute distribution identifying temporal patterns of activity during the experiment as an indicator of habituation.29,54 Therefore, in this study, we expected that visible differences in behavior would occur during the test, according to prior exposure to visual and chemical cues. The temporal distribution of the analysis aimed to highlight differences between the first and last phase of trials to observe the potential effects of treatments on the coping styles, that is, the ways whereby animals overcome stressful situations. 58
Statistical analysis
We performed statistical analysis with IBM SPSS Statistics Ver. 28.0.0.0 (190). Only data after the acclimation period of LDPT and OFT assays were used for analysis. The distance traveled, time spent in different zones, movement, and transitions between zones by each individual were averaged without interpolation of missing data points. Twenty animals were isolated for the LDPT and 100 for the OFT. Failed trials and trials with incomplete data are not represented in the data. Missing data did not represent more than 5% for all successful trials.
A general linear model-repeated measures (GLM-RE) was performed to assess effects between treatments, the effects of the time of measurement (5-min intervals), and the interaction effects between the time and treatments. When the sphericity assumption had not been met, the corrected test was carried out using the Huynh-Feldt Epsilon. The GLM-RE was followed by a planned post hoc contrast analysis without adjustment for multiple comparisons (least significant difference) to assess statistically significant differences. We reported pairwise comparisons between the groups for each measurement times, and between measurement times within each group.
In addition, for the LDPT, we used the binomial distribution test to compare the proportion of time spent in the light and dark area for all individuals. For the OFT, the Pearson correlation coefficient was applied to assess the relationship between the distance traveled, freezing behavior, and the time spent in the central area of the arena.
Results
Light/dark preference test
In Table 1, we summarize the effects of time and treatments from the GLM-RE analysis. Regardless of experimental treatment, marine medaka exhibited a strong preference for the light, spending most of the trial in the bright area of the chamber during the first half of the test (control: 98.5%, standard error [SE] = 0.80; chemical: 93.1%, SE = 2.44; visual: 95.5%, SE = 1.78; and chemical and visual: 96.9%, SE = 1.28) and second half (control: 95.3%, SE = 2.25; chemical: 87.5%, SE = 3.97; visual: 92.2%, SE = 2.32; and chemical and visual: 93.5%, SE = 2.29) (Fig. 3A).
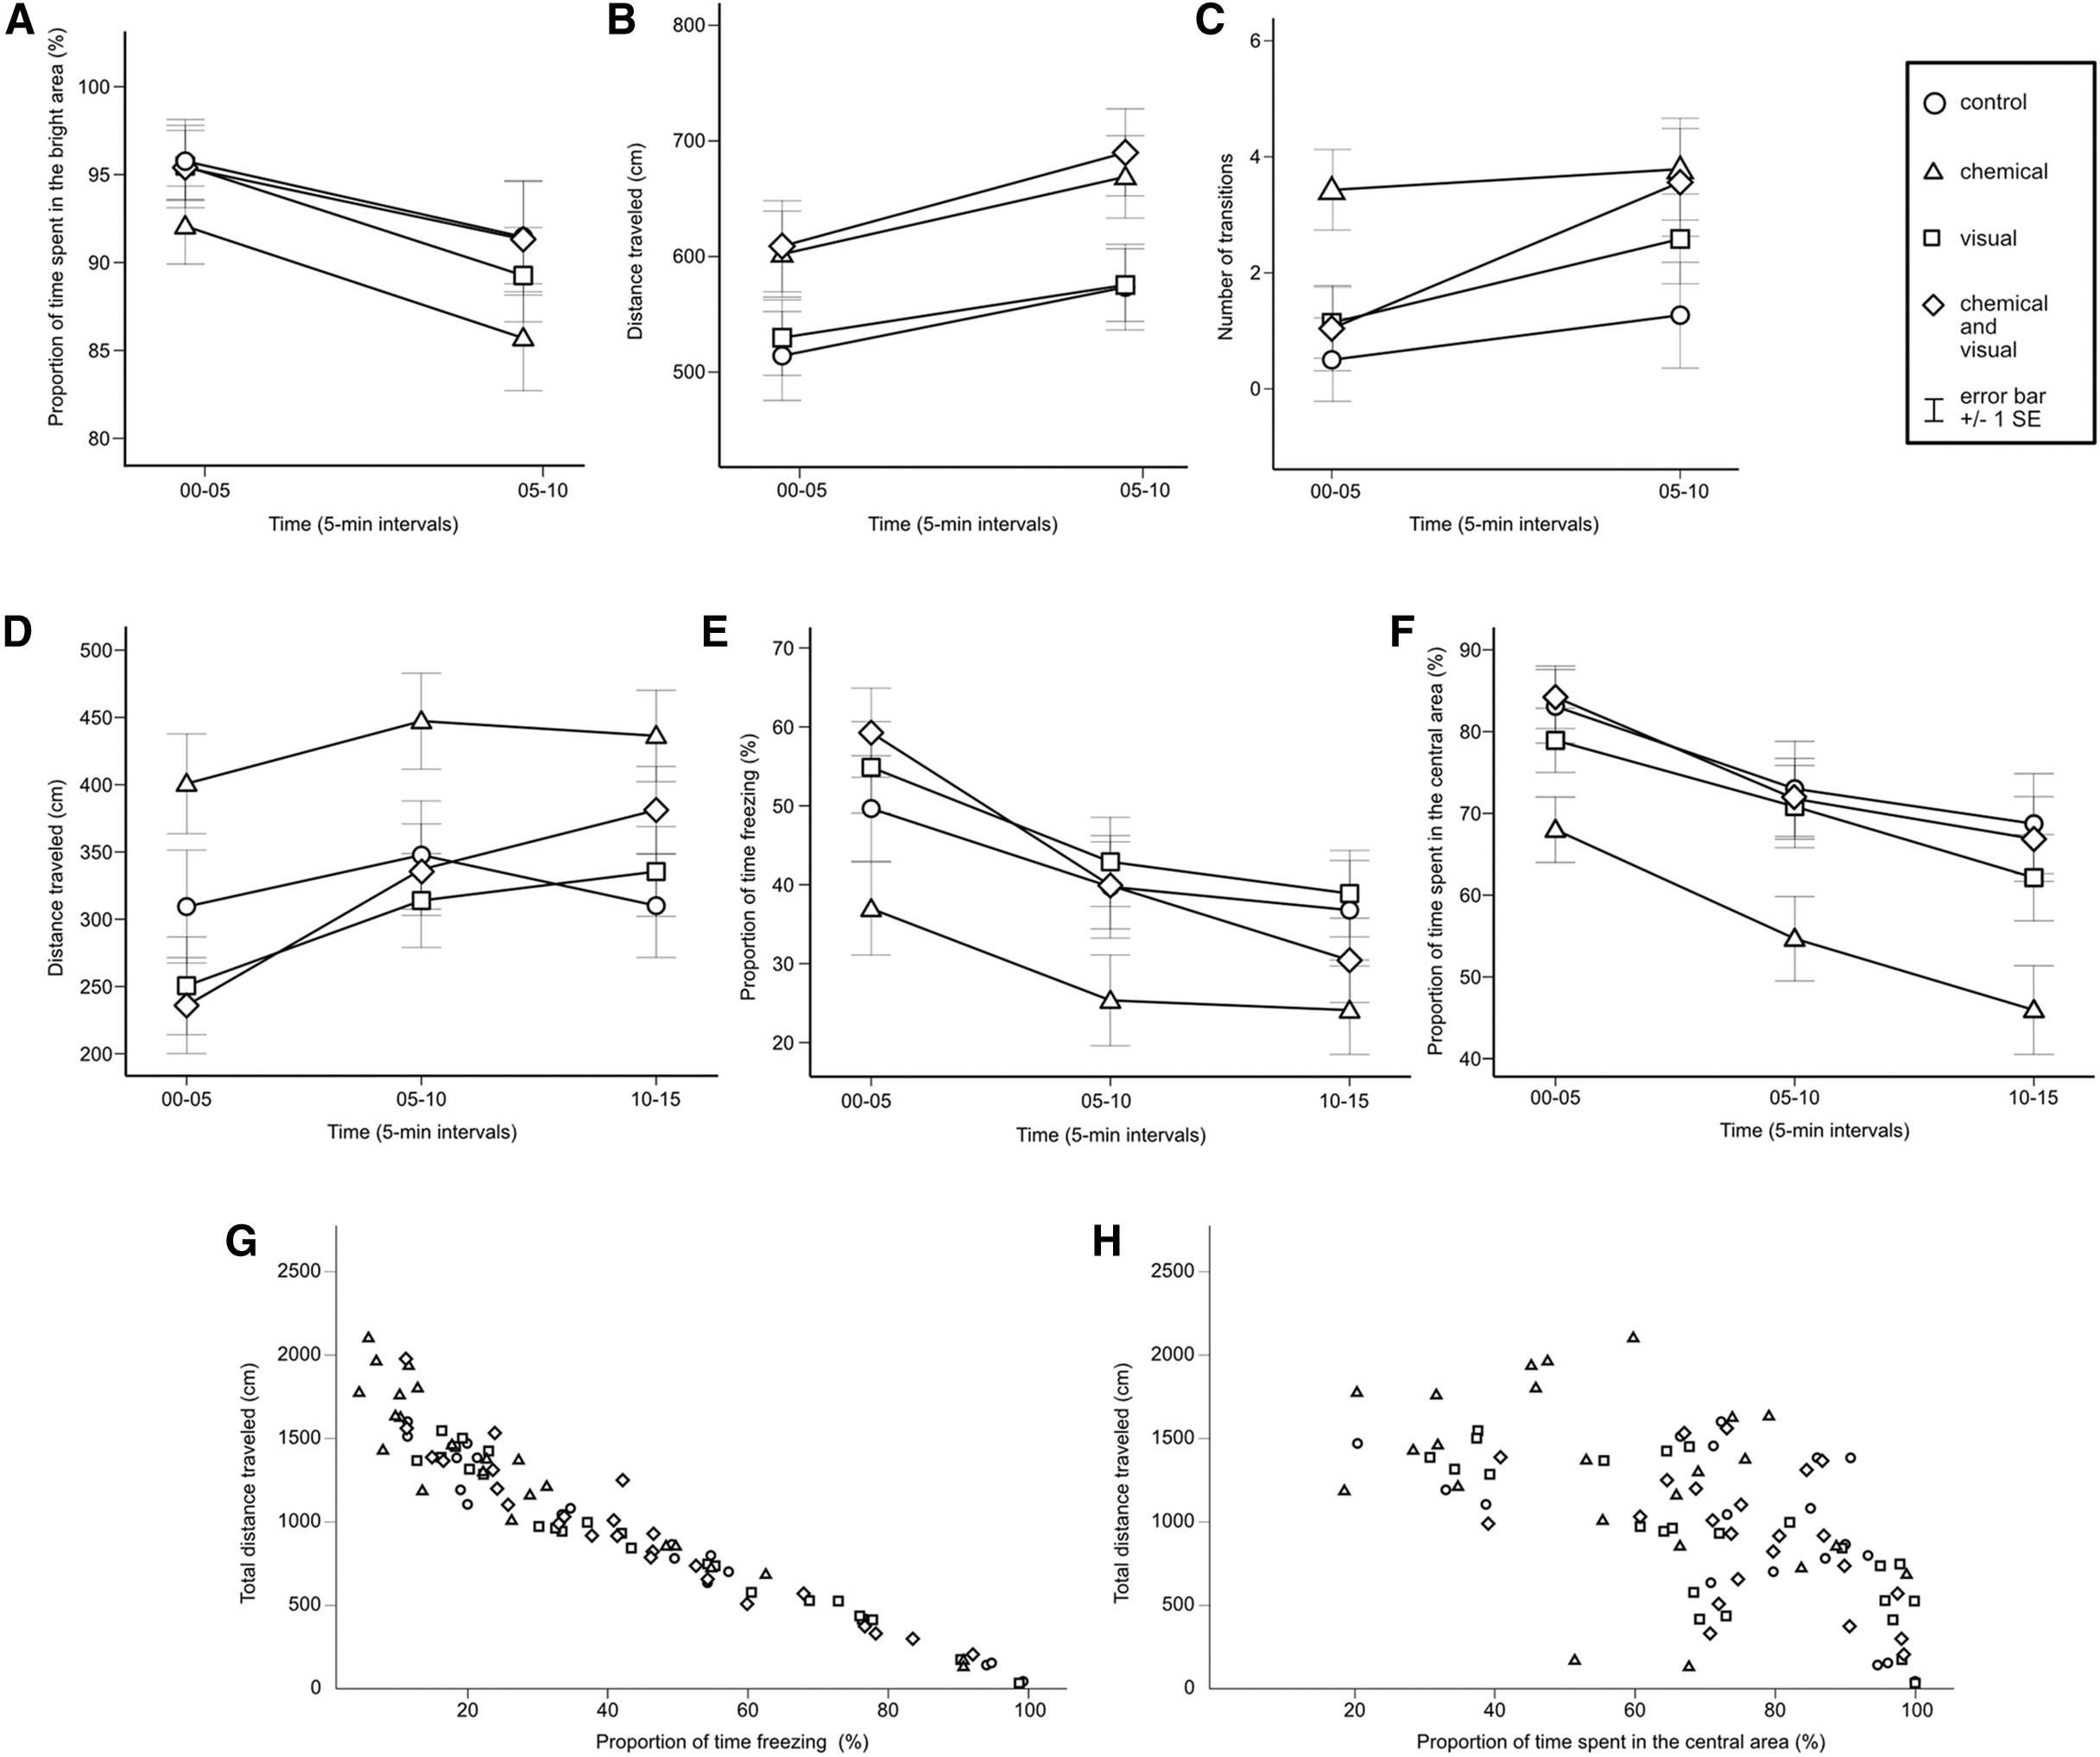
Proportion of time spent in the bright area
Summary of the General Linear Model-Repeated Measures Analysis and Significance of Within-Subject and Between-Subject Factors
LDPT, light/dark preference test; OFT, open field test.
For the totality of the trial, a binomial test revealed that more than 90% of the fish spent more than 70% of their time in the bright area (p = 0.008) or more than 70% of the fish spent more than 90% of their time in the bright area (p = 0.049). The measurement time had an effect on the individual proportion of time spent in the bright area (F[1, 111] = 11.506, p < 0.001).
Post hoc analysis revealed that the time spent in the bright area decreased between the first and second intervals for all groups, but it was only significant in the group exposed to chemical stimuli (control: p = 0.181; chemical: p = 0.016; visual: p = 0.108; and chemical and visual: p = 0.161). There was no interaction between time and treatment (F[3, 111] = 0.255, p = 0.858) or differences between treatments for the entire test (F[3, 111] = 1.775, p = 0.156), but during the first half, the group exposed to chemical stimuli spent less time in the bright area compared to the control group (p = 0.038).
We measured the distance traveled in the arena during the first half (control: 514.9 cm, SE = 33.76; chemical: 602.8 cm, SE = 42.89; visual: 530.6 cm, SE = 31.25; and chemical and visual: 609.7 cm, SE = 38.96) and second half (control: 574.3 cm, SE = 34.33; chemical: 669.8 cm, SE = 36.10; visual: 576.2 cm, SE = 30.69; and chemical and visual: 690.7 cm, SE = 41.04). In general, the measurement time had an effect on the individual distance traveled during the test (F[1, 111] = 28.094, p < 0.001).
The distance traveled significantly increased throughout the test for all groups (control: p = 0.019; chemical: p = 0.033; visual: p = 0.006; and chemical and visual: p = 0.002) (Fig. 3B). There was no interaction between time and treatment (F[3, 111] = 0.406, p = 0.749) or differences between treatments for the entire test (F[3, 111] = 2.541, p = 0.060). However, for the second half, post hoc analysis showed that the animals exposed to visual and chemical stimuli traveled more, compared to the control (p = 0.030) and the group exposed to visual stimuli (p = 0.021), and the animals exposed to chemical stimuli alone also traveled more, compared to the group exposed to visual stimuli (p = 0.051). No difference in distance traveled was observed between the treatments during the first half.
As the proportion of time spent in the least preferred dark area increased throughout the test, we compared the distance traveled in this area during the first half (control: 8.5 cm, SE = 4.88; chemical: 66.9 cm, SE = 25.88; visual: 19.8 cm, SE = 8.87; and chemical and visual: 29.1 cm, SE = 13.87) and second half (control: 27.3 cm, SE = 12.91; chemical: 102.6 cm, SE = 39.58; visual: 61.6 cm, SE = 18.13; and chemical and visual: 71.6 cm, SE = 25.20).
The measurement time had an effect on the distance traveled in the dark area (F[1, 111] = 18.869, p < 0.001). The distance traveled increased in all groups, except for the control (control: p = 0.0261; chemical: p = 0.028; visual: p = 0.004; and chemical and visual: p = 0.014). There was no interaction between time and treatments (F[3, 111] = 0.460, p = 0.711) or differences between treatments for the entire test (F[3, 111] = 1.937, p = 0.128). However, post hoc analysis revealed that animals exposed to chemical stimuli traveled more in the dark area during the first half, compared to the control (p = 0.010) and the group exposed to visual stimuli (p = 0.023). No difference was observed between the treatments during the second half.
We counted the number of transitions between the bright and dark areas during the first half (control: 0.35, SE = 0.166; chemical: 2.36, SE = 0.838; visual: 0.72, SE = 0.278; and chemical and visual: 0.76, SE = 0.357) and second half (control: 0.88, SE = 0.343; chemical: 3.50, SE = 0.993; visual: 1.92, SE = 0.574; and chemical and visual: 2.84, SE = 0.877). Measurement time had an effect on the number of transitions between the first and second half of the test (F[1, 111] = 24.085, p < 0.001).
The number of transitions increased, except for the control group (control: p = 0.308; chemical: p = 0.026; visual: p = 0.009; and chemical and visual: p < 0.001). The interactions between time and treatments (F[3, 111] = 0.1.427, p = 0.239) were nonsignificant, but we observed a difference between treatments (F[3, 111] = 2.859, p = 0.040). Post hoc analysis showed that during the first half, the group exposed to chemical stimuli completed a higher number of transitions compared to the other groups (control: p = 0.005; visual: p = 0.012; and chemical and visual: p = 0.025) (Fig. 3C).
Open field test
We measured the distance traveled in the open field during the first time interval (control: 308.5 cm, SE = 47.77; chemical: 399.8 cm, SE = 43.90; visual: 255.8 cm, SE = 24.61; and chemical and visual: 235.0 cm, SE = 36.24), second (control: 346.8 cm, SE = 38.61; chemical: 443.0 cm, SE = 40.14; visual: 321.4 cm, SE = 33.78; and chemical and visual: 336.1 cm, SE = 32.97), and third (control: 309.2 cm, SE = 34.84; chemical: 430.9 cm, SE = 38.25; visual: 342.6 cm, SE = 36.77; and chemical and visual: 380.28 cm, SE = 27.32) (Fig. 3D).
The effect of measurement time on swimming activity was significant (F[1.61, 138.70] = 21.998, p < 0.001). Increments in the distance traveled occurred between the first and second intervals (control: p = 0.122; chemical: p = 0.055; visual: p = 0.002; and chemical and visual: p < 0.001). Between the second and third intervals, the distance traveled also increased in the individuals exposed to both stimuli (p = 0.005), but decreased in the control group (p = 0.040). No significant difference was observed in the other groups (chemical: p = 0.463 and visual: p = 0.170).
There was an interaction between time and treatments in terms of distance traveled during the test (F[4.84, 138.70] = 4.109, p = 0.002), but no difference between the treatments for the entire test (F[3, 86] = 2.648, p = 0.054). The post hoc analysis showed that the individuals exposed to chemical stimuli traveled more than the groups exposed to visual stimuli during the first interval (visual: p = 0.007 and chemical and visual: p = 0.002) and second (visual: p = 0.018 and chemical and visual: p = 0.036). The group exposed to chemical stimuli also traveled more than the control during the last interval (control: p = 0.022). No significant difference was observed between the other groups.
We measured the proportion of time when the animal was not moving (freezing) during the first time (control: 49.0%, SE = 7.64; chemical: 37.6%, SE = 6.06; visual: 53.8%, SE = 4.58; and chemical and visual: 59.4%, SE = 5.85), second (control: 39.5%, SE = 6.80; chemical: 26.3%, SE = 5.71; visual: 41.7%, SE = 5.79; and chemical and visual: 40.1%, SE = 5.29), and third interval (control: 38.3%, SE = 6.75; chemical: 25.4%, SE = 5.44; visual: 38.3%, SE = 6.44; and chemical and visual: 30.8%, SE = 4.04) (Fig. 3E). The proportion of time freezing decreased according to the time measurements (F[1.73, 148.78] = 53.215, p < 0.001). Lower freezing was observed between the first and last interval for all treatments (control: p = 0.019; chemical: p = 0.003; visual: p < 0.001; and chemical and visual: p ≤ 0.001).
During the first interval, freezing was lower in the animals exposed only to chemical stimuli compared to the other groups, except for the control group (control: p = 0.206; visual: p = 0.051; and chemical and visual: p = 0.009). No significant difference was observed between the other groups. There was a significant interaction between freezing and treatments (F[1.73, 148.69] = 3.036, p = 0.011), but no difference between treatments for the entire test (F[3, 86] = 1.589, p = 0.198), such that no difference between treatments was observed during the last interval. The distance traveled and the proportion of time when the subjects were immobile were negatively correlated (Fig. 3G; r = −0.957, p ≤ 0.001, N = 90).
We measured the proportion of time spent in the central zone of the arena during the first time (control: 83.4%, SE = 4.31; chemical: 69.1%, SE = 4.76; visual: 78.0%, SE = 4.07; and chemical and visual: 84.3%, SE = 3.05), second (control: 73.6%, SE = 6.24; chemical: 56.5%, SE = 5.13; visual: 69.0%, SE = 5.45; and chemical and visual: 71.8%, SE = 4.44), and third interval (control: 69.0%, SE = 6.29; chemical: 47.6%, SE = 5.80; visual: 60.6%, SE = 6.16; and chemical and visual: 67.1%, SE = 3.79) (Fig. 3F).
The measurement time influenced the time spent in the central area (F[1.91, 163.80] = 44.960, p < 0.001). There was a significant reduction in the time spent in the central area between the first and second intervals in all groups (control: p = 0.011; chemical: p < 0.001; visual: p = 0.006; and chemical and visual: p < 0.001) and between the second and third intervals in groups exposed only to chemical or visual stimuli (control: p = 0.236; chemical: p = 0.011; visual: p = 0.011; and chemical and visual: p = 0.144).
The interactions between time and treatments were nonsignificant (F[1.91, 163.80] = 0.398, p = 0.872), but there was a difference between the treatments (F[3, 86] = 3.117, p = 0.030). Post hoc analysis reveals that during each of the three intervals, the individuals that were only exposed to chemical stimuli spent less time in the central zone than the control group and the group exposed to both stimuli (control: p < 0.034; visual: p > 0.091; and visual and chemical: p < 0.038).
No significant difference was observed between the other groups. In general, the distance traveled and the time spent in the central area were negatively correlated (Fig. 3H; r = −0.607, p < 0.001, N = 90), but we did not find such a significant relationship in the group that was only exposed to chemical stimuli (control: r = −0.533, p = 0.023, N = 18; chemical: r = −0.384, p = 0.071, N = 23; visual: r = −0.796, p = 0.000, N = 24; and chemical and visual: r = −0.599, p = 0.002, N = 25). In general, differences in swimming behaviors at different time points produced recognizable exploratory patterns (Fig. 4).

Common exploratory patterns during the OFT (15 min, 3 different subjects).
Discussion
Light/dark preference test
In zebrafish, the LDPT is commonly used to measure anxiety behaviors based on the natural avoidance of bright areas. The ability to make choices (phototaxis/scototaxis paradigm) engages distinct brain regions whose functions are significant to ensure individual welfare. 59 The alteration of brain functions and physiological stress may elicit abnormal behaviors in prey/predator situations. The use of the LDPT with adults and larvae across different fish species shows that phototaxis/scototaxis preference can be interpreted as a marker of anxiety in terms of predation avoidance and exploratory behaviors.60,61
Freezing behavior is reported in zebrafish in response to white-induced anxiety. 62 Accordingly, anxiolytic and anxiogenic drugs can alter the innate preference for dark and bright areas, although the scope of the stress response remains unclear (reviewed in Lachowicz et al. 63 ). Chronic exposure to fluoxetine increased the time spent in the bright area in zebrafish 64 and zebrafish exposed to acute fluoxetine concentrations had lower cortisol levels. 65 However, acute exposure to fluoxetine increased the time spent in the dark area. 66
Our results show a clear preference for the bright area in marine medaka, supporting the use of the phototaxis paradigm also in this species. In previous studies, Wang et al. found no phototaxis preference in adult O. melastigma (control group), but fish that were exposed to 1800 ppm CO2 for 7 days significantly displayed a preference for the dark zone during a short period. 50
Lucon-Xiccato et al. attributed the lack of a clear phototaxis/scototaxis response in O. latipes to the light body coloration that reduces their visibility in their natural habitat. 29 Differences in body coloration can affect survival behavior of medaka species. 67 Inversely, exposure to diuron, a potential stressor, increased the time spent in the bright area, also in O. melastigma. 51 Ansai et al. determined that chronic fluoxetine treatment induced anxiolytic responses (lower freezing and territorial aggression) in O. latipes, and the animals spent more time in the bright area with or without exposure. 49
Behavioral differences can be attributed to ecological adaptations across species, but nonstandardized conditions for the LDPT should also be considered. In our study, the housing conditions of animals were similar to the bright area of the LDPT, without shelter or dark-color elements. In zebrafish, although results vary between studies, a preference for either dark or bright environments is generally detected. 68 However, experimental conditions such as light intensity, olfaction, 69 circadian clock, 70 water column depth, 71 presence of conspecifics, 72 and background shade 73 may influence phototaxis/scototaxis behavior. A detailed investigation of how these factors influence the behavior of O. melastigma would be required to better understand the temporal response during the LDPT.
Our results show that the initial avoidance of the dark area in the marine medaka decreases over time, which corroborates similar observations in O. latipes by Lucon-Xiccato et al. 54 The proportion of time, distance traveled in the dark area, or number of transitions increased in all groups, except for the control group, thus indicating an increase in exploratory behaviors. A similar behavior is also observed in O. latipes, where male individuals generally prefer a bright environment during the LDPT, but the display of a neighboring conspecific encourages risk-taking behaviors, thus spending more time in the dark environment. 74 Visual stimuli alone or in combination with chemical stimuli did not increase the time spent in the bright area. However, the distance traveled in the dark area and number of transitions significantly increased, suggesting rapid incursions.
We did not find any significant interaction between time and treatments in terms of time spent in bright areas, distance traveled, or number of transitions. The progressive exploration of the dark area may indicate that the novel environment and prior handling induced a stress response and the animals needed a certain time to recover, regardless of the treatment. This may also indicate that social isolation was not a stressor in this species, that it was a stressor, but that visual/chemical cues did not attenuate the stress response, or that the LDPT failed to detect the stress response.
Nevertheless, the differences detected between treatments suggest that the groups exposed to chemical stimuli were keener to explore the dark area, although for short swims. Our results also suggest that exposure to chemical cues may modulate the stress attributed to social isolation or favor the exploration of the novel environment. It is possible that, given a longer trial duration, we would have observed a transition toward the dark area in all groups, but at different time points. In future research, extended trial duration should seek to detect temporal patterns in phototaxis behavior.
Open field test
The OFT measures anxiety behaviors related to a presumably stressful novel environment. 75 Swimming activity (and stationary behaviors) and thigmotaxis (preference for the periphery of the open field) indicate differences between individuals in coping with the novel environment. The fish exposed to chemical cues initially showed more swimming activity than groups exposed to visual or both stimuli and spent less time in the periphery than all other groups during the last interval. Lucon-Xiccato et al. interpret the freezing behavior in O. latipes during the OFT as a stress response. 54
They also observe that adult fish swim close to the edges, suggesting possible spatial cues for navigation. Thigmotaxis may be interpreted as a defensive behavior against potential predators. In zebrafish, animals treated with fluoxetine spent more time in the central area of the open field, thus suggesting an indicator of boldness. 76 Ansai et al. also observed the increase of time spent in the center area of the open field in marine medaka with a chronic fluoxetine treatment. 49 Our results suggest that chemical cues mitigated the stress response to the novel environment: the animals were initially more active and went on to explore the center area. Exposure to chemical cues may have incited the animals to reach the social stimuli, as seen in zebrafish, 30 thus encouraging risk-taking behaviors. Further behavioral assays, such as the Y-maze choice paradigm, could quantify the preference (or avoidance) of chemical cues.
Our study also shows that swimming behavior affects thigmotaxis. In terms of distance traveled, less active animals spent more time in the central area, while completely immobile, and the more active ones spent more time close to the edges. We observed a correlation between distance traveled and the time spent in the periphery in all groups, except in the fish exposed to chemical cues, thus suggesting different exploratory patterns and conflicting behaviors.
On the one hand, freezing animals spent more time in the central area. In zebrafish, despite scototaxis behaviors, dark environments elicited more thigmotaxis than bright ones. 77 Schnörr et al. suggested that, in ecological settings, since predators can detect changes in illumination, zebrafish larvae chose brighter environments to avoid the potential transition between bright and dark environments, and contrast against a dark background. 78 In our study, the brightness of the OFT may have incited the animal to initially freeze in the central area. On the other hand, the animals generally explored the novel environment by swimming close to the edge, while bolder fish, which were actively swimming in the central area, also traveled greater distances in total. Accordingly, thigmotaxis increased during testing, which is consistent with previous studies in Oryzias javanicus 57 and O. latipes. 29
While increased activity may be associated with the anxiolytic effects of chemical cues, this effect was not visible in the group exposed to both stimuli (the group exposed to chemical stimuli also traveled more than the control group during the last interval). Chemical and visual stimuli, alone or in combination, may produce different behavioral endpoints. In the OFT, exposure to visual stimuli might have inhibited, for a certain time, the anxiolytic effects of chemical cues.
As such, we noted that the animals exposed to both stimuli gradually became more active throughout the test: in that group, the distance traveled significantly increased between each time interval. This progressive exploration in the group exposed to visual and chemical stimuli points at different sets of behaviors (freezing and exploration) in response to different types of social cues and stressors in O. melastigma. For example, in O. latipes, Otsuka et al. found that physical contact among males was more stressful than isolation, 26 and Wang and Takeuchi postulated that the ability of O. latipes to perform individual recognition shapes their social behaviors. 32
On the one hand, our study does not discriminate between the stress response attributed to social isolation, to the novel environment (including handling), and to an unfamiliar social situation. The visual contact in a “crowded” setup may have induced additional stress compared to the treatment with chemical cues. Alternatively, as seen in the Atlantic salmon, 20 social isolation might have affected the willingness to approach conspecifics. On the other hand, the animals received chemical and visual cues that did not come from familiar individuals. Without the recognition of social partners, which could be effective at buffering the stress response as seen in zebrafish, 79 test subjects could be sensitive to the stress level of the model animals, which influenced shoaling and anxiety-like behaviors.
We observed different swimming patterns between the LDPT and OFT. The group exposed to both stimuli cues was the most active (distance traveled) during the LDPT, but was initially the least active during the OFT. In addition, the group exposed to chemical stimuli traveled more during the OFT compared to the other treatments, but not during the LDPT. Visual and chemical stimuli could have specific effects on anxiety-related behaviors in regard to the avoidance of the dark area and the exploration of unfamiliar environments. In our experiment, we used model animals for chemical and visual stimuli from a different group, but belonging to the same cohort.
The type of chemical or visual cues was not systematically identified or quantified. It is unknown whether they were interpreted as alarm signals or social cues, or a combination of both. For instance, in zebrafish, social fear learning relies on chemical and visual cues from conspecifics80–83 and the perceived stress from others can alter individual behavior. 84 The response depends on the type of the cue and combination of information. Visual and chemical cues from conspecifics can also act as a “social buffer” in zebrafish as they can lower fear response. 85 It is possible that the lack of visual familiarity or social fear contagion affected exploratory behaviors momentarily, or inversely, species-specific chemical cues favored exploration. Further characterization of chemical and visual cues would be necessary to assess and confirm the behavioral observations in this study.
Ecological and methodological implications
Our results show that visual and chemical stimuli are involved in social and spatial recognition and can induce different behavior in the marine medaka. For instance, the stimuli could mitigate the stress response to the novel environment and, at the same time, provide potential information to find conspecifics. In zebrafish, the animals spend more time in a compartment where no fish is visible, but where they smell the presence of conspecifics, 35 although visual and olfactory stimuli contribute to discriminating between familiar and new individuals. 86 In O. latipes, visual cues alone are sufficient for individual recognition 32 and for inducing or impeding shoaling behaviors. 31
While the effects of each sensory modality have yet to be identified in the marine medaka, both stimuli seem to influence exploratory behaviors or modulate the stress response. It is also worth noting that the experiments were run with one fish at a time to avoid possible confounding effects of interaction with conspecific cues during trials. Still, it is possible that exposure to chemical and visual cues after social isolation may also modulate shoaling behavior and more experiments would be needed to test this hypothesis.
Changes in the environment may induce physiological responses, thus eliciting abnormal behaviors in marine organisms. For example, marine medaka larvae exposed to elevated CO2 levels displayed abnormal development, such as otolith calcification 87 or eye and brain defects, 50 and such impairments can negatively affect escape behaviors. In O. melastigma, elevated CO2 concentrations affect the escape behavior of newly hatched larvae, which become more vulnerable to predation. 88 In juveniles and adults, significant mortality was observed after short-term exposure to CO2-induced pH below 5.70. 89 In teleost fishes, pheromone detection is associated with olfactory receptors and chemosensory neuron pathways.90,91
Accordingly, Porteus et al. suggest direct physiological and molecular mechanisms in the olfactory system of sea bass fish to explain altered behaviors under elevated CO2 concentrations. 8 Our results suggest that changes in the quality of chemical communication (during the production and reception of odorants or the alteration of the molecule itself and its interaction with corresponding receptors) could impact the behavior in marine medaka. Medaka species are susceptible to predation 67 and visual predators. 92 Shoaling behaviors may provide chemical cues that incite the animals to explore their environment. While unfed animals could be more vulnerable in bright or open areas, alteration in chemical communication could potentially affect hunger and prey tracking behaviors.
The phototaxis and thigmotaxis paradigms have not been thoroughly investigated in medaka species and interspecific behavioral variability has been regularly observed.39,93 Furthermore, it is unclear to what extent short-term social isolation induces behavioral stress in these species. Otsuka et al. did not assess behavioral changes in O. latipes after social isolation, 26 and no such study had been previously carried out in marine medaka. In zebrafish, Shams et al. observed different swimming behaviors in animals with no social experience, but surprisingly, long-term social deprivation decreased anxiety-related behaviors during the OFT. 21
Moreover, acute social competition in zebrafish, such as fighting interaction, may elicit a higher stress response than in isolated control animals. 94 However, either in zebrafish or medaka, experimental conditions have not been standardized and the LDPT and OFT fostered diverse interpretations from different designs. This study contributes to clarifying the interpretation of the LDPT and OFT in relation to social stressors and social cues in the marine medaka.
Conclusions
In this study, we tested the effects of visual and chemical cues in a putative stress response to social isolation. Chemical stimuli may have modulated the stress response attributed to social isolation or from the stress induced during the tests, as it stimulated exploratory behaviors. The LDPT did not detect a clear response to either chemical or visual cues in marine medaka in terms of time spent in each zone. Nevertheless, increasing total distance traveled and transitions indicated that the animals became keener to explore the novel environment during the test and that this was more pronounced in animals exposed to chemical stimuli. Moreover, there was a clear phototaxis across all tested groups. The OFT supports the observations made from the LDPT, indicating that chemical stimuli increased exploration behaviors, in terms of distance traveled and reduced thigmotaxis.
Taken together, our results suggest that chemical communication plays a significant role in the social behavior and welfare of the species, although the chemical compounds and physiological mechanisms involved remain to be identified. We have shown that the OFT would be appropriate to assess the impact of different factors, such as ocean acidification, on chemical communication and behavior in marine medaka. Despite a strong phototaxis response, further research should seek to standardize the LDPT.
Footnotes
Acknowledgments
We wish to thank Dr. Xiaona ZHANG from Ocean University of China for providing the original batch of the marine medaka.
We would like to thank two anonymous reviewers for their time spent on reviewing our article and careful reading. We sincerely appreciate all insightful comments and suggestions, which lead us to improve the quality of the article.
Authors' Contributions
A.L.: Conceptualization and methodology (supporting); investigation (lead); formal analysis (lead); writing—original draft (lead); writing—review and editing (lead); and visualization. L.Z.: Writing—review and editing (supporting); D.G.: Conceptualization and methodology (lead); formal analysis (supporting); writing—review and editing (supporting); and project administration and funding acquisition. All authors have read and agreed to the published version of the article.
Disclosure Statement
No competing financial interests exist.
Funding Information
This work was supported by the Macao Science and Technology Development Fund, project 0001/2020/AFJ, and the National Natural Science Foundation of China project 42061160365.