




Abstract
Animal models are an important tool for studying noncommunicable diseases (NCDs) as they provide a unique opportunity to investigate real-time changes that occur in the onset of, and during, the diseased state. This is of particular importance given that the global prevalence of NCDs, such as type 2 diabetes mellitus (T2DM), is rising at an alarming rate. In South Africa, which has one of the highest levels of HIV in the world, the incidence of T2DM is thought to be associated, in part, with exposure to combination antiretrovirals. We report on the establishment of both nonobese and obese zebrafish models of T2DM, as well as associated changes in mRNA expression of preproinsulin and phosphoenolpyruvate carboxykinase (pck) 1 and 2. The diabetic state was achieved by either immersing adult zebrafish in a 2% glucose solution for 40 days or by overfeeding adult zebrafish for 10 weeks. Glucose immersion resulted in significantly elevated fasting blood glucose levels twice as high as control, whereas bodyweight did not change significantly (nonobese model). Overfeeding led to both significantly elevated fasting blood glucose and bodyweight compared with control (obese model). Both models were characterized by significantly increased preproinsulin mRNA expression indicating insulin resistance; mRNA expression of metabolic enzymes PCK 1 and 2 was also significantly upregulated, as seen in diabetic patients. These candidate gene expression changes, similar in both zebrafish models, establish a baseline that can be utilized to investigate the underlying mechanisms driving the increased T2DM incidence, using an excellent alternative to traditional rodent models.
Introduction
Globally, more than 536 million people live with diabetes, a figure that is estimated to rise to 783 million by 2045. 1 More than 90% of all diabetes cases are classified as type 2 diabetes mellitus (T2DM). During the onset of T2DM, cells of the muscle, liver, and adipose tissue become insensitive to insulin (also referred to as insulin resistance) triggering beta cells of the pancreas to produce more insulin; over time pancreatic beta cells become exhausted or damaged, ultimately leading to reduced insulin production and chronic high blood glucose levels (hyperglycemia). 2 Sustained hyperglycemia is used as clinical evidence of diabetes for diagnostic purposes. Multiple factors influence an individual’s diabetic predisposition, including age, bodyweight, family genetics, diet, and medication, among others. 3 T2DM heredity is more complex, but involves variations in a cluster of genes (mostly associated with pancreatic –beta cell function and insulin action) that make individuals more susceptible to developing the disease. 4 Weight gain, or more specifically visceral-abdominal adipose tissue accumulation, is a major contributor to insulin insensitivity; hence most T2DM patients are therefore overweight or obese.2,5 Bodyweight reduction has therefore been shown to improve glycemic control and reduce the risk of cardiovascular complications in diabetic patients. 6 Although there has been positive advancement in antidiabetic medication, most options are not accompanied by a reduction in bodyweight; some medication (sulfonylureas, insulin, and thiazolidinediones) may even promote weight gain.5,7
Animal models of impaired glucose metabolism are an important tool for studying T2DM development as they provide a unique opportunity to investigate real-time changes that occur in the onset of, and during, the diseased state. Various models of T2DM exist, including diet-induced, 8 chemical-induced, 9 and genetic knockouts or transgenic manipulated models.10,11 Many of these models utilize rodents 12 or large mammals such as pigs and primates. 9
The zebrafish (Danio rerio) has gained prominence as an ideal animal model for human diseases, including diabetes.13,14 Zebrafish metabolism and organ physiology are similar to mammals; zebrafish share 70% of their genetic makeup with that of humans, the majority of these genes are associated with human diseases.13,15 A number of zebrafish models of diabetes have been developed using either larvae 16 or adult zebrafish and involve diet-based approaches, glucose induction, chemical or genetic approaches, or a combination of these.17–19 Glucose, diet, or chemical induction are cost-effective, easy to implement, and more relevant as most human T2DM is primarily driven by nongenetic factors such as lifestyle and medication, rather than single gene modifications. 20 Based on previous studies, symptoms of T2DM can be induced in adult zebrafish with chronic immersion in a 2%–4% glucose solution over a period of 2–8 weeks of induction, 21 whereas diet-induced models take 6–10 weeks. 19
The glucose induction model of adult zebrafish is usually associated with hyperglycemia, insulin resistance, and diabetic retinopathy similar to that seen in diabetic humans. 22 The immersion of zebrafish in a glucose solution is the most commonly utilized method of inducing hyperglycemia and T2DM in zebrafish. 19 Embryo models are more adaptive to changes in glucose concentration in their surrounding environment and thus often require a stepwise increase in glucose concentration from 1% up to 3%. 23 Adult zebrafish, in contrast, are more susceptible to chronic immersion in fixed glucose concentrations, and exposure to concentrations above 2% for extended periods can be lethal. 24 The exposure period is therefore dependent on the glucose concentration and tends to be shorter when used above 2%. 23
Overfeeding protocols as an approach to developing models of obesity and T2DM do exist in zebrafish and vary depending on the type of feed used. 19 Fish overfed with Artemia display an increased bodyweight and plasma triglyceride levels after 8 weeks, 25 whereas overfeeding a high-fat diet comprising brine shrimp and 1% egg yolk for 10 weeks can induce T2DM accompanied by weight gain and insulin resistance in zebrafish. 26 Another zebrafish diet-induced obesity (DIO) model was established by Zang et al. (2017) 27 using a commercially available fish food known as Otohime; this study demonstrated that overfeeding with Otohime B2 (a high-protein, high-fat containing food) can induce early stages of insulin resistance in zebrafish, similar to that seen in humans, characterized by weight gain, high fasting blood glucose, and impaired glucose tolerance. The advantage of this approach is that significant weight gain and elevated fasting blood glucose levels are evident in the adult zebrafish within 6 weeks of overfeeding.
Although numerous zebrafish models of T2DM exist, to our knowledge, mRNA expression levels of candidate genes have not been reported in these models. These baseline data are critical for the purposes of increasing our understanding of the underlying mechanism driving the observed increase in T2DM prevalence. The most obvious candidate, insulin, is synthesized as preproinsulin and subsequently processed in the endoplasmic reticulum to insulin. 28 Insulin mediates glucose uptake and is therefore essential for regulating blood glucose levels and maintaining glucose homeostasis after a meal. 29 The insulin released is directly proportional to the amount of glucose consumed; a prolonged state of excessive glucose or carbohydrate consumption (including high fat and protein diets) overburdens the pancreas to produce more insulin, which eventually exhausts the capacity of the tissues, leading to a diabetic state. 29 Insulin does not only control blood glucose uptake but also regulates endogenous glucose production in the liver through gluconeogenesis; this involves the activity of the metabolic enzyme phosphoenolpyruvate carboxykinase (PCK). 30 Elevated PCK expression has been associated with increased blood glucose levels and seen as an indicator of the diabetic state in zebrafish; however, PCK has only been investigated in larvae. 31
The aim of the current study was therefore to establish zebrafish models of T2DM using glucose induction and overfeeding protocols that mimic nonobese (glucose) and obese (overfed) diabetic complications.18,23 Once established, the expression of selected candidate genes (including insulin and phosphoenolpyruvate carboxykinase) was assessed to establish a baseline of gene expression changes that are known to be associated with the diabetic state. This represents the first time these models have been established in South Africa, thereby serving as a guide for local researchers wishing to utilize similar approaches when studying obesity and T2DM.
Materials and Methods
Animals
All animal procedures were approved by the Animal Research Ethics Committee (AREC; protocol reference number AREC/00005213/2023) of the University of KwaZulu-Natal (UKZN). Male and female zebrafish were maintained in the UKZN Zebrafish Research Facility at 28.5°C in tanks of the IWAKI system (Iwaki Aquatic Systems and Services, Massachusetts, USA) containing reverse osmosis water under a blue-light cycle of 14-h light/10-h dark period.
The glucose-induced nonobesity model
Healthy adult (4–6 months old) male and female zebrafish were assigned to tank water in the presence or absence of 2% glucose at densities of 6–7 fish per 2.5 L (Fig. 1A). The fish were exposed to these conditions for 40 days with water and glucose solutions changed every second day. On day 40, the fish were fasted for 12 h after which they were anesthetized on ice and weighed before blood was drawn to determine fasting blood glucose using a glucometer (Accu-Chek Instant, Roche, Germany). Whole carcasses were homogenized in TRIzol (Cat no. 15596026, Life Technologies, California, USA), and the supernatant utilized to isolate total RNA using the PureLink RNA Extraction Mini Kit (Cat no. 12183018A, Life Technologies, California, USA). cDNA was synthesized for quantitative polymerase chain reaction (qPCR) using the Invitrogen SuperScript (IV) first-strand synthesis system (Cat no. 18091050, Thermo-Fisher Scientific, Massachusetts, USA).
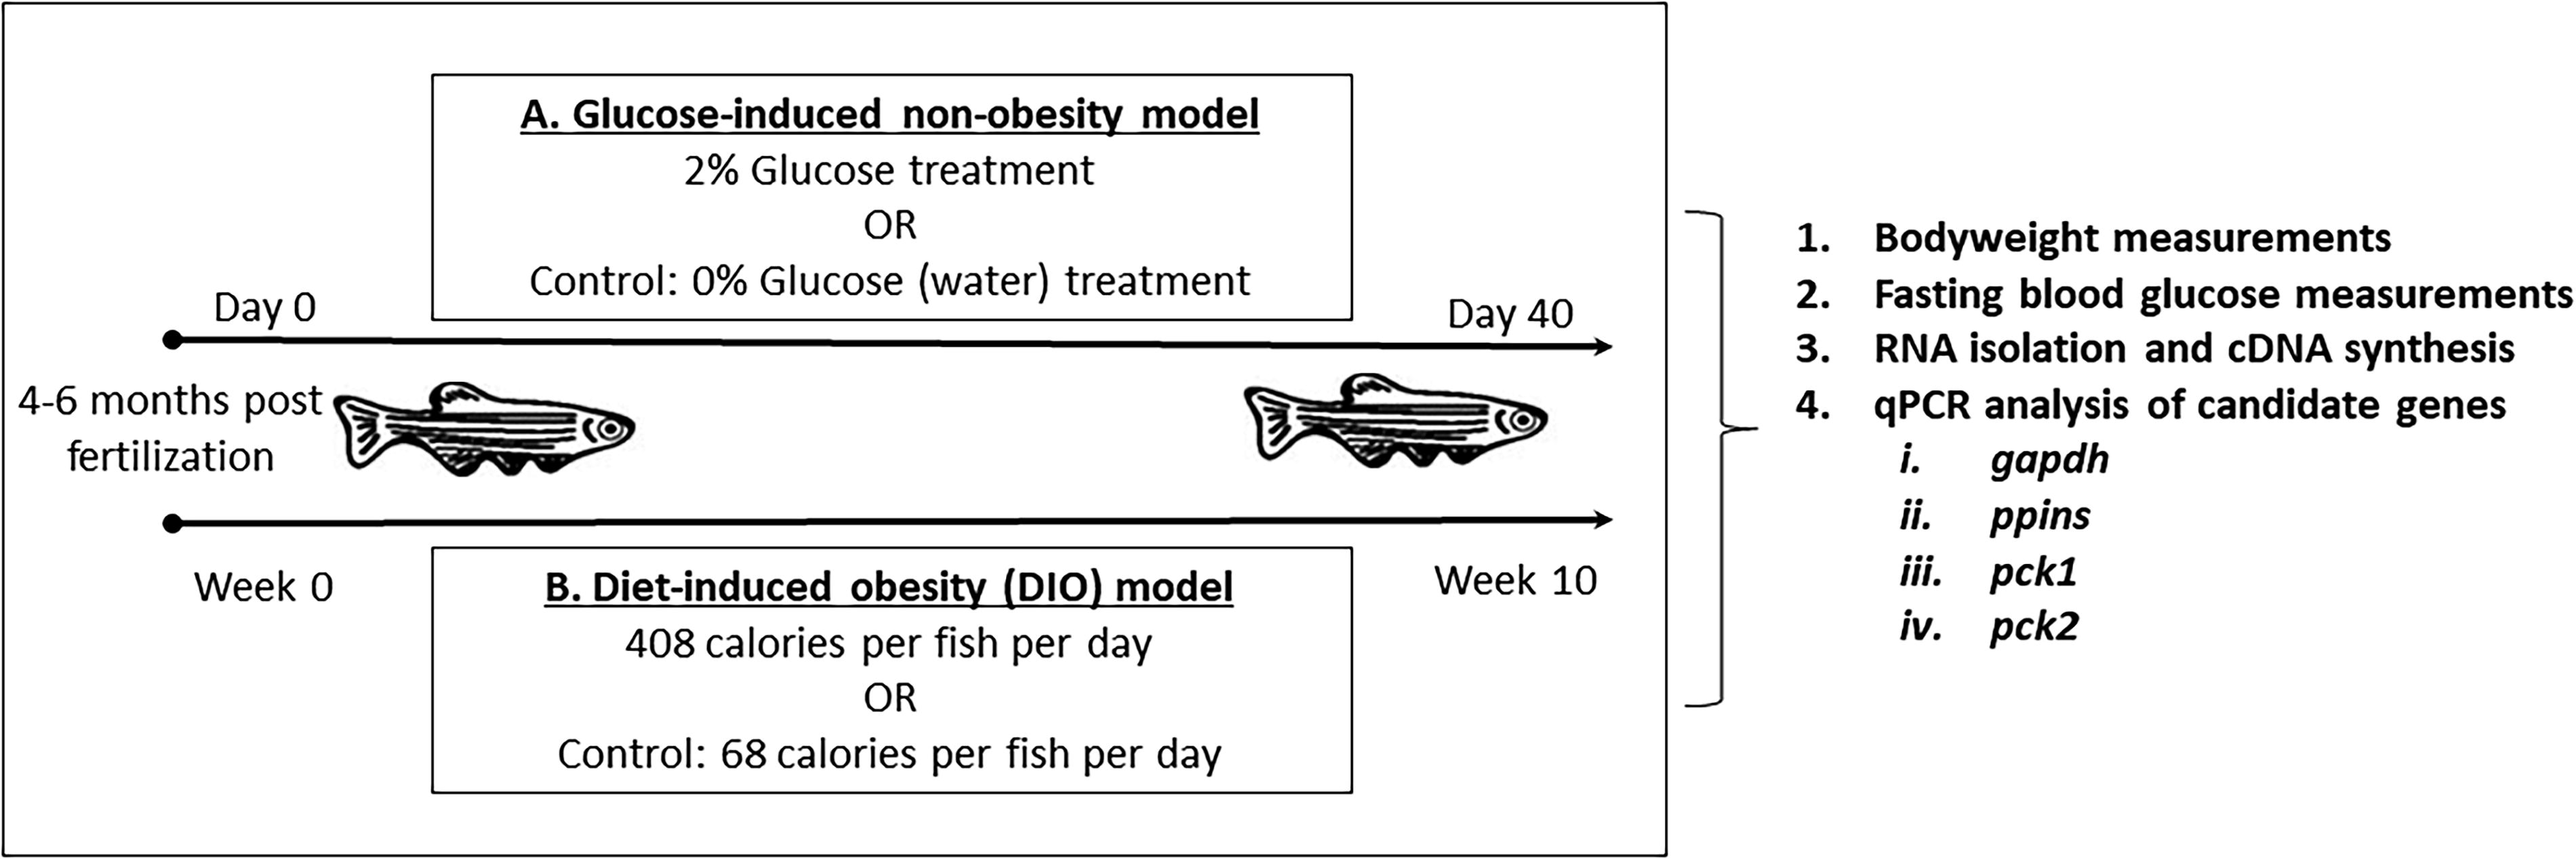
Experimental approach to establishing type 2 diabetes mellitus (T2DM) zebrafish models. Adult zebrafish [4–6 months postfertilization (pf), males and females] were
DIO model
Healthy adult (4–6 months old) male and female zebrafish were assigned to either an overfeeding group or a control group at densities of 6–7 fish per 2.5 L (Fig. 1B). So-called DIO fish were hand-fed 120 mg commercially available fish food (Otohime B2; Marubeni Nisshin Feed, Tokyo, Japan) per fish per day (408 calories per fish per day). This was divided into six daily feedings spaced out every 1.5–2 h; Otohime B2 contains 11% fats, 51% protein, 3% fiber, 2.3% calcium, and 6.5% moisture. The control group was fed a single 20 mg per fish per day (68 calories per fish per day). Fish were weighed at week 6, 7, 8, 9, and 10 before feeding. At week 10, fish were fasted for 12 h and anesthetized on ice after which blood was drawn for fasting blood glucose measurements. Whole carcasses were then prepared in TRIzol (Cat no. 15596026, Life Technologies, California, USA) and utilized to isolate total RNA using the PureLink RNA Extraction Mini Kit (Cat no. 12183018A, Life Technologies, California, USA) followed by cDNA synthesis for qPCR.
qPCR analysis
The mRNA expression levels of glyceraldehyde 3-phosphate dehydrogenase (gapdh); beta-actin (β-actin); zebrafish preproinsulin (ppins); and phosphoenolpyruvate carboxykinase 1 and 2 (pck1 and pck2) were assessed. Using the PowerUp SYBR Green Master Mix (Cat no. A25742; Applied Biosystems, Massachusetts, USA), the signal was analyzed using the QuantStudio design and analysis software (Applied Biosystems, Massachusetts, USA). The primer sequences used to detect β-actin and ppins,
31
gapdh,
32
and pck1 and pck2
33
are listed in Table 1; all primers were obtained from Inqaba Biotechnical Industries (Pretoria, South Africa) and achieved efficiencies of between 90% and 100%. The specificity of each PCR was checked with a melting curve analysis. Relative gene expression levels or fold-changes were determined by calculating 2-ΔΔCt; β-actin was used as the reference gene.
Primers Used for qPCR Analysis of Zebrafish Gene Expression
qPCR, quantitative polymerase chain reaction.
Statistical analysis
All results are represented as means with their standard deviation. Data were analyzed using the Student’s t-test or one-way analysis of variance with multiple comparisons depending on the number of comparisons. A p value < 0.05 was considered significant.
Results
Extended exposure of adult zebrafish to 2% glucose significantly raises fasting blood glucose levels
To model a glucose-induced diabetic state, adult zebrafish were exposed to a 2% glucose solution for a period of 40 days as described by McCarthy et al. (2021). 21 On day 40, the fasting blood glucose levels were assessed, and bodyweight was measured. Although some fish in the experimental group had a slightly higher bodyweight, there was no overall significant change in bodyweight of the experimental group compared with the control group (Fig. 2A). Fasting blood glucose levels were, however, found to be significantly higher (p < 0.01) in the experimental group (4.0 ± 0.7 mmol/L) compared with the control group (2.3 ± 0.2 mmol/L), indicating that long-term exposure of zebrafish to 2% glucose solution induced hyperglycemia (Fig. 2B).
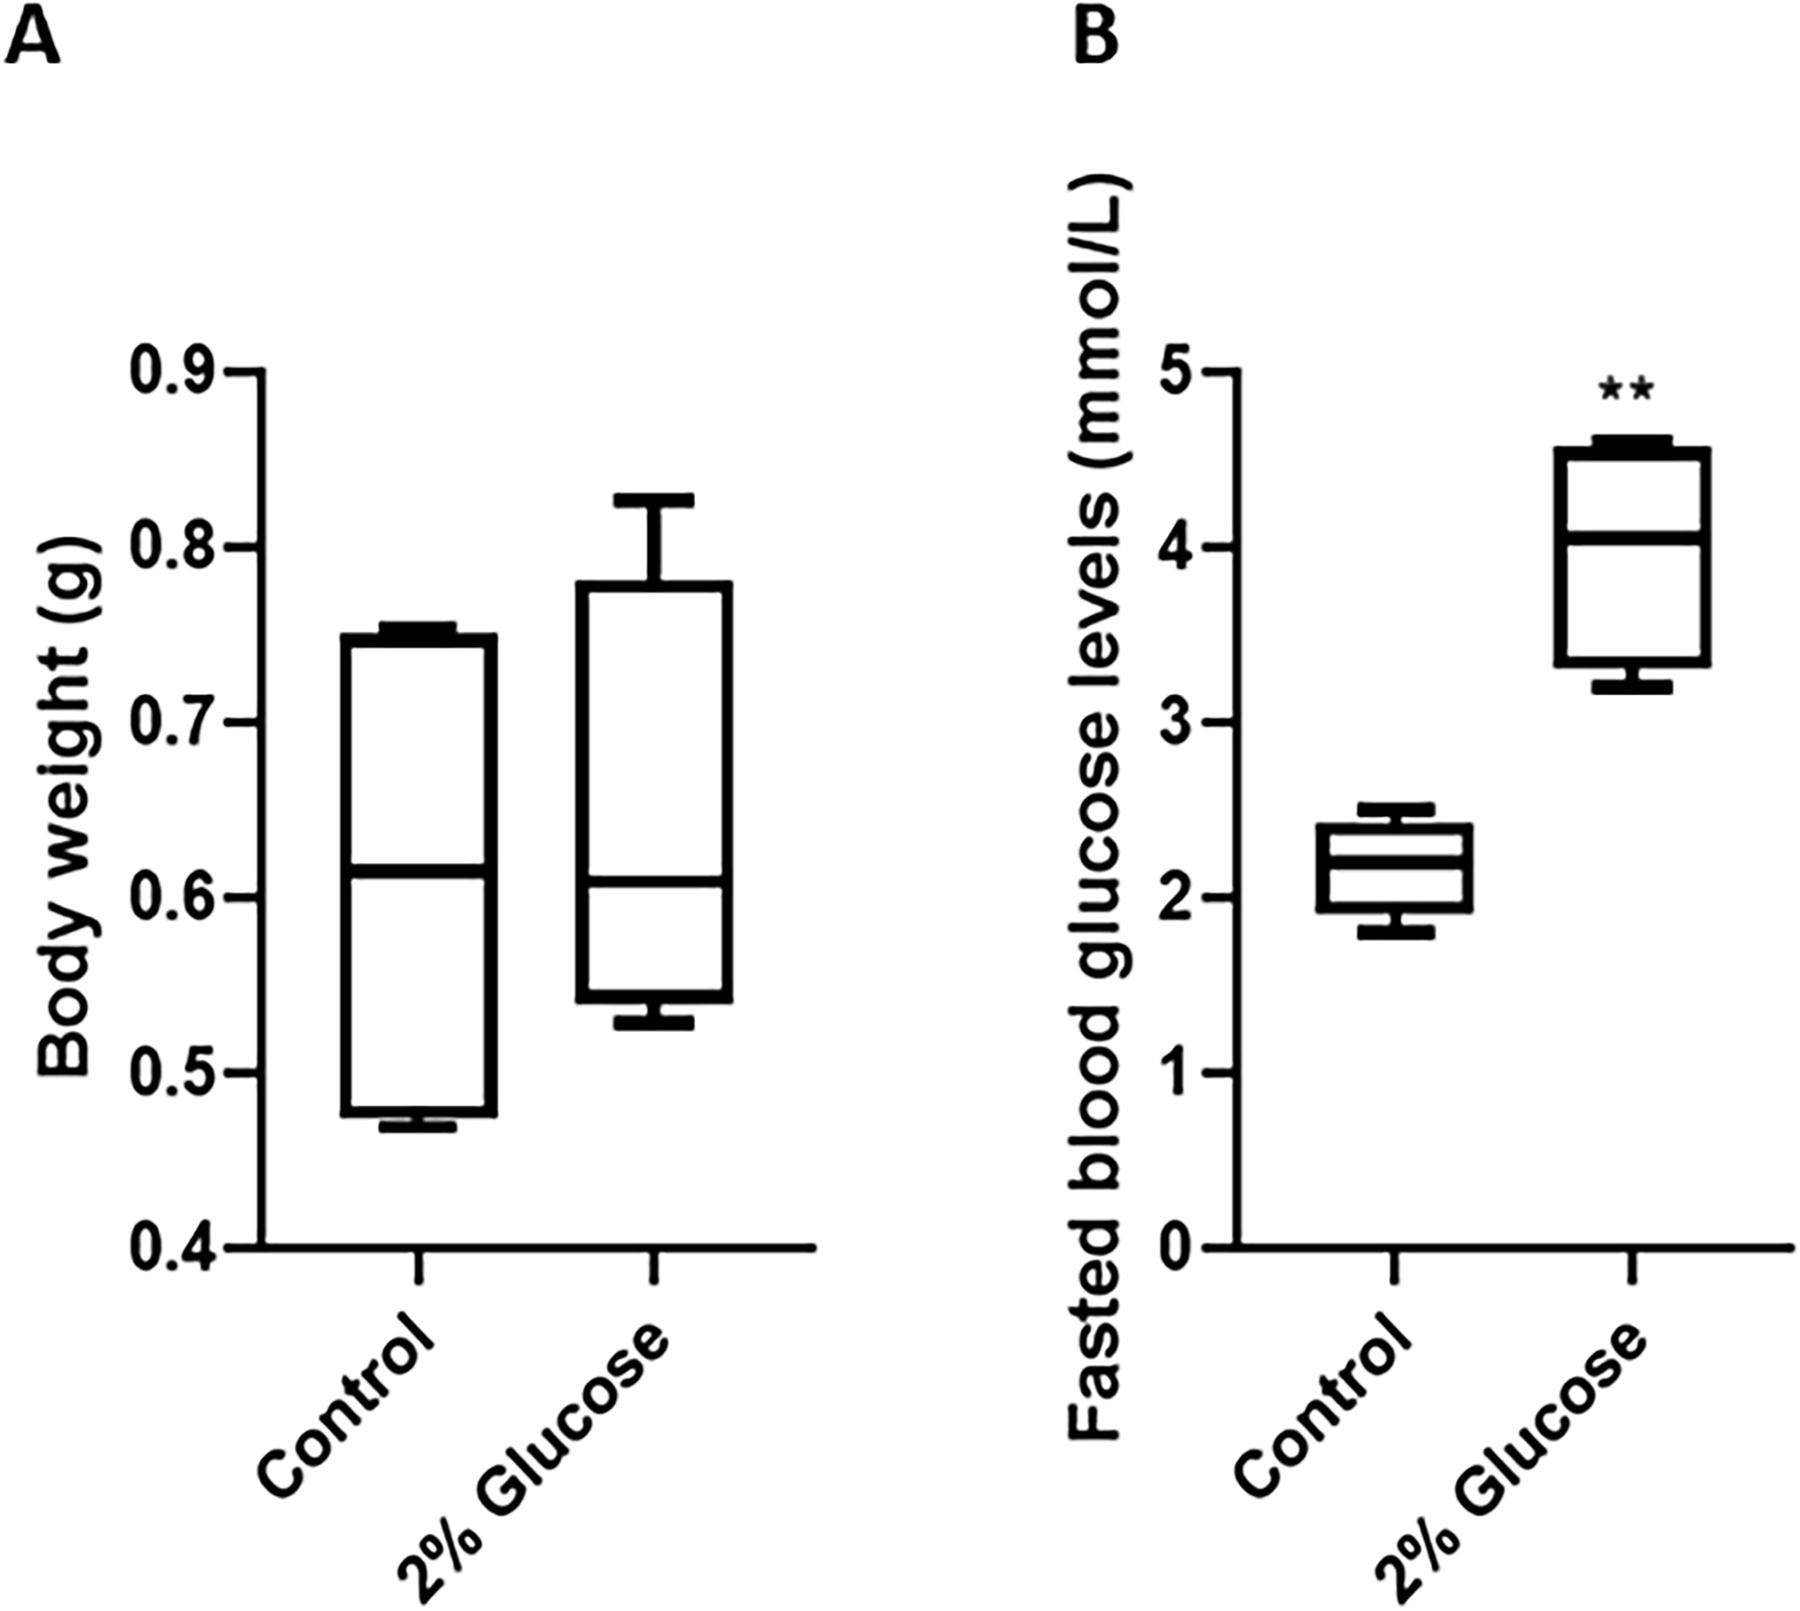
Bodyweight and fasting blood glucose levels of control and glucose-exposed zebrafish. Adult zebrafish were continuously exposed to 2% glucose solution or tank water (control) for 40 days. At day 40, the control group (n = 6) and experimental group (n = 7) were weighed
Overfeeding significantly increases both fasting blood glucose levels and bodyweight of adult zebrafish
DIO was established according to the protocol by Zang et al. (2017) 17 for a period of 10 weeks. At week 6 of overfeeding, the bodyweight of the DIO group (0.73 g ± 0.05 g) was significantly (p < 0.01) increased compared with the control group (0.57 g ± 0.1 g) (Fig. 3A). Subsequently, from week 7 to 10, the bodyweight of the overfed group remained significantly higher compared with the control group: week 7 (0.69 g ± 0.1 g vs. 0.56 g ± 0.15 g; p < 0.01), week 8 (0.70 g ± 0.1 g vs. 0.55 g ± 0.1 g; p < 0.01), week 9 (0.72 g ± 0.05 g vs. 0.55 g ± 0.1 g; p < 0.01), and week 10 (0.73 g ± 0.05 g vs. 0.66 g ± 0.1 g; p < 0.05) (Fig. 3A). It was visually evident that the fish in the overfed group gained significant body mass compared with the control group within 6 weeks of overfeeding and maintained this weight until week 10 (Fig. 3B). The difference in fasting blood glucose in control (2.1 ± 0.2 mmol/L) versus DIO (3.5 ± 0.9 mmol/L) fish was also significant at week 10 (Fig. 3C; p < 0.005), demonstrating that long-term overfeeding of a high-protein, high-fat diet induced both obesity and hyperglycemia in zebrafish compared with those fed a normal diet.
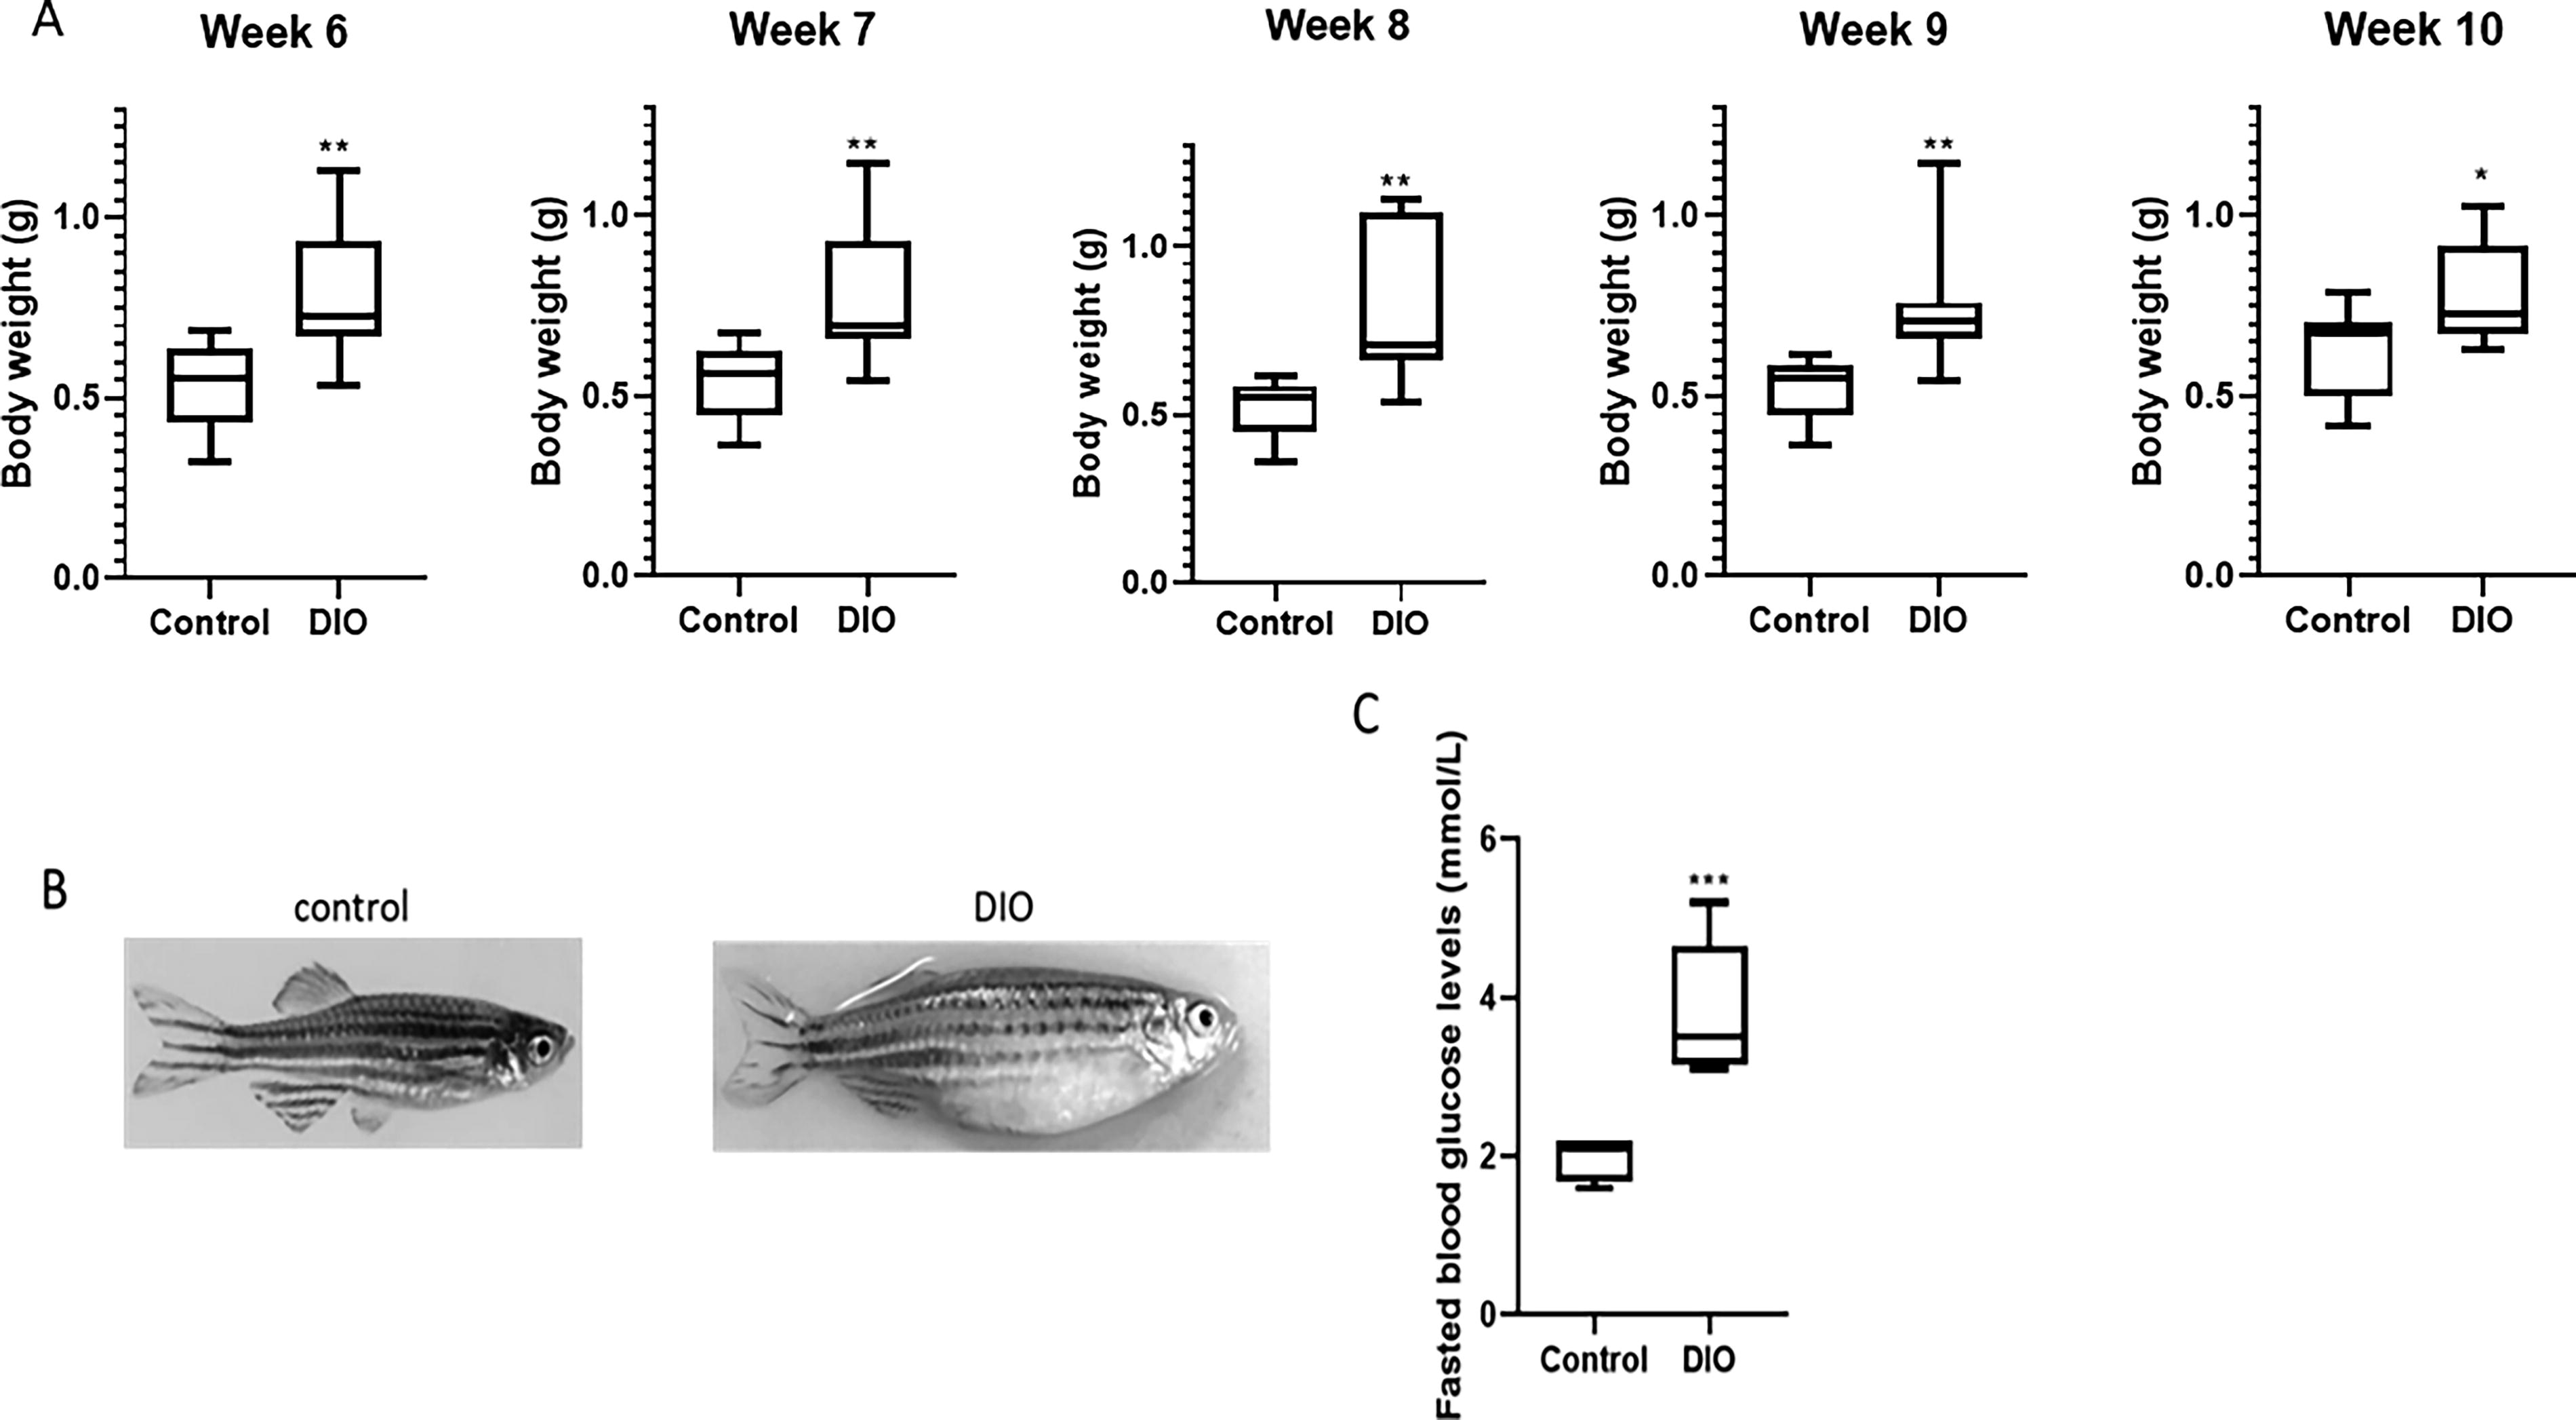
Bodyweight change and fasting blood glucose of control and overfed [diet-induced obesity (DIO)] zebrafish. Adult zebrafish were overfed (DIO; 408 calories per fish per day; n = 7) or normal fed (control; 68 calories per fish per day, n = 6) for 10 weeks. The control and overfed groups were weighed weekly during the period of treatment
Candidate gene expression
Preproinsulin
Hyperglycemia is one of the early stages of insulin resistance and a diabetic state. We therefore analyzed the expression profile of preproinsulin (ppins), the transcript that is translated and processed to produce insulin and is essential for the maintenance of blood glucose homeostasis. 34 We specifically started by determining the ΔCt under control and experimental conditions, which allowed us to compare the mRNA expression between these conditions. Mean ΔCt values were significantly different (p < 0.01) in the control versus glucose experimental group for ppins (9.1 ± 1.5 vs. 2.9 ± 3.9) (Fig. 4A). Compared with the control population, the mean ΔCt for ppins expression in the DIO experimental population after 10 weeks of overfeeding was also significantly (p < 0.01) lower (9.1 ± 1.5 vs. 2.8 ± 3.7) (Fig. 4A). The ΔCt value for ppins expression in the glucose model reflects an increase in mRNA expression compared with the control; this was confirmed by a higher relative fold-change in ppins expression (55.7 times higher than control, respectively; Fig. 4B). Similarly, increased ppins mRNA expression was observed in the overfed group compared with the control group, as reflected by the fold change that was 73.5 (Fig. 4B).
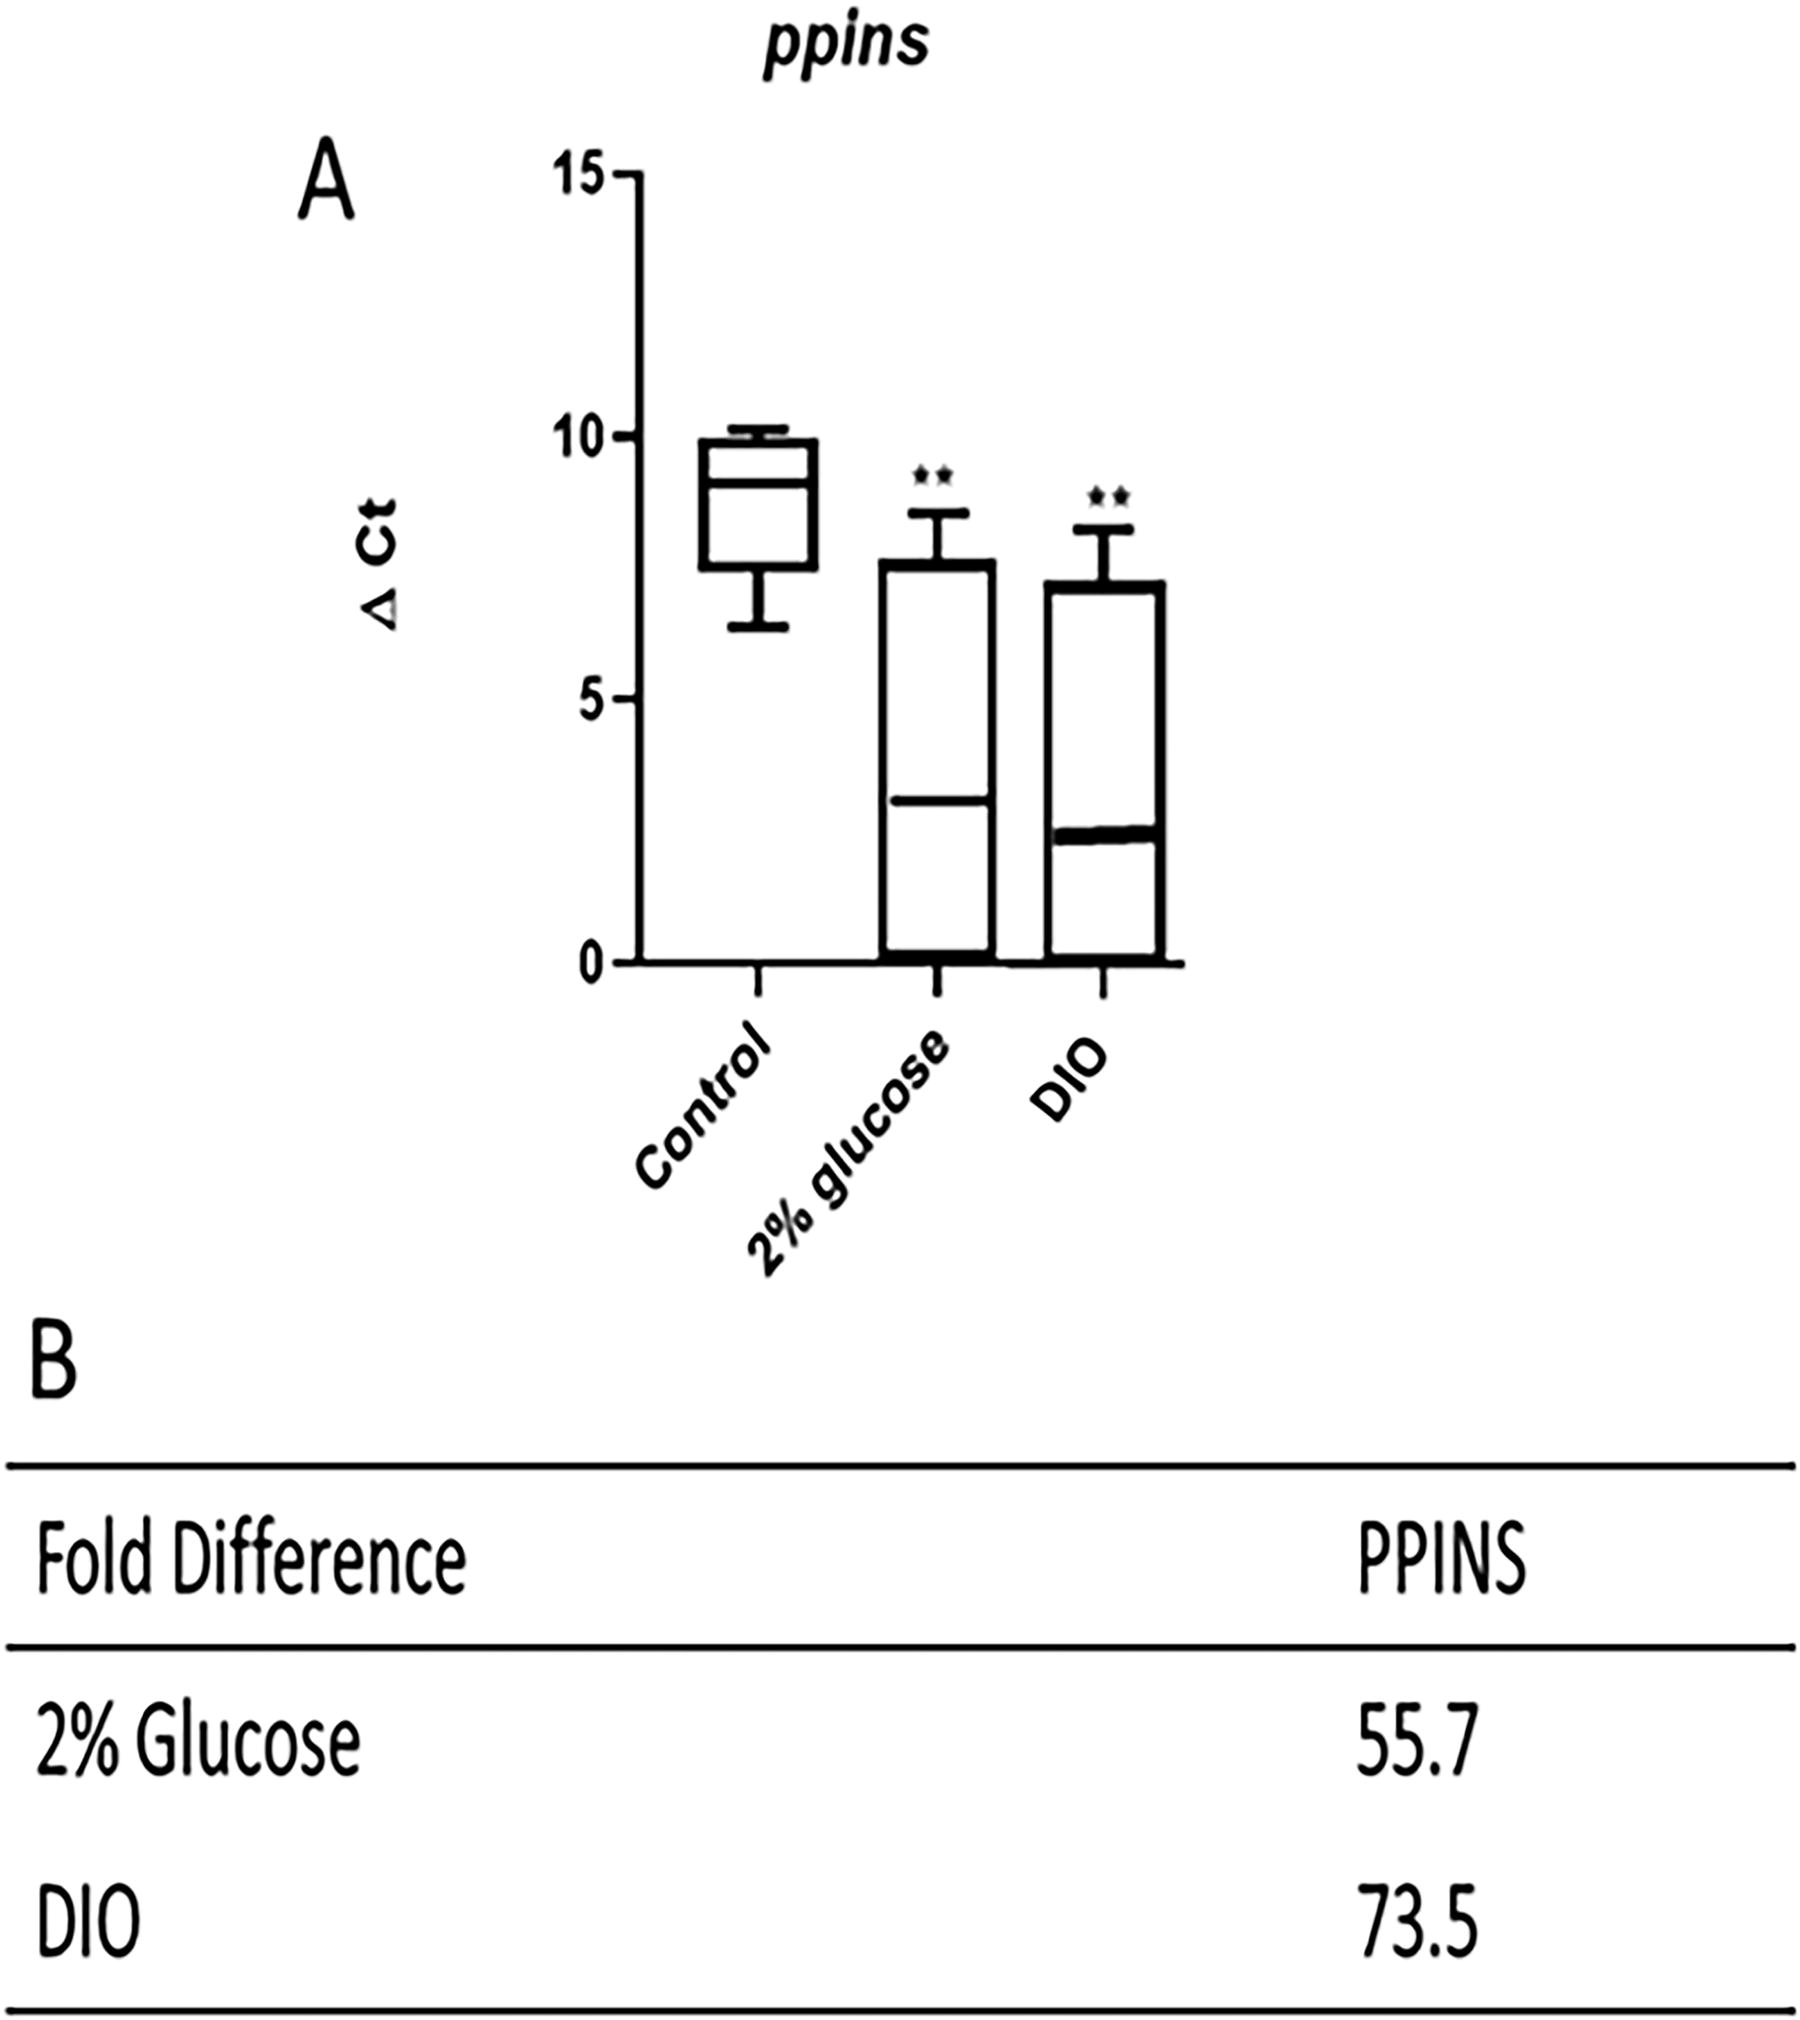
ΔCt values and fold-change in gene expression of preproinsulin essential in both adult zebrafish models of diabetes. qPCR analysis of zebrafish preproinsulin (ppins)
Glyceraldehyde 3-phosphate dehydrogenase and Phosphoenolpyruvate carboxykinase 1 and 2
GAPDH and PCK are crucial enzymes in regulating glucose metabolism to maintain appropriate blood glucose levels. The expression of PCK has been shown to be sensitive to changes in blood glucose levels in a zebrafish model and could potentially indicate a diabetic state. 31 The mRNA expression of the metabolic enzymes GAPDH (gapdh) and PCK 1 and 2 (pck1 and pck2) was then evaluated to access the diabetic status of both T2DM models. The ΔCt values were more variable in the glucose experimental group than the control population for the expression of gapdh, pck1, and pck2 (Fig. 5). The average ΔCt values for gapdh (4.5 ± 1.8), pck1 (4.7 ± 2.6), and pck2 (3.9 ± 2.1) were significantly (p < 0.05) lower than for control (6.7 ± 0.5, 9.8 ± 0.6, and 6.7 ± 0.6, respectively) (Fig. 5A–C). The population mean ΔCt of the overfed group for the expression of gapdh (2.7 ± 3.6) was also lower than the control group (6.3 ± 0.7), but not significantly so (Fig. 5A); whereas the ΔCt values were both significantly (p < 0.05) lower in the overfed versus control groups, respectively, for pck1 (3.2 ± 3.5 vs. 9.7 ± 3.2) and pck2 (3.9 ± 1.7 vs. 6.7 ± 1.4) (Fig. 5B, C). These lower ΔCt values in both experimental groups reflect an increase in gapdh, pck1, and pck2 mRNA levels, as confirmed by respective fold changes in the high glucose environment (4.6, 34.3, and 3.5 higher than control, respectively) and in the overfed groups (12.1, 90.5, and 6.4 higher than controls, respectively) (Fig. 5D).
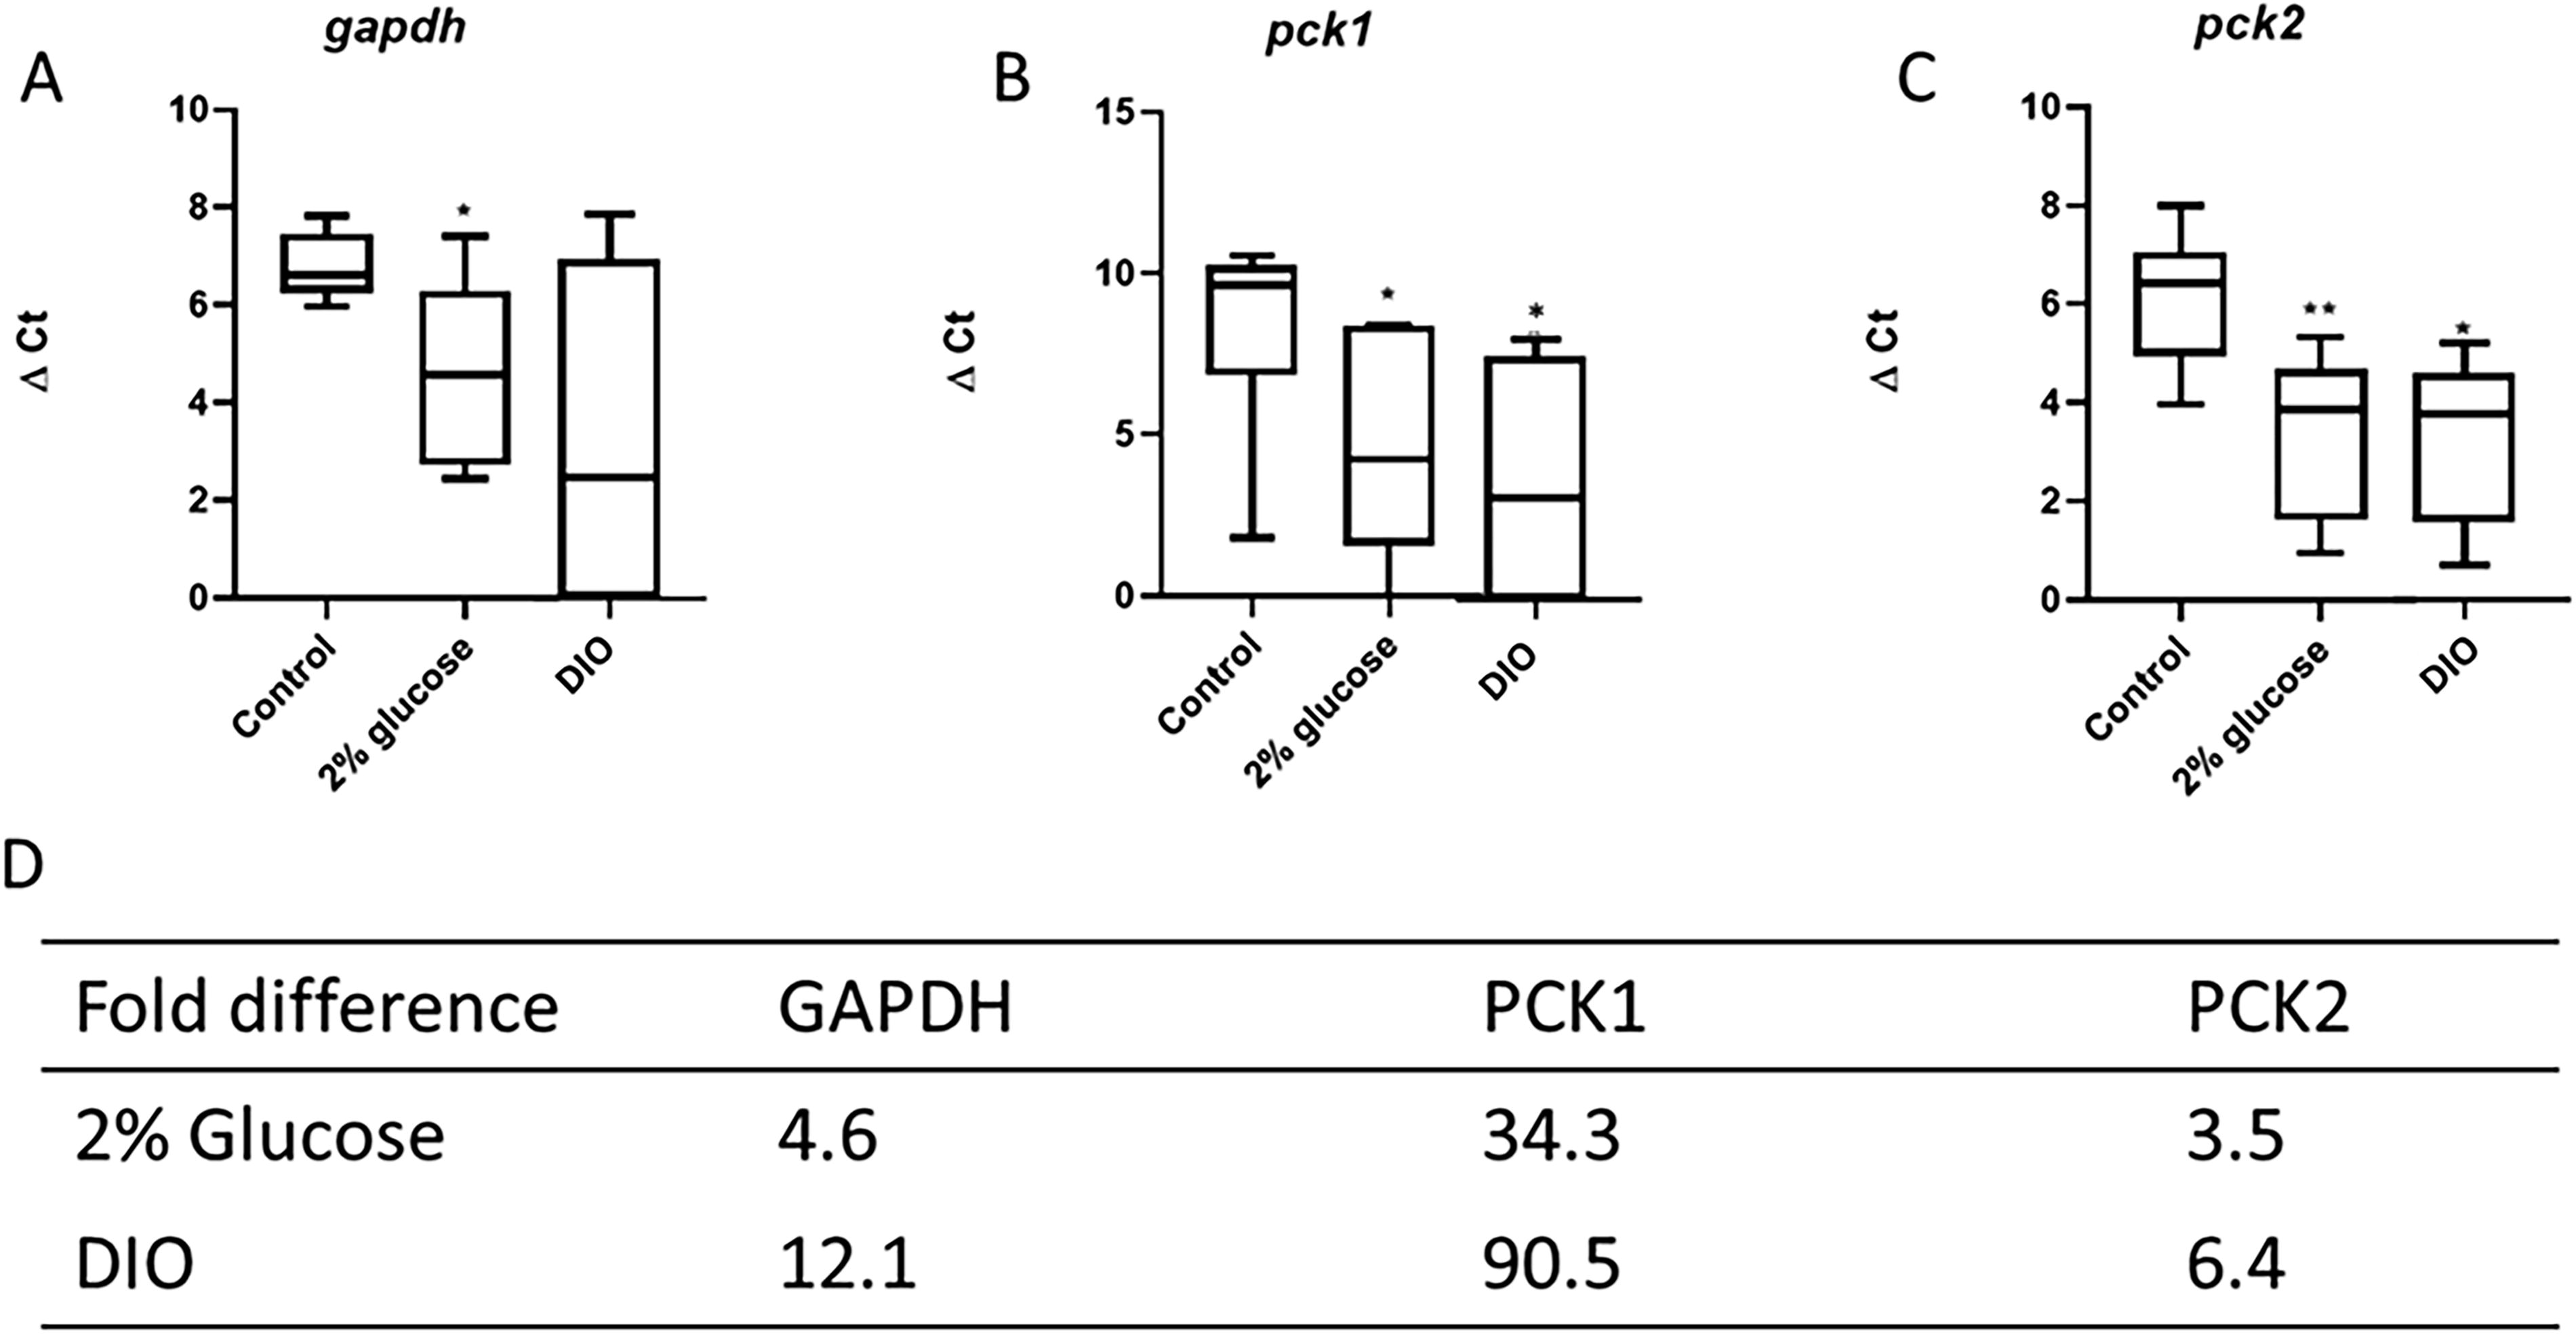
ΔCt values and fold-change in gene expression of enzymes essential for glucose metabolism in both adult zebrafish models of diabetes. qPCR analysis of zebrafish GAPDH (gapdh)
Discussion
The zebrafish is increasingly becoming one of the most widely used animal models for simulating human disease. Established models of diabetes in zebrafish are important in investigating changes in gene expression when comparing the impact of treatment variances.
We set out to directly compare two models that represent hyperglycemia and subsequently consider the impact that these treatments may have on the downstream processing of insulin, a known factor in insulin resistance and a symptom of progression to T2DM.
In the current study, adult zebrafish models of T2DM-related hyperglycemia were successfully established using two different approaches as follows: continuous 2% glucose exposure and overfeeding (high-fat, high-protein diet).18,22 Glucose exposure did not induce significant bodyweight changes, but did significantly increase fasting blood glucose levels; this indicated hyperglycemia in the treated group consistent with other studies. 24 The normal average fasting blood glucose levels in zebrafish were previously shown to be 3.1 ± 0.2 mmol/L, 35 whereas the control group in our study was 2.3 ± 0.2 mmol/L; although ours was slightly lower, it is still comparable to published results. The fasting blood glucose levels observed in our study were twofold higher in the glucose-treated group (4.0 ± 0.7 mmol/L) compared with the control group, which is comparable to the 4.1 ± 0.5 mmol/L reported in another published study for a zebrafish T2DM model. 35 Feeding a diet high in fat to adult zebrafish for 10 weeks has been shown to cause obesity, increase fasting blood glucose levels, and, in addition, impair insulin function. 26 Zang et al. (2017) demonstrated that overfeeding zebrafish using a diet that is high in both protein and fat such as Otohime B2 for 8 weeks caused obesity, hyperglycemia, and insulin resistance. 18 Using a similar approach, we induced significant bodyweight gain and hyperglycemia in the treated group (3.5 ± 0.9 mmol/L) compared with control (2.1 ± 0.2 mmol/L) by overfeeding Otohime B2 for 10 weeks; this was comparable to the study by Zang et al., which, by week 8 of overfeeding with Otohime, obtained an average fasting blood glucose level of 4.5 ± 0.8 mmol/L for the treatment group compared with 2.8 ± 0.1 mmol/L for control. The overfeeding approach is almost always associated with weight gain or adipose tissue accumulation, which are contributing factors to insulin insensitivity and hyperglycemia. 2 We recorded significant weight gain already at 6 weeks, and even though we measured elevated fasting glucose only at week 10 for this model, it is likely that fasting glucose was upregulated before 10 weeks. It may be interesting to investigate changes in fasting blood glucose at earlier time points.
Impaired glucose processing as a result of insulin resistance is one of the major determining factors of T2DM. To determine whether the hyperglycemia observed after the glucose treatment and overfeeding was accompanied by reduced insulin responsiveness (resistance) or a lack of insulin production, we sought to quantify the mRNA expression level of preproinsulin, the precursor of insulin, a hormone essential for carbohydrate metabolism. 34 Our approach involved utilizing the whole carcass rather than specific specialized organs to determine the mRNA expression levels. Mean ΔCt values for preproinsulin were significantly higher in the control versus experimental group for glucose (9.1 ± 1.5 vs. 2.9 ± 3.9) and overfeeding (9.1 ± 1.5 vs. 2.8 ± 3.7), respectively, indicating increased mRNA and suggesting a potential increased transcription to protein production; protein levels were, however, not directly measured. These findings are consistent with insulin resistance given that these fish were fasted for 12 h before candidate gene expression was analyzed. Furthermore, the sustained hyperglycemic burden of glucose and overfeeding does promote insulin resistance. Studies on zebrafish models of T2DM using both the glucose and diet induction methods have demonstrated hyperglycemia to be a result of insulin insensitivity and not necessarily lack of insulin production; this was done through fluorescence tagging of insulin 27 or measuring insulin mRNA expression levels in specific target organs such as the liver and muscle. 26 Our findings on preproinsulin mRNA levels could be correlated with this knowledge. A future expansion of our model may be to analyze the expression of pancreatic genes, such as pdx1, to determine organ function as related to the production of insulin or its precursors.
The metabolic enzyme PCK is overexpressed in diabetic patients in response to chronic hyperglycemia. 30 Hyperglycemia initially increases insulin gene expression; however, sustained hyperglycemia and high fatty acid levels in the blood stream of T2DM patients ultimately impair insulin gene expression. 36 In our study the mRNA expression of pck1 and pck2 increased significantly in both glucose-exposed zebrafish and in the overfed group. Studies have shown that prolonged hyperglycemia reduces the inhibitory effects of glucose and insulin on PCK, leading to its upregulation and subsequently more glucose production through gluconeogenesis 30 ; this phenomenon has not been observed with overfeeding.
While these are proven methods of inducing hyperglycemia, the limitation of this study is that to confirm hyperglycemia, fish were sacrificed; it would therefore be beneficial to optimize a repeated blood draw protocol, which permits blood sampling every 2 weeks. 37 It would also be advantageous to assess protein expression (preferably in real time as done in other studies) in the future as an extension of these two models, in addition to mRNA expression analysis.
In summary, using two different approaches, we established, for the first time in South Africa, zebrafish models that are clearly hyperglycemic, indicative of a diabetic state. We evaluated three specific diabetic parameters to validate our T2DM models; these include bodyweight gain, fasting blood hyperglycemia, and gene expression levels of metabolic hormones and enzymes. We sought to establish and evaluate genetic, physical, and glycemic changes that occur in zebrafish during a diabetic state as a result of exposure to glucose and overfeeding. This model can now be applied by local researchers wishing to use zebrafish to study obesity and T2DM.
Acknowledgment
The authors thank the UKZN Zebrafish Research Facility (ZRF) for all their assistance.
Footnotes
Authors’ Contributions
M.S. was responsible for the execution of the laboratory work, as well as compilation and revision of the article. C.S. and C.U.N. were responsible for the supervision of the laboratory work, funding, and finally compilation, as well as extensive revision of the article.
Disclosure Statement
The authors declare that there is no conflict of interest.
Funding Information
This work was funded by the