
Abstract

To the Editor:
Ichise and Ballinger suggest a modification to the graphical analysis of reversibly binding ligands (Logan et al., 1990) in positron emission tomography (PET) and single photon emission computed tomography that eliminates blood sampling. The operational equation in the proposed method is
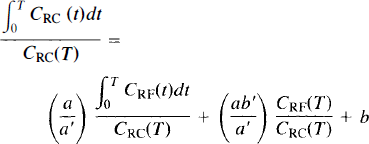
where a/a′, the parameter of interest, is the ratio of distribution volumes of the receptor region [with radioactivity CRC(t)] to the reference region [CRF(t)]. In theory, this is a valid equation; however, in practice, there are potential problems in its application. The b in Eq. 1 is not constant but becomes constant after some time t*, which needs to be identified. This is done in the graphical method using blood data by observing when the plot becomes linear. A more serious problem occurs in the numerical solution of Eq. 1. The “independent” variables in the multiple linear regression (the two functions of T on the right side of Eq. 1) differ greatly in their variation with time and in their magnitude. Over the time of analysis, the second term [CRF(T)/CRC(T), which is <1, can vary 10–30% or so as it appproaches a steady-state value. The first term [CRF(t)dt/CRC(T)] is 10–100 times larger and varies by factors of 4–5 over the same time period. In effect, the time dependence of the second term coupled with the random effects of noise makes it appear approximately constant in comparison with the first term.
To compare results from the multilinear regression method with those from the graphical method using plasma data, we applied both methods to previously collected PET data from studies in human subjects with [11C]d-threo-methylphenidate [which binds to the dopamine transporter (Ding et al., 1995; Volkow et al., 1995)] for which we had measured plasma input functions. Using regions of interest from the basal ganglia (which has a high concentration of dopamine transporters) and from the cerebellum (which does not), we calculated the distribution volume ratio using the multiple regression method (PVWave function REGRESS) and using the graphical method based on blood data. The average distribution volume ratio using multiple linear regression was found to be 2.31 compared with 2.71 using the graphical method with plasma data (the ratio was calculated as the ratio of distribution volumes for basal ganglia and cerebellum) (n = 6). To determine the effect of CRF(T)/CRC(T) on the regression calculation, we left this term out and used

instead of Eq. 1. The average distribution volume ratio was found to be 2.36, the same as was obtained using the multiple regression method. This is now a graphical analysis in which the reference region is substituted for the blood. Although this value is 14% lower than that calculated with blood data, it may provide a useful method, although with a small loss in sensitivity.
We have recently proposed a graphical method without blood sampling starting from the same equation as Ichise and Ballinger but using an average value for the blood-to-tissue efflux constant k2 (corresponding to − 1/b′ in Eq. 2 of Ichise and Ballinger). The average value of k2 was obtained from a number of studies in which plasma concentrations of unchanged radiotracer were measured. By using this experimentally determined average k2 and time radioactivity from the nonreceptor region (cerebellum), we obtain values for the distribution volume ratio that agree very well with those calculated using plasma data (Logan et al., 1996).
Another possibility for determining the distribution volume ratio is to compute the ratio of radioactivity from the latest scans in a study. If both regions are close to a steady state, this might not be a bad approximation, but it depends upon the ligand, isotope, plasma clearance rate, and experimental conditions.
Footnotes
Acknowledgment:
This research was carried out at Brookhaven National Laboratory under contract DE-AC02-76CH00016 with U.S. Department of Energy and supported by its Office of Health and Environmental Research, National Institutes of Health grants NS 15638 and NS 15380.