
Abstract

To the Editor:
The letter by Chung et al. entitled “A reinvestigation of the extended counting method for fractal analysis of the pial vasculature” touches on some relevant issues while giving us a chance in our response to emphasize and elaborate on some key points regarding the fractal analysis of pial vascular networks (Hermán, et al., 2001). However, we do not share the concern of Chung et al. regarding the use of the extended counting method (XCM) for the analysis of the pial arborization as reported recently in our article (Hermán, et al., 2001) for the following reasons.
General remarks
It seems that our notion of “pattern” and that of Chung et al. are different. Chung et al. seem to associate pattern with an inherent geometric regularity in the arborization, such as law of branching angles versus order, or length versus order. Hence, when it comes to interpret our findings, Chung et al. anticipate that our results should infer an exact geometric self-similarity or should relate to geometric patterns. However, as we previously stated (Hermán et al., 2001, pp 751, first column, second-to-last paragraph), this is not the case for pial vascular networks because most natural structures are not exact fractals but should be regarded as statistical fractals. Therefore, our use of the term “pattern” does not imply an explicit geometric order but a statistically self-similar distribution of features (i.e., branched segments of different length) over the entire network.
We used the box counting method (BCM) to demonstrate the feasibility of the fractal approach in the analysis of statistical self-similarity in the branching pattern by showing if a scaling relation between features seen at different scales and scales themselves is present. The close-to-1 fit of the linear regression model used to derive the fractal dimension D (r2 = 0.98, Table 1 [Table 1 in Hermán et al., 2001] is evidence of a statistical self-similarity present in the set of observations. On this ground, XCM can improve on the precision of BCM. However, numerical evaluation of BCM and XCM for their precision on different fractal models with known D revealed that these two methods yield different values of fractal capacity dimension, Dcap, depending on the model used in testing (Fig. 1 [Fig. 8 in Hermán et al., 2001]). Hence, we concluded that fractal models—more realistic than the Mandelbrot-tree we used in testing—should be found if we would have liked to improve on the estimate of Dcap by BCM using XCM. We interpreted the similarity of Dcap values of the arterial and venous networks found by BCM and XCM as an indication that using such realistic treelike fractal model (if found), these methods may yield similar performance in numerical testing. We firmly concluded that until this is proven, XCM should not be considered as a choice in fractal analysis of the pial system. In this regard, we are more critical of the possible use of XCM in the analysis of vascular networks than its inventors, Sandau and Kurz (Hermán et al., 2001).
Estimated fractal capacity dimension for pial vessels
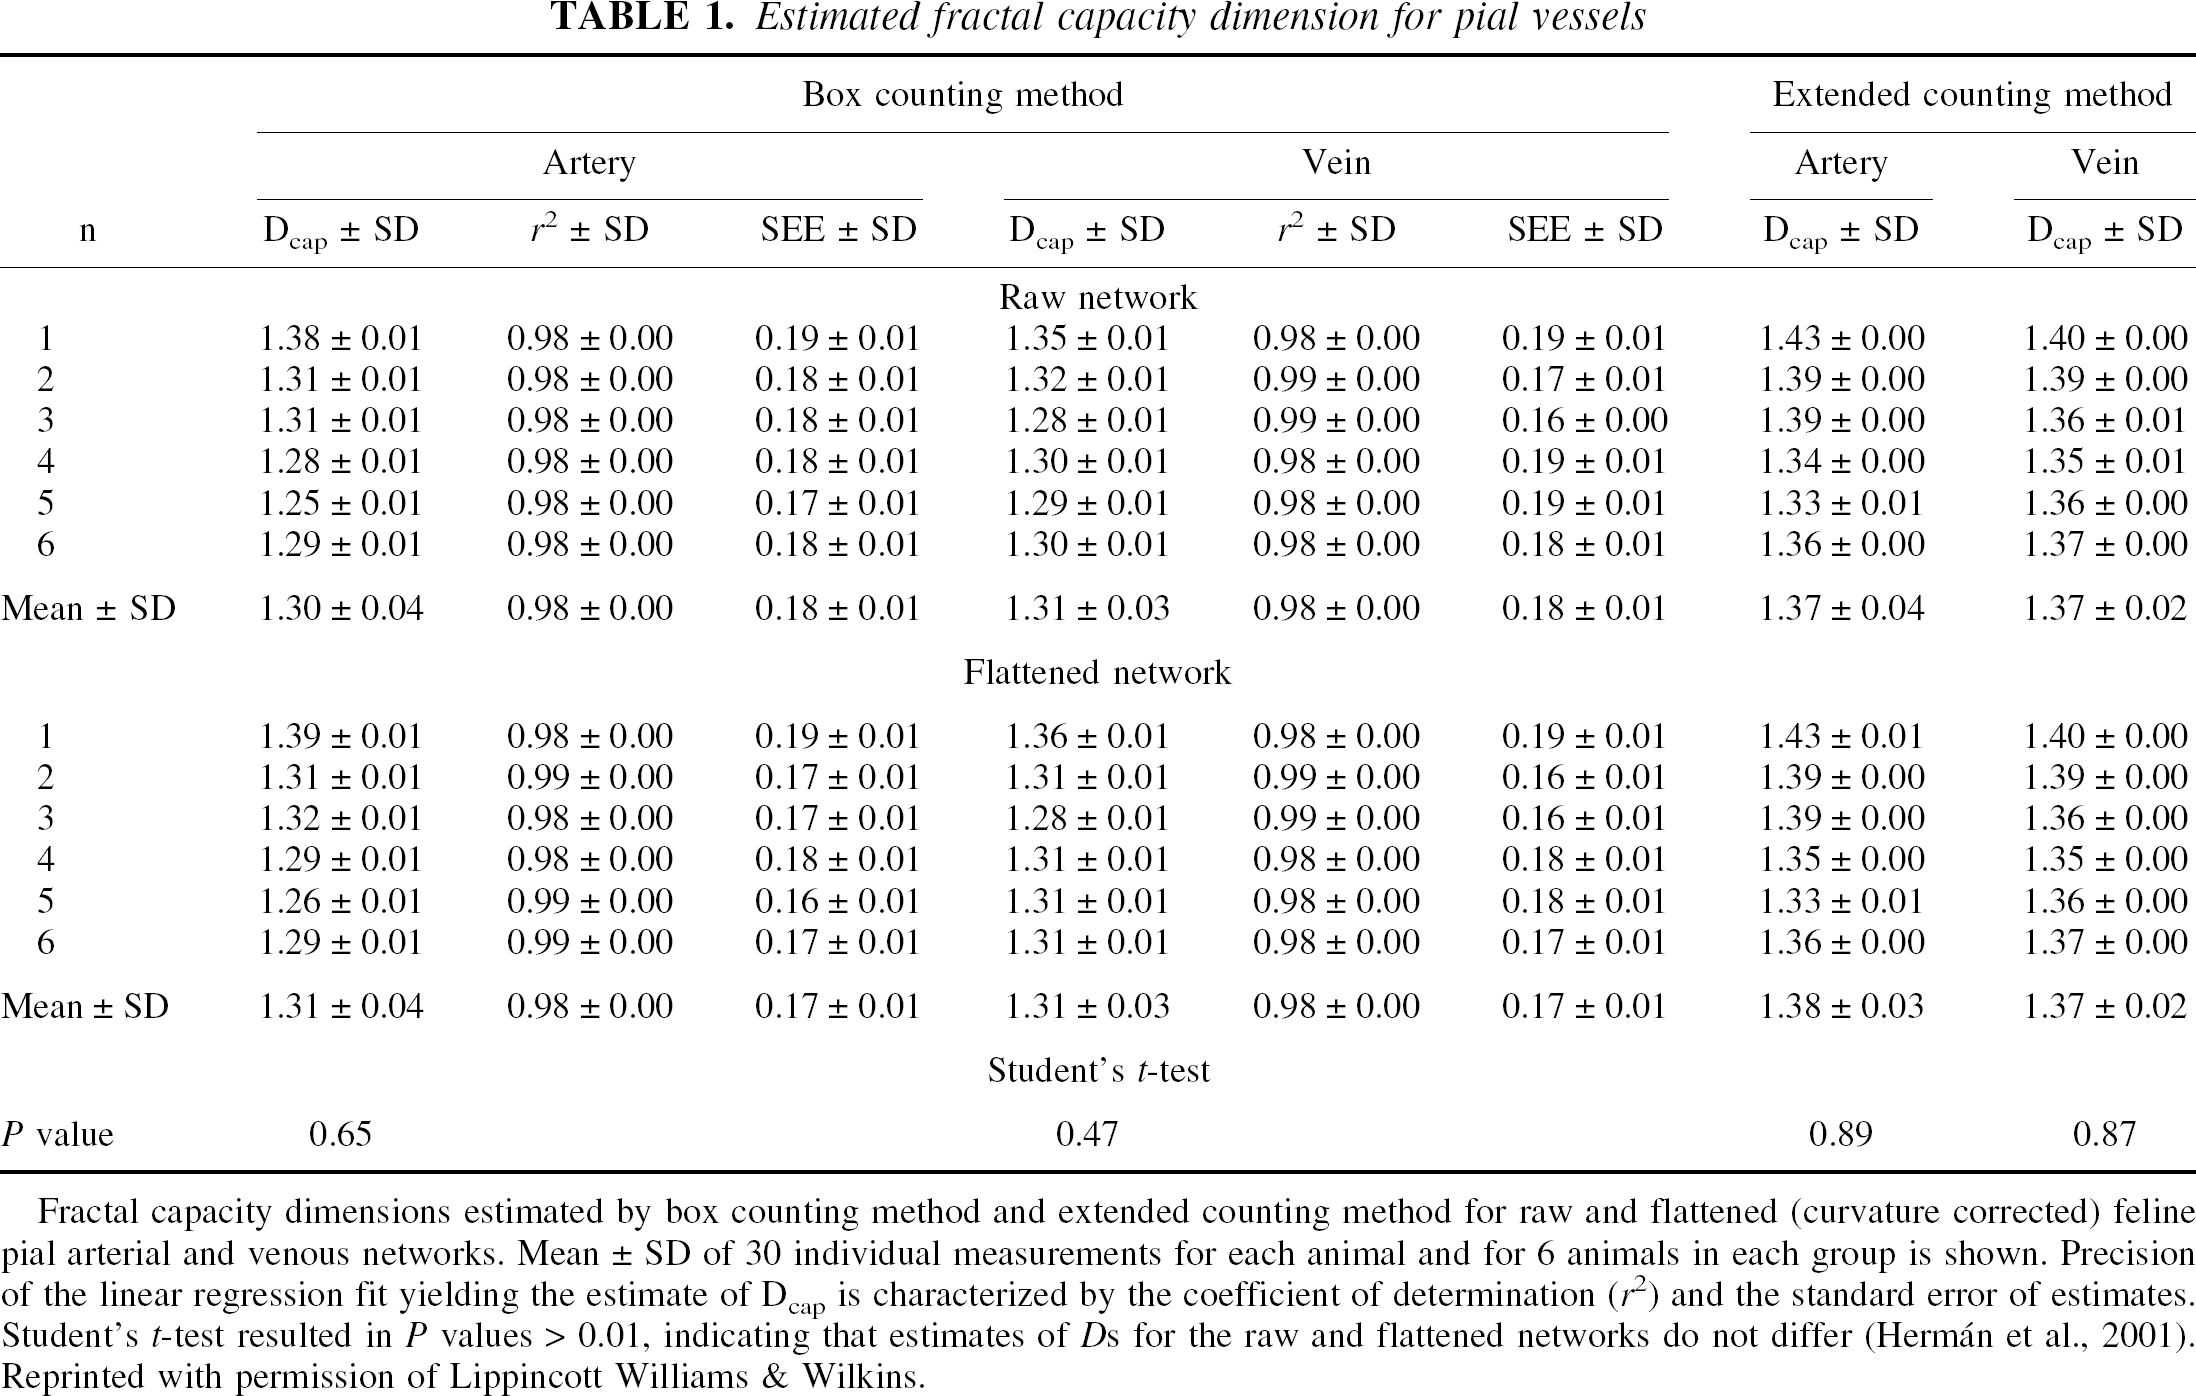
Fractal capacity dimensions estimated by box counting method and extended counting method for raw and flattened (curvature corrected) feline pial arterial and venous networks. Mean ± SD of 30 individual measurements for each animal and for 6 animals in each group is shown. Precision of the linear regression fit yielding the estimate of Dcap is characterized by the coefficient of determination (r2) and the standard error of estimates. Student's t-test resulted in P values > 0.01, indicating that estimates of Ds for the raw and flattened networks do not differ (Hermán et al., 2001). Reprinted with permission of Lippincott Williams & Wilkins.

Estimated fractal dimensions for exact nonbranching and branching geometric fractal structures. Exact single fractal structures shown in Fig. 6 were used to test the precision of the box counting (BCM) and extended counting (XCM) methods in estimating the capacity dimension (D cap ) of the structure. Dotted lines indicate the line of identity at which estimate of D equals true D. Deviation from this line is the bias in the estimate, whereas bars of SD indicate the variance. The mean squared error (MSE = SD2 + bias2) was used to give a combined characterization of bias and variance in estimates of D cap . Each point represents the mean of 30 estimates of the same structure rotated by 3 degrees (Hermán et al., 2001). Reprinted with permission of Lippincott Williams & Wilkins.
Specific remarks
Chung et al. correctly spotted a typographic error in the equation defining DXCM. However, note that our reported DXCM values were calculated according to the correct form of the equation defining DXCM. May we add one more typographic error that we found in Fig. 6 (Hermán et al., 2001), where a should equal Ai/Ai+1.
Chung et al.'s letter does not expand on what has been published by Sandau and Kurz (Sandau and Kurz, 1997) in terms of the concept of XCM and how Nmax relates to maximum local-vessel density. As stated previously, XCM is an extension of BCM. Hence, the strategy of XCM is based on assuming the presence of fractal statistical properties and finding Nmax at q0 as the maximum in the statistical set of observations of N(q)s that scatter along a line with r2 ≈ 1. Under these conditions, Nmax directly yields DXCM as the regression slope of the line. Nmax does indeed correlate with the maximum local-vessel density—though Sandau and Kurz (1997) did not use the term—provided there is a loss or lack in structural details most commonly due to limitations in methodology in vascular network studies, such as imperfect filling or limitations in imaging. The XCM effectively reduces these errors by searching for Nmax.
Chung et al. argue that the computed value of DXCM of the networks may be prone to variations with different choices of q0, even when q0/q1 is kept constant. However, this problem is arbitrary because these authors disregard that q0 should be set not in absolute terms, but relative to the actual image size given in pixels. In their Fig. 3, as q0 increases, DXCM values asymptotically approach a maximum, the best estimate of true DXCM of the networks. Note that the DXCM values of Chung et al. equal the values that we reported (Hermán et al., 2001, arteries 1–3, veins 1–3 in Table 1) because DXCM values in our studies and in Chung et al.'s reevaluation experiments were found at approximately the same ratio of q0/L, where L = image size in pixels. Hence, Chung et al. are wrong to contrast q0s (q0 ⩾ 1,536 pixels as compared to our value of q0 = 256) by emphasizing that our chosen value was too small. What matters is not the actual values of q0 but that their relation to image size is large enough to represent the network and smaller than L to allow sufficient room for the region of interest, with side q0 to be moved over the image in search for Nmax. q0 is increased by the power of 2; hence, in our case its value of 256 indicates that L should be approximately 512 pixels. Therefore, in our study L ranged between 460 × 356 and 598 × 426 pixels. In conclusion, Chung et al.'s choice of q0/q1 = 256 and q0 ⩾ 1,536 pixels and our choice of q0/q1 = 256, q1 = 1 should yield similar DXCM values because the respective q0s and Ls yielded the same ratio of q0/L (i.e., approximately half the image size). The actual resolution of the images is irrelevant, provided the image itself is of adequate size. Note, that q0/L = 256/800 and q0/L = 256/10,000 were adequate to assess DXCM values of ideal fractals (Mandelbrot tree and von Koch curve, respectively) because, as mentioned previously, in these ideal cases N(q) values do fall on a line with a slope of DXCM.