
Abstract
The population of truck drivers plays a key role in the spread of HIV and other infectious diseases in sub‐Saharan Africa. Truck drivers thereby affect the health and lives of many, but also suffer from poor health and significantly reduced life expectancy themselves. Due to professional circumstances, their health service needs are generally not well addressed. Therefore, the non‐governmental organization North Star Alliance builds a network of healthcare facilities along the largest trucking routes in sub‐Saharan Africa. This paper studies the problem where to place additional facilities, and which health service packages to offer at each facility. The objective combines the maximization of the patient volume at these facilities and the maximization of the effectiveness of the health service delivery to the population served. The latter criterion is modeled through three novel access measures which capture the needs for effective service provisioning. The resulting optimization problem is essentially different from previously studied healthcare facility location problems because of the specific mobile nature of health service demand of truck drivers. Applying our model to the network of major transport corridors in South‐East Africa, we investigate several prominent questions managers and decision‐makers face. We show that the present network expansion strategy, which primarily focuses on patient volumes, may need to be reconsidered: substantial gains in effectiveness can be made when allowing a small reduction in patient volumes. We furthermore show that solutions are rather robust to data impreciseness and that long‐term network planning can bring substantial benefits, particularly in greenfield situations.
Introduction
Sub‐Saharan African truck drivers work under difficult conditions. Their trips last up to several weeks, during which time they are separated from their spouses and social‐cultural norms and in which they are challenged by monotonity, risk of hijacking, loneliness, and long waiting times at border posts. This working environment has been shown to be conducive to their engagement in behaviors that bring about high risks of communicable diseases such as tuberculosis (TB), malaria, HIV, and other sexually transmitted infections (STIs) (Apostolopoulos and Sönmez 2007, Botão et al. 2015, Delany‐Moretlwe et al. 2014, Gomez et al. 2013). For instance, Ramjee and Gouws (2002) report a study on a population of 310 truck drivers in South Africa, 70% of whom had wives or girlfriends in rural areas, 13% used a condom during their last sexual encounter, and 56% was HIV positive. Similar behaviors and high prevalence of communicable diseases in general and STIs in particular are also reported for truck driver populations in India (Pandey et al. 2008, Roa et al. 1997), Brazil (Lacerda et al. 1997, Malta et al. 2006), China (Chen et al. 2006, Wong et al. 2007), the Baltic Region (Kulis et al. 2004), and the USA (Lichtenstein et al. 2008, Solomon et al. 2004, Stratford et al. 2000).
The high prevalence of communicable diseases among sub‐Saharan truck drivers and their sex partners has a dramatic impact on their health and life expectancy (Apostolopoulos and Sönmez 2007, Delany‐Moretlwe et al. 2014, Matovu and Ssebadduka 2012). For example, Wilson (2005) mentions a firm that “lost 39 out of 144 drivers in the last three years.” Moreover, because of their mobility and behaviors, truck drivers have substantially contributed to the spread of HIV and other communicable diseases among the sub‐Saharan population at large (Apostolopoulos and Sönmez 2007, Caldwell et al. 1999, Gomez et al. 2013, Hudson 1996, Laukamm‐Josten et al. 2000, Morris and Ferguson 2006,2007 Ramjee and Gouws 2002). In addition, the disease burden has impoverishing effects on patients, decreases labor productivity of firms, and slows down economic growth (Ahlburg 2000, Sachs and Malaney 2002, Stover and Bollinger 1999).
Delivering prevention, diagnosis, and treatment services to sub‐Saharan truck drivers is considered highly effective to reduce their burden of disease (ILO 2005, Matovu and Ssebadduka 2012, Ramjee and Gouws 2002). Unfortunately, traditional healthcare facilities struggle to provide these services as they are often not easily accessible by trucks, have insufficient parking space, require detours, have long waiting times, and are only open during the day whereas drivers usually stop during the evening (Delany‐Moretlwe et al. 2014, Ferguson and Morris 2007, Ferguson and Morris 2007, Gatignon and Van Wassenhove 2008, ILO 2005, IOM 2003, Ramjee and Gouws 2002).
The non‐governmental organization (NGO) North Star Alliance (North Star) aims to improve the health of the sub‐Saharan truck driver population and roadside communities. It operates 55 Roadside Wellness Centers (RWCs) or “Blue Boxes,” which are easily accessible by truck and located at major truck stops and border crossings along sub‐Saharan Africa’s main transport corridors. The RWCs provide primary care services, behavior change communication, condom distribution, HIV and STI voluntary counseling and testing, screening for TB and malaria, and treatment for HIV, malaria, TB, and STI. Part of these services are provided during outreach sessions at “hotspots” (e.g., parking lots, bars, and brothels).
This study focuses on important managerial network design challenges/ questions that were identified during our collaboration and conversations with North Star and were not addressed in earlier work related to our topic (see Ares et al. 2016, and our discussion below). The first relates to the criteria considered when expanding the network—that is, adding new RWCs. The NGO has so far based location decisions mostly on patient volume, positioning new RWCs where the expected number of patient visits is highest. Because of the long travel times and the relative sparsity of the network of roadside clinics, however, the effectiveness of health service provisioning – the degree to which it improves health–is often hampered by access discontinuities. In other words, travel time gaps between RWCs along a truck route are often too large. Hence, maximizing patient volume solely may not bring maximum gains in health effects for the population. To incorporate effectiveness in future network expansions, it is key to precisely define how it relates to access. Doing so is, however, far from trivial, partly since the relationship differs per health service. Accessibility requirements for “effective” HIV care may differ from those for primary care. Our first research objective is to develop models for health service effectiveness that capture this variety.
Second, North Star has been offering virtually identical health services at all of its RWCs. As indicated, accessibility requirements differ per health service and disease prevalence varies across the network. In view of the scarce financial resources, this suggests that differentiation or centralization of certain service packages may be beneficial. Next to a standard primary care service package, North Star considers to introduce optional service packages. For example, North Star has piloted offering a package of HIV treatment services (see Gomez et al. 2013, Lalla‐Edward et al. 2017). Evidently, potential locations of service packages are determined by locations of new facilities (and current facilities), which makes integrated decision‐making beneficial. Our second research objective is to model and solve the problem of optimizing integrated location and service differentiation choices.
Third, we aim to explore trade‐offs between volume and effectiveness for this problem. How does the present network expansion strategy, which primarily focuses on patient volumes, perform in terms of effectiveness? How would an increased focus on effectiveness affect patient numbers? Answers to these questions form important inputs for strategic choices on objectives (cf. Ferdows and De Meyer 1990). They also fuel discussions with donors, which commonly evaluate impact through volume indicators rather than actual health impacts (Bolton et al. 2007).
Our fourth research objective is to assess the importance of long term network planning. The NGO makes expansion decisions sequentially and has not explicitly accounted for future expansions while doing so. The advantage of this method is its simplicity: advanced solution methods may not be required when choosing locations of few new facilities. On the other hand, the present myopic approach may lead to sub‐optimality in the long run. At present, scientific and practical understanding of this matter is lacking.
Finally, North Star operates in a context where data on truck routes and volumes is scarce and imprecise. Quantification of objectives may also be biased. Impreciseness generally impedes trust in data‐driven decision making (De Vries and Van Wassenhove 2019). Our fifth research objective is to inform decision makers on the magnitude of this risk by assessing robustness of “optimal” location decisions.
We pursue these five objectives by modeling and studying the roadside healthcare facility location problem (RHFLP): Given an existing transportation network and set of RWCs, and a limited expansion budget, where to place additional RWCs, and which service packages should each of the RWCs offer, so as to maximize a weighted sum of health service effectiveness and volume of truck drivers served? We present both analytical and numerical results, using the network of major transport corridors in South‐East Africa as a case study.
Our work is the result of the network design project we started in 2011, together with the NGO and ORTEC Consulting Group. The research presented by Ares et al. (2016) forms a first publication that spun off from this project. They analyze the problem of locating a fixed number of clinics based on the objectives to enhance equity of access to healthcare and to maximize patient volume and effectiveness. Our research advances on Ares et al. (2016) in the first place by distinguishing multiple health service packages and analyzing service differentiation, which motivate research objectives 1 and 2. As our aim is to address key managerial challenges posed to us by practitioners, which deal with volume and effectiveness measures, we especially focus our analyses on these two criteria, and present corresponding extensive trade‐off analyses (see research objective 3). In section 5.8, we turn our attention to equity considerations along the lines of Ares et al. (2016). Our comparison between long‐term and incremental planning approaches and sensitivity analyses on data impreciseness (see research objectives 4 and 5) are also novel contributions. To these purposes, we extend the mixed‐integer linear programming (MILP) formation presented by Ares et al. (2016) and use a more elaborate case study: it incorporates more recent demand data and adds two major truck corridor networks that span eight East African countries.
Our results show that standard software solves real life RHFLP instances within reasonable computation times (<2.5 hours). This is an important finding, given that we prove that RHFLP is strongly

The remainder of this study is organized as follows. Section 2 presents a literature review. In section 3, we present measures of access to health services for mobile patients. A MILP formulation of the location problem and some analytical results are presented in section 4. The results of our numerical experiments are described in section 5. Finally, in section 6 we summarize our findings and present conclusions.
Literature Review
Our work extends the growing literature on operations research applications in global health/public health in low and middle income countries (see Yadav (2010) and White et al. (2011) for reviews). Papers from this field typically deal with the use or allocation of resources that improve health in heavily resource‐constrained contexts. Kraiselburd and Yadav (2013) stress the importance of this field by describing the deficiencies in global health supply chains. The World Health Organization (WHO) also acknowledges the added value these disciplines can have for global health (Royston 2011).
Applications that use facility location models in this context have been reviewed by Daskin and Dean (2004), Rahman and Smith (2000). The authors show that existing models are variants of the set covering model, the maximal covering model, and the P‐median model, which optimize or put constraints on some function of the patients’ distance or travel time to nearby health facilities. The applicability of these models in the context at hand is, however, rather limited. Truck drivers are highly mobile, so that their distance or travel time to a facility is constantly changing. In more recent work, Deo and Sohoni (2015) develop a model for allocating a health service to health clinics, Smith et al. (2009) consider the problem of locating primary healthcare workers, Griffin (2012) constructs strategies to allocate treatments to health centers and populations, and McCoy and Lee (2014) consider the allocation of motorcycle capacity to outreach sites. McCoy and Johnson (2014) investigate how to optimally allocate clinic capacity over time, and explicitly model the impact on HIV treatment adherence. None of these articles, however, considers optimizing access to mobile patients.
Our work is also related to mobile healthcare facility planning problems (see e.g., Doerner et al. 2007, Hachicha et al. 2000, Hodgson et al. 1998), as these problems also consider the time intervals between moments of health service provisioning. These papers, however, consider the optimization of routing decisions whereas we consider location decisions.
Our problem seems to most closely resemble a facility location problem which balances the maximization of the total node demand covered by the facilities with the maximization of the total flow demand covered by the facilities. Such flow represents a collection of truck drivers traveling the same route and demanding a given service. Their “degree of coverage” represents the effectiveness of service provisioning, that is, the resulting improvement in health, which we define as a function of the level of access to the service along the route. Our problem is therefore closely related to flow interception facility location problems (FIFLPs), which have the objective of intercepting demand units on their pre‐planned paths (see Boccia et al. (2009) and Hodgson (1998) for reviews of FIFLPs). Most FIFLPs assume that a demand unit is covered if and only if there exists at least one “conveniently located facility,” such as a facility along its path or within a given distance from its path. The fact that it is beneficial to offer a service at multiple locations along a path makes our problem a multi‐coverage FIFLP. Other than the aforementioned work of Ares et al. (2016), an extensive search yielded only two other multi‐coverage FIFLPs: the billboard location problem (Averbakh and Berman 1996) and the flow refueling location problem (De Vries and Duijzer 2017, Kuby and Lim 2005). Though these problems show much similarity to the RHFLP, it is not possible to directly apply models for these problems to solve the RHFLP. As we will explain in the next sections, we measure the benefits of providing access to facilities by means of a continuous variable which depends on the travel time intervals between adjacent facilities along a route. In contrast, the billboard location problem measures these benefits based on the number of billboards along a route. The flow refueling location problem considers the driving times between adjacent facilities but differs from our problem in that it defines that a fixed amount of benefits are obtained if and only if specified travel time interval constraints are met. For a comprehensive literature review on related facility location problems, we refer to De Vries (2011).
Finally, the closely related paper by Ares et al. (2016) considers the problem of locating a fixed number of roadside clinics using a three‐criteria objective function which considers volume, effectiveness and equity. They propose an advanced column generation algorithm to deal with the computational complexities induced by equity considerations. The model considered in their work differs from our model in that (i) it includes an equity criterion, and (ii) it does not consider service differentiation decisions and the corresponding variety of effectiveness models (their work uses one of the access measures elaborated below, following expert opinion). See section 1 for our discussion on how our work builds and advances upon theirs.
Continuous Access
We collected expert opinion by interviewing ten of North Star’s staff members from the headquarters and regional offices on model objectives and requirements. See Appendix A for interviewee characteristics. Interviewees were added till saturation was reached (Saunders et al. 2017). These interviews confirmed the importance of capturing the relationship between access and effectiveness, and revealed how this relationship varied among diseases.
For some health services, a critical time limit (CTL) exists which defines a time limit for access to healthcare. For instance, providing antimalarial drugs within 24 hours of onset of symptoms is essential for treatment effectiveness (Johnson et al. 2013, Khatib et al. 2013). The dichotomous variable of having access to a health service facility within 24 hours is therefore commonly used as performance indicator (see e.g., Chuma et al. 2009, WHO/UNICEF 2003). A critical time‐limit may also apply to health services that need to be accessed at fixed time‐intervals. One example is directly observed therapy for TB patients, in which a health provider frequently monitors a patient swallowing the required drugs (Volmink and Garner 2007).
For many services, however, responsiveness is less dichotomous. Instead, health impacts of postponing access gradually build up over time. In such cases, a recommended time limit may apply, in addition to a critical time‐limit. Such a distance‐decay relationship has been confirmed in a variety of studies (see e.g., Cooke et al. 2010, McLaren et al. 2014, Tanser et al. 2006), and are common for STIs (see e.g., Meyer‐Weitz et al. 2000, Moses et al. 1994), for which a positive relation exists between treatment delay and disease progression and transmission (Hook et al. 1997).
Thirdly, there are services for which specific time limits are lacking, but improved access is associated with higher utilization, less treatment delay, and improved treatment adherence, which in turn lead to lower mortality and morbidity, less drug resistance, and less disease transmission. Examples include HIV testing and treatment services (De Vries et al. 2014, Mills et al. 2006).
Types of Service Packages
On the basis of the three aforementioned relationships between access and effects, we now propose a classification of service packages in three service package types. The mapping of North Star’s service packages to the three service package types is presented in section 5.1.
This package type corresponds to diseases for which access within a time‐limit from the moment of (self) diagnosis is crucial and to health services that need to be accessed at fixed time‐intervals.
This service package type refers to health service packages for diseases for which a recommended time‐limit and a critical time‐limit are well defined, and that are also characterized by a continuous relationship between access and effects.
This last package type corresponds to health service packages for diseases for which there exists a distance‐decay relationship without a clear time‐limit of access.
Access Measures
We now propose access measures corresponding to the service package types introduced in the previous section. Following interview results we assume that truck drivers cyclically travel from origin O to destination D and back to origin O (cf. Ferguson and Morris 2007, Orubuloye et al. 1993). Figure illustrates the access measures for part of such a round trip.

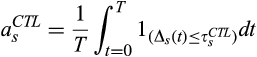
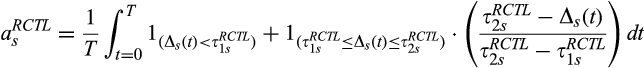
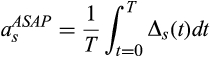
Three Ways to Measure Continuity of Access. Upper: time within critical time‐limit (CTL). Middle: time within recommended/critical time‐limit (RCTL). Lower: average value of the access time (ASAP) [Color figure can be viewed at
The boxes with the cross represent a moment at which some service package s is passed. Let us consider a given moment t during a trip. We define the truck driver’s access time to package s as the travel time to the next facility along his route that offers package s. (Our interviews revealed that returning to a facility the driver already passed is generally not an option.) We refer to a facility that offers package s as a package s location from now on.
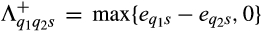
Suppose that service package s is of package type CTL. At a given point in time, we say that a truck driver is “covered” if his access time to package s is at most the critical time‐limit. Obviously, the larger the part of the time‐line the truck driver is covered, the more effective the service provisioning can be. Therefore, we define


Second, suppose that service package s is of package type RCTL. Now, we say that a truck driver is “covered” if his access time is smaller than the recommended time‐limit, that he is “not covered” if his access time exceeds the critical time‐limit, and that he is “partially covered” otherwise. We assume that the degree of coverage with package s decreases linearly from 1 (covered) to 0 (not covered) as the access time increases from the recommended time‐limit to the critical time‐limit (see the middle part of Figure : the lower the truck driver’s degree of coverage, the darker the shade of grey). Next, we define


Finally, suppose that the service package is of package type ASAP. Then, for each point of time during the truck driver’s trip, the following holds: the lower the access time, the more effective the health service accessed can be. Based on this observation, we define


Model
In this section, we formally model the RHFLP. Some notations are introduced in sections 4.1. and 4.2 models the value of a set of location decisions in terms of volume of truck drivers served and effectiveness of healthcare provision. Next, section 4.3 introduces a MILP formulation of the problem. Finally, section 4.4 provides a worst case analysis with respect to data inaccuracy.
Notation
We model a problem instance by means of a graph G(L,E), where L and E denote a set of vertices and a set of edges connecting these vertices, respectively. Table introduces the notations we use to denote the graph, service packages, demand parameters, decision variables, and auxiliary variables.
Table of Notations
Here, a truck flow q represents a collection of truck drivers who travel the same long distance route. A route defines a path in the graph, starting from origin 


Optimization Criteria
A solution ω = (


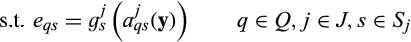
This definition of 
Let us now quantify for a given solution ω ∈ Ω the effectiveness of health service provisioning. We denote the number of truck drivers in flow q demanding service package s by 

We let functions 


These functions 


Effectiveness of Package s Provisioning as a Function of
Parameters 


For later use, we represent the total effectiveness of health service provisioning by 
MILP Formulation
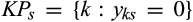
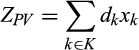
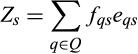
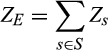
The measures presented in section 4.2 allow us to introduce the following problem formulation, which we refer to as the Roadside Healthcare Facility Location Problem (RHFLP). Here, parameters r ∈ [0,1] and (1−r) ∈ [0,1] capture the relative importance of the patient volume criterion and the effectiveness criterion, respectively: 
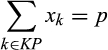


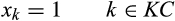


The objective function (8) maximizes a weighted sum of 


The nonlinearity of these Equations makes a mixed‐integer nonlinear programming (MINLP) model, which is generally very hard to solve. In Appendix B, we show how this model can be non‐trivially transformed into a mixed integer linear programming (MILP) model. Specifically, it suffices to replace Equations by constraints (20)–(23) and (25)–(39). We also prove that the vast majority of the binary variables needed to perform this transformation can be relaxed to continuous variables, since the corresponding constraint matrix is totally unimodular (TU). This substantially decreases the model complexity.
In Online Appendix D, we prove the following by reduction from the problem CLIQUE:
The RHFLP, as formulated by (8)–(15), is strongly 
Compared to the model presented by Ares et al. (2016), model (8)–(15) has a simplified objective function (8), as it disregards equity. Section 5.8 discusses how this criterion can be added to model (8)–(15). At the same time, constraint (9) At the same time, constraint (9) now captures three instead of one effectiveness modalities, allowing for the introduction of service package differentiation, as expressed in constraints (11), (12), and (14). Constraints (20)–(39) in Appendix B form the non‐trivial linearization of (9). See section 1 for our discussion on contributions of both papers.
Worst‐case Effect of Imprecise Input Data
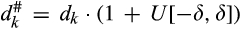
Parameters 

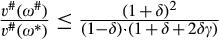
Proposition provides an upper bound on this gap (see Online Appendix E for the proof). Here, 


If the true values of 

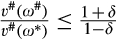
To illustrate this bound, let δ be equal to 0.1. Then in the worst case, the true value of 

Let us now analyze the optimal solution’s sensitivity with respect to the parameters 

If the “optimal” values of 
For example, if γ = 0.5 and δ = 0.1, then in the worst case, the optimality gap is at most 11%.
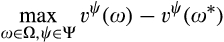
It is easy to see that, in the worst case, the true value of a given parameter is either the fraction δ larger or the fraction δ smaller than the presently used values. Let an extreme realization of the parameters of interest be represented by ψ ∈ Ψ, and let 
Numerical Analysis
This section illustrates how our model can be used for strategic planning and reveals practical insights for decision makers. We use CPLEX 12.6.2 to solve our MILP model, on a PC with a 3.4 AMD A4‐5300 processor and 8 GB RAM.
South‐East Africa Case
We base our baseline case on the network of major transport corridors in South‐East Africa. This network of roads spans 14 sub‐Saharan countries and connects the main ports in the region with the main inland cities and other areas of economic importance such as the copper belt in the DRC. It consists of three subsets of corridors: (i) the North‐South Corridor, which spans the region from Tanzania to South Africa, (ii) the Central Corridor, which runs from the port of Dar es Salaam (Tanzania) into Burundi, Rwanda, and the DRC, and (iii) the Northern Corridor, which connects the port of Mombasa (Kenya) with landlocked countries lying east and north of Kenya. Figure depicts the corridor network as a graph consisting of the 29 RWCs North Star operated in this network at the time our case study was finalized (August 2016) and 85 potential RWC locations.
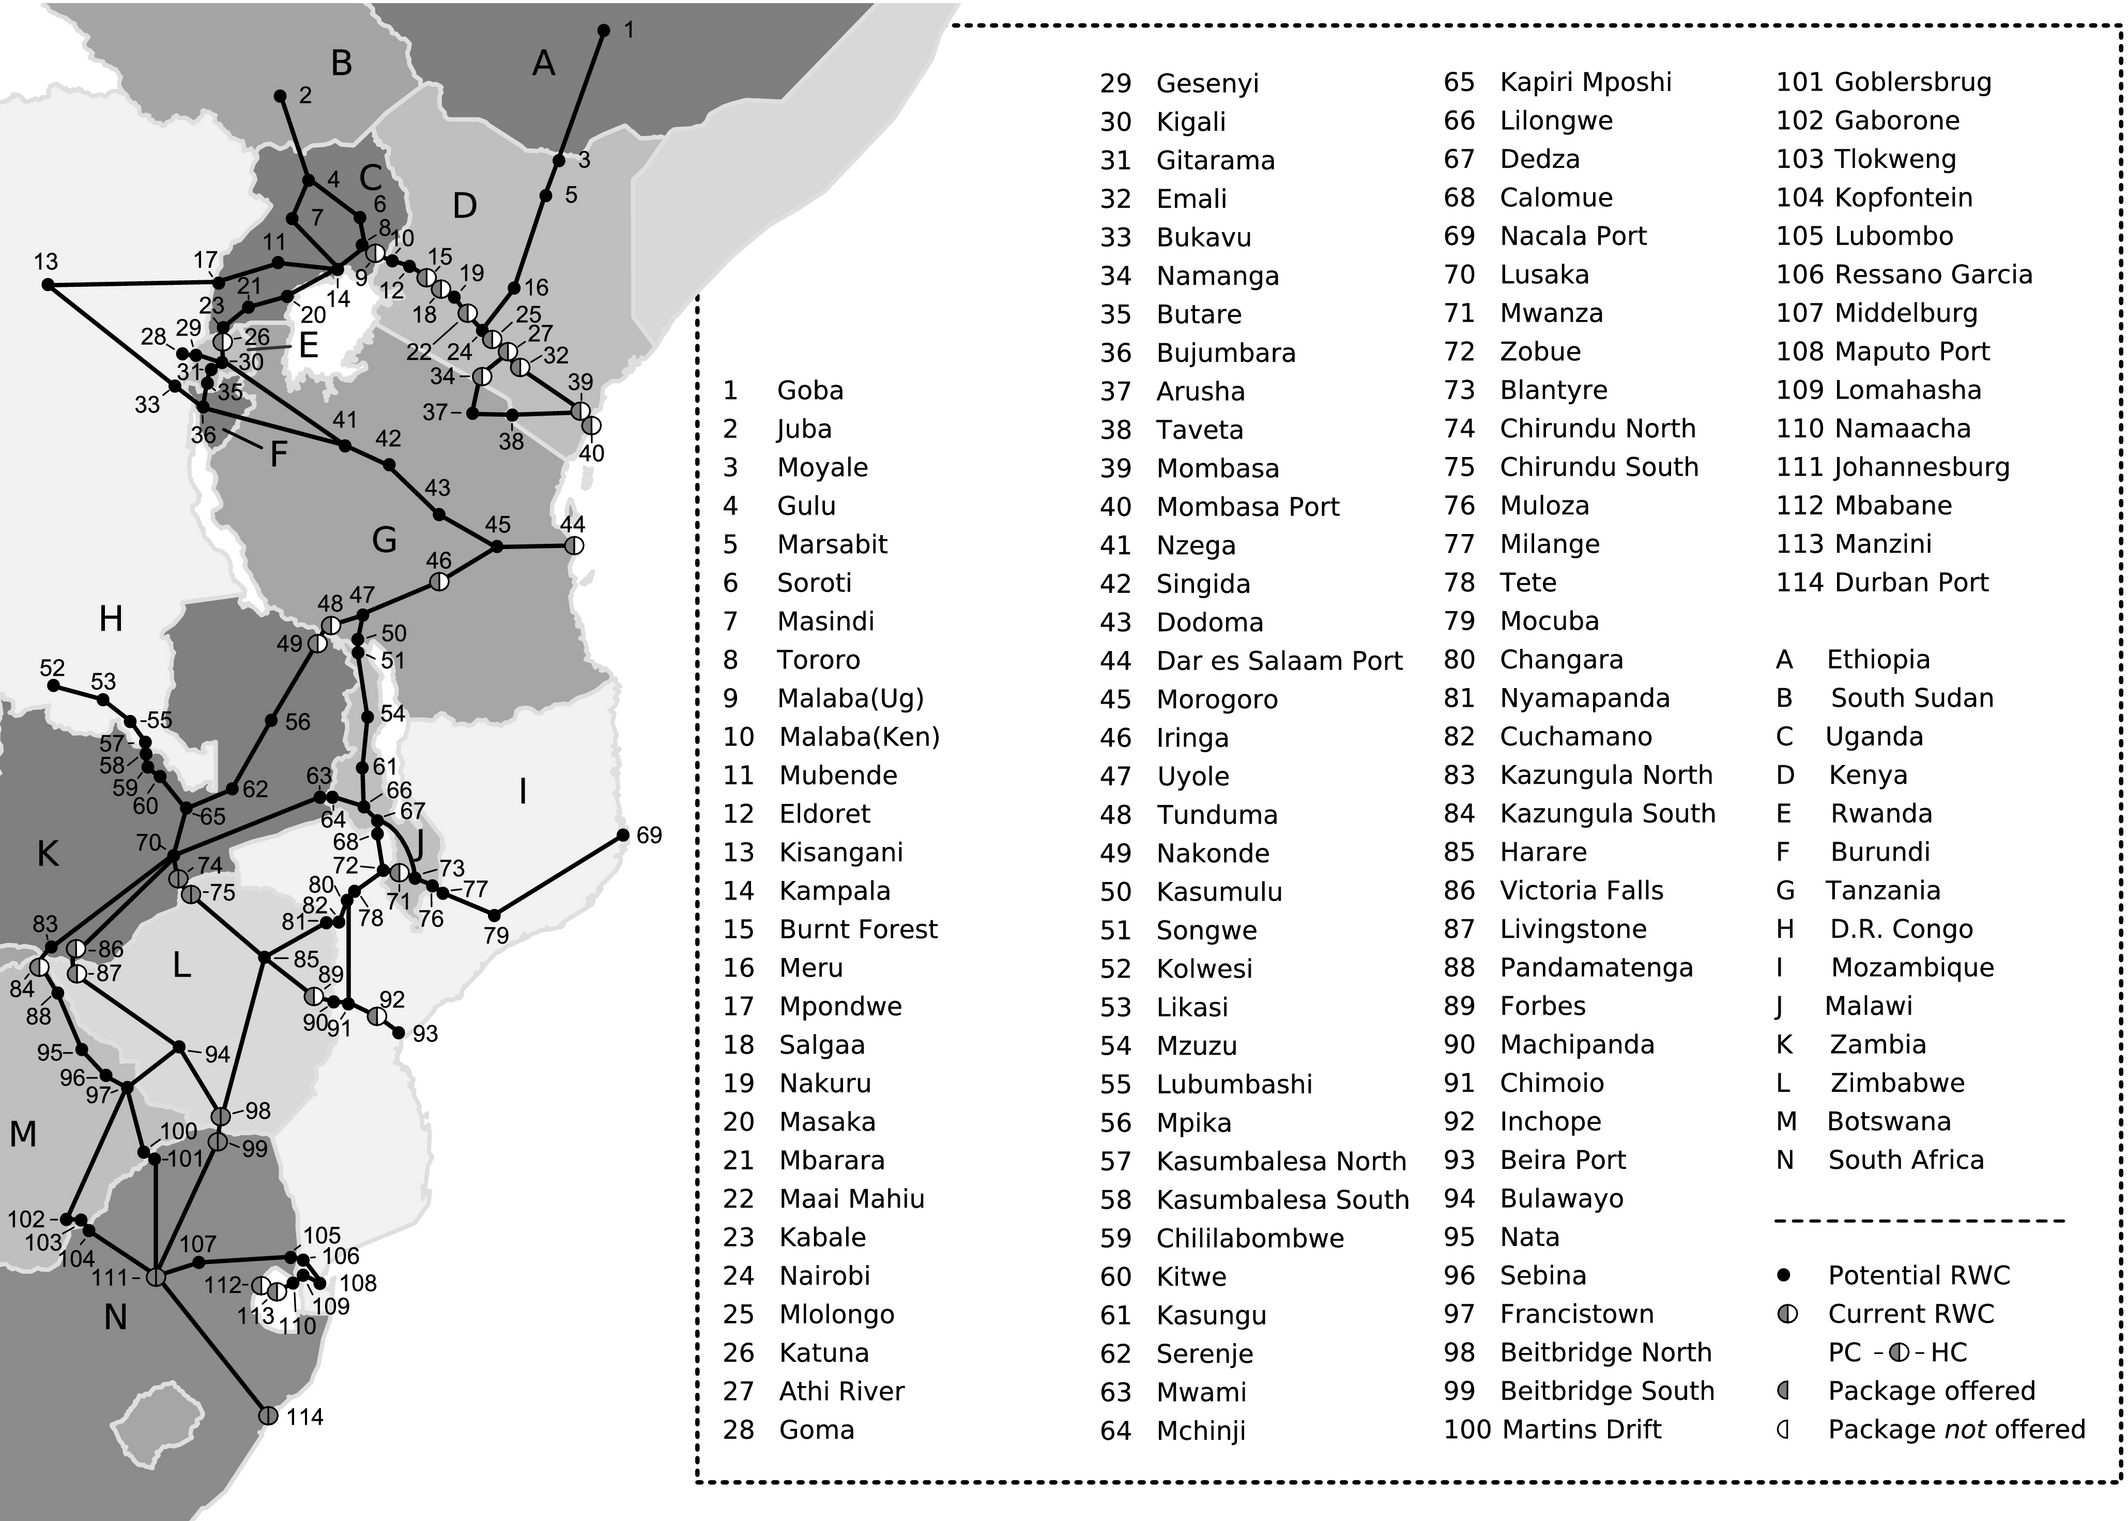
Map of the South‐East African Transport Corridor Network
The case study data sources are summarized in Table and a full description of the data is provided in Online Appendix I. In line with package allocation choices currently faced by North Star, we choose the primary care (PC) package to be a standard service package and the HIV care (HC) package to be the only optional service package. Hence, in the baseline case, S = {PC,HC}. The data sources identify 95 major truck flows, and their health service needs are calculated as 


Data Sources Baseline Case
Finally, we use least squares optimization to fit the relationship between truck volume along current RWC locations 


Our calibration of the relationship between access and effectiveness is based on structured expert surveys. Specifically, we asked two experts from North Star to quantify the relative importance w(s) of the two service packages s, to connect to each service package a corresponding package type, yielding 


Parameters Describing the Relationship Between Access and Effectiveness of Package s Provisioning


Note
The TC, SC, and MC packages are only used in section 5.7. W.l.o.g. we set scaling factor σ = 1/25
When asked to elaborate on their service type allocation—PC to the RCTL type and HC to the ASAP type—the experts made references to the criticality of corresponding health services, the aforementioned distance decay relationship, and the benefits of repeatedly passing a health facility:
Experience suggests that decision makers will vary the parameter r in the software package we developed (see North Star Alliance 2011) until one or more satisfactory solutions are obtained. This is essentially a basic way to calibrate parameter r. We initially assume that decision makers can identify the “optimal” value. Sensitivity towards this assumption is analyzed in section 5.6. Under this assumption, it suffices that parameters 
The service package type allocation obtained from the expert surveys—PC to the RCTL package type and HC to the ASAP package type—is largely influenced by the time criticality of the corresponding health services, the aforementioned distance decay relationship, and the benefits of repeatedly passing a health facility, as reflected by the quotes in section 3.
We finally note that the parameterization for HC is much more conservative than the requirement of facilitating monthly or bimonthly follow‐up visits for drivers under HIV treatment.
Network Expansion Strategies
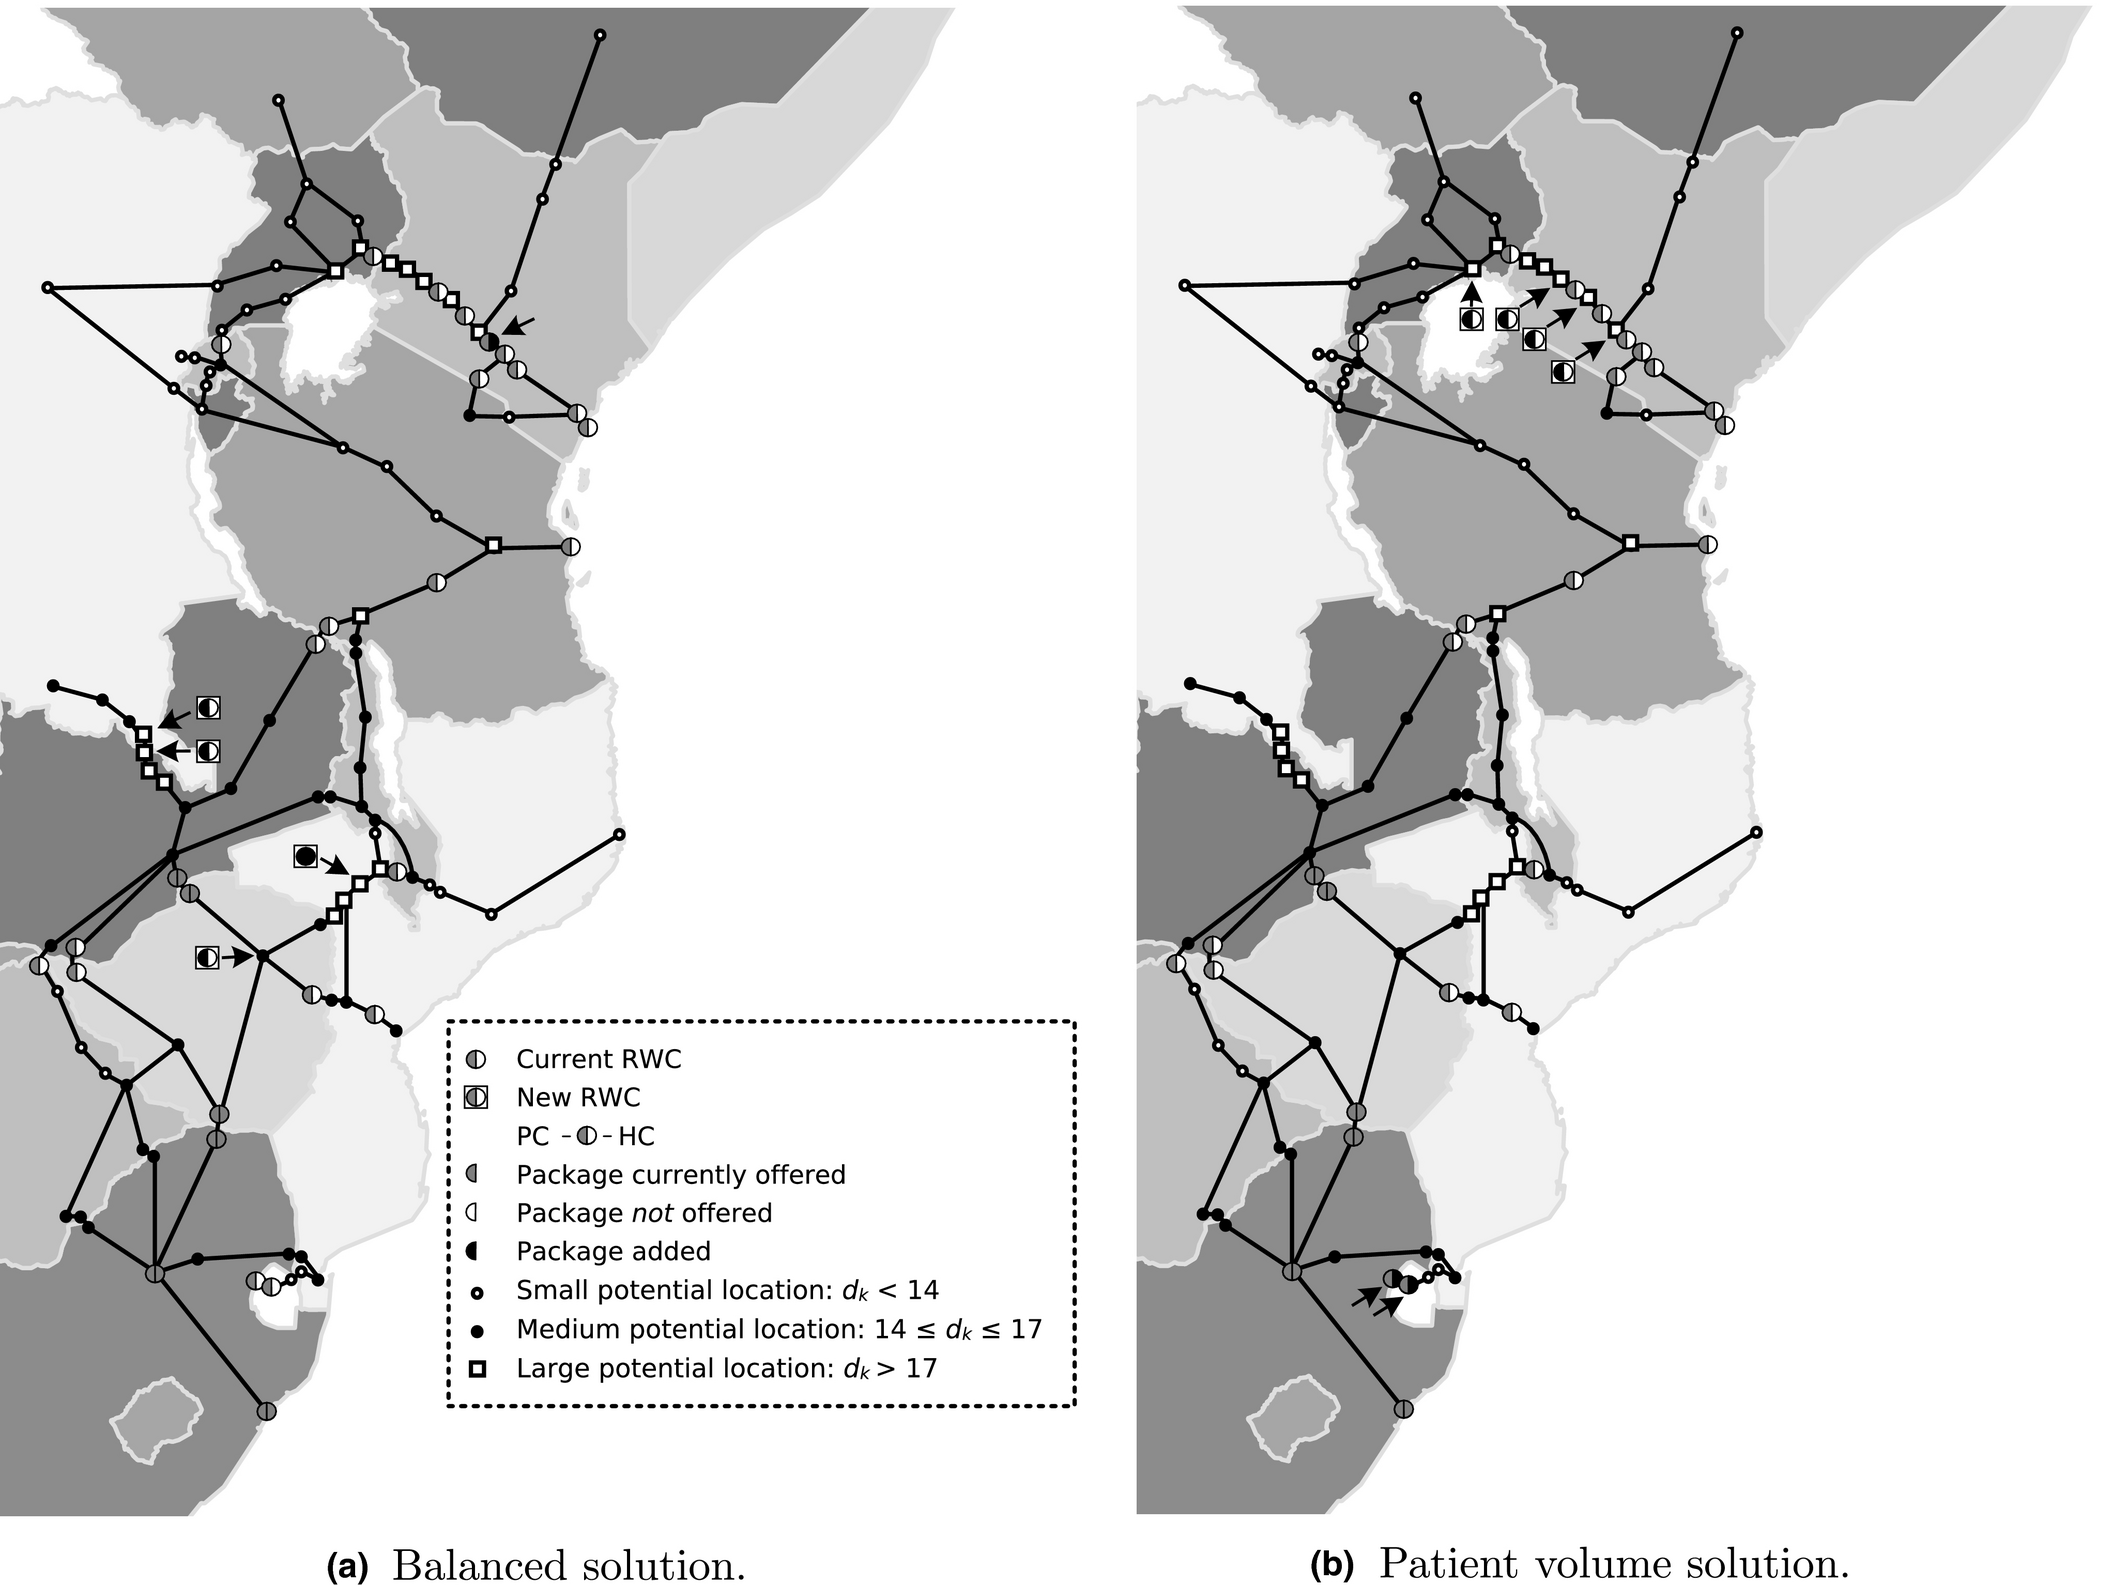
Based on the parameter values from the baseline case, we optimize locations of 4 new RWCs and the allocation of the HC package among two established RWCs (i.e., 

Figures a and b and Table describe the optimal solutions yielded by the balanced strategy and the patient volume strategy. We see that the “balanced solution” results in a relatively lower expected daily patient volume (5.3% points lower) but also in a substantially higher effectiveness (14.5% and 42.6% points higher for PC and HC, respectively). The latter is illustrated by the bubble plots in Figures a and b, which depict the solutions’ impact on the effectiveness of package PC provisioning for the 95 truck flows separately. The reason is that the patient volume solution places RWCs in the busiest parts of the network, which are already well‐served by current RWCs (see Figure b). The balanced strategy, instead, yields locations that fill up gaps in the RWC network. For example, Figure shows how the new RWCs improve the degrees of coverage with the PC package during trips along the routes connecting the ports of Durban, Beira, Nacala, and Dar es Salaam with the copper belt (Kolwesi, DRC).
Optimal Location Decisions for the Baseline Case

Effectiveness of Package PC Provisioning for the 95 Truck Flows before and after Implementing the Balanced Solution and the Patient Volume Solution. A Bubble’s Size Reflects the Number of Truck Drivers in the Corresponding Flow [Color figure can be viewed at

Degree of Coverage (see section 3.2) with the PC Package before and after Locating the New RWCs at each Point of Time During a Trip from a Major Regional Ports (Durban, Beira, Nacala, and Dar es Salaam) to the Copper Belt (Kolwesi, DRC). The numbers Correspond to the Location Numbers Introduced in Figure 3 [Color figure can be viewed at
Daily Patient Volume (


Note
The percentage improvement with respect to the initial network is given between brackets.
The optimal network obtained when relocation of clinics is allowed moves 17 of the current 29 clinics and all of the 6 current HC packages to a different location. Compared to the case when relocation is not allowed, this significantly increases patient volume (8.9% point increase) and the effectiveness of PC provisioning (7.0% point increase) and HC provisioning (19.4% point increase). This provides a strong argument for critically assessing the fitness of the current network.
Finally, the optimal solutions illustrate an important property of the RHFLP: adding a given package to multiple locations can bring about synergy effects. For instance, when adding the PC package to Kasumbalesa North or to Kasumbalesa South only, the effectiveness of package PC provisioning to truck flow Nacala Port ‐ Kolwesi increases by 0.09, whereas it increases by 0.27 if this package is added to both locations. This is a direct implication of the assumption that a certain level of access is required before this translates into a strictly positive level of effectiveness. These effects suggest that long‐term network planning instead of making location decisions consecutively can be beneficial, as we further explore in section 5.4.
Importance of Balancing Patient Volume and Effectiveness
Let us analyze the trade‐off between the two main objectives in some more detail now. Figure summarizes the results when solving the RHFLP for the baseline case with the number of facilities (with PC packages) to be placed p ∈ {2,4,8,12,…,44,48,50}, the number of HC packages to be allocated 

Pareto Curves for Various Values of p, with
The results show that focusing solely on one criterion—that is, choosing r = 0.0 or r = 1.0—results in significant sub‐optimality in terms of the other criterion. When also assigning some weight to the other criterion, large gains in effectiveness (patient volume) can be made at a marginal loss in patient volume (effectiveness). The “irregular behavior” of the effectiveness score for r = 1.0 (i.e., the lowest point of each curve) is caused by the indifference on where to place the HC package, leading to more or less random package allocation decisions.
Importance of Network Planning
To assess the added value of long term network planning over consecutive decision making, we now calculate for the baseline case the optimality gap when locating clinics one at a time for p ∈ {2,4,…,50} and 

The results show that consecutive decision‐making yields near‐optimal location decisions: the optimality gap does not exceed 0.28%. This seems surprising, given the earlier observation that network planning allows for a better exploitation of synergy effects. We note, however, that such effects are only attainable for a given truck flow when its current level of access is lower than the “access threshold”: the level of access required for a strictly positive level of effectiveness (e.g., 
We hence argue that network planning is mostly beneficial when the network of clinics is still small and/or when relatively many clinics are required to exceed the access threshold. To assess this, we calculate the optimality gap for consecutive decision making when no clinics are presently in the network and when 


Table describes the results, which confirm our hypothesis. Consecutive decision making can substantially underperform in greenfield situations, in particular when the access threshold is large. The effectiveness increase attainable when locating a single clinic is comparatively small in such cases, so that location decisions are mostly determined by patient volumes. As a consequence, the solutions perform well in terms of patient volume, but weakly exploit possible gains in effectiveness.
Optimality Gap (%) for Consecutive Decision Making in a Greenfield Situation; Overall and for Separate Objectives


These observations suggest the existence of a tipping point: a point at which most of the synergy effects have been obtained and from which one can switch to consecutive decision making without risking substantial suboptimality. To further investigate this, we analyze the optimality gap when switching to consecutive decision making, depending on the density of the network. Specifically, we again consider the greenfield synergistic situation and p = 20. We perform network planning in the startup phase, corresponding to 


Blue: Optimality Gap when Performing Network Planning for the First


The results show that the optimality gap drops to almost 0% when 
Sensitivity Analysis on Demand Parameters
Proposition proves worst‐case bounds for the optimality gap induced by impreciseness in the demand parameters 


Optimality Gap (%) by Imprecise Demand Data
Note
The results indicate that the optimal solution is highly insensitive to impreciseness. Even when the true values of the demand parameters deviate by up to 100% from the presently used values, the maximum optimality gap attained in the 50 demand scenarios is only 3.8%. This can be explained by the fact that near‐optimal solutions tend to locate facilities along the busiest truck routes and at the busiest truck stops. The location decisions in these solutions therefore tend to overlap considerably. As implied by the proof of Proposition (see Online Appendix E)), the effects of impreciseness are strongly correlated for such overlapping solutions, thus reducing the maximum optimality gap.
Sensitivity Analysis on Model Parameters
As argued, setting “optimal” values for r and 


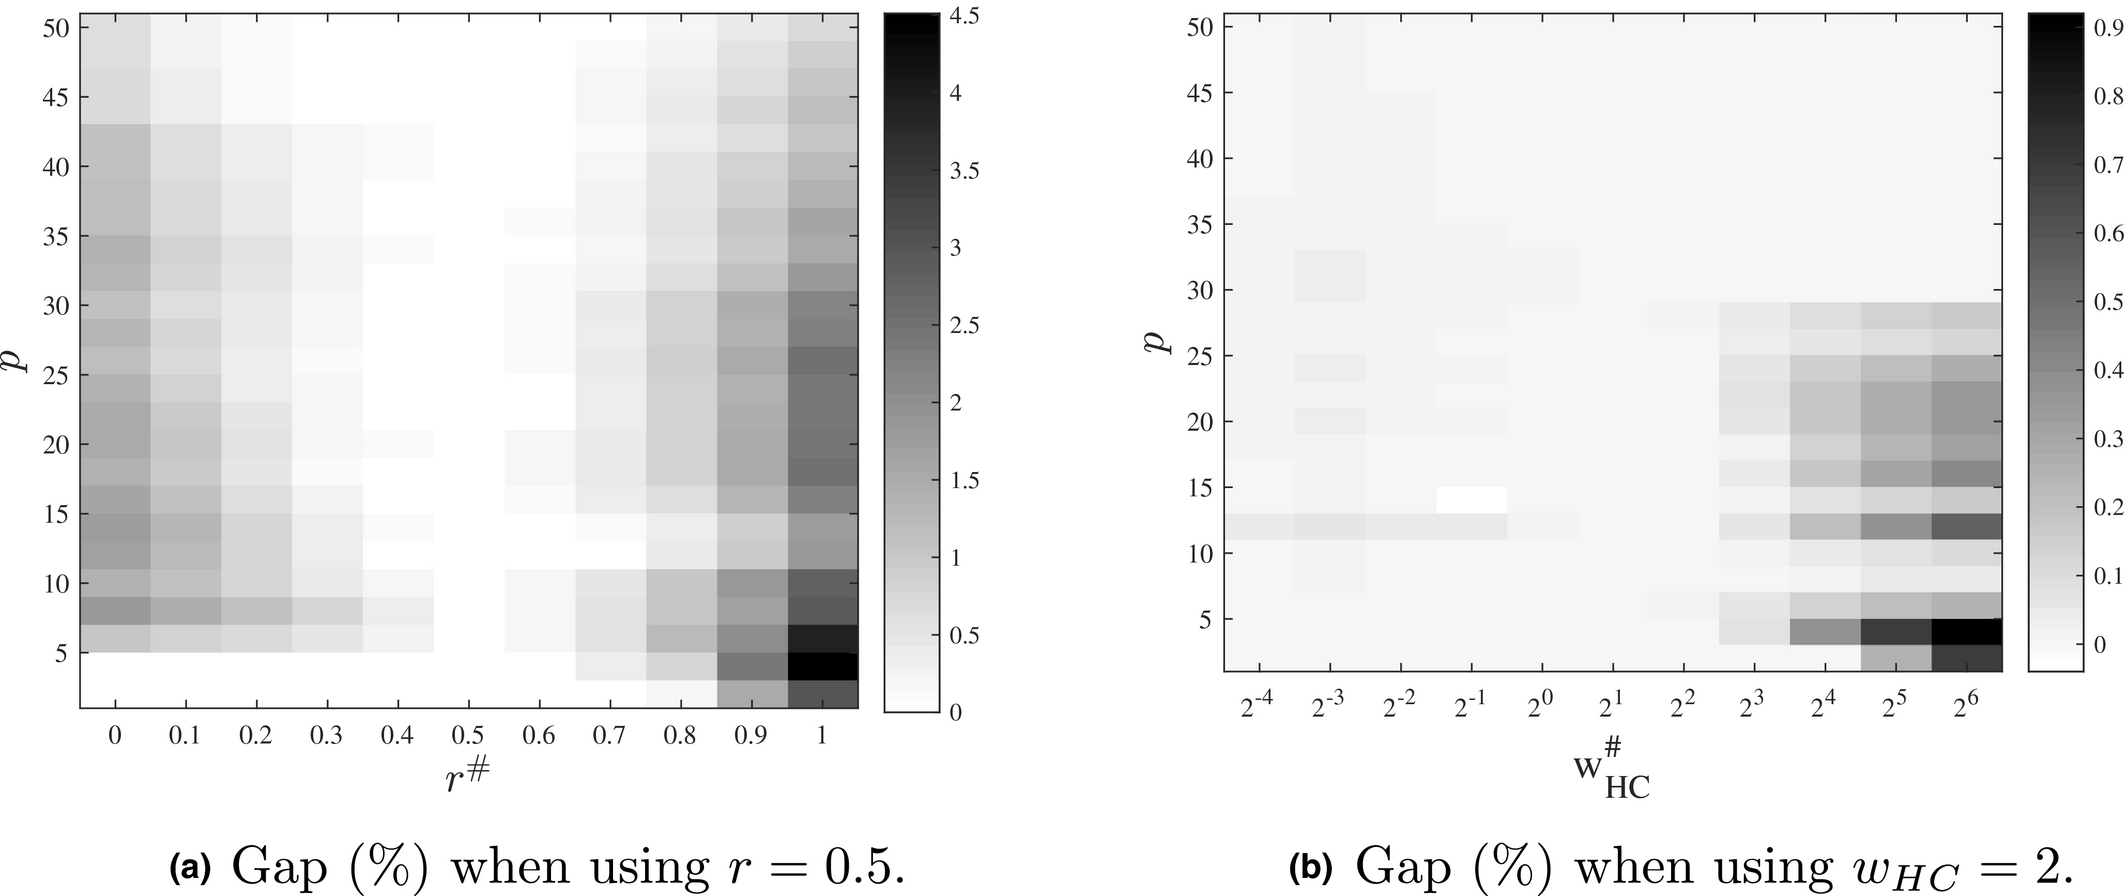
Optimality Gap (%) When Using Baseline Parameter Values for r and the Relative Importance of Service Packages Instead of the “Real” Values
The results show that solution values are very robust with respect to impreciseness in r and 

Selecting the “true” package type to a given package s may be subject to errors as well, as understanding of access requirements is still in early stages of development. We therefore assess the potential impact of assigning the “wrong” package type to package PC. For each package type j ∈ J, we determine the parameters of function 


Table summarizes results, which show that selecting a wrong package type can induce an optimality gap of up to approximately one percent for the case considered. This on the one hand makes it beneficial to adequately assess the package type, but on the other hand suggests that solution values are rather robust with respect to wrong package type choices. For example, applying the three functions to the 10 configurations of RWCs included in the survey yields rather similar function values (see Online Appendix G).
Optimality Gap (%) When Choosing Package type j While the “true” Package type is j #

Model Statistics
Table describes the solution times and model statistics of 12 problem instances. The problem instances are defined by the number of truck flows (55 or 95), the number of different service packages (2 or 5), and the structure of the network (baseline, dense, or sparse). The three additional service packages are: tuberculosis care (TC), STI care (SC), and malaria care (MC). Table shows the definitions of the corresponding effectiveness variables. The fractions of truck drivers who need these packages were again estimated based on data from the global health data repository (WHO 2016) and are provided in Online Appendix I. The sparse network is generated by selecting the minimum spanning tree of our graph G(L,E), and the dense network is generated by adding for each vertex two imaginary edges that connect this vertex with the two closest neighbor vertices it was not connected to in the baseline network. We generate the time needed to traverse such imaginary edge by dividing the Euclidian distance of the edge by the average speed of 40 km/hour. For both alternative network structures, we determine the shortest origin‐destination routes. All other parameters are kept as before.
Model Statistics for 12 Problem Instances
We observe that the CPU time needed to solve an instance tends to grow rapidly when |Q| increases, when |S| increases, and when the network becomes sparser. This is well explained by the observations that, in each of these cases, the number of variables and constraints increase and the LP relaxation of the MILP becomes weaker, which tends to negatively impact the performance of a branch‐and‐bound algorithm. Note that sparser networks bring about many additional variables in Equation and additional constraints in Equations -, because the number of RWC locations along a route, 
Incorporating Equity
The presented MILP model could be extended to include equity of access to healthcare as an additional objective along the lines of Ares et al. (2016). Their paper proposes to take a weighted sum of pairwise absolute differences in effectiveness between different truck flows as a measure of equity. As effectiveness is calculated for each service package in our context, we propose to additionally sum the equity terms over the packages. Specifically, letting 


To analyze sensitivity of optimal solutions towards equity, we assess the trade‐off between 


Pareto Curves for


To assess the impact of incorporating equity on computation times, we repeat the numerical experiments from section 5.7, using 
Discussion and Conclusions
This study considers the design problems arising when developing an integrated network of roadside healthcare facilities to meet health service needs of truck drivers, as operated by NGO North Star Alliance. More specifically we consider the problem of choosing optimal locations for clinics that are added to the existing network, and allocating service packages to clinics. The optimization considers two criteria: the number of truck drivers served and the effectiveness of the service delivery to the population served. We model the latter criterion through three novel access measures.
The resulting optimization problem differs from previously studied healthcare facility location problems, which typically assume patients to be static instead of mobile. This study develops a mixed‐integer linear programming model which captures the three access measures. This model has been implemented in a software package called POLARIS and installed at headquarters (North Star Alliance 2011). We also present computational analyses and address prominent managerial questions and challenges, using the network of major transport corridors in South‐East Africa as a case study.
One such question deals with the suitability of heuristic approaches to make network design decisions. North Star NGO has predominantly made such decisions based on the first objective: maximize patient volumes. While intuitively appealing, our experiments indicate that this approach may need to be reconsidered, as such decisions may be quite different from those maximizing health. We show that solutions that are close to optimal for both patient volume and effectiveness can be obtained by balancing the weights of the criteria in the objective function. In other words, considerable gains in effectiveness of the services are attainable when taking the second criterion into account, without having to reduce the number of truck drivers served much.
We also analyze the heuristic of making decisions consecutively, as is current practice, as opposed to planning ahead future expansion decisions. In a context where many clinics are presently operating, consecutive decision making is shown to yield near‐optimal decisions. This is an important finding, as it suggests that advanced and possibly expensive optimization tools might not be needed in such contexts. Long term network planning, however, substantially outperforms such heuristic in greenfield situations and in cases when synergy effects of placing multiple locations are substantial.
Impact of impreciseness in data and model parameters on solution quality presents another prominent question. Availability and quality of data is essentially limited in sub‐Saharan Africa. Moreover, understanding the relationship between access to services and effectiveness is still in early stages of development and parameter calibration may be weak. We present extensive theoretical and computational analyses on the relationship between data inaccuracy and solution values. These reveal that the solutions found are highly robust to impreciseness, suggesting that difficulties in acquiring precise input data do not necessarily hinder effective location choices.
Although, as we prove, the RHFLP is strongly 
As access to health services is a human right laid down in the WHO constitution (United Nations 1946), we advocate that, once the high volume needs are addressed, equity considerations are taken into account in future network expansions. Along the lines of Ares et al. (2016), our work proposes how to extend our model to include this criterion and shows that substantial gains in equity can be attained at a marginal loss in the other criteria. Much additional work is yet to be done to better understand adequate models and assess trade‐offs. One specific challenge is to develop methods that identify so‐called equitably efficient solutions (see Ogryczak 2000). Our model also does not capture possible effects of location and service package decisions on patient volumes. These may include competition effects, marketing or repetition effects, and effects of offering a more comprehensive set of health services. For example, Morris and Ferguson (2007) show that demand is partly affected by the availability of public healthcare providers. Follow‐up research could investigate the magnitude of such effects for the truck driver population, propose richer models for 
The proposed model captures the effectiveness of services provided via three newly proposed measures of access. The validity of these measures and their parametrization should be strengthened. For example, there is much room for improvement in terms of understanding the mechanisms relating access to effectiveness and the role of the composition of a package in these relationships. For instance, integrating HIV and TB care is known to bring about significant synergy effects. One specific area is to investigate possibilities to calibrate model parameters through empirical research relating differences in health outcomes to differences in access. We believe that the models, and subsequently the solutions proposed and health services provided to the truck drivers can greatly benefit from advancing scientific understanding in this area.
Acknowledgment
We thank all the staff from North Star for their support and close cooperation in this research. We also acknowledge Kevin Dalmeijer for contributing to the strongly NP‐completeness proof. Finally, we thank the ORTEC Consulting Group for the close collaboration on this project and the support provided while developing software‐package POLARIS and implementing this at North Star.