
Abstract
Sibling correlations have gained increasing prominence in inequality studies as a measurement of the total impact of family background on individual outcomes. Whilst previous studies have tended to use traditional socio-economic measures such as parent’s income or education, this paper introduces an analytical class approach to sibling studies by analysing how much of the influence that siblings share in their long-term income results from class origin. Data are from Statistics Denmark and consist of 290,399 individuals born between 1963 and 1973. Models are estimated which – in addition to parents’ education and income – include modifications of the Erikson–Goldthorpe–Portocarero schemes ranging from 3 to 15 classes and Grusky’s micro-class scheme of 72 classes. The results show that although class adds to explanations of the family influence on children’s income, most of the sibling similarities are not explained by parental education, income or class. Depending on gender, the class schemes explain between 8 and 13 per cent of the sibling similarities and 15 to 20 per cent when parents’ income and educations are also included. Models with different class schemes demonstrate that elaborated versions of the EGP class scheme add little to the explanation of similarities between brothers, sisters and mixed siblings.
Introduction
Over the last three decades the relevance of social class as an analytical tool for the study of persistent inequalities in contemporary society has been widely debated. These debates have resulted in a long line of studies providing consistent empirical evidence that parents’ social class remains an important factor in explaining inequality in a number of outcomes for their children, such as educational attainment (Breen, 2004), family life (Carlson and England, 2011), and health and mortality (Elo, 2009).
However, previous studies have paid little attention to the relation between parents’ social class and their children’s long-term income. In explaining the lack of integration between social class studies and income studies, three factors appear important. First, because of data limitations, detailed information on income is often missing in data sets with information on occupation and employment, and vice versa (Albertini, 2013). Second, when examining the persistence of economic inequality, sociologists and economists tend to use different measures of inequality (Atkinson and Brandolini, 2013; DiPrete, 2007). Whilst most sociologists use categorical measures such as social class, economists are more likely to use continuous measures such as earnings or wealth (Goldthorpe, 2012). Third, class analyses have always been characterised by heated arguments over the definition and number of social classes, making comparisons difficult not only between income studies and class studies but also between studies with different class schemes (Crompton, 2008).
In this study I used sibling correlations to investigate whether analyses of the effect of family background on long-term income can benefit from an emphasis on social class. Sibling correlations are particularly useful measures for investigating the importance of family background effects on future outcomes because they provide information about what fraction of the variation in the variable of interest (i.e. income) can be attributed to factors shared by siblings who have grown up together (Mazumder, 2008). The more variation shared by siblings (i.e. higher correlation), the more family background matters for the children’s future socio-economic outcome. Recent sibling studies report that parents’ ability to transmit resources to their children is affected not only by their economic assets but also by their cultural family dispositions, such as parental involvement in schoolwork and parenting firmness (Björklund and Jäntti, 2012; Björklund et al., 2010).
Studies on sibling correlations and class can learn from one another in at least two ways. First, class provides an analytical framework for the study of sibling correlations, a framework that explains both economic and cultural family differences in transmitting resources across generations. Taking their departure from a definition of class as individuals’ or families’ structural position in the economy, measured by occupation or employment relations (Wright, 2009; Goldthorpe, 2000), these studies highlight cultural class differences in parents’ resources for supporting their children’s academic and occupational careers (see Farkas, 2003, for a review). For example, Lareau (2011) found that because of certain cultural class dispositions more suited to the schooling culture, middle-class parents were much better able than working-class parents to assist their children with schooling. Hence, class offers researchers a theoretical approach to studies on sibling correlations, an approach that combines theories on cultural reproduction patterns in the family with theories about the labour market and key institutions of the state apparatus (e.g. the educational system). Second, sibling correlations provide class analyses with a robust, overall empirical measure of the importance of family background characteristics.
Using sibling correlations as a measure of family background, this study contributes to the on-going discussion about the continued validity of the predominant Erikson–Goldthorpe–Portocarero (EGP) class scheme (Tåhlin, 2007). My analysis evaluates recent suggestions for modifying this scheme, ranging from those of post-industrial class theorists arguing for the inclusion of new classes of social and cultural specialists (Güveli et al., 2007; Esping-Andersen, 1993) to those of sceptics arguing that the class concept is an academic anachronism (Beck, 2013; Pakulski and Waters, 1996). Inspired by Piketty’s (2014) distinction between economic inequality due to either wealth or earnings, the analysis also evaluates a modification of the EGP class scheme which, in addition to the post-industrial classes, includes ‘old’ classes based on wealth, i.e. major entrepreneurs and agricultural holders.
Denmark is a highly useful case for evaluating the effect of social class origin on long-term income. Because the data come from Danish administrative registers for tax assessments, they have high reliability and consistency for measuring the income level and employment of family members, compared to similar data from surveys in which one individual accounts for the income level of the entire family. Moreover, Denmark is a comprehensive welfare state and this ensures a relatively high level of equality between classes in terms of income and health (Esping-Andersen, 2015). A prominent feature of this welfare system is that education is free at all levels, including the tertiary level, with the state providing students with monthly grants (regardless of parents’ income).
These features mean that, due to their upbringing, Danish children experience fewer constraints to succeeding in life than children from other advanced industrial societies (Benjaminsen, 2006). Thus I did not expect social class to explain a large part of the family effect on children’s future income. Nevertheless, if the analysis showed empirical evidence of a large family class effect on income, I would be able to infer that countries with greater inequality in conditions and opportunity may be even more affected by social class.
Theoretical background
This section presents the principal theoretical reasons for the inclusion of class as an important part of the explanation of family background effects on individuals’ long-term income. I begin by presenting the relevance of sibling correlations as a measure of the effect of family background.
Studies in sibling correlations
Analyses in sibling correlations have gained increasing prominence in studies on the effect of family background. Rather than stressing particular measurable family characteristics, sibling studies take a simpler, more comprehensive approach (Solon et al., 2000). Because the correlations capture everything shared by siblings throughout their upbringing, these studies view sibling correlations as an ‘omnibus measure’ of family effects, including parents’ socio-economic resources, their cultural norms and values, and neighbourhood influence (Björklund et al., 2002: 758). Since studies from the USA and Scandinavia have found that neighbourhood characteristics have very little influence on sibling correlations (Lindahl, 2011; Raaum et al., 2006; Solon et al., 2000), most researchers view sibling correlations as an upper bound on the family influence (Mazumder, 2008).
Of particular value is the fact that sibling correlations can be deconstructed into two terms: the first is the squared intergenerational elasticity, called ‘the intergenerational correlation’; the second describes factors uncorrelated with parental income. As research on Scandinavia estimates the sibling correlation in income at about 0.20 and the intergenerational income elasticity between father and son at about 0.25, Björklund et al. (2010) note that more than two thirds (1 – (0.252/0.20) = 0.69) of the total amount that siblings share in long-term income is unrelated to parental income. This finding allows for considerable room for other factors in explaining why some families have higher transmission rates of resources between parent and children.
Sibling studies on the effect of family background on long-term income therefore include non-economic variables measuring family characteristics such as family structure (e.g. number of siblings and single- or two-parent families) and parental involvement in schoolwork (Mazumder and Levine, 2003; see also Becker and Tomes, 1986, for an early remark). Using Swedish data, Björklund et al. (2010) found that, when accounting for family income and education, family practices are far more important than family structure in explaining sibling similarities.
Given that sibling studies often depend on data with very different variables for measuring family practices, researchers search for a more analytical frame for describing differences between families. As Morgan (2006: 5) noted, economists focus increasingly on categorical descriptions of the socio-economic status of families when analysing intergenerational income inequality (see also Atkinson and Brandolini, 2013, for a similar remark). For example, Mazumder (2005) compared the association of family background and future outcome characteristics by categorizing the earnings of sons and fathers into deciles. Björklund and Jäntti (1997) used the term ‘income classes’ in differentiating between families with different economic and cultural assets and resources. However, as Goldthorpe (2012) argued, the aggregation of socio-economic family resources into groups does not provide a consistent theory about how and why families differ (see Wright, 2009, for a similar observation). Goldthorpe pointed out that income, wealth and even education are the outcomes, not the causes, of social structures.
The relevance of social class in income studies
Dahrendorf (1959 [1957]) and Ossowski (1963) argued over half a century ago that a fundamental difference existed between thinking about inequality in terms of continuous socio-economic measures (e.g. wealth or earnings) and applying the class concept: whereas the former covers only a statistical operationalisation, the latter includes a theory of the inequality structure. Goldthorpe has consistently endorsed the use of the class concept. Instead of using simple empirical categorisations (e.g. income or status groups) that can differ greatly when applied in different contexts, Goldthorpe (2012) argued that the theoretically-derived classes take into account the underlying societal structure that facilitates the production and persistence of inequalities. Thus, whereas the continuous measures provide only descriptions of the outcomes of these structures, the class approach seeks to explain the mechanisms that generate the (economic) outcomes. Furthermore, whilst continuous measures refer to only one dimension of inequality, the class concept implies a relational, multidimensional social theory.
In his most recent definition of class, Goldthorpe (2000) identified a key mechanism of the inequality structure in the employment structure that groups people into three fundamental classes: employers, the self-employed, and workers. These classes in turn can be broken down into more detailed classes by dividing the within-class occupations according to their type of ‘regulation of employment’ (Goldthorpe, 2000: 209). For example, whilst the working classes (e.g. lower-grade technicians, skilled manual workers) usually have labour contracts, the middle classes (e.g. professionals, managers) have service relationships. Goldthorpe and McKnight (2006) found a correspondence between the theoretically derived classes and individuals’ economic life in terms of security, stability and prospects.
Other studies have reported that class played a key role in explaining family differences in cultural norms and practices (Farkas, 2003; Bowles and Gintis, 2002), differences possibly affecting their children’s long-term income. Most notably, such studies show class differences in how parents help their children deal with institutions that govern the transition to higher education (Schoeni and Ross, 2005). In explaining cultural differences between middle class and working class parenting, Lareau (2011) used the term ‘concerted cultivation’ to highlight how middle class parents attempt to foster their children’s talents by incorporating organised activities into the children’s lives. This concerted cultivation means that whilst working class children depend heavily on educational institutions during the transition, middle class children receive additional parental help, a benefit giving them more confidence in their academic and occupational opportunities.
In addition, research has found that the effects of parental class are not limited only to childhood but also affect the ‘children’ during adolescence and (early) adulthood; for example, studies on class-based differences in factors that might affect long-term income, such as the likelihood of marriage, divorce rates, household structures and parenting (Furstenberg, 2008). However, because class theories are diverse and sometimes even contradictory, the analysis in this paper is limited to an analytical approach to class, an approach that categorises individuals or families relative to their main occupation − what Crompton (2008) termed the ‘employment aggregate class approach’. Starting with the EGP class scheme, the next section explains how this approach, by evaluating recent contributions, provided an understanding of how family class affects children’s long-term income in contemporary society.
The EGP class scheme and its revisions
In their empirical analyses of the European class structure, Erikson et al. (1979) introduced the Erikson–Goldthorpe–Portocarero (EGP) class scheme which emphasised the growing middle classes in Western societies during the post-WW2 economy. This scheme, comprising seven classes, originally distinguished between occupations in market and work situations: ‘market situation’ is the income source and level of the occupation; and ‘work situation’ constitutes the levels of authority and control of individuals in that particular occupation (Goldthorpe, 1987). In his later analyses Goldthorpe redefined this class scheme by differentiating class according to individuals’ employment relations, i.e. their conditions of employment and types of labour contracts (Erikson and Goldthorpe, 1992). This modification allows researchers to break the seven classes down into eleven. For example, some classes are based on labour contracts (e.g. manual and lower-grade non-manual workers), and other classes are based on service relations (non-manual classes of professional, administrative and bureaucratic managerial staff). Nevertheless, because of data limitations, some studies draw on a restricted version, with only three classes: the service class, the intermediate class, and the working class. Table 1 summarises the three versions of the EGP class scheme, showing the sample shares of families in each class category used for the analysis.
The three original versions and the two modifications of the EGP-class scheme: percentages refer to the distribution of classes included in the analysis, defined by the family breadwinner (n = 189,279).
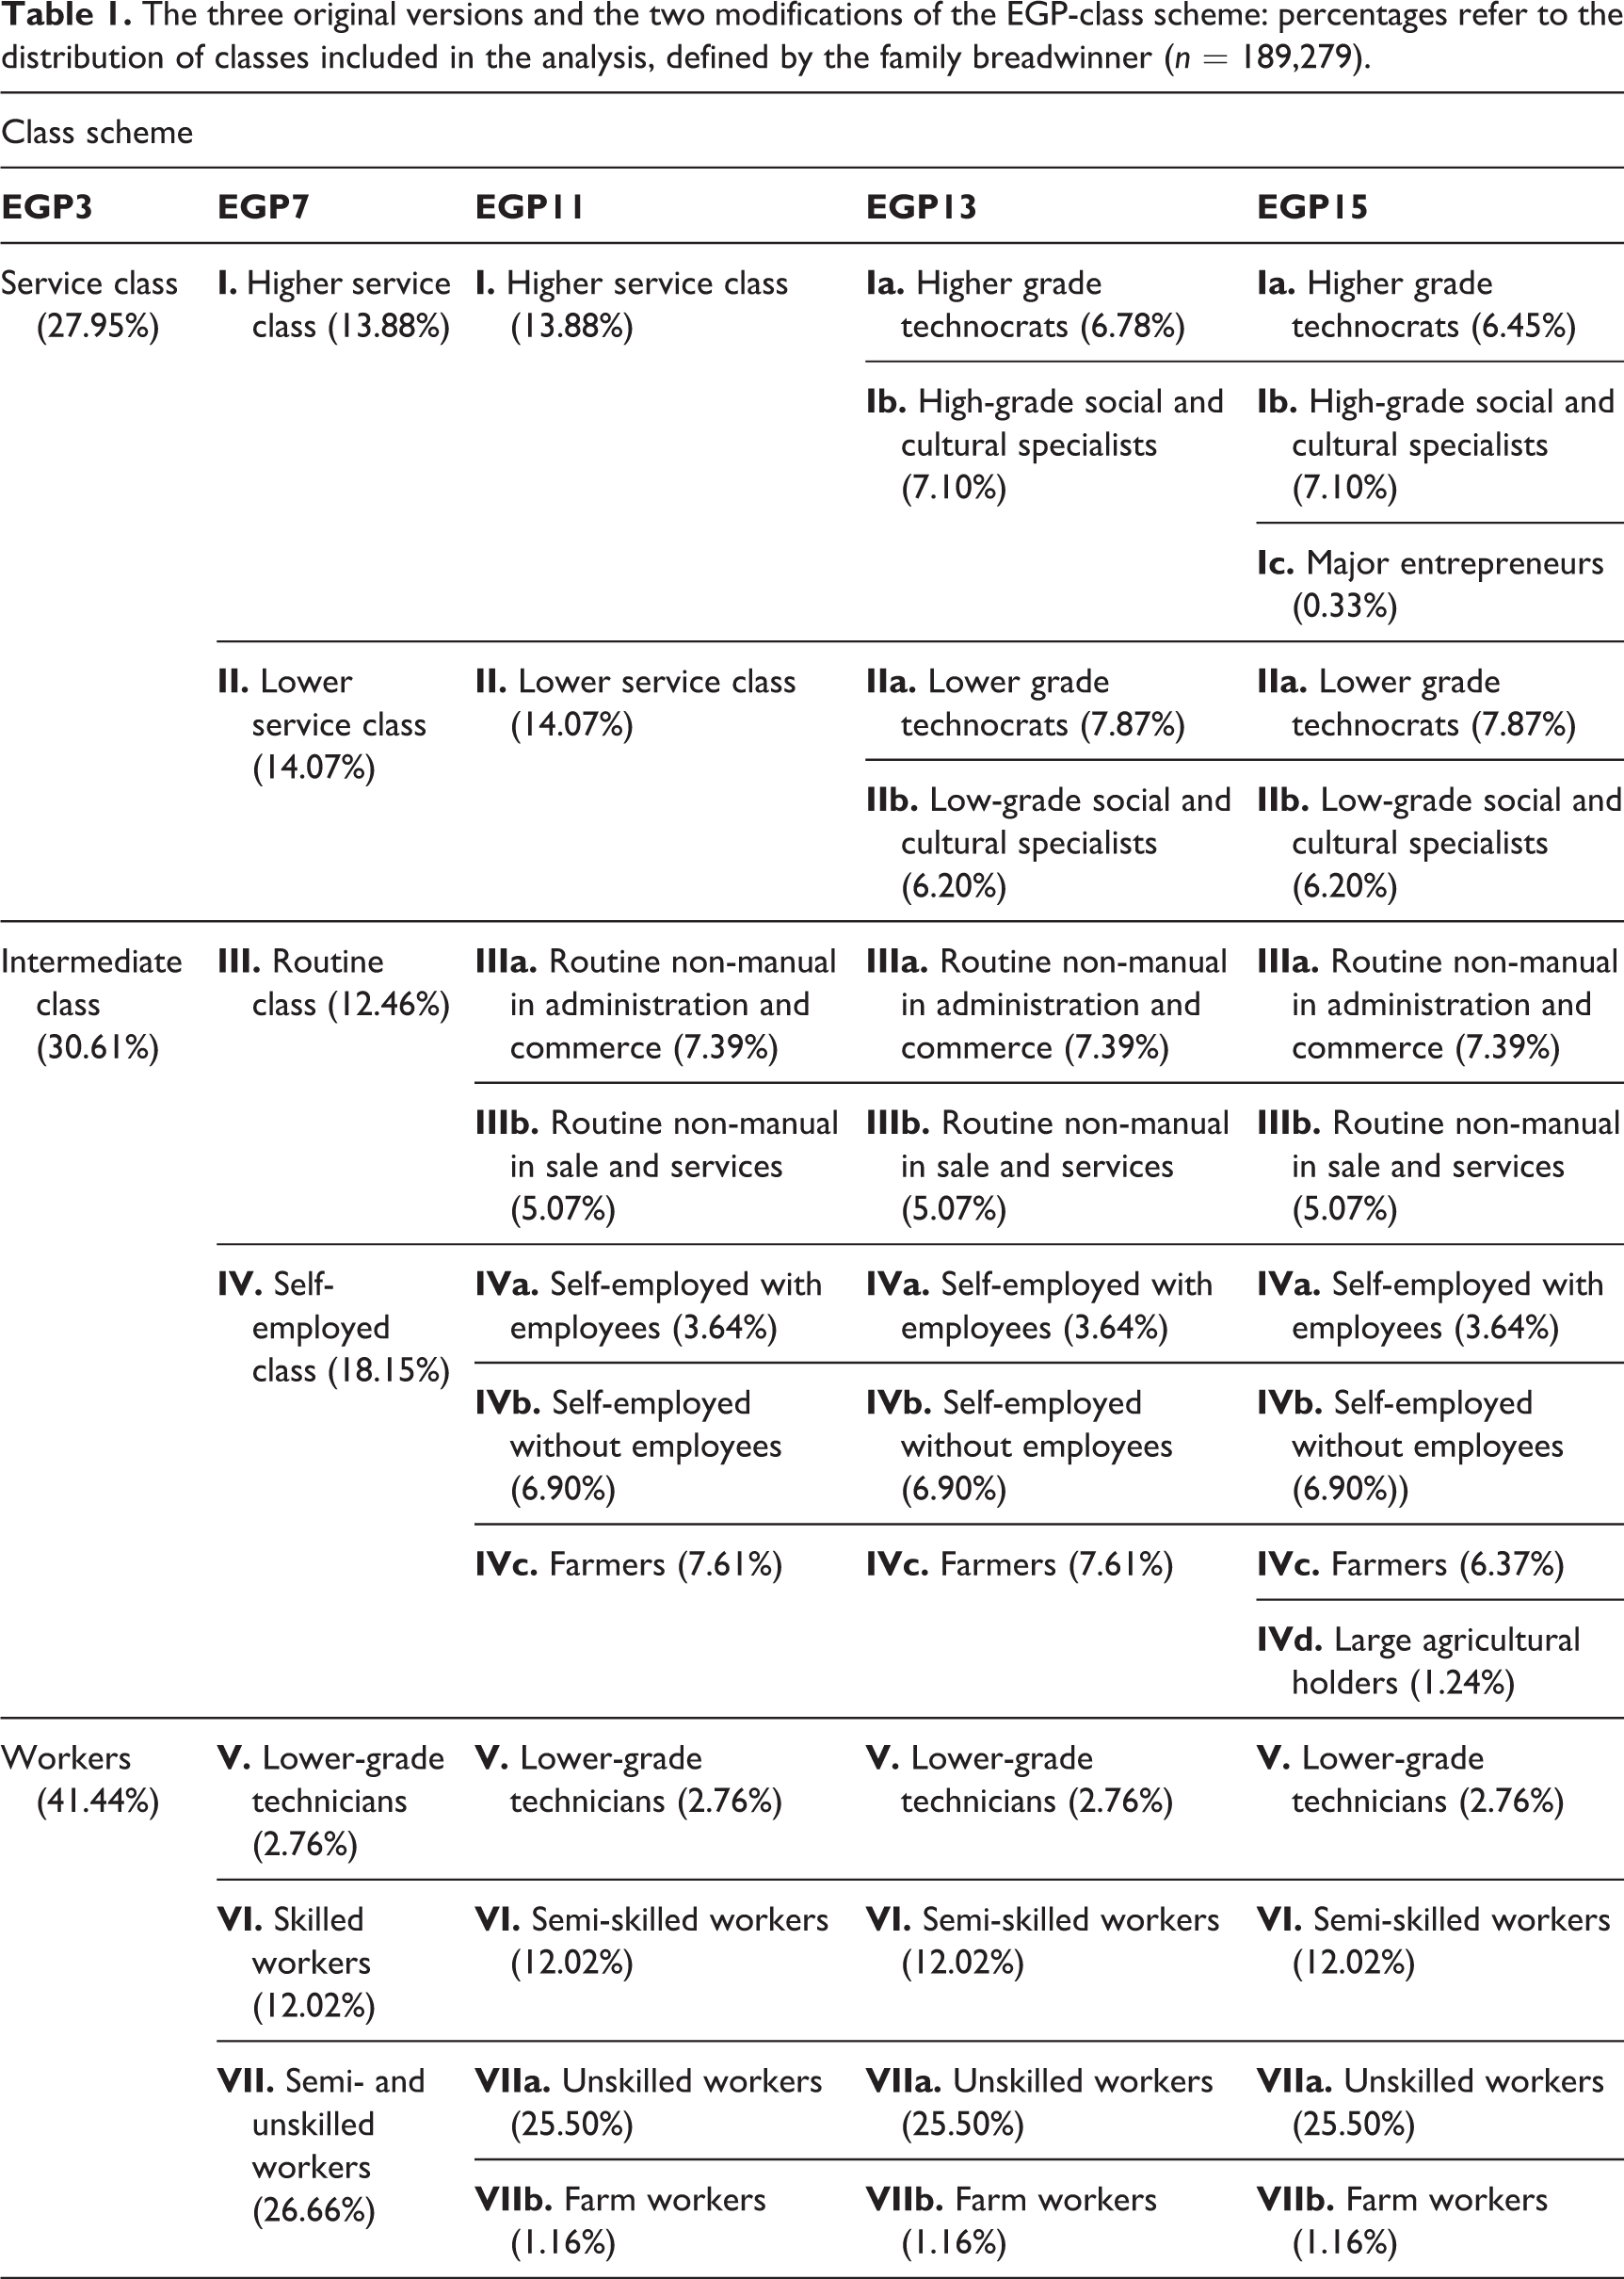
Although the EGP class scheme has shown high reliability (Evans and Mills, 2003), since its first publication it has been subject to discussions about the need for revision (Clark et al., 1990). Esping-Andersen (1993) argued for including new class boundaries in employment because of the emergent post-industrial society. Further to this, Güveli et al. (2007) argued that whilst the EGP class scheme was formulated for the industrial society, the new post-industrial society has created classes. The adjustment by Güveli et al involved a change only in the service classes, dividing both the higher and lower service classes into an ‘old’ class of technocrats and a ‘new’ class of social and cultural specialists (see also Savage et al. 1995, for an earlier argument for dividing the service class into ‘managers’ and ‘professionals’).
Another adjustment, inspired by studies on income inequality (Atkinson and Brandolini, 2013; Mazumder, 2005), suggests that sociological class analyses can benefit from economic studies. Most notably, Piketty (2014) demonstrated that the very different transmission of income inequality depends on whether the transmission results from earnings or from accumulated wealth. Whilst acknowledging that income in capital and earnings are highly correlated, Piketty points out that in periods when the economy is growing relatively slowly, past wealth ‘naturally’ becomes more important than earnings (Piketty, 2014: 25). Because only a small flow of new savings can increase the stock of wealth steadily and substantially, families with wealth-based income have more robust transmissions of economic resources than families dependent on wages alone.
In line with these insights, I argue for an additional adjustment of the EGP class scheme. Whilst the wage earner and service (or salaried) classes (EGP–7 classes II, III, V, VI and VII) are defined mainly in terms of wages, the class of the self-employed (EGP–7 class IV) is defined in terms of wealth or capital that is often inherited, such as a shop or a family firm (Goldthorpe and McKnight, 2005). In the original EGP–7 class scheme, the higher service class (class I) comprises both higher-grade professionals (defined by wages) and proprietors of large businesses (defined by capital). My revision expands the higher service class into two additional classes of major entrepreneurs and holders of agricultural land defined by (different forms of) capital. I retain the emphasis on post-industrial changes in the class structure, as Güveli et al. (2007) proposed, but without neglecting the persistence of the ‘old’ affluent self-employed classes, defined by their accumulation of capital and wealth.
However, the EGP class scheme and the very relevance of the entire concept of social class have both been the subjects of serious debate. Critics argue that contemporary society is becoming increasingly differentiated and characterised by subcultures (e.g. lifestyles of taste and consumption) formed by social institutions unrelated to larger aggregated groups such as classes (Pakulski and Waters, 1996). As Beck (2013) pointed out, the notion of the disappearance of class does not mean that other forms of socio-economic stratification based on income or education have lost their importance – rather that class distinctions and lifestyles have only lost their relevance for the individual in contemporary society.
Nevertheless, an emphasis on differentiation, institutions and subcultures is not necessarily incompatible with a concept of class. Rather, as Grusky and Sørensen (1998) argued, class theorists and class sceptics should pay more attention to the micro-level association within the aggregated classes. Grusky and Sørensen’s micro-class scheme can be conceptualised as a third way between American stratification studies based on occupational groups and the European tradition based on class.
On the one hand, Grusky and Sørensen wishes to defend class theory from post-materialist criticism of ‘the death of class’ (Pakulski and Waters, 1996); on the other, they found that since Marx the class concept has been overloaded with normative demands and meanings (Grusky and Sørensen, 1998). Thus instead of abandoning the class concept entirely or constructing a new theoretical aggregated class scheme, Grusky and Sørensen turned the perspective upside down: they rejected deductive class schemes, arguing that (micro) class defines the actual institutionalised occupational groups in the social division of labour (Jonsson et al., 2009). Rather than constituting a fixed number or being based on theoretical arguments, micro-classes constitute the actual institutionalised occupational groupings of society. Table 2 shows how the EGP15-class scheme can be disaggregated into a micro-class scheme of 72 classes.
The disaggregation of the EGP15 scheme into the micro-class scheme, defined by the family breadwinner: percentages refer to the distribution of classes included in the analysis defined by the family breadwinner (n = 189,279).
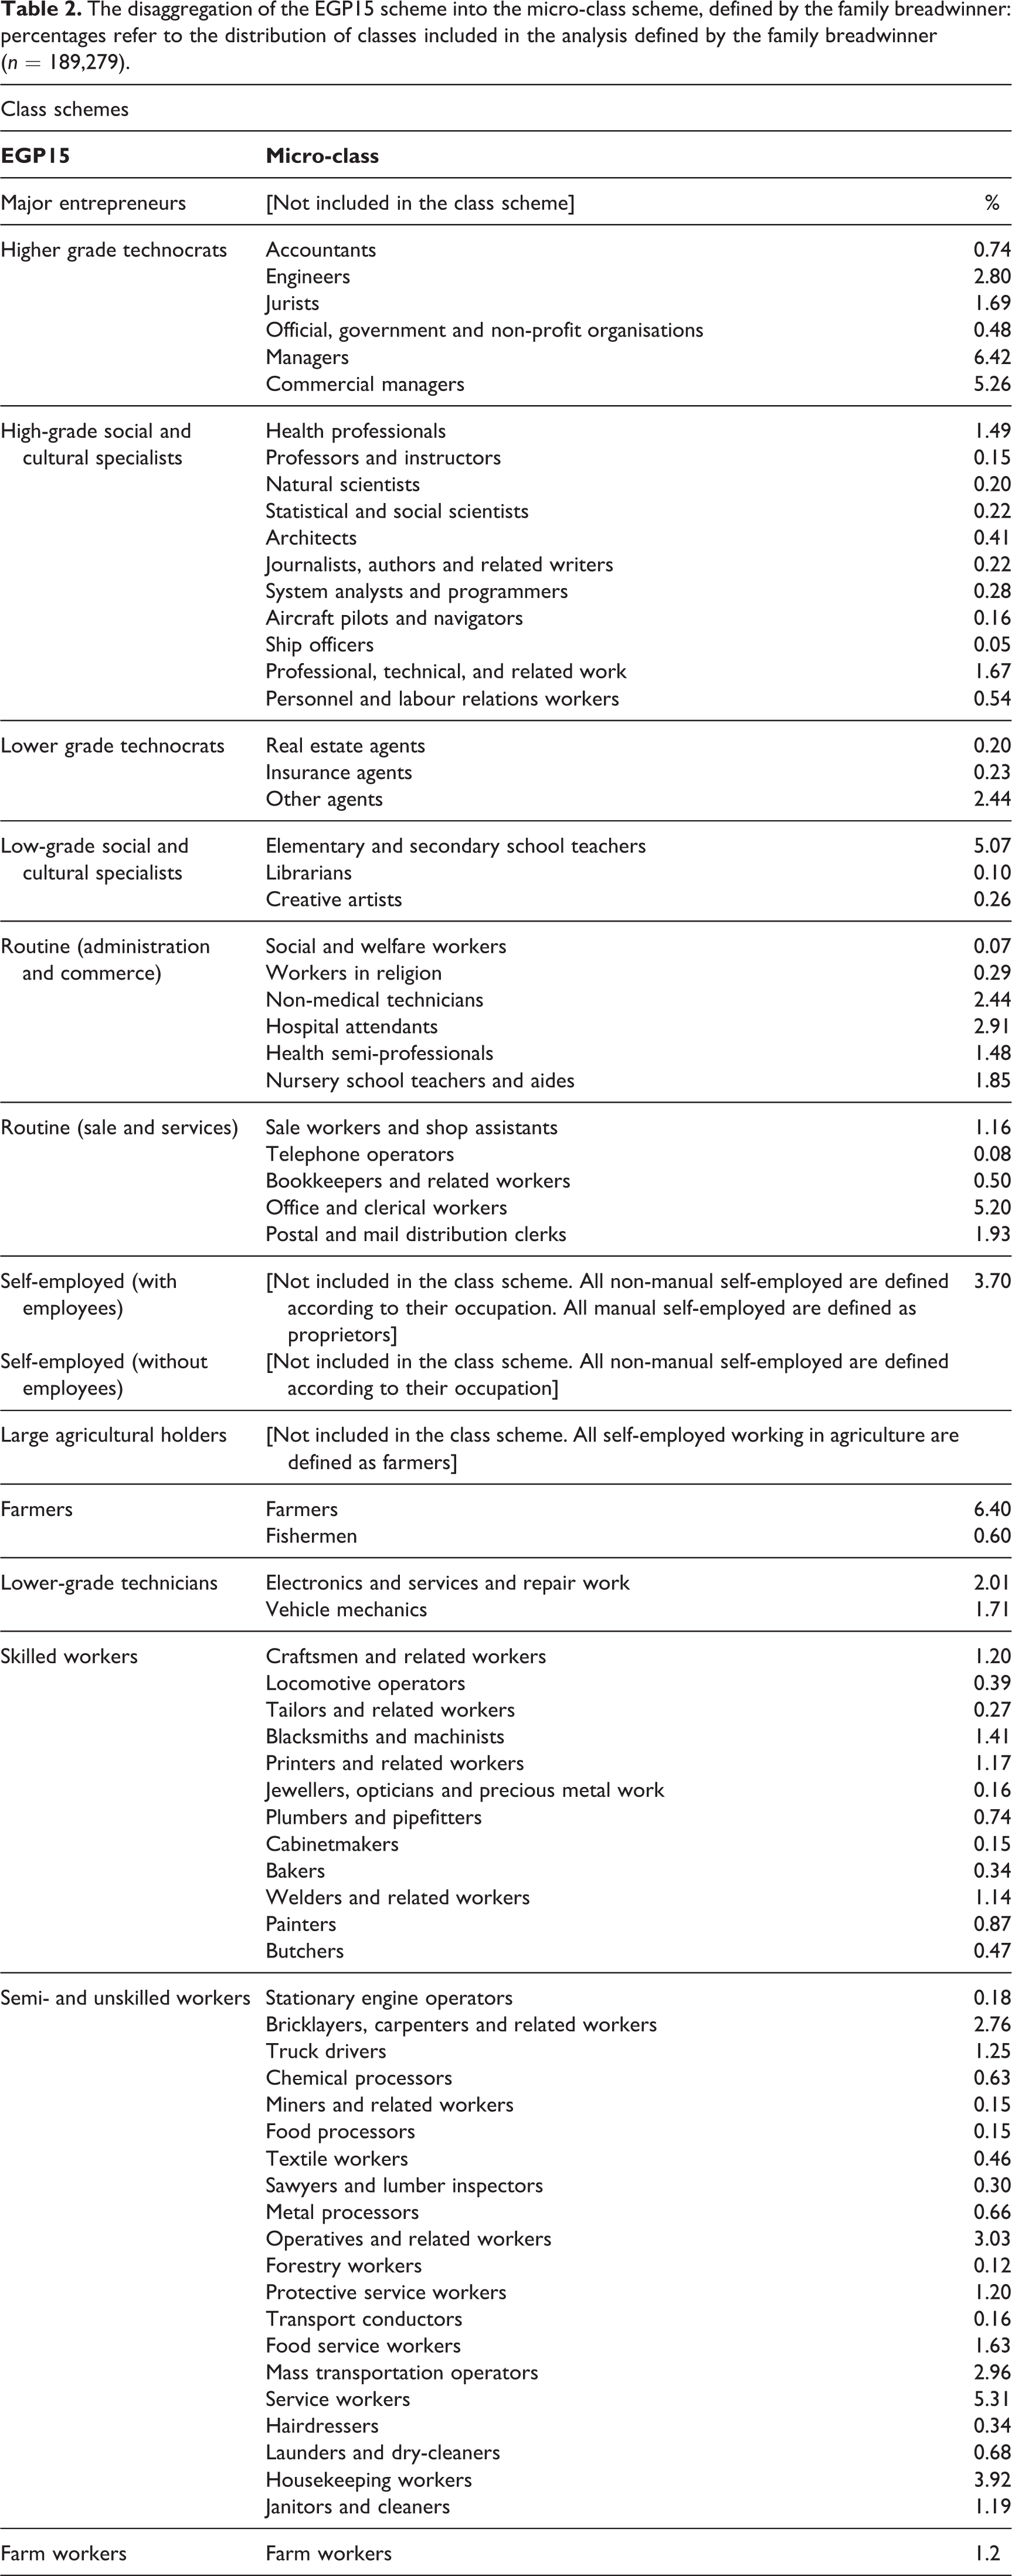
The emphasis of the micro-class scheme on distinctive cultural socialisation patterns within the occupational groups means that the class scheme has only one class of self-employed (the manual self-employed), whom Grusky and his colleagues calls ‘proprietors’. As a result, the total share of people in the aggregated, non-self-employed EGP classes (which also differentiate between other types of self-employed) differs from that of people in the micro-classes that the EGP classes comprise. For example, whilst EGP class IIIb – routine non-manual workers in sale and services – consists of 5.07% of the families in my data, the share of families within the micro-classes of this class (e.g. sale workers and shop assistants, telephone operators, and office and clerical workers) comes to 8.87% of the families.
Data and method
The data in Table 3 come from Statistics Denmark and comprise 290,399 individuals (51.5% male), born between 1963 and 1973, from 189,279 families. Because I measure the individuals multiple times, once each year in the eight-year period from 1998 to 2008, the result is 1,632,366 observations. I merged these data with information from various registers. Information on individuals’ employment was taken from employers’ reports to the tax authorities; information on income from individual tax reports; and information about the family from the fertility register. All income measures have been adjusted for inflation and are shown in 2008 prices.
Sample descriptive statistics for brothers, sisters and pooled sample of mixed siblings (standard deviation shown in parentheses).

†‘Singletons’ refers here to having no siblings in year span of the cohort: individuals listed as siblings can therefore have siblings who are either older or younger than the cohort
Because siblings are identified through their mother, I include both full siblings and half-siblings on their mother’s side. Due to data limitations, I do not distinguish between biological and adopted children.
Dependent variable
The long-term income of the ‘children’ is measured by calculating the natural logarithm of their annual gross income each year for the period 1998 to 2008, when they are 35–45 years old – the age when most individuals establish their occupational career. However, because the income continues to increase somewhat rapidly for individuals in their twenties and thirties (Böhlmark and Lindquist, 2006), I performed robustness analyses on the validity of my design with other periods (i.e. ages 30–40 and 25–45). These analyses all yielded similar results. Although I did not impose an upper limit for income, I truncated the lowest annual income observation to 1000 DKK (≈ €134) in 2008 prices. The lower income bound enabled me to compare the results with similar studies from other countries (including other Scandinavian countries) reporting considerably higher minimum annual earning in their surveys or administrative records (Björklund et al., 2002: 760). Thus I regarded 9271 earnings observations (i.e. 0.5%) distributed across 4291 individuals below this value as missing.
Measures of family background
The parental income and education variables were measured at the time they were presumed to matter most for the long-term income of the ‘children’. Parental income is operationalised by the average of the parents’ annual average gross income when the individuals are aged 14–19. Parents’ educational attainment is measured by the highest education level of the parents, categorised as follows: Compulsory education (9 years of total schooling); High school (11–12 years); Vocational (13–14 years); Short tertiary (14–15 years); Intermediate tertiary (15–16 years); and University (16–19 years).
To ensure comparability amongst the children of the cohort, I measured parents’ educational level from 1980 to 1990, when the child was 17.
Because my coding of the class schemes (especially the micro-classes) is based on the four-digit International Standard Classification of Occupations (ISCO), and because previous Danish occupational classifications are not sufficiently detailed in specifying the occupations, I was unable to measure parents’ class membership before the mid-1990s. Parents’ class was measured in 1994, when the individuals were aged 18–28 and their parents’ were in their late forties and early fifties (when most adults would be at the height of their occupational career). Following the ‘dominance approach’, I defined family class membership by the breadwinner (male or female) with the highest annual gross income (Goldthorpe, 1987: 294–296). All versions of the EGP class schemes are operationalised with the four-digit ISCO classification scheme, together with information on employment relations. Whilst I used Ganzeboom and Treiman’s (1996) algorithm for operationalising the three, seven and eleven EGP class schemes, I operationalised micro-classes in line with the methodology of Grusky and colleagues (Jonsson et al., 2009). Major entrepreneurs and holders of agricultural land were differentiated from other self-employed if they had more than four full-time employees. 1
Method
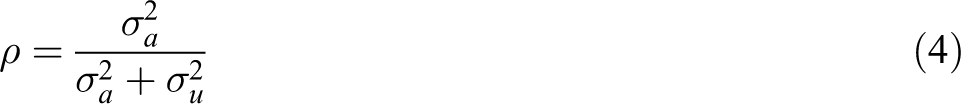
Inspired by previous research (Björklund et al., 2010), I based estimations of the sibling correlations on variance component analyses. For individual i in family j at time t, outcomes are modelled as follows:

where

where

Whilst excluding the transitory component (
As in previous studies, I used the residual maximum likelihood estimates (Mazumder, 2008), which enabled me to bootstrap confidence intervals of the sibling correlations coefficients.
Results
I started my analysis from a baseline model including only the dummy variables for years, the two age variables (age and age squared), and a dummy variable for single-breadwinner family. After using this baseline model to estimate the sibling correlation in long-term income, my primary objective was to determine how much of the sibling correlation (i.e. similarities in siblings’ income) can be explained by the introduction of various measures of family background characteristics (parents’ income level and education) and the six class schemes. To control for gender differences, I estimated separate models for brothers, sisters and both (‘mixed siblings’).
Thus all models with variables measuring socio-economic family background characteristics were evaluated relative to the baseline model through the reduction in the sibling correlation and the family component. If a variable measuring a particular family background characteristic (e.g. a version of the EGP scheme) reduced the family component or the sibling correlation relative to the estimates from the baseline model, then the measure can account for some of the observed similarities amongst siblings. Because the family component – in contrast to the sibling correlation – does not account for the individual variance in long-term income, the family component constitutes a rough measure of similarities in children’s income for similarities both between siblings and within individual siblings’ long-term income. I used t-tests to determine whether the reductions in the estimates of the sibling correlations across the models are significant.
An overview of the results for the first three models is presented in Table 4. Estimates of the family component and the individual component in the baseline model (model 0) differ somewhat amongst the three samples. The family component for the brothers is estimated at 0.057, which is 14.26% of the total variance in the model, whilst the individual component is 55.92%. The relative component sizes for the sisters are lower, with the family component at 9.86% and the individual component at 59.81% of the total variance. This suggests that sisters have less in common than brothers in terms of long-term income. Mixed siblings have the smallest family component (9.51% of the total variance), a finding attributable to the lack of similarity in long-term income across brothers and sisters. Moreover, the baseline model for mixed siblings has a larger individual component, accounting for 62.08% of the total variance.
Model results for baseline models and models with parents’ income and education (standard error in parentheses).
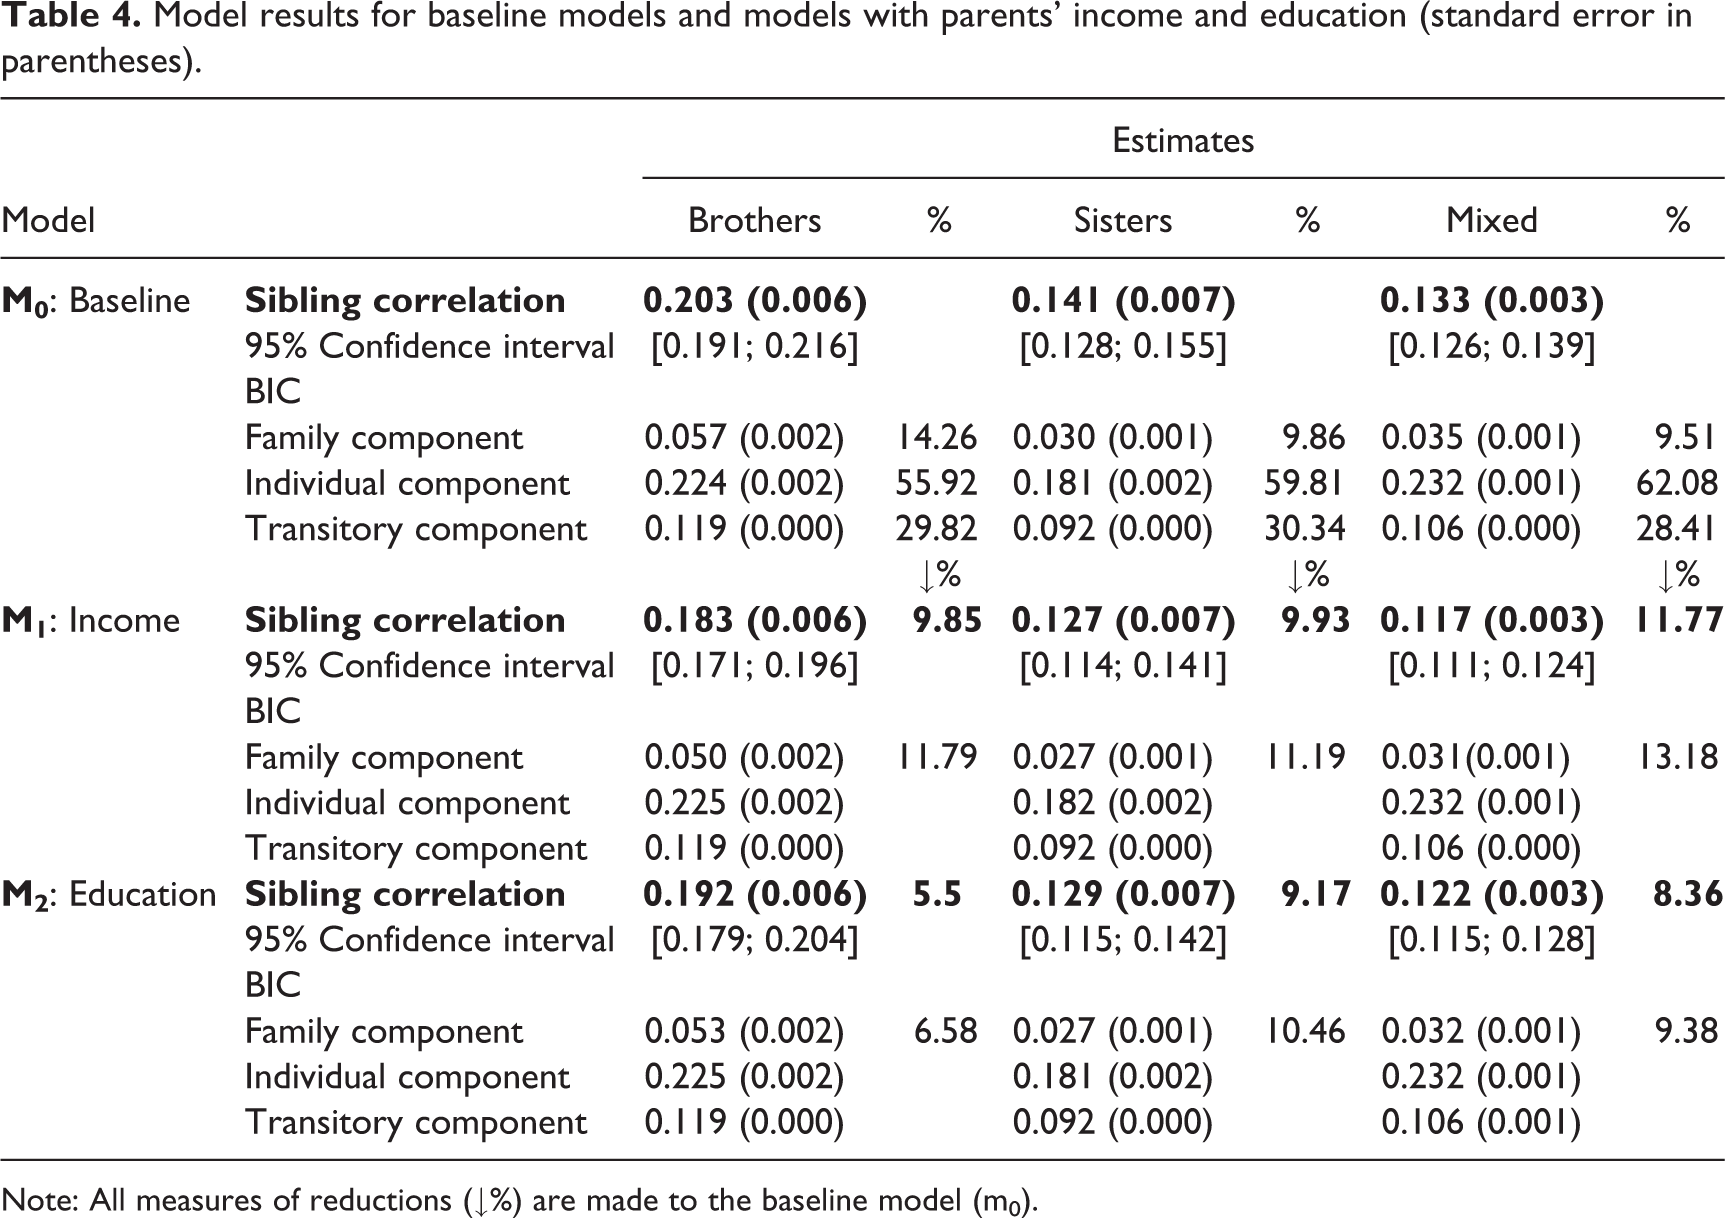
Note: All measures of reductions (↓%) are made to the baseline model (m0).
Models 1 and 2 include measures of, respectively the parents’ income and highest level of education. These models enabled me to investigate whether the class concept explains more of siblings’ similarities in long-term income than other relevant measures of socio-economic background characteristics. Model 1 shows that, relative to the baseline model, parents’ income explains 9.85% of the brothers’ income similarities, 9.93% of the sisters’, and 11.77% of the mixed siblings’.
Compared to model 1 (with income), model 2 reveals that parents’ highest education explains a considerably lower share of sibling income similarities than parents’ income. Parents’ education explains only about 5.55% of brothers’ income similarities and 8.36% for mixed siblings’ similarities but 9.17% of sisters’ similarities. This result implies that, in contrast to brothers, family cultural resources (measured by parents’ education) are almost as valuable as economic resources (parents’ income level) in explaining why sisters from some families are economically better off than sisters from other families. The question is whether such cultural resources captured by parent’s education are also included in more elaborated theoretical operationalisations of the socio-economic status of families, such as social class membership − the focus of the next six models (Table 5).
Model results for the six class schemes (standard error in parentheses).

Note: All measures of reductions (↓%) are made to the baseline model (m0).
Model 3 introduces the aggregated three-class version of the EGP scheme (EGP3). For brothers EGP3 explains 7.77% of the sibling correlation and 9.22% of the family component (from 0.057 to 0.052). Thus EGP3 explains more for the brothers (about two percentage points) than model 2, which included parents’ education, but less (about two percentage points) than model 1, which included parents’ income level. The inclusion of the EGP3 scheme entails a similar conclusion for the sisters – although at a much lower scale (model 1 gives a 9.93% reduction in the sibling correlation, whilst model 3 gives a 9.84% reduction). The result for mixed siblings shows a greater difference between the two models: parents’ income (model 1) entails an 11.77% reduction in the sibling correlation, whilst the three EGP classes (model 3) entail a 10.00% reduction.
For all three groups (brothers, sisters and mixed siblings), the sibling correlation was additionally reduced by at least 1% when, in model 4, I introduced the EGP class scheme with seven classes (EGP7). Compared to the reduction in the sibling correlation found in model 3 (EGP3), the reduction in model 4 (EGP7) is largest for the brothers and lowest for the sisters: from a 7.77% reduction in model 3 to 9.73% in model 4 for the brothers, and from 9.84% to 11.01% for the sisters. Thus more detailed classification of the middle classes is particularly valuable in explaining similarities between brothers, whilst simpler class schemes with fewer classes are almost as good at explaining similarities between sisters.
I found similar results when, in model 5, I expanded the EGP classes to include 11 classes (EGP11). Whilst the 11 EGP classes, compared to the seven in the previous model, show a reduction in the sibling correlation for brothers of about one percentage point (from 9.73% to 10.95%), the reduction for the sisters is less than one percentage point (from 11.01% to 11.10%). In other words, more elaborated versions of the middle classes do not appear to add much to explaining the income similarities of sisters.
Model 6 introduces the class scheme suggested by Güveli et al. (2007), with the higher and lower service classes divided between technocrats and social and cultural specialists. This model provides a greater reduction than in the previous models, in both the sibling correlation and the family components for brothers and sisters. However, compared to model 5, model 6 only reduces the sibling correlations and the family component by less than one percentage point. Thus compared to simpler classifications with fewer classes the expansion of more elaborated classifications of the middle classes (technocrats and specialists) adds little explanatory power for families’ ability to transmit resources over generations. This finding holds particularly true for mixed siblings, whose income similarities are better explained in model 5 – EGP11 – than with the inclusion of the additional classes in model 6.
In model 7 I introduced the distinction between capital and labour by distinguishing the large entrepreneurs from the higher service class and distinguishing the large agricultural land-holders from the farmers. This expansion of the EGP scheme, with these two additional classes, results in a slight improvement over the baseline model: the sibling correlation for brothers drops by 11.31% and the family component by 13.50%. Although this class scheme of 15 classes (EGP15) provides a similar improvement for the mixed siblings, for sisters the reduction is smaller than that in model 6. This finding suggests a gender difference in the intergenerational transmission of wealth: families that tend to rely more on capital than wages (e.g. entrepreneurs or agricultural landholders) favour sons over daughters, whilst families relying primarily on high wages accruing from educational credentials (e.g. cultural and social specialists) benefit daughters due to their tendency for high educational attainment.
Model 8 expands the number of classes to 72 micro-classes. However, when compared to model 7 (with 15 classes), the brother correlation drops by only 0.55 percentage points. Nevertheless, the micro-class scheme explains better the correlations of sisters and mixed siblings, which, in comparison to model 7, drop by 0.95 percentage points and 0.48 percentage points, respectively.
Although the addition of classes results in a greater reduction in both the sibling correlation and family component compared to model 1 (which included parents’ income), additional investigations using two-sided t-tests showed that none of the reductions found in models 3 to 8 were significantly different from model 1 (see Table A1 in the Appendix). None of the various class schemes for brothers, sisters or mixed siblings is therefore able to explain significantly more than parents’ income (model 1). Nonetheless, the question remains as to whether the class schemes in models 3 to 8 account for other aspects of the variation in the sibling similarities in long-term income, beyond those including the parents’ income and education already accounts for. The answer to this question appears in Figure 1, which – in addition to model 1 and models 3 to 8 – illustrates the share of explained sibling similarities when parents’ income and education are also included (for more details on these additional models, see Table A2 in the Appendix).

Sibling correlations for brothers, sisters and mixed siblings with the parents’ income, and the six class schemes with and without controls for parents’ income and education.
Figure 1 shows that whereas parents’ income alone explains about 10% of the similarities in siblings’ long-term income for brothers sisters and mixed siblings, the explained share of similarities varies between 11.86% for brothers and 15.24% for mixed siblings when parents’ education is included in the model. Whilst the EGP3 scheme alone explains 7.77% of the similarities between brothers’ income, the inclusion of parents’ income and education raises the total share of explained similarities by 6.79 percentage points, totalling 14.58% of the similarities between brothers. For sisters and mixed siblings the total reduction is even higher, at 16.80% and 18.27%, respectively.
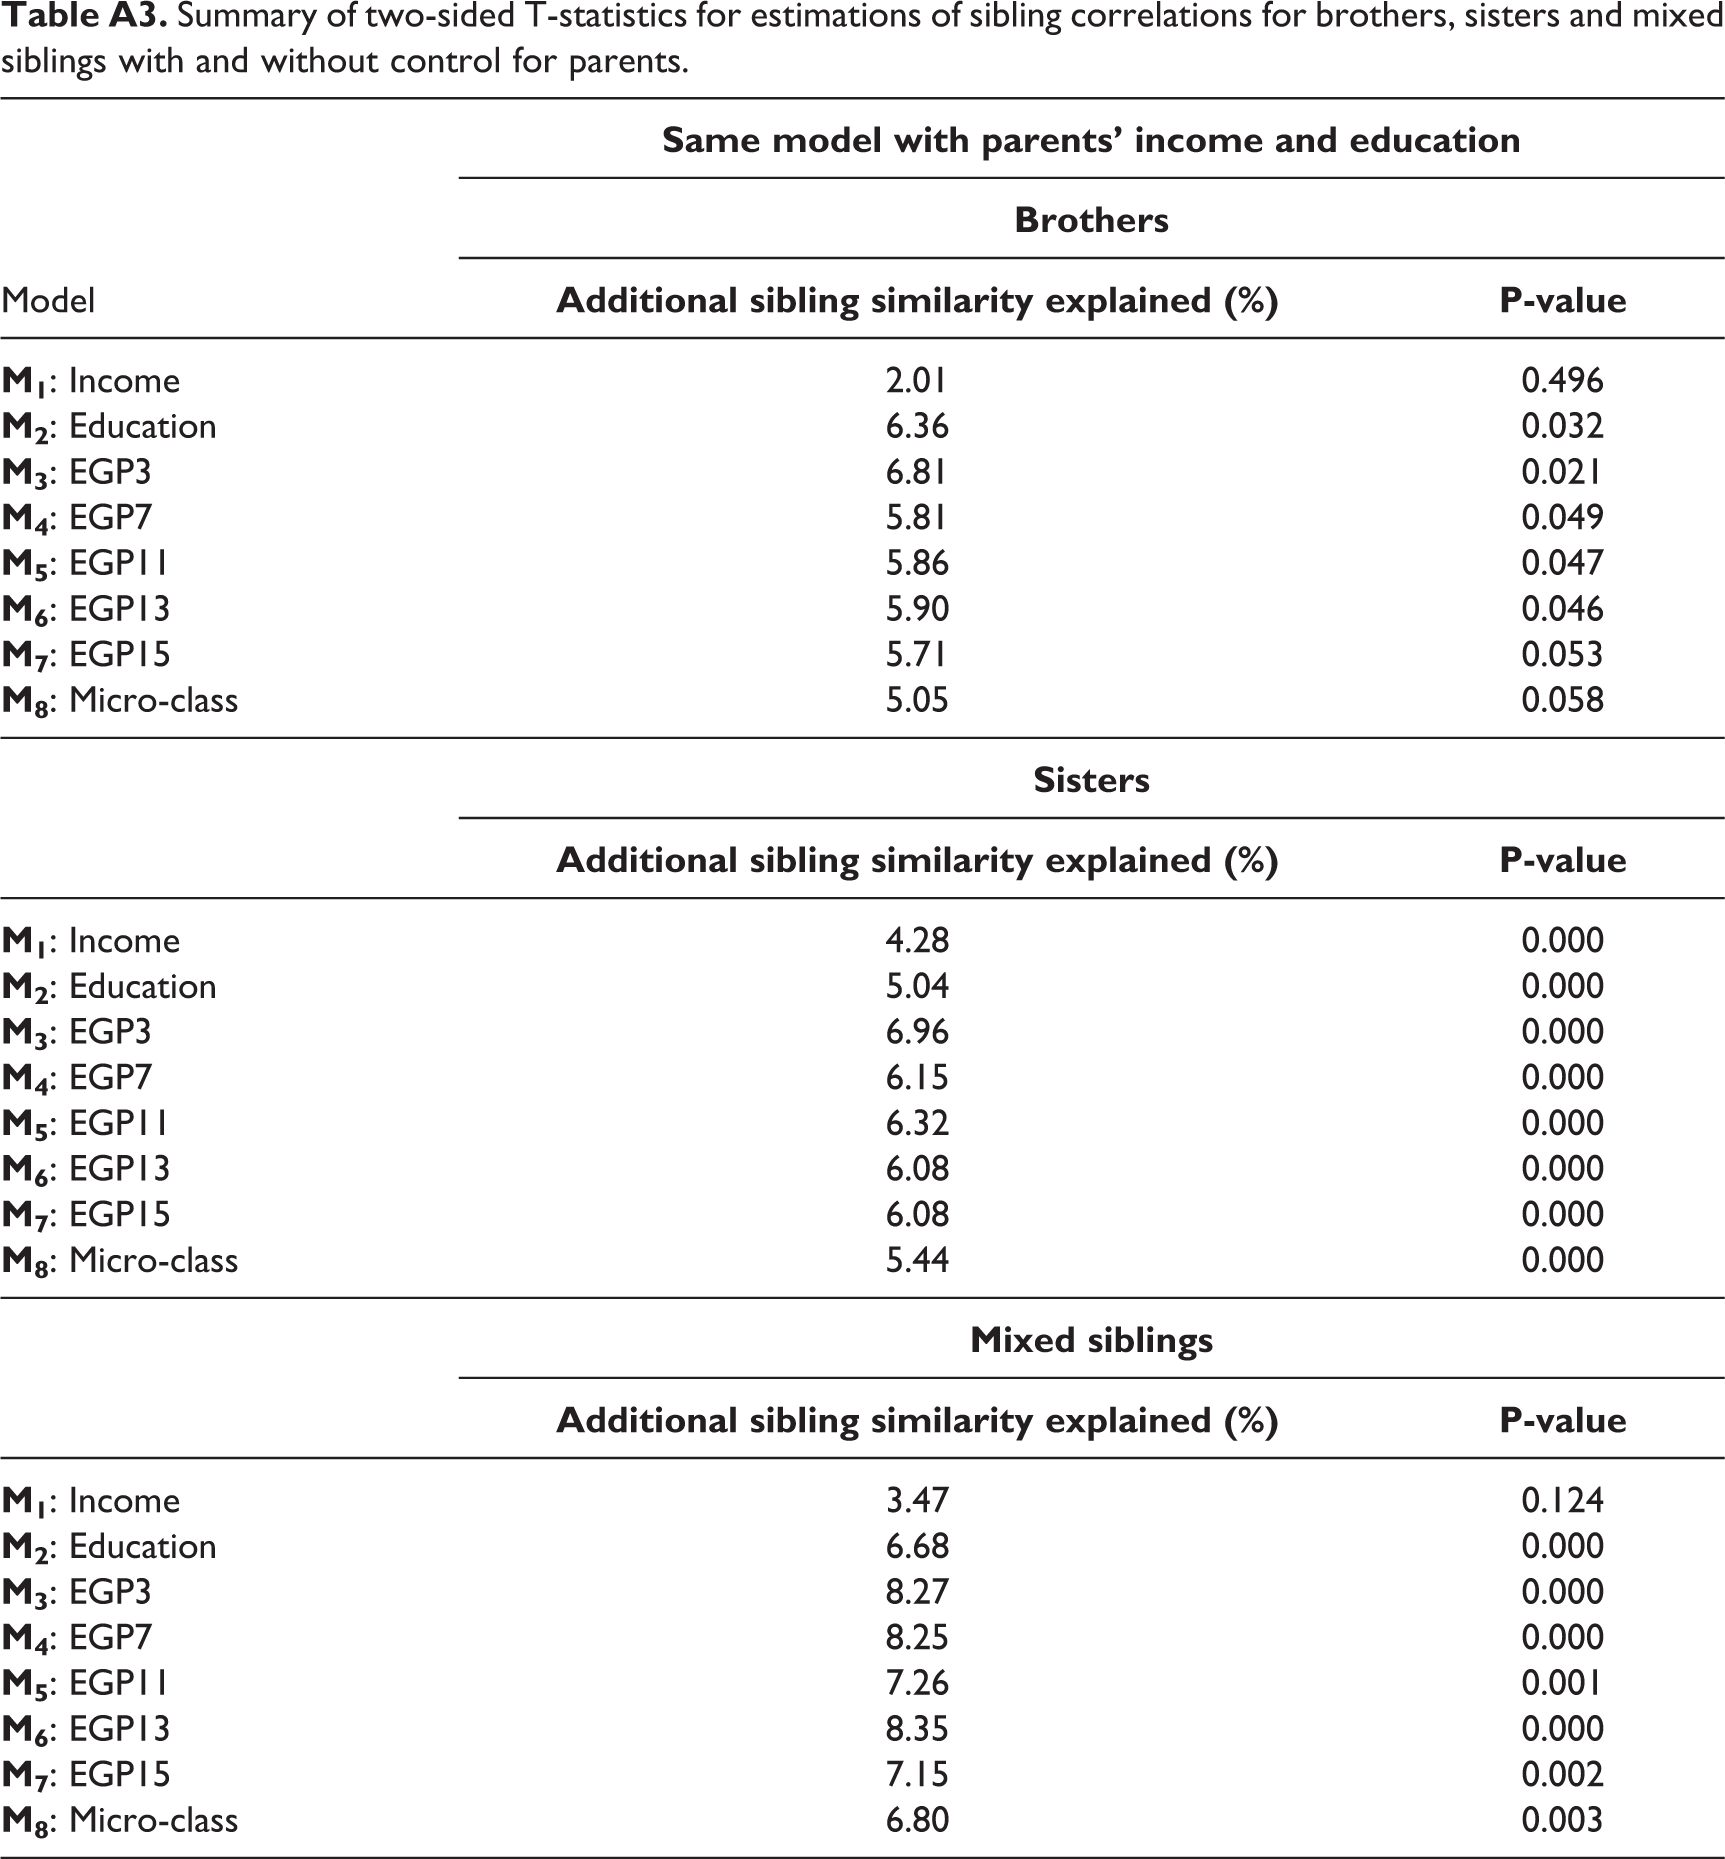
For all three groups of siblings, the reduction increases as the EGP class scheme includes more classes. Brothers and mixed siblings have the highest reduction with the EGP15 classes, which reduce the sibling correlation in the baseline model by 17.02% and 20.05%, respectively. In contrast, sisters’ income similarities are best explained either by the EGP13 classes, which gave a 17.48% reduction, or by the 72 micro-classes, which gave a 17.78% reduction (if the spending on degrees of freedom is not taken into account). Compared to the estimates of the baseline model, additional t-tests showed that all models yielded statistically significant reductions in the sibling correlations. However, t-tests between those models including class schemes (see Table A3 in the Appendix) showed that the model including not only parents’ education and income but also the EGP13 scheme had the best fit overall for brothers and mixed sibling whereas the EGP11 scheme had the best fit for sisters.
Discussion
This study introduced the class concept in studies that use sibling correlations in order to measure the importance of family background on long-term income. Although the Danish welfare state has a range of social institutions explicitly seeking to reduce inequalities through taxes and public spending on schools, social security and health care, the analysis showed that family background continues to have a significant effect on long-term income.
To examine further the relation between family background and income, the study evaluated different measures of family background. In addition to traditional socio-economic measures such as parents’ income and education, the study included six suggestions for revising the predominant seven-class scheme originally developed by Goldthorpe. These six suggestions include no class variation, as argued by class sceptics (Beck, 2013), three EGP classes (Goldthorpe, 2000), seven EGP classes (Erikson et al. (1979); 11 EGP classes (Erikson and Goldthorpe, 1992); 13 adjusted EGP classes accounting for the emergence of new service classes, as suggested by Güveli et al. (2007); 15 extended EGP classes, accounting for both the new classes and the persistence of ‘old’ wealthy classes of large entrepreneurs and agricultural holders (inspired by recent income studies, in particular Piketty, 2014); and a class scheme of 72 micro-classes developed by Grusky and his research team (Jonsson et al., 2009).
My results reveal that whilst parents’ income can explain about 10% of sibling similarity in income for brothers and sisters, and education can explain about 5%, more detailed elaborations of the EGP class scheme (e.g. EGP11) explain between 11% and 13%, depending on gender. When family EGP11 class is included in the model, together with parents’ income and education, the share of explained sibling similarity rises to about 17% for brothers and sisters – and 20% for mixed siblings. This demonstrates that, whilst social class as an analytical categorisation of family background involves aspects other than crude socio-economic measures of parental income and educational level, most of the sibling similarities are not explained by parental education, income or class.
Beyond the need for further studies on the impact of family background on children’s income, my findings have three additional – and important – points, the first of which is that sibling correlations are more encompassing than parent–child correlations. As this study shows, even when all socio-economic measures (including class) are included, at least 80% of the sibling similarities remain unexplained. Siblings may share some characteristics such as personality and other psychological traits, e.g. confidence or extraversion, that correlate with their income but not necessarily with family class.
However, this finding does not mean that socio-economic family factors are irrelevant in explaining similarities in sibling income. Indeed, I would argue that future research should focus on the interactions between these socio-economic measures (particularly family class) and relevant cultural family practices in childhood, e.g. measures of parents’ involvement in schooling that might affect their children’s future income. Another relevant factor for explaining inequality patterns is detailed information on individuals’ life courses (Andrade, 2015). Whilst unexpected life events such as job loss can trigger a range of problems, e.g. divorce or poverty, these occur across different class backgrounds (Vandecasteele, 2011). Research on how and why some people end up with higher income than others should include an emphasis on unexpected events and analyse how class mediates the individual consequences of such events.
My second point is that the shares of sibling similarities that are explained across the EGP class schemes improve by only a few percentage points. My analysis, in line with a Swedish study on educational attainment (Erikson et al., 2012), shows that the influence of family background class does not coincide with the micro-class theory in which the post-industrial society is expected to lead to an increased labour market differentiation of occupational groups with distinctive closure mechanisms. Part of the explanation for this may lie in the institutional settings of the Danish labour market, with their ‘macro-class’ structure: large unions and wage earners from various sectors engage in collective bargaining and joint determination, as opposed to having specific occupations fighting one another for higher wages and better working conditions.
The small differences between the EGP classes with more than three classes can be interpreted in two ways. On the one hand, the results could mean that the less detailed class scheme (e.g. EGP7) works almost as well as those requiring much more detailed data (e.g. EGP13). On the other hand, the results could mean that whilst the more detailed class schemes do not explain larger shares of the sibling similarities than the simpler ones, they nevertheless highlight different ways and aspects of how families transmit resources to their children. Given class-specific strategies for parents to secure their children’s social position, more detailed class schemes can help explain how and why children from families with similar income levels and education have different long-term incomes. For example, for class-specific family norms and values, researchers have explained why children of lower-grade technocrats have different opportunities and aspirations than children of low-grade cultural and social specialists (Goldthorpe, 2000; Güveli et al., 2007). Such theoretical elaborations are more difficult to find in studies that rely only on continuous economic measures or empirical categorical presentations, e.g. income rank groups.
In other words, quantitative studies drawing on analytically defined classes already include a theory on how families secure their children’s social position. In contrast, studies without a notion of class need to include additional variables that measure particular family patterns – for example, to show the tendency for children from middle class families to choose an academic career, and for working class children to enter the labour market earlier (Goldthorpe, 2012). More research is needed to determine exactly how and why various (middle) classes differ from one another. For example, do parents in the higher and the lower service classes of technocrats use the same strategies for securing their children’s future outcomes?
My third point is that my analysis contributes to the on-going discussion of how to define social class. A growing number of researchers, including Conley (2008), argues that rather than a precise definition of class, researchers should embrace a ‘kitchen sink’ approach in which all possible measures of social hierarchy are included in their empirical models. Because my results show little difference in the explanatory power between the various class schemes they support Conley’s point that class cannot be measured precisely because it takes many forms. If class is stripped from its precise definition, however, we may very well risk the concept losing the theoretical foundation that distinguishes it from the simple (empirical) categorisations of socio-economic measures.
Certainly there is no reason for viewing class and other (simpler) socio-economic measures as mutually incompatible. Nonetheless, this study shows that class entails aspects of family reproduction patterns other than income or education. However, as this study also shows, the introduction of the class concept in studies on sibling similarities is not without theoretical and empirical concerns: the exact definition of class may still remain unresolved, and other (non-socio-economic) factors are definitely relevant in explaining sibling similarities in long-term income. Still few or perhaps no other variables in contemporary quantitative inequality research are able to provide researchers with a similar well-established theoretical foundation from which they can explain their empirical findings about specific (cultural) reproduction mechanisms in the family.
Thus the class concept provides researchers with not only a theory about the family but also a general social theory that includes references to structural inequalities in the economy (e.g. the labour market) and the state apparatus (e.g. the education system). As with this study, Tåhlin (2007) used Swedish data to question the theoretical foundations of the EGP class scheme. However, studies that question the theoretical or empirical validity of class should not necessarily – as class sceptics would argue – be viewed as a reason for abandoning the class approach but rather as an invitation for researchers to sharpen the theoretical argument on how and why inequalities persist.
Footnotes
Acknowledgements
The author wants to thank Margaretha Järvinen, Peter Gundelach, Kristian B. Karlson, Mads M. Jæger, Martin D. Munk and Jens-Peter Thomsen for generous comments and suggestions. I am also grateful to the anonymous reviewers and the editors of Acta Sociologica for their valuable help in revising the article.
Funding
The author(s) received no financial support for the research, authorship, and/or publication of this article.
Note
Appendix
Summary of two-sided T-statistics for estimations of sibling correlations for brothers, sisters and mixed siblings with and without control for parents.
| Model |
|
|
|---|---|---|
|
|
||
|
|
|
|
|
|
2.01 | 0.496 |
|
|
6.36 | 0.032 |
|
|
6.81 | 0.021 |
|
|
5.81 | 0.049 |
|
|
5.86 | 0.047 |
|
|
5.90 | 0.046 |
|
|
5.71 | 0.053 |
|
|
5.05 | 0.058 |
|
|
||
|
|
|
|
|
|
4.28 | 0.000 |
|
|
5.04 | 0.000 |
|
|
6.96 | 0.000 |
|
|
6.15 | 0.000 |
|
|
6.32 | 0.000 |
|
|
6.08 | 0.000 |
|
|
6.08 | 0.000 |
|
|
5.44 | 0.000 |
|
|
||
|
|
|
|
|
|
3.47 | 0.124 |
|
|
6.68 | 0.000 |
|
|
8.27 | 0.000 |
|
|
8.25 | 0.000 |
|
|
7.26 | 0.001 |
|
|
8.35 | 0.000 |
|
|
7.15 | 0.002 |
|
|
6.80 | 0.003 |