



Abstract
A great deal of research has been dedicated to understanding the relationship of public preferences to public policy. Much of this literature, though, does not account for risk perception, an important characteristic that affects individuals’ preferences. In terms of policy, those who perceive high risk in association with a particular issue should be more likely to oppose policies that would increase that risk, and, conversely, support policies that would decrease this risk. In this article, we examine the role of specific risk perceptions related to nuclear, coal, and renewable sources of energy on related policy preferences. Controlling for the influence of knowledge and several specific attitudinal indicators, we find that risk perceptions are strong predictors of energy policy preferences.
A number of researchers have argued that the actions of policy-makers tend to mirror the policy preferences of the public (e.g., Burstein 2010; Page and Shapiro 1983). While various aspects of this research have been criticized (e.g., Page 2002) and recent, aggregate-level research suggests an inequality to this representativeness (e.g., Bartels 2009; Gilens 2009; Gilens and Page 2014), there is little doubt that elected officials respond to the public in at least a limited fashion. Indeed, a recent, individual-level study found that, even for a complex issue such as climate change, decision-makers’ preferences aligned with the public’s preferences over those of climate scientists (Stoutenborough and Vedlitz 2012). Given the influence members of the public have on policy-makers, it is critical that we understand how individuals reach policy decisions.
A robust literature has developed to examine citizens’ decision-making processes as they relate to science-based public policy. Historically, the literature has emphasized the roles of demographic, attitudinal, and knowledge indicators. Much of this attention is related to data limitations, as most of these studies utilize secondary analyses of public opinion polls that were conducted without the input of those seeking to use the data to understand why citizens’ support for specific public policies varies. Consequently, the majority of this literature focuses on the role of basic demographic and general attitudinal perspectives to explain policy support and opposition (e.g., Lipsmeyer 2003; Timberlake, Lock, and Risinski 2003) because these were the available variables.
A growing recognition within this literature is that risk perceptions have a direct causal link to policy preferences. However, these studies typically rely on general measures of risk perceptions (e.g., Lubell 2002), preventing us from understanding what about a particular problem or policy solution an individual finds risky. What is important is that not all specific risk perceptions on an issue predict general risk perceptions in the same manner (Stoutenborough, Vedlitz, and Xing 2013). In other words, a specific risk perception may not be included within the calculus of a general risk perception. If the devil is in the details, it is important to understand how specific risk perceptions drive policy attitudes.
In this article, we attempt to overcome many of these limitations by examining public support for different types of energy policy. Using a unique, nationally representative survey of U.S. citizens, we examine public support for nuclear energy, renewable energy, and reducing U.S. dependence on coal. Each type of energy source is associated with more than one specific risk perception, which allows us to examine how specific risks influence policy preferences. Additionally, we control for several general attitudinal indicators, knowledge, demographics, and specific perceptions of the regulatory environment for each energy source. We find that having a more nuanced understanding of risk perceptions provides a better understanding of how risk perceptions influence policy preferences.
Understanding Public Policy Preferences
The potential for the public to influence policy processes necessitates a better understanding of what drives an individual’s policy preferences. Much of the extant literature has focused on the roles of attitudinal and demographic indicators. Many have argued that attitudes serve as “orienting dispositions” that filter our responses to complex situations (e.g., Dake 1991; Leiserowitz 2006; Wildavsky and Dake 1990). These attitudes act as heuristics that simplify cognitive processing. When evaluating a given situation, an individual relies on these general attitudes to help determine the appropriate response. Not surprisingly, the literature consistently finds that attitudinal indicators such as trust, ideology, and environmental beliefs, as well as demographic indicators, predict policy support (e.g., Bies et al. 2013; Leiserowitz 2006; Li et al. 2009; Lubell 2002; Lubell, Zahran, and Vedlitz 2007; Sears et al. 1980; Stern et al. 1999; Stoutenborough and Vedlitz 2012; Stoutenborough, Bromley-Trujillo, and Vedlitz 2014; Wynne 1996).
Similarly, information is at the heart of virtually every decision-making theory. One’s understanding of an issue should influence one’s decision-making choices. If one is unaware of a critical aspect of a problem, that information cannot influence one’s decisions (e.g., Simon 1965, 1972). In this vein, every theory of the policy process recognizes the importance of information (e.g., Baumgartner and Jones 1993; E. Ostrom 2007; Sabatier and Weible 2007), and the literature often finds that an individual’s policy support is influenced by issue-specific knowledge (e.g., Lubell 2002; Lubell et al. 2006; Stoutenborough, Sturgess, and Vedlitz 2013). Knowledge has such a profound influence on decision-making that many studies have found it influences the quality of the debate and the solutions that follow (e.g., Delli Carpini and Keeter 1996). A lack of understanding may cause an individual to reach a less than efficient or optimal policy solution to address that topic (e.g., V. Ostrom 2007).
While there is a robust political science literature illustrating the importance of the above characteristics, far less attention has been given to the role of risk perceptions. Risk perceptions are inherently connected to our understanding of a problem, and risk perceptions can tap into the fear center of the mind where dread resides (see, e.g., Blendon et al. 2003; Finucane et al. 2000; Slovic 1987; Fischhoff et al. 1978; Slovic and Peters 2006). The linkage to the emotion dread helps to explain why risk perceptions have such a strong influence on behavior and other perceptions (for a good review of this literature, see Slovic 2000, 2010).
Although there are similarities, risk perceptions differ from attitudes. While there are many definitions of attitudes, the social psychology literature generally agrees that attitudes provide a mechanism for evaluating some idea, often in a positive or negative manner, and they are often malleable even if they tend to be fairly consistent (see Banaji and Heiphetz 2010). Similarly, there does not appear to be a single definition of risk perception. Within the theoretical framework for risk, it is accepted that attitudes, particularly affect, are one of the many characteristics that inform an individual’s risk perceptions. This argument suggests that risk perceptions should be differentiated from general attitudes, as they incorporate these attitudes with a variety of other indicators to develop this viewpoint.
Although attitudes help to shape risk perceptions, risk is principally influenced by information gathered through social, institutional, and cultural forces (Slovic 2000). There is a direct connection to knowledge, which allows risk perceptions to be relatively easy to alter because the more one learns, the better one will be able to evaluate the risk associated with any given action or situation. For instance, young children do not understand why they should not touch a hot stove until they do so. At that point, they have gained knowledge that informs their ability to assess this risk. Note that, in this scenario, as with many others, the role of the attitude affect is best represented through the idea that the child’s physical response to touching the stove was a negative experience. There are many ways for this knowledge to influence risk perceptions, but psychologists suggest that we can narrow them to the four components of risk—severity, likelihood, magnitude of harm, and level of understanding (e.g., Mumpower et al. 2013). In short, a person uses new information to reevaluate various aspects of these components, which potentially causes that individual’s assessment of risk to change.
This potential malleability matters because risk is a powerful perception that increases one’s willingness to act to resolve a problem (e.g., Mumpower et al. 2013). If individuals are more likely to act when they perceive higher levels of risk, we should find that risk perceptions influence policy preferences (e.g., Lubell 2002; Stoutenborough and Vedlitz 2012; Stoutenborough, Bromley-Trujillo, and Vedlitz 2014). The relationship between risk and policy is often managed by the precautionary principle, which suggests that if the risk of an action is perceived to be high, humans will prefer to take the least risky action (e.g., Sapolsky 1968). In terms of policy, those who perceive the risk associated with something as high should be more likely to oppose policies that would increase that risk and, conversely, support policies that would decrease the risk.
Unfortunately, this research primarily relies on general assessments of risk (e.g., Lubell 2002; Stoutenborough and Vedlitz 2012). Consequently, it is not clear which specific risk perceptions influence these policy preferences. On most issues, several potential risks could influence policy support or opposition. For instance, there are three clear types of risks that could influence support for nuclear energy. An individual could evaluate the risk associated with a nuclear meltdown occurring, the risk of storing nuclear waste, or the risk of transporting this waste to a storage site. Each of these risks connects to the broader issue of nuclear energy, but they link to completely different aspects of the production process. While a general risk perception for nuclear energy may be found to predict opposition to nuclear policy support (e.g., Whitfield et al. 2009), it is unclear what specifically about the perceived risk influenced this policy preference.
Recent research has found that specific risk perceptions do not always predict general risk perceptions in an equal manner (Stoutenborough, Vedlitz, and Xing 2013). Therefore, it is important to understand whether specific risk perceptions predict different levels of support for different policy options. Individuals may not factor certain types of risk into their decision-making calculus. If this is the case, we can begin to get a better understanding of how an individual reaches a particular decision within the policy process.
Further complicating our understanding of individual policy preferences, the literature tends to focus on aggregated policy positions (e.g., Dietz, Dan, and Shwom 2007; Lubell et al. 2006). 1 While it may be useful to understand what predicts the likelihood of an individual generally supporting environmental, educational, or health care policy reform, it does not help us to understand why an individual would support one policy but not another that a legislative body may debate. Indeed, Stoutenborough, Bromley-Trujillo, and Vedlitz (2014) recently found that an aggregated measure of support for policy reform offered a poor approximation for specific policy support. Consequently, we focus here on specific policy support.
Analytical Approach
Can looking at specific risk perceptions better enable us to understand why an individual supports or opposes a specific policy? We examine this question by analyzing public support and opposition toward three potential energy policies. We utilize a national public opinion survey of adults age 18 and over that was designed to measure many aspects of public attitudes toward energy. Administered by GfK Custom Research, LLC, the survey was in the field from May 11, 2012, through May 26, 2012. A total of 1,525 respondents participated in the survey. 2
Three dependent variables are derived from a battery of policy preferences. Respondents were presented with the following question stem, “A number of policy options have been proposed to deal with issues associated with America’s energy supply. For each policy option, please indicate whether you: strongly support, support, oppose, or strongly oppose that policy.” Additionally, respondents were given the option of “unsure.” The policy options were: (1) “Promote the increased use of nuclear power”; (2) “Require electric generating companies to reduce dependence on coal power plants”; and (3) “Provide tax cuts to energy companies to develop renewable energy technologies.” Each of these policy options was coded from 0 to 4, with 0 representing strongly oppose and 4 representing strongly support. Due to the response options and coding scheme, an ordered logit is an appropriate approach to analyze the ordered, noncontinuous data (McKelvey and Zavoina 1975).
Our premise was to determine whether specific risk perceptions influenced policy support. For each of the above three policy proposals, we modeled at least two risk perceptions. Beginning with nuclear energy, we determined which risks—nuclear meltdown, storing nuclear waste, transporting nuclear waste—influenced support. When an individual believes these risks are high, he/she should be less likely to support the expansion of nuclear energy. For coal policy, we analyzed the risk associated with pollutants released during the burning of coal and the risk from coal ash disposal. When an individual believes these risks are high, he/she should be more likely to support a policy that would decrease our reliance on coal.
We assessed two risk perceptions associated with the renewable energy policy. First, we asked respondents to evaluate the risk associated with bird and bat mortality as it relates to wind energy. We suspect that having concern about risk to life, even nonhuman, should cause an individual to be less likely to support renewable energy policy. Second, we evaluated perceptions of risk associated with water temperature changes caused by hydroelectric plants. The water tends to heat up after it flows through the turbine, which could cause a number of ecological effects downstream (e.g., Lessard and Hayes 2003). Therefore, we expect that those who view hydroelectric power as being risky should be less likely to support renewable energy.
Furthermore, we included two general measures of risk in all three models. We controlled for concern for the environment and the risk of an energy shortage. Those who are more concerned about the environment should be more likely to support policies that are more environmentally friendly. Additionally, if people believe the country is going to face an energy shortage, they should be more likely to support any policy that would increase the availability of energy.
In addition to risk perception, we controlled for knowledge, attitudinal, and demographic indicators. We included knowledge because it is often found to influence policy preferences (e.g., Stoutenborough, Sturgess, and Vedlitz 2013). The knowledge measure computes the average number of energy knowledge questions a respondent answered correctly from a nine question true/false battery. 3
Our models also contain a number of attitudinal indicators. Specifically, we included the influence of trust in the media, trust in experts, trust in industry, trust in government, and specific evaluations of the regulations associated with each form of energy, as trust in the information provider often predicts policy support (e.g., Wynne 1996). Additionally, if people believe an energy technology is sufficiently regulated, they should be more likely to support its use.
Finally, studies of public attitudes toward policy consistently find that these attitudes are influenced by demographic indicators (e.g., Zahran et al. 2006). Therefore, we included a typical battery of demographic indicators. Specifically, we included age, gender, education, race, party identification, and political ideology. 4
Results
The results of all the analyses are presented in Table 1. All of the models are included in a single table to allow easier comparison across the various indicators. Model fit statistics indicate that each of the models performs well.
Public Support for Energy Policy

NOTE: Standard errors in parentheses. Two-tailed test.
p < .100. *p < .050. **p < .010. ***p < .001.
Nuclear energy
We begin with our analysis of public support for increasing the use of nuclear energy. We found support for our expectation that specific risk perceptions influence policy support. The risk associated with a nuclear meltdown (β = −.436, p = .000) is the strongest predictor of policy opposition in the model (z = −7.19). Although much weaker, we found that higher risk perceptions associated with transporting nuclear waste (β = −.133, p = .071) also predict policy opposition. As suggested in the literature, we found that not all specific risk perceptions enter into the public’s decision-making calculus. The model indicates that those who view the risk associated with the storage of nuclear waste (β = −.105, p = .167) as higher are no more or less likely to support the policy than those who view the risk as low.
When using ordered logit, it may be easier to interpret the influence of a variable through an illustration, so we present in Figure 1 all three risks at all five levels of risk. 5 As perceptions of risk increase, opposition to increasing the use of nuclear energy increases. In particular, the simulation for nuclear meltdown risk predicted that, out of 1,000 respondents with risk equal to 0, we would expect to see 84 respondents “strongly oppose” the policy. However, by the time risk increases to 4 (the highest point on the scale), the simulation predicts that 354 would “strongly oppose” the policy, a 321.4 percent increase.
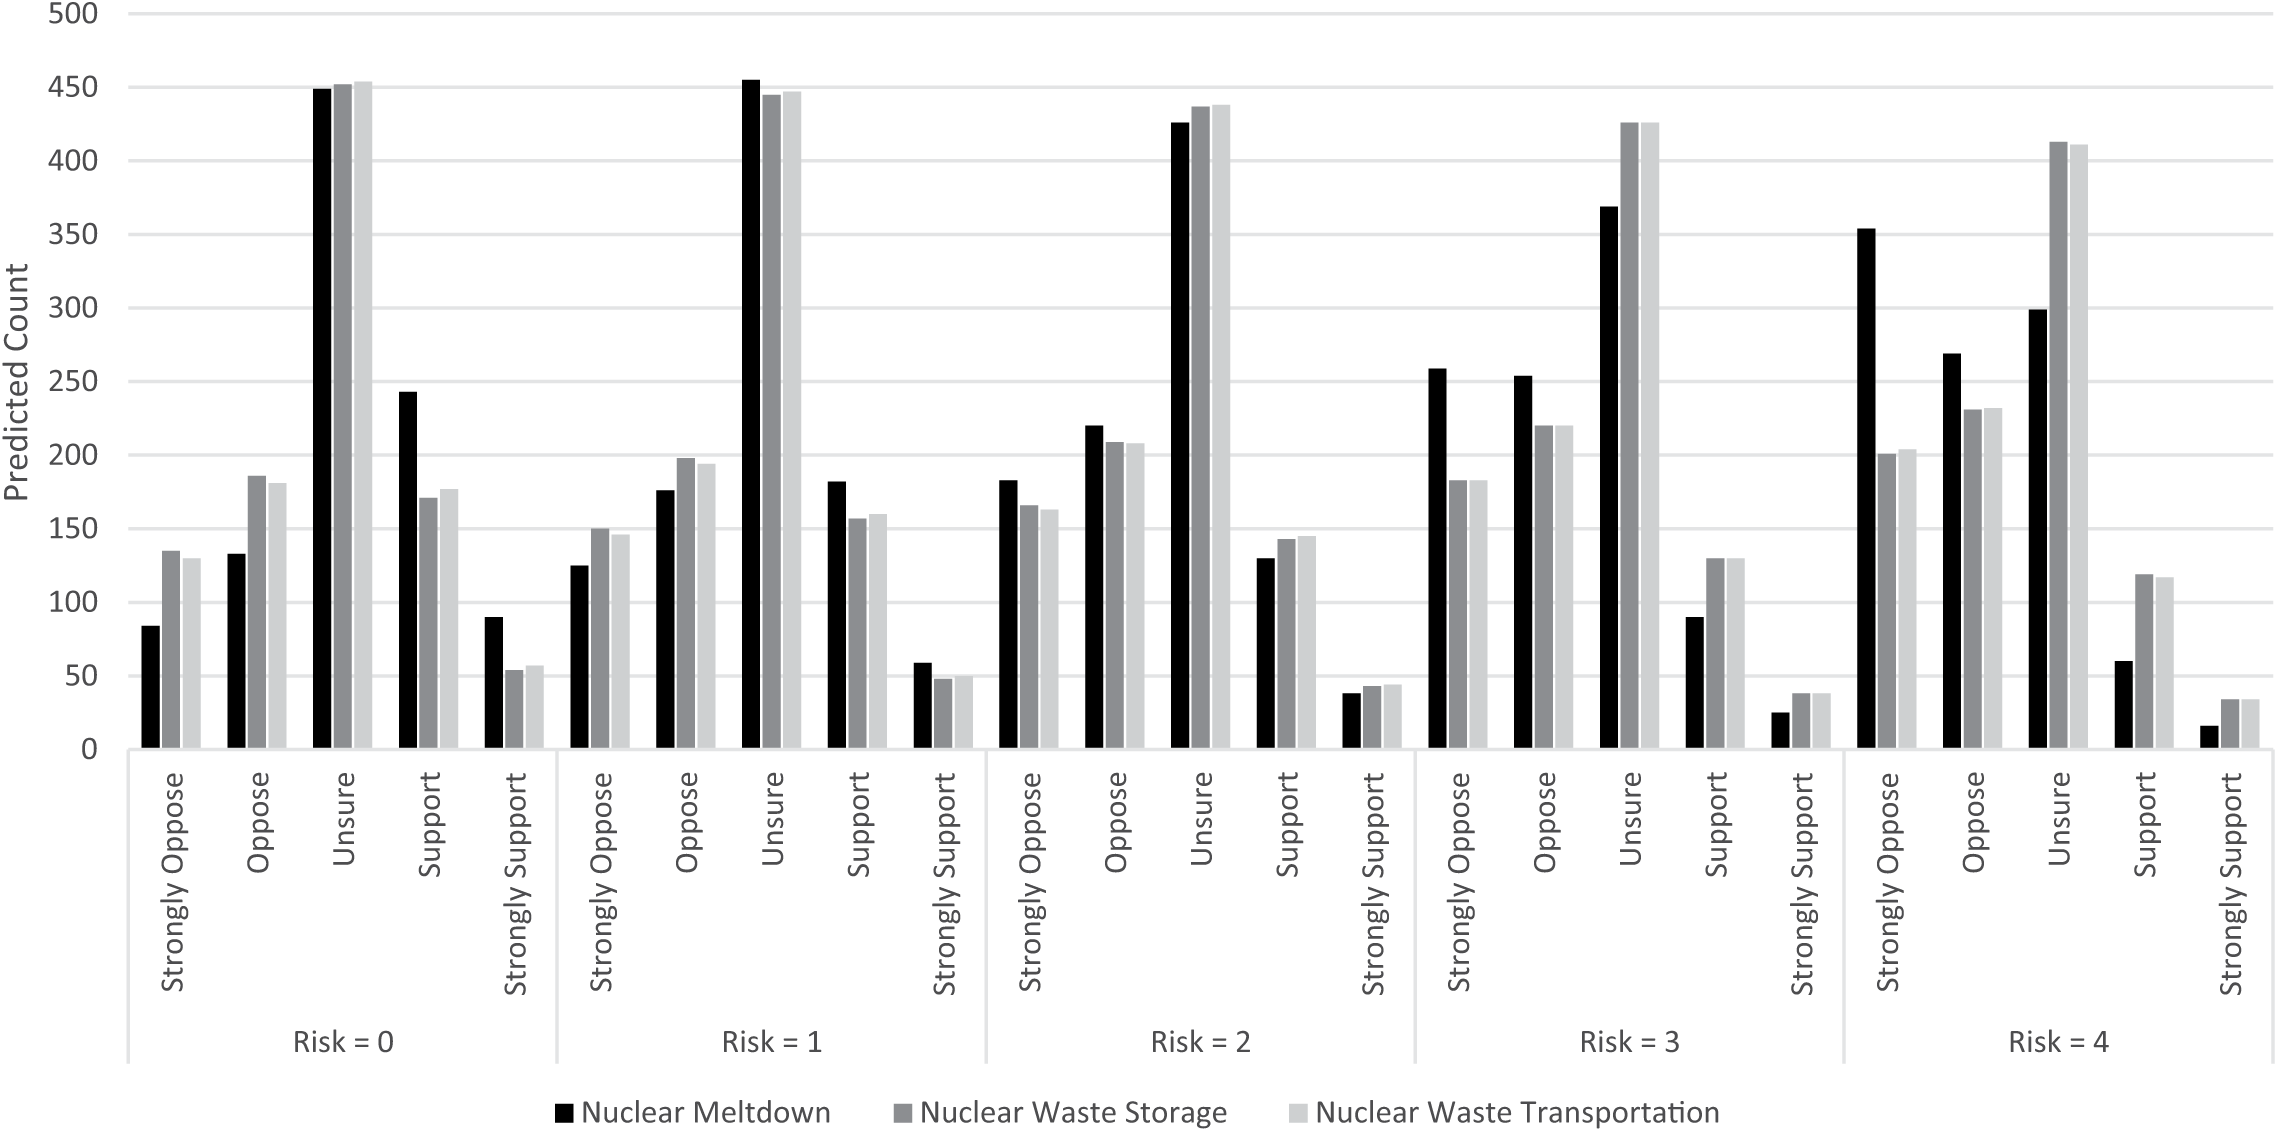
Simulated Influence of Risk Perceptions on Nuclear Policy Support
We also find that those who have more knowledge, greater trust in industry, more concern that the United States will face an energy shortage, and greater confidence that nuclear energy is sufficiently regulated are all more likely to support the increased use of nuclear energy. Finally, those who are older, male, and more strongly associated with the Republican party are more likely to support nuclear energy.
Reduce coal dependency
The examination of support for reducing our dependency on coal is also found in Table 1. The analysis indicates that those who view the risk associated with coal pollutants (β = .437, p = .000) and the risk of coal ash (β = .139, p = .028) as being higher are more likely to support this policy proposal. While both predict policy support in a similar manner, the risk associated with coal pollutants is a stronger predictor than the risk of coal ash. In fact, it is the strongest predictor in the model (z = 6.18).
The simulated influence of risk perceptions on support for decreasing our dependency on coal is found in Figure 2. As illustrated, as risk perceptions increase, support for reducing coal dependency increases. Indeed, the simulations estimated that among respondents who reported no risk associated with coal pollutants, only sixty-eight were expected to “strongly support” the policy of reducing dependency on coal. Conversely, the simulation of those who reported a risk of 4 resulted in an estimated 305 respondents who would “strongly support” the policy. This represents an increase of 348.5 percent.

Simulated Influence of Risk Perceptions on Support for Reducing Coal Dependency
Several additional indicators are also predictors of policy support in this instance. Those who trust experts, trust government, do not trust industry, are more concerned about the environment, and believe coal is insufficiently regulated are more likely to support the policy of reducing our dependency on coal. Finally, the model identifies those who are older and those who are more conservative as less likely to support this policy.
Renewable energy
Finally, we turn our attention to public support for using tax incentives to promote the construction of renewable energy. The analysis reveals that those who view the risk of bird and bat mortality (β = −.180, p = .001) as being high are less likely to support renewable energy. Clearly, those who are more concerned with the potential costs of avian life are more likely to want to avoid constructing more structures that could increase this mortality rate. Interestingly, the public is more supportive of renewable energy if it perceives the risk associated with increased water temperatures (β = .220, p = .000) as being higher. The public appears to support the use of hydroelectric power to reduce greenhouse gas emissions even if doing so creates other ecological problems. 6
The simulated influence of renewable energy policy support is presented in Figure 3. As risk increases, support for this renewable energy policy moves in opposite directions. With risk set at 0, the simulation estimates for bird and bat mortality risk, 274 respondents would “strongly support” renewable energy, and for hydroelectric risk, 168 respondents would. When risk is amplified to 4, we found that for bird and bat mortality, this support shrinks to 155 (a 43.4-percent decrease), and for hydroelectric risk, support increases to 329 (a 95.8-percent increase).
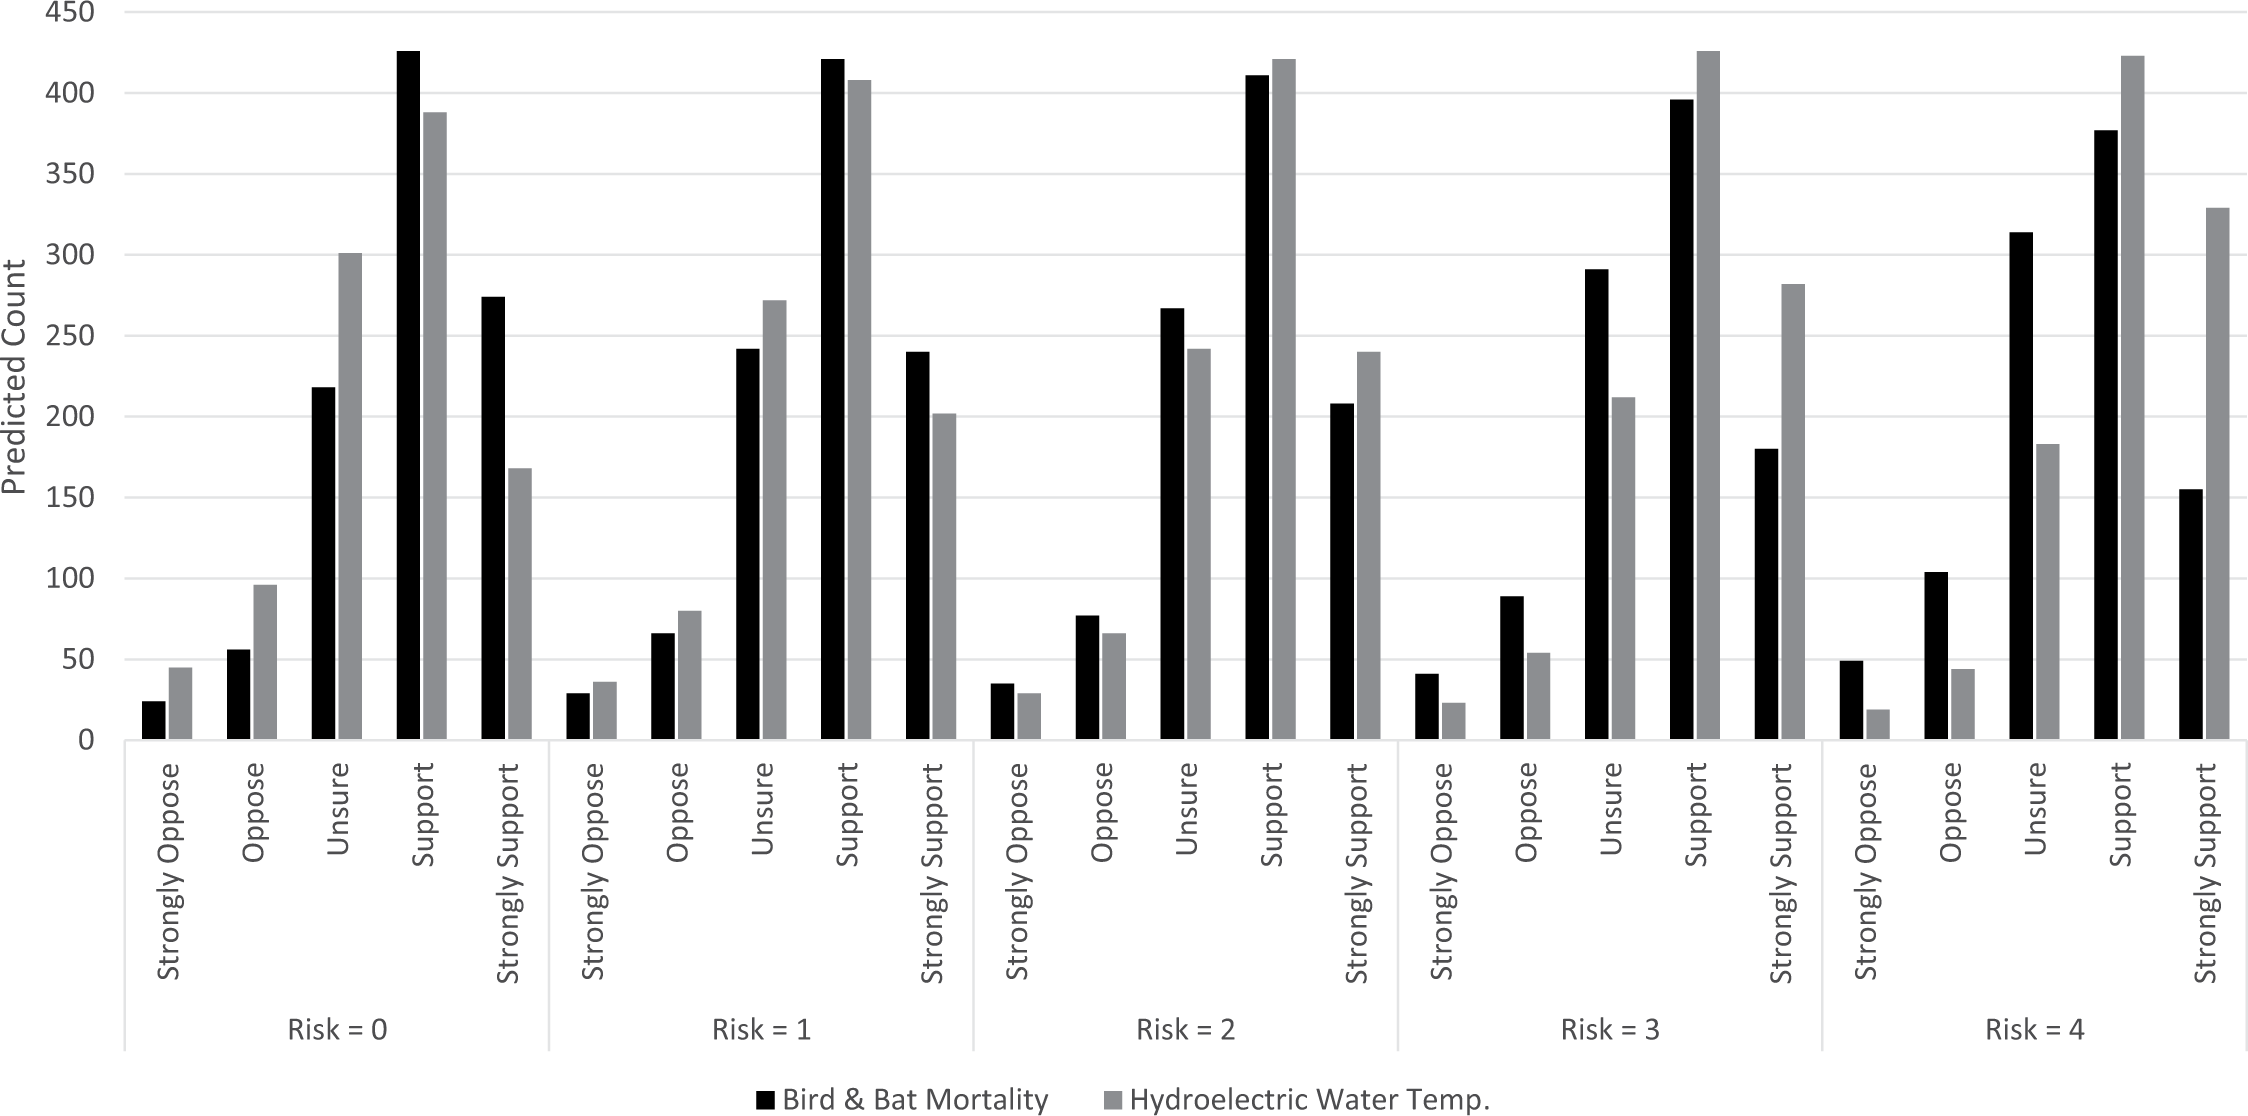
Simulated Influence of Risk Perceptions on Renewable Energy Policy Support
Several other indicators are identified as predictors. Those with greater trust in the media, trust in experts, little trust in industry, greater concern about the environment, and those who worry about an energy shortage are more likely to support the policy. We also found that those who are younger, white, and more liberal are more likely to support the policy.
Discussion
We began our project with the intent of understanding how specific risk perceptions influence an individual’s support for public policy. We tested this within the domain of energy policy. We examined three policy proposals concerning three different energy resources and seven different risk perceptions. Several implications are derived from this endeavor.
The analyses clearly indicate that specific risk perceptions are strongly associated with energy policy preferences over and above traditional attitudinal, knowledge, and demographic indicators (which remain important factors). Indeed, in two of the three models, one of these specific risk perceptions represented the strongest predictor of policy preference. While individual-level policy research is often limited by the data, these results provide additional support for the inclusion of risk perceptions in models that seek to explain the nature of public support for and opposition to policy options.
Specific risk perceptions add nuance to our understanding of the public’s opinions regarding policy issues. Instead of a simple measure of concern for the environment or even a slightly more specific indicator of concern for energy, we are able to identify more specifically why an individual would choose to support or oppose a particular policy proposal. Moreover, because risk perceptions are malleable as more information becomes available, this nuance becomes increasingly important. The better an individual is able to evaluate risk, the better he/she should be able to reach informed policy decisions.
Our analyses provide further evidence that much can be gained by examining specific policy preferences as opposed to aggregate measures. As illustrated in Table 1, many of the control variables predict differently depending on which aspect of energy policy the individual was asked to evaluate. For instance, even though directionality varies, age and trust in industry are the only control variables that are predictors in all three models. And, despite the robust literature indicating the importance of information, energy knowledge is a predictor only in the nuclear energy model. Overall, we find that the variation in the specifics of each policy influences which control variables are predictors.
Furthermore, as we noted above, most studies of individual-level policy preferences are limited by the questions that were included in a survey. As our results suggest, much more can be ascertained regarding the determinants of individual behavior within the policy process by designing surveys that contain greater specificity. For instance, as Wynne (1996) would suggest, there is a nuance in the influence of trust that is found when dividing trust into four distinct categories. Similarly, the traditional approach to understanding policy preferences focus on partisan and ideological differences in large part because these are the only behavioral measures consistently included in surveys. Although either party identification or ideology is a predictor of each of the policies we examine, all three models identify several predictors that are much stronger. Although designing issue-specific surveys can be costly, this article reveals that such surveys provide a greater understanding of policy preferences than the typical examination would reveal.
Finally, acknowledging that specific risk perceptions influence public support for energy policy in different manners will allow interested parties to identify better which aspects of a problem should be the focus of their efforts. For instance, we found that the risk associated with nuclear waste storage is not a predictor of policy preference. Consequently, those trying to craft a comprehensive nuclear regulatory strategy should address the risk of meltdown, and to a lesser extent transportation, more so than storage when trying to convince the public to support their policy. 7 The ability to target a message in a manner that would maximize its effects is particularly important in complex issue domains. However, this cannot be done if we do not have a strong understanding of the determinants of policy support, particularly risk perceptions.
Footnotes
Appendix
Variable Definitions
| Dependent Variable | |
|---|---|
| Increase nuclear power | Measured using a 5-point scale. Respondents were asked, “A number of policy options have been proposed to deal with issues associated with America’s energy supply. For each policy option, please indicate whether you: strongly support, support, oppose, or strongly oppose that policy.” “Promote the increased use of nuclear power.” Coded in order from 0 = “strongly oppose” to 4 = “strongly support.” |
| Reduce coal dependency | Measured using a 5-point scale. Respondents were asked, “A number of policy options have been proposed to deal with issues associated with America’s energy supply. For each policy option, please indicate whether you: strongly support, support, oppose, or strongly oppose that policy.” “Require electric generating companies to reduce dependence on coal powered plants.” Coded in order from 0 = “strongly oppose” to 4 = “strongly support.” |
| Renewable energy | Measured using a 5-point scale. Respondents were asked, “A number of policy options have been proposed to deal with issues associated with America’s energy supply. For each policy option, please indicate whether you: strongly support, support, oppose, or strongly oppose that policy.” “Provide tax cuts to energy companies to develop renewable energy technologies.” Coded in order from 0 = “strongly oppose” to 4 = “strongly support.” |
| Knowledge | |
| Energy knowledge | Measured as an index that averaged the number of correct answers to a 9-question battery. Respondents were asked, “Please decide if each of these statements are true or false.” (1) “The U.S. is NOT the largest per capita energy consumer in the world” (True); (2) “Refrigerators account for 7% of the nation’s energy use” (True); (3) “Wind power accounts for 10% of the electricity currently generated in the United States” (False); (4) “An odor must be added to natural gas for safety purposes” (True); (5) “Coal accounts for less than 20% of the electricity currently generated in the United States” (False); (6) “Electricity produced by coal, natural gas, nuclear, and oil relies upon heat to turn water into steam to spin large turbines, which generate the electricity” (True); (7) “One fingertip sized uranium pellet produces roughly the same amount of energy as 150 gallons of oil” (True); (8) “Renewable energy sources, like wind and solar, receive government subsidies or tax incentives, but conventional energy, like coal and natural gas, do not” (False); and (9) “Conditions along much of the coastline of the United States are well suited for wind energy.” (True). |
| Attitudinal Indicators | |
| Trust government | Measured using a 4-point scale. Respondents were asked, “How much of the time do you think you can trust the federal government in Washington, D.C. to do what is right?” Coded as, 0 = “rarely,” 1 = “only some of the time,” 2 = “most of the time,” and 3 = “just about always.” |
| Trust media | Measured as an index that averaged responses using an 11-point scale. Respondents were asked, “Place the following information sources on a scale from 0 to 10 in terms of the trustworthiness of information provided on energy, with 0 indicating the source is not at all trustworthy and 10 indicating the source is extremely trustworthy.” Respondents were presented with the following media categories: newspaper, radio, TV, Internet. |
| Trust experts | Measured as an index that averaged responses using an 11-point scale. Respondents were asked, “Place the following information sources on a scale from 0 to 10 in terms of the trustworthiness of information provided on energy, with 0 indicating the source is not at all trustworthy and 10 indicating the source is extremely trustworthy.” Respondents were presented with the following expert categories: environmental groups, Department of Energy; Environmental Protection Agency, state government agencies. |
| Trust industry | Measured as an index that averaged responses using an 11-point scale. Respondents were asked, “Place the following information sources on a scale from 0 to 10 in terms of the trustworthiness of information provided on energy, with 0 indicating the source is not at all trustworthy and 10 indicating the source is extremely trustworthy.” Respondents were presented with the following industry categories: utilities (such as your electric company), oil and gas companies. |
| Environmentalism | Measured using an 11-point scale. Respondents were asked, “On a scale from 0 to 10, with 0 indicating not at all concerned and 10 indicating extremely concerned, how concerned are you about each of the following issues?” “The environment.” (Recoded: 0–1 = 0, 2–3 = 1, 4–6 = 2, 7–8 = 3, 9–10 = 4) |
| Likely energy shortage | Measured using an 11-point scale. Respondents were asked, “On a scale from 0 to 10, with 0 indicating not at all likely and 10 indicating extremely likely, what is the likelihood of the United States facing a critical energy shortage in the next ten years?” (Recoded: 0–1 = 0, 2–3 = 1, 4–6 = 2, 7–8 = 3, 9–10 = 4) |
| Nuclear properly regulated | Measured using a 3-point scale. Respondents were asked, “This energy source is sufficiently regulated by the government.” “Nuclear.” Respondents were presented with the following answer choices: “True” = 2, “Unsure” = 1, and “False” = 0. |
| Coal properly regulated | Measured using a 3-point scale. Respondents were asked, “This energy source is sufficiently regulated by the government.” “Coal.” Respondents were presented with the following answer choices: “True” = 2, “Unsure” = 1, and “False” = 0. |
| Wind regulated | Measured using a 3-point scale. Respondents were asked, “This energy source is sufficiently regulated by the government.” “Wind.” Respondents were presented with the following answer choices: “True” = 2, “Unsure” = 1, and “False” = 0. |
| Hydroelectric regulated | Measured using a 3-point scale. Respondents were asked, “This energy source is sufficiently regulated by the government.” “Hydroelectric.” Respondents were presented with the following answer choices: “True” = 2, “Unsure” = 1, and “False” = 0. |
| Solar regulated | Measured using a 3-point scale. Respondents were asked, “This energy source is sufficiently regulated by the government.” “Solar.” Respondents were presented with the following answer choices: “True” = 2, “Unsure” = 1, and “False” = 0. |
| Risk Perceptions | |
| Nuclear meltdown | Measured using an 11-point scale. Respondents were asked, “We are interested in assessing your level of concern regarding various issues associated with energy generation. Using a scale from 0 to 10, with 0 indicating not at all concerned and 10 indicating extremely concerned, what is your level of concern for the following?” “Nuclear meltdown.” (Recoded: 0–1 = 0, 2–3 = 1, 4–6 = 2, 7–8 = 3, 9–10 = 4) |
| Nuclear storage | Measured using an 11-point scale. Respondents were asked, “We are interested in assessing your level of concern regarding various issues associated with energy generation. Using a scale from 0 to 10, with 0 indicating not at all concerned and 10 indicating extremely concerned, what is your level of concern for the following?” “The storage and disposal of nuclear waste.” (Recoded: 0–1 = 0, 2–3 = 1, 4–6 = 2, 7–8 = 3, 9–10 = 4) |
| Nuclear transportation | Measured using an 11-point scale. Respondents were asked, “We are interested in assessing your level of concern regarding various issues associated with energy generation. Using a scale from 0 to 10, with 0 indicating not at all concerned and 10 indicating extremely concerned, what is your level of concern for the following?” “The transportation of nuclear waste to a storage facility.” (Recoded: 0–1 = 0, 2–3 = 1, 4–6 = 2, 7–8 = 3, 9–10 = 4) |
| Coal pollutants | Measured using an 11-point scale. Respondents were asked, “We are interested in assessing your level of concern regarding various issues associated with energy generation. Using a scale from 0 to 10, with 0 indicating not at all concerned and 10 indicating extremely concerned, what is your level of concern for the following?” “Pollutants created during the burning of coal.” (Recoded: 0–1 = 0, 2–3 = 1, 4–6 = 2, 7–8 = 3, 9–10 = 4) |
| Coal ash | Measured using an 11-point scale. Respondents were asked, “We are interested in assessing your level of concern regarding various issues associated with energy generation. Using a scale from 0 to 10, with 0 indicating not at all concerned and 10 indicating extremely concerned, what is your level of concern for the following?” “Storage and/or disposal of ash from coal-fired power plants.” (Recoded: 0–1 = 0, 2–3 = 1, 4–6 = 2, 7–8 = 3, 9–10 = 4) |
| Bird & bat mortality | Measured using an 11-point scale. Respondents were asked, “We are interested in assessing your level of concern regarding various issues associated with energy generation. Using a scale from 0 to 10, with 0 indicating not at all concerned and 10 indicating extremely concerned, what is your level of concern for the following?” “Bat and bird mortality in relation to wind turbines.” (Recoded: 0–1 = 0, 2–3 = 1, 4–6 = 2, 7–8 = 3, 9–10 = 4) |
| Hydroelectric water temperature | Measured using an 11-point scale. Respondents were asked, “We are interested in assessing your level of concern regarding various issues associated with energy generation. Using a scale from 0 to 10, with 0 indicating not at all concerned and 10 indicating extremely concerned, what is your level of concern for the following?” “Increased temperature of water after it exits a hydroelectric dam.” (Recoded: 0–1 = 0, 2–3 = 1, 4–6 = 2, 7–8 = 3, 9–10 = 4) |
| Demographic Indicators | |
| Education | Measured in years of education |
| White | Measured nominally as 1 = white, and 0 = nonwhite. |
| Ideology | Measured as a 7-point scale, with 1 = strongly liberal, and 7 = strongly conservative. |
| Party ID | Measured as a 5-point scale, with 1 = strong Democrat, and 5 = strong Republican |
| Age | Measured in years. |
| Female | Measured nominally as 0 = male, and 1 = female. |

NOTE:
This article is based on research conducted by the Institute for Science, Technology and Public Policy in the Bush School of Government and Public Service, Texas A&M University in cooperation with the Texas A&M Energy Institute. This research was supported by Texas A&M University’s Crisman Institute for Petroleum Research in the Harold Vance Department of Petroleum Engineering; the Institute for Science, Technology and Public Policy; and the Texas A&M University Office of the Vice President for Research. The statements, findings, conclusions, and recommendations are solely those of the authors. The authors would like to thank Jamie Druckman and Liz Suhay for their helpful comments throughout the development of this article.
Notes
James W. Stoutenborough is a postdoctoral research associate in the Department of Political Science at Idaho State University and a senior research fellow in the Institute for Science, Technology and Public Policy in the Bush School of Government and Public Service at Texas A&M University. His research interests lie within science and technology policy, with an emphasis on energy and climate change.
Arnold Vedlitz is director of the Institute for Science, Technology and Public Policy and the Bob Bullock Chair in Government and Public Policy in the Bush School of Government and Public Service at Texas A&M University. He has authored or coauthored several noted books and dozens of articles and book chapters on politics, science, and technology policy.
Xinsheng Liu is an associate research scientist in the Institute for Science, Technology and Public Policy in the Bush School of Government and Public Service at Texas A&M University. His academic interests include public policy, politics of agenda setting, foreign policy, and U.S.-China relations.