
Abstract
Researchers have long measured people’s thoughts, feelings, and personalities using carefully designed survey questions, which are often given to a relatively small number of volunteers. The proliferation of social media, such as Twitter and Facebook, offers alternative measurement approaches: automatic content coding at unprecedented scales and the statistical power to do open-vocabulary exploratory analysis. We describe a range of automatic and partially automatic content analysis techniques and illustrate how their use on social media generates insights into subjective well-being, health, gender differences, and personality.
Language reveals who we are: our thoughts, feelings, beliefs, behaviors, and personalities. Content analysis—quantitative analysis of the words and concepts expressed in texts—has been extensively used across the social sciences to analyze people’s communications. Social media, now used regularly by more than 1 billion of the world’s 7 billion people, 1 contains billions of such communications. Access to these enormous samples, via Facebook and Twitter for example, is changing the way we can use content analysis to understand people: the door has been opened for data-driven discovery at an unprecedented scale.
Through status updates, tweets, and other online personal discourse, people freely post their daily activities, feelings, and thoughts. Researchers have begun leveraging these data for a wide range of applications including monitoring influenza and other health outbreaks (Ginsberg et al. 2009; Paul and Dredze 2011), predicting the stock market (Bollen, Mao, and Zeng 2011), and understanding sentiment about products or people (Pang and Lee 2008).
An understudied but fast-growing area of such analysis is the behavioral and psychological linguistic manifestations that make up who we are. Unlike traditional survey-based or controlled laboratory studies, data-driven content analysis of social media is unprompted, often requiring no specific a priori theories or expectations. One only needs to plan the outcomes they are interested in and the types of language features (e.g., words or topics) they would like to associate, and let the data tell the story (e.g., that conscientious people are not only interested in “planning” and “work” but also “relaxing” and “weekends”; Schwartz, Eichstaedt, Kern, Dziurzynski, Ramones, et al. 2013).
Data-driven techniques can work toward two goals for social science: prediction and insight. Prediction focuses on automatic estimation or measurement of specific psychosocial outcomes from word use, for example, depression from social media (De Choudhury et al. 2013); personality from conversations (Mairesse et al. 2007); or political ideology from speeches (Laver, Benoit, and Garry 2003) or Twitter (Weber, Garimella, and Batayneh 2013). Insight-based studies use exploratory language analyses to better understand what drives different behavioral patterns, for example, finding topics that distinguish personality factors (Schwartz, Eichstaedt, Kern, Dziurzynski, Ramones, et al. 2013) or words that characterize partisan political stances (Monroe, Colaresi, and Quinn 2008). Each goal warrants different statistical techniques. Prediction is often best done using large multivariate regression or support vector machine models (e.g., what combination of word weightings best predicts extraversion?), while insight is often best accomplished by repeated univariate (or bivariate) analyses that are generally easier to understand (e.g., what is the correlation between “party” and extraversion? between “computer” and extraversion?).
Both prediction and insight content analysis methods can be viewed as lying along a continuum from the manual to the data-driven, ranging from simply counting words in manually constructed word lists (lexica) to “open-vocabulary” methods that automatically generate lexica or identify keywords predictive of who we are. This article provides an overview of prediction and insight methods, organized along the continuum from the manual to the data-driven and illustrated with examples drawn from automatic content analysis in psychology.
Data-Driven Content Analysis
The social sciences have a long tradition of studying language use to better understand people (Krippendorff 2012). Raters manually judge people’s writing to quantify prevailing opinions in newspapers (Woodward 1934) or attempt to infer intents from propaganda (George 1959) or relate explanatory style to depression (Peterson and Seligman 1984) among countless other applications. The past few decades, though, have seen the growth of automatic techniques. Until recently, these techniques were largely constrained to using manually created dictionaries—lists of words associated with a given category (e.g., positive emotion words). Such approaches, characterized as “closed-vocabulary,” provide an accessible hypothesis-driven language analysis (e.g., females use more positive emotion words), but only harness a small fraction of information that language use can reveal about people.
Modern work has begun to use “open-vocabulary” language features—any words or other linguistic features that do not rely on manually preselecting words or categories. Instead, for example, the vocabulary can be derived from the data through tokenization—the process of splitting a sentence or document into individual lexical units known as “tokens.” The field of computational linguistics (Jurafsky and Martin 2000), which focuses on modeling language rather than understanding people, has long embraced open-vocabulary techniques. However, the social sciences have only recently begun to adapt such techniques, presumably due to a combination of limited data sizes and the open-vocabulary computational methods being less accessible to employ.
Automatic content analysis techniques range from hand-driven closed-vocabulary to more data-driven and open-vocabulary. This spectrum of techniques is depicted according to language feature types in Figure 1. Several factors tend to vary across the spectrum: accessibility, sample-size requirements, scientific approach (theory-driven versus exploratory), and abstractness/transparency. For example, manual dictionary techniques are accessible, theory-driven, abstract, and can be used with small samples. On the other hand, open-vocabulary techniques require larger samples, but capture more patterns, tend to be more transparent regarding insights (reflect the language itself rather than it abstracted into categories), and are able to yield unexpected results.

Categorization of Content Analysis Techniques
Hand-driven techniques tend to be more accessible, theory-driven, abstract, and able to handle small datasets, while data-driven tend to be more transparent, capture more connections, and are able to yield unexpected associations.
Manual dictionaries
Dictionaries, lists of words associated with given categories, have been used extensively and through a long history of social science research dating back to Stone’s “General Inquirer” (Stone, Dunphy, and Smith 1966). While many techniques to apply dictionaries have been attempted through the years (Coltheart 1981), modern approaches, such as the popular linguistic inquiry and word count (Pennebaker, Francis, and Booth 2001; Pennebaker et al. 2007), rely on an accessible “word count” technique. A positive emotion dictionary category might contain the words “happy,” “excited,” “love,” and “joy.” For a given document (e.g., the writing of a given study subject), the program counts all instances of words from the given dictionary category. Typically, these word counts are converted to percentages by dividing by the total number of words (e.g., 4.2 percent of a subject’s words are classified as positive emotion).
Dictionary language use has been associated with many outcomes. Example findings (a small but diverse selection across a vast literature) include older individuals using more first-person plurals and future-tense verbs in spoken interview transcripts (Pennebaker and Stone 2003), males swearing more across a variety of domains (Newman et al. 2008), couples having more stable relationships if they match pronoun category usage (Ireland et al. 2011), and highly open individuals including more quotations in social media (Sumner et al. 2012).
The advantages of using dictionaries are plentiful. Their wide adoption in social science is evidence of their accessibility: one does not need a computational programming background to understand counting words in categories, they can be run on traditional human-subject samples (e.g., tens to hundreds of people), and they mostly fit the standard model of hypothesis-driven science. On the other hand, the abstraction of labeling large groups of words with categories can mask what is truly being measured. One word may drive a correlation, or words may be used in ways that are not expected—for example, the word “critical” driving the belief that there is more anger, when it is used in the sense of “very important.” This abstraction into predetermined categories also means they generally do not yield unexpected associations.
Crowd-sourced dictionaries
Another manual dictionary creation process builds on the wisdom of crowds. Modern web platforms such as Amazon’s Mechanical Turk allow one to collect large amounts of word ratings with little effort and time. By using ratings, one can create a weighted dictionary where each word has an associated strength of being within a category (e.g., “fantastic” may be rated as a 4.7 on a 5-point scale of positive emotion while “good” may be only a 4). Having tens of thousands of words rated by hundreds of people allows one to develop a dictionary that essentially covers all common words (e.g., including neutral words such as “computer,” rated 3 on a positive emotion scale, in addition to negative words). Crowd-sourced dictionaries may also be less subject to the biases and oversights from dictionaries made by a small number of experts.
A precursor to crowd-sourced dictionaries was the development of affective norms for English words (ANEW) (Bradley and Lang 1999), in which a group of about twenty-five undergraduates at the University of Florida rated 1,040 words along the dimensions of emotional valence, arousal, and dominance. The mean values of these ratings are often used as a weighed dictionary. More recently, Dodds et al. (2011) used Amazon’s Mechanical Turk to develop the Hedonometer, a dictionary of happiness. The Hedonometer was applied as a measurement of happiness across time (Dodds et al. 2011) and space (Mitchell et al. 2013). Dodds also found the ability to “turn up the contrast” in a weighted dictionary by only keeping words rated strongly positive or negative. Still, words are ambiguous, and people are often unaware of how words are most often used in real-life text. When primed with emotional words, “play” may sound like a good fit, but the sense in which it is most often used (e.g., “play the video”) conveys much less happiness than the sense of “play” people likely associate with happiness (e.g., “child going to play with friends”).
Deriving dictionaries from text
An attractive way to derive dictionaries automatically is to start with a large collection of texts (e.g., tweets or posts) that are labeled in some way, either based on attributes of the person that wrote them (sex, age, personality, political orientation, and so on) or by crowd-sourced labeling (e.g., how positive/negative, optimistic/pessimistic, liberal/conservative the post is.) The text is then automatically broken up into words (“tokenized”). Stochastic methods, such as pointwise mutual information (Church and Hanks 1990) are then used to identify the words or phrase most highly correlated with the outcome.
Deriving dictionaries from text is part of a long-running trend of data-driven techniques taking over much of the field of computational linguistics (a field focused on modeling language rather than understanding people, but one highly relevant to content analysis). The most relevant of such work is that in the generation of sentiment dictionaries (Taboada et al. 2011). In fact, a seminal work in the field, Pang, Lee, and Vaithyanathan (2002), showed that sentiment dictionaries derived from movie reviews performed significantly better than hand-crafted dictionaries. Many words they found to be predictive would not have occurred to most people manually building lexica (e.g., “still” was found highly predictive of positive reviews, signaling positive transitions; a question mark was found to be negatively correlated with movie sentiment; that is the movies associated with the question were generally less liked).
The primary advantage of deriving dictionaries from text is that such dictionaries are grounded in real-world distributions of words rather than suspected word use. On the downside, they require annotated text; this is not very expensive in the modern world of Mechanical Turk, but not free either.
Topics
One can also automatically derive dictionaries in the absence of a priori categories. Unlike the above example of correlating word use with concept labels (so-called supervised learning), words that tend to co-occur with each other or with the same words are grouped together. Such unsupervised learning yields theory-free clusters of related words, which can then be tested for correlation with document labels or human attributes. Skip ahead to Figure 2 to see some topic related to gender, derived from Facebook with the widely used latent dirichlet allocation (LDA) method (Blei, Ng, and Jordan 2003). In our previous work (e.g., Schwartz, Eichstaedt, Kern, Dziurzynski, Ramones, et al. 2013; Eichstaedt et al., forthcoming), we often find five hundred or two thousand topics using a large text collection (e.g., tens of millions of status updates), and then see which of them correlate with outcomes of interest.

County Life Satisfaction Prediction Accuracy, Based on Two Types of Features over Twitter Dictionaries (lexica) and LDA Topics (topics)
Theory-free word clusters offer many advantages over manually constructed word groups. Automatically derived “topics” include many words that one would not have thought of adding, including many “words” not in any dictionary. Incorrect or novel spellings are often crucial “words” in topics. Elsewhere we find enthusiasm and extroversion are indicated by “sooo” or “!!!”, simply misspelling words indicates low conscientiousness, or novel spellings signal multicultural backgrounds. All of these word types end up in automatically generated topics. Such topics also allow data-driven discovery: the discovery of classes of words that were not anticipated as being predictive of an outcome. People low in neuroticism use more sports words (e.g., names of sports teams) (Schwartz, Eichstaedt, Kern, Dziurzynski, Ramones, et al. 2013). Counties high in athereosclerotic heart disease use more topics subjectively characterized as boredom and disengagement (Eichstaedt et al., forthcoming).
Topics also, of course, offer some disadvantages. Different researchers tend to generate their own word clusters, making comparison across different research groups more difficult than the case where everyone uses a standard lexicon such as Linguistic Inquiry and Word Count (LIWC). One often starts with a given theory; in such cases, a narrowly crafted lexicon such as the Moral Foundations Dictionary (Graham, Haidt, and Nosek 2009) may be preferred. Also, although they can be displayed in a transparent fashion (see Figure 2), topics often require interpretation or validation (e.g., does the “boredom” topic correlate with messages rated for disengagement).
Words and phrases
An important technical question is what to use as the smallest unit of linguistic analysis. Words are the obvious candidate, but the concept of a “word” is much slipperier than one might think; just dividing up texts based on where spaces occur works very poorly, as punctuation then attached to the word they follow, and meaningful terms often include spaces; “Barack Obama” is perhaps best viewed as a single term, not two words.
Linguistic analysis generally starts with tokenization, splitting the sequence of characters that compose a message into “words.” Thus, “Sadly, I can’t come.” would be broken up into “Sadly”, “,”, “I”, “can’t”, “come” “.” (some tokenizers also split “can’t” into two tokens). One can then further look within words to extract the root (e.g., “sad” in “sadly”). Early methods such as LIWC often use wildcards to match any word with a given root (e.g., “sad*” would match “sad,” “sadder,” and “sadly,” but also, unfortunately, “saddle,” “Sadie,” and “Saddam.” More modern methods tend to keep entire words, since words derived from the same root have very different meanings and connotations (e.g., LIWC uses “treasur*”, which matches “treasure,” “treasuring,” and “treasury”). Further, social media often presents new types of words such as emoticons ( :) and <3), hashtags (“#Bieber”), or URLs (“http://www.aapss.org“).
Multiword expressions (Sag et al. 2002) often offer a better unit of analysis than tokens. Multiword terms describing entities should be grouped together. “United States” is not just “united” and “states.” Natural language is also inherently ambiguous; the same word has different meanings based on its context. “Bank” in a “river bank” is not the same as “bank” in “bank deposit”; “sick” is not the same as “sick of.” One could, in theory, use automatic word sense disambiguation software; in practice it is usually easier and more reliable to automatically group together pairs or triples of words that occur together more often than one would expect by chance. This has the added benefit of finding collocations such as “Merry Christmas” or “United States” where ambiguity is not the main issue. Fortunately, there are relatively clear methods for extracting such multiword expressions. One of the most commonly used is point-wise mutual information (PMI; Church and Hanks 1990). PMI is a ratio comparing the true probability that words occur together (joint-probability) to the random chance that the words appear together (the independent probability).
The biggest advantage of looking at words and phrases directly rather than using dictionaries is that one gets much more comprehensive coverage of the language that may be significant. Additionally, while all methods need some domain adaptation when used in a new environment (e.g., over Twitter), data-driven techniques lend themselves nicely to automatic adaptation, often facilitated through “semi-supervised learning”—the process of using unlabeled data to increase the utility of labeled data (e.g., one might adapt a Facebook model to Twitter by renormalizing the data according to the mean and standard deviation of words used in the Twitter data). On the other hand, when working directly with words and phrases, one may get overwhelmed; there may be too many statistically significant words to read and interpret them all (we show the top fifty to one hundred words and phrases in our differential word clouds but there are often thousands of statistically significant results). Thus, many terms (and associated theories) may go overlooked. In such cases topics or dictionaries offer easier interpretability; they also require fewer observations.
Other types of linguistic features
For some language models, words and phrases are not enough. For example, a popular definition of optimism considers how one explains the cause of situations (Peterson and Seligman 1984). Capturing causal explanations is not easily done simply with words—one may need syntactic or even discourse parsers. A variety of other linguistic features including parts of speech, grammatical and discourse relationships (e.g., as extracted from parsers), and disambiguated words can be used for content analysis. Thus far, few of these features have been applied in social science settings, but we may see their adoption as the field runs up against the limits of dictionaries, topics, and words.
Statistical Techniques
Automatic content analysis can be used both for prediction and for insight. In prediction (or estimation) a statistical model is built with the goal of predicting some label or outcome for a person or community based on the words they use: How old is this person or what opinion are they likely to hold on abortion? What is the crime rate or the consumer confidence this month in this city? In insight-driven analysis, the goal is to form hypotheses from the words used by a person or community about the labels or outcomes: What is it like to be neurotic? How are happy communities different from less happy ones? Prediction and insight often require different statistical methods.
Prediction (language-based measurement)
Prediction requires building a model that estimates a dependent variable, often called a “response,” “label,” or “outcome” (e.g., a person’s age, sex, reported satisfaction with life, or political party affiliation) as a function of some independent variables, called “predictors” or “features” (e.g., the words that the person used, or some features derived from the words, such as relative frequency of mention of different LIWC categories or LDA topics). For automatic content analysis, this can be a replacement for coding at the document level (e.g., how positive is a given speech), or more directly be used to measure characteristics (e.g., extent of extraversion; political ideology of an individual or group).
Building predictive models is a widely studied topic (Bishop 2006; Hastie, Tibshirani, and Friedman 2009), which we cannot do justice to here. We do, however, note that the techniques of regularization and feature selection are very important when dealing with a large number of features (e.g., words) to avoid overfitting. If one has a sample of ten thousand people, each of whom used different combinations of forty thousand words or multiword expressions, it is often possible to find word weights that perfectly predict a given property across all people. (Imagine the extreme version where each person had a unique name that only they said; then a regression predicting, for example, each person’s sex based on the words they used could end up just memorizing the sex associated with each name.) Feature selection (automatically choosing which features to keep in the model) and regularization (shrinking the regression coefficients toward zero) are thus critical.
Because language features often have a Zipfian distribution (most features only occur a few times), a common first step to any analysis is simply removing infrequent features from which it is difficult to infer any relationships with statistical confidence. If further feature selection is needed, then univariate correlation values can be used (see “Sample Size and Power”). Common regularization techniques include L2 (ridge) and L1 (Lasso) penalization for regression over continuous outcomes, or, when outcomes are discrete, logistic regression or support vector machines (SVMs) (Hastie, Tibshirani, and Friedman 2009). Such approaches shrink or “penalize” coefficients in linear models, essentially limiting any single feature from driving predictions. If one uses a large penalty, the model will likely generalize to other datasets better (have more “bias”) but at the expense of predictive accuracy; a small penalty, and the model might predict very accurately over training data but not generalize well to new data (overfit). This compromise between generalization and accuracy over the training data is often referred to as the “bias-variance trade-off.” Principal components analysis for dimensionality reduction also offers a form of regularization useful when many features have high covariance (i.e., words). In practice, we often use a hybrid method, starting with the most frequent words, phrases, and LDA topics. We then select out those features that most correlate with the label (e.g., using family-wise error rates to control for the number of features considered), run them through a dimensionality reduction, and put the resulting feature set into a penalized regression (e.g., a Ridge regression).
Insight (exploratory analyses)
The other main goal of content analysis is insight—gaining an understanding of possible psychological and behavioral factors of a population suggested by language patterns, and thus forming hypotheses for future investigation. Although multivariate methods exist for capturing insight (Eisenstein, Smih, and Xing 2011), we find it generally more useful to find the univariate correlation between words used and the label of interest. 2 Viable approaches for such iterative univariate analyses include a Bayesian approach; iterative Dirichlet prior (Monroe, Colaresi, and Quinn 2008) when documents have distinct classes (e.g., male, female; liberal, conservative); or our own differential language analysis (DLA; Schwartz, Eichstaedt, Kern, Dziurzynski, Ramones, et al. 2013), which handles continuous outcomes.
An attractive aspect of using language as features is that they are often easily interpreted. We have found that differential word clouds provide an excellent method of visually communicating which words or topics (word clusters) are most highly correlated with an outcome of interest. For example, Figure 3 shows word clouds derived from a DLA of Facebook posts by men and women.
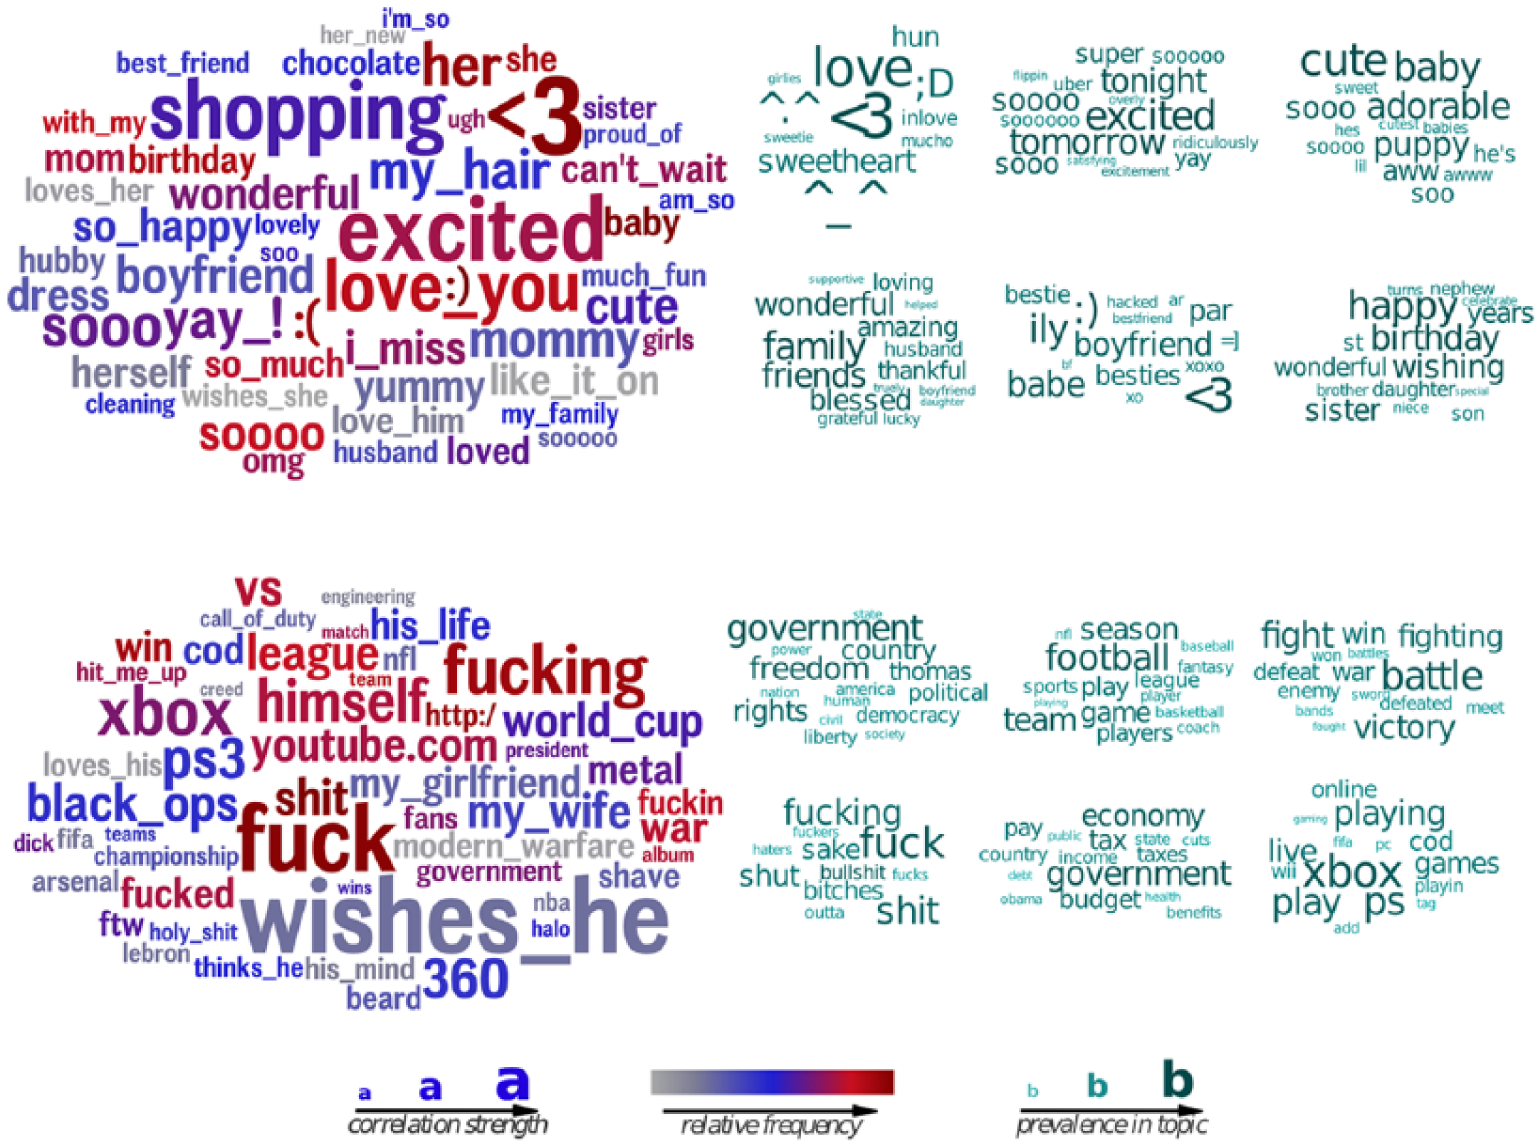
Words and Phrases (Left) and Topics (Right) Most Distinguishing Women (Top) from Men (Bottom)
On the left are the words that most correlate with either being male or being female. The larger the word, the higher the correlation. The bolder the color (the more red), the more frequent the word; the paler the color (more blue or gray) the less frequent the word. The word clouds show at a glance what most distinguishes American males and females in their language on Facebook. Note that most of the language used by males and females is virtually indistinguishable (e.g., the words “the” or “dog” or “Canada”); the word clouds only show the words with the most different usage patterns. Note also that many of the “words” would not show up in any standard dictionary, either because they are emoticons or variant spellings, or because they are multiword expressions.
Arranged on the right are the words in the LDA topics that most highly correlate with being male or being female. The LDA topics contain many of the same words found in the central word cloud, but by organizing them into topics, they make clearer the themes that run across the different words (e.g., love topic for females; government topic for males), but also might miss nuances found in the words (e.g., “mommy” for females; “Youtube” for males).
Levels of content analysis
Content analysis can be done at different levels and with different goals. As depicted in Figure 4, one can analyze individual messages (e.g., single tweets or blog posts), individual people (e.g., all Facebook posts or articles written by one person) or groups or communities (e.g., all tweets from a given city or messages posted by a given organization). Individual messages are easiest to label using a crowdsourcing platform such as Mechanical Turk but are rarely the end goal of the analysis. Instead one is often interested in people or in communities. People—not messages—are introverted or extroverted, and vote Democrat or Republican. Data are often available at the county level, allowing one to correlate words in Tweets originating from a county with health, crime, or political leanings.
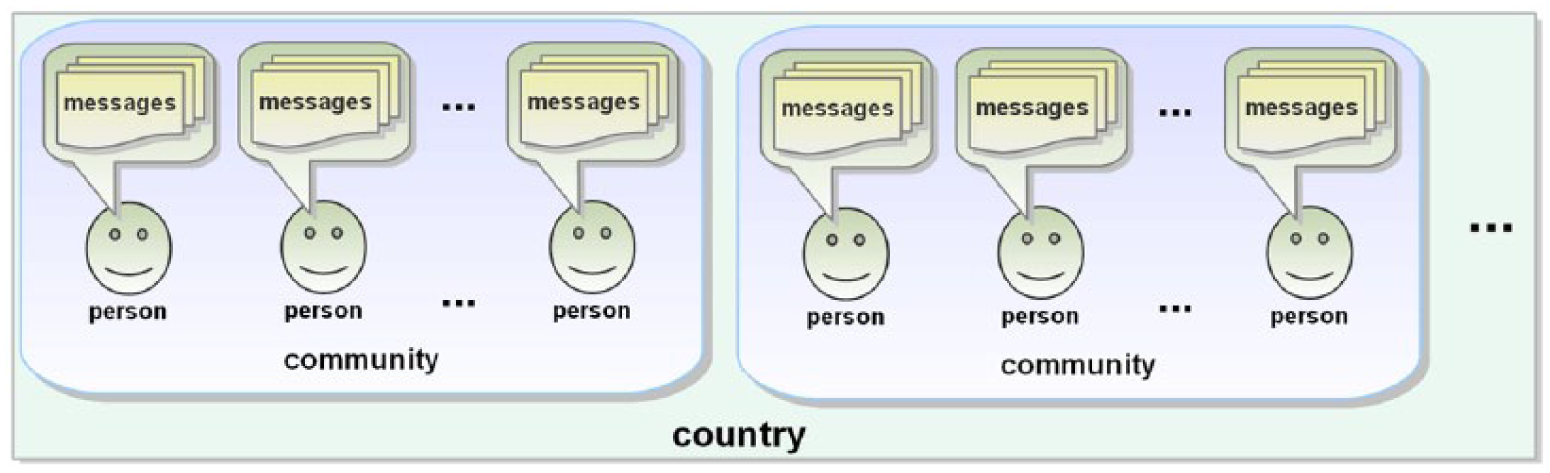
Levels of Content Analysis Available from Social Media
Sample size and statistical significance
More observations are always better, but a weak rule of thumb is to shoot for approximately the same or slightly fewer observations than language features. Thus, if one is building an extraversion predictor based on ten thousand people, one could use a vocabulary of around ten thousand words and multiword expressions; but if one only had information about two thousand people, it would be good to use LDA topics. For fewer observations, one would need to turn to specific word sets such as LIWC or sentiment dictionaries. Since only approximately twenty thousand to forty thousand unique words and multiword expressions are used moderately frequently, results start to flatten out above twenty-five thousand users. It is also helpful to consider the number of words each person or community has written. Again, the more the better, but as one increases the requirement for the word total, the total number of observations needed decreases. For Facebook, for example, we have found that requiring a thousand-word minimum, before any analyses or filtering, is often sufficient (i.e., it is not worth the loss in observations to increase beyond this point). When annotating observations containing very limited word counts, such as individual messages, we often use binary features—simply encoding whether a feature exists rather than frequency.
Note that when making claims about the statistical significance of any correlation between words and outcomes, it is important to control for the false discovery rate (FDR), either with a simple Bonferroni correction (requiring a p-value to be ten thousand times smaller if one tests ten thousand features for correlations than if one did a single test) or using more sophisticated methods such as Simes or Benjamini-Hochberg false discovery rate (Benjamini and Hochberg 1995).
Challenges and Limitations
Analysis of social media data has many limitations, some relatively easy to overcome, others less so. Social media posts are a biased sample; Facebook and Twitter users are not representative of the overall population; old people and children are (obviously) vastly underrepresented. While some have found online surveys match responses from general populations (Gosling et al. 2004), others suggest it depends on the questions: Asking mechanical turkers who they would vote for in an election predicts a democratic landslide; mechanical turkers are far more liberal than randomly selected Americans (Berinsky, Huber, and Lenz 2012). However, we know the demographics of Facebook and Twitter, and corrections in the style of stratified sampling can be made. Additionally, many studies, such as O’Connor’s time-series analysis of consumer confidence polls and Twitter sentiment (O’Connor et al. 2010) and our study of county life satisfaction (Schwartz, Eichstaedt, Kern, Dziurzynski, Agrawal, et al. 2013) successfully fit the biased samples to representative data.
Some social media, such as Facebook, is rapidly becoming used by broader demographic segments. Whether this will result in social media as a whole becoming more representative of the population is unclear. There are now hundreds of social media platforms appealing to different demographics, interest communities, and people using different media (e.g. text, speech, images, video). Individual social media platforms rapidly wax or wane in popularity but the trend is toward increased usage and broader penetration of the population.
Online users, of course, also attempt some self-presentation (Walther 2007), trying to make themselves attractive in different ways. But this is true even in questionnaire-based assessments or in people’s daily life. Which is most biased is unclear. What is clear is that there are still striking individual differences in social media language use that match psychological literature (e.g., extraverts talk about people more; neurotics talk about depression). And most men do not try to portray themselves as women; nor do Democrats masquerade as Republicans.
A deeper problem lies in any data-driven analysis: it discovers correlation, not causality. Democrats may drink more lattes than Republicans, 3 but this does not imply that coffee consumption causes liberal voting (or even the converse). This is a trade-off for the comprehensive nature of such techniques; data-driven analyses into causality remain contentious and fraught with possible errors. One can, however, gain suggestions of possible causal links by looking at longitudinal data. Social media is particularly rich with such data; social media is suited for looking back in time pre– and post–critical events (e.g., How do people change before and after an unpredicted traumatic event?) and asking questions where traditional analyses often must rely on reflections rather than everyday behavioral data.
When analyzing communities (e.g., county- or city-level analyses), one must be particularly sensitive to ecological fallacies (Kramer 1983)—the misassumption that group-level correlations reflect individual or causal relationships. Communities that talk more about museums have higher crime rates (Gerber 2014), but this does not mean the museums (or museum-goers) cause crime. Instead there is a “lurking variable” of being in a city, an “ecology” that has both educated people and criminals (not always the same people).
Ecological fallacies can be partially—but only partially—mitigated by making sure that the sample is large enough (using two thousand counties generally gives better results than using fifty states) and by including appropriate demographic variables in the regressions. For example, if income, education, or race are suspected as being possible contributors to the outcome, these can be controlled for so that language analyses reveal a marginal contribution above and beyond the known SES or demographic correlates.
In the end, evaluations should be conducted and care must be taken to not overstate the associative nature of such results. Many factors should be considered: sample size, available outcomes, and domain of text. A language model or dictionary that applies in one domain (e.g., financial newswire) may not in another (e.g., social media). Grimmer and Stewart (2013, especially “Principle 3”) note, that “there is no globally best method of automated text analysis.”
What the Future May Bring
Examples in this article have focused on the social media sources most widely used in academic studies: Twitter (because it is free, extensive, and can be at least partially mapped to geolocation) and Facebook (because it is widely used and can more easily be complemented with online questions). There has also been extensive study of blogs and discussion boards (because they have good single-issue coverage, especially for health and medical issues). There are, of course, many other similar social media. China in particular has its own set of such media including Sina Weibo, Renren, and WeChat, all of which are of huge potential interest to social scientists and language researchers alike.
Analysis of this “standard” social media has primarily focused on its text content, but increasingly users are sharing photos, audio clips, and videos. In fact, many of the fastest growing sectors of social media have involved these “rich media” exchanges (e.g., YouTube, Instagram, Pintrest). Analysis of images and audio files is, of course, much harder, but offers potentially complementary insights into people’s thoughts and concerns. For example, Ranganath, Jurafsky, and McFarland (2009) were able to better predict flirting in speed dating verbal conversations by using prosodic features (rhythm, pitch in audio clips) in addition to words. Features like rhythm and pitch are not available in written text corpora.
Another promising direction is the analysis of everyday spoken language acquired through mobile phones and emerging technologies such as Google Glass—“always on” devices for capturing conversations (Mehl and Robbins 2012). Current social media captures a part of people’s everyday thoughts and feelings; phone and mobile data can capture even more. Mobile devices have the additional advantage of providing context through motion and location sensors. For example, knowing that people are making a web search query from a location close to a hospital provides a more meaningful context to the search (Yang, White, and Horvitz 2013).
In recent decades, the biomedical sciences have been transformed based on large scale computational analyses such as the microarray and gene sequencers. Hypothesis-driven tests of specific theories have been supplemented by data-driven discovery of new classes of biological mechanisms (e.g., regulation by small RNA). Once niche, computational methods are now central to understanding biological processes. Likewise, data-driven content analysis over massive datasets will create new insights into behavioral and psychological processes. Such methods are rapidly becoming part of the standard social science toolkit, and may in time drive a host of future discoveries.
Footnotes
Notes
H. Andrew Schwartz is a visiting assistant professor of computer & information science at the University of Pennsylvania and an assistant professor at Stony Brook University (SUNY). His interdisciplinary research uses natural language processing and machine learning techniques to discover health and psychological insights through social media.
Lyle Ungar is a professor of computer and information science at the University of Pennsylvania, where he also holds appointments in other departments in the schools of Engineering, Arts and Sciences, Medicine, and Business. His current research interests include machine learning, text mining, statistical natural language processing, and psychology.