



Abstract
This study describes the spatial and racial variations in housing foreclosure during the recent housing crisis. Using data on the 9.5 million visible foreclosures (public auctions and bank repossessions) occurring between 2005 and 2012, we show that the timing and depth of the foreclosure crisis differed considerably across regions and metropolitan areas, with those located in the Mountain and Pacific West regions experiencing the highest foreclosure risks. The crisis was patterned sharply along racial/ethnic lines, with metros and neighborhoods with large black and Latino populations—as well as racially mixed neighborhoods—having high rates of foreclosure. Our analysis also highlights the particular vulnerability of Latino households, who not only had very high individual risk of foreclosures but tended to reside in areas hit hardest by the crisis. The race-stratified geographic patterns of foreclosure revealed here are substantially more complicated than a narrative that depicts only the unique disadvantage of black households during the crisis, and likely reflect some level of specific targeting of minority populations and neighborhoods by predatory and subprime lenders.
The bursting of the housing bubble in the first decade of the 2000s was one of the most cataclysmic housing-related events in a century. Over the past decade, Americans had seen the value of their homes rise to unprecedented levels, only to have a large portion of their equity erased when the housing market crashed. The contraction of housing prices, and the subsequent economic recession, contributed heavily to an explosion in the number of homeowners unable to afford their mortgages. Since 2006, approximately 16.2 million homes have entered foreclosure (RealtyTrac 2015). The scale of the crisis, thus, has been colossal, directly affecting nearly one in six American households. Yet estimates of the incidence of foreclosure completion miss the full scope of the crisis—while an enormous number of homeowners saw their homes enter the foreclosure process during the crisis, an even higher number experienced foreclosure vicariously through their extended families and friends, and an untold number dealt with the repercussions of foreclosure in their neighborhoods and broader communities. The full scale of the crisis has thus stretched far beyond individual homeowners undergoing housing-related stress.
Despite the wide reach of the foreclosure epidemic, media reports and commercial data outlets point to the strong likelihood that the impact of the crisis was unevenly distributed across the American residential landscape, with some locales seeing foreclosures accumulate rapidly and others hardly witnessing any. The geographic clustering of foreclosures means not only that people differentially experienced housing distress, but that the populations residing in these places were also unevenly exposed to housing foreclosures. In particular, the uneven distribution of racial/ethnic group populations across the United States presents the possibility that foreclosure and its consequences were racially variant. Furthermore, the high rates of subprime and other risky mortgages among racial minorities—driven not just by their relatively lower position on the socioeconomic ladder, but also by financially diminished family support networks and explicit targeting of black and brown neighborhoods by predatory lenders—suggests that minority homeowners may have been uniquely harmed by the housing crisis and experienced especially high rates of foreclosure, independent of their regional location.
A growing body of work is directed at documenting and explaining the consequences of the foreclosure crisis, including its effects on wealth accumulation (e.g., Pfeffer, Danziger, and Schoeni 2013), mental and physical health (e.g., Houle 2014), neighborhood crime (e.g., Ellen, Lacoe, and Sharygin 2013), and neighborhood instability (Hall, Crowder, and Springer 2014). While this work has been crucial for expanding our understanding of the consequences of housing foreclosure, we still lack basic knowledge of how the foreclosure crisis differentially affected communities and populations.
Information about which areas, and which populations, have been most affected by the foreclosure crisis is crucial to the development of policy responses capable of stabilizing vulnerable neighborhoods and remediating the individual- and community-level effects of the crisis. For example, the effectiveness of the federal Neighborhood Stabilization Program and similar state and local programs designed to interrupt the effects of foreclosure concentrations on housing decay, crime, and disorder hinges on a solid understanding of the types of neighborhoods most at risk of experiencing such concentrated effects (Immergluck 2012). Similarly, mortgage default counseling, loan modification programs, and related state and local programs are likely to be much more impactful if effectively designed for, and targeted to, the populations and neighborhoods most heavily affected by the foreclosure crisis (Collins, Lam, and Herbert 2011; Collins and Schmeiser 2013; Mayer et al. 2012). More generally, variations in foreclosure patterns across populations and geographic areas provide important clues about the underlying forces that may precipitate the next crisis.
In this study, we seek to build on this basic knowledge by describing geographic and demographic variation in foreclosures since the onset of the crisis. In doing so, we take a geographically and temporally expansive view, examining foreclosures across virtually all metropolitan areas during the run-up to the crisis, during its peak, and into the recovery (2005–12). Working our way down the geographic scale, we document temporal patterns of foreclosure accumulation across U.S. regions and metropolitan areas, explore whether foreclosure concentrations in metropolitan areas, their cities, their suburbs, and the constituent neighborhoods were patterned along racial lines, and show how individual households faced different risks of experiencing foreclosures themselves and in their neighborhood settings. To describe these patterns, we combine population-level data on nearly all foreclosure events in the United States between 2005 and 2012 with data on individual households from the Panel Study of Income Dynamics.
To preface our findings, we demonstrate here that the timing and depth of the foreclosure crisis varied significantly across the regions of the country, and that the concentration of foreclosures was especially pronounced in metropolitan areas—and their constituent cities and suburbs—containing relatively large shares of African Americans and Latinos. Moreover, foreclosures were highly clustered in metropolitan neighborhoods with large minority populations, a finding that stands in sharp contrast to the popular depiction of high rates of foreclosures in white suburbs. Finally, our data indicate that these spatial variations corresponded with individual-level variations in the likelihood of foreclosure in ways that reinforce the disadvantages experienced by some racial-ethnic groups; in comparison to whites, individual African Americans and, especially, Latinos were considerably more likely to experience foreclosure during (and following) the crisis period.
Background
According to conventional wisdom, the foreclosure crisis that hit the United States in 2007 was precipitated by a pernicious combination of unsustainable lending practices, irresponsible borrowing, and unrealistic expectations about the appreciation of real estate (Been, Chan, et al. 2011; Engel and McCoy 2011). In the years leading up to the crisis, housing prices rose steadily in most metropolitan areas, and astoundingly so in some. These housing-price increases reflected not only general economic prosperity during the last years of the twentieth century, but the assumption by homeowners, speculators, and lenders that real estate prices would continue to rise.
This expectation of ever-increasing equity helped to justify the increasing use of risky financing strategies, all enabled by years of federal deregulation of the banking industry (Immergluck 2008). With the growing popularity of zero-down mortgages, loan-to-value ratios soared and an increasing share of homeowners had little or no equity even at the origination of their loans. These problems were exacerbated by the proliferation of predatory lending practices that left millions of homeowners vulnerable to the financial burden of large balloon payments and unsustainably high interest rates. Moreover, even owners who had been in their homes for years were tempted by low interest rates and rising prices to borrow against the value of their homes. The end result was that by 2007, more than one in five homeowners had negative equity in their homes, owing more than the value of the property (CoreLogic 2010).
With the general slowing of the economy, this negative-equity epidemic fueled the foreclosure crisis. Declining economic activity and growing long-term unemployment left millions of homeowners—especially those with unfavorable mortgage terms—in properties they could no longer afford (Gerardi, Ross, and Willen 2011). In a normal housing market, such homeowners would be able to reduce their financial hardship by selling their homes. But for millions, negative equity and falling home prices made such an escape impossible, leading to high rates of default and foreclosure (Been, Chan, et al 2011). Even for many who did not experience job loss, making payments on a high-cost loan for a property that was no longer expected to appreciate lost its financial imperative. The result was millions of homeowners in default on their mortgages and a huge increase in the number of housing foreclosures. Between 2007 and 2010, the estimated number of annual foreclosures increased by more than fourfold, from about 650,000 to 2.9 million (RealtyTrac 2011).
Yet the underlying dynamics of the foreclosure crisis are likely to have varied dramatically across the country (see Dwyer and Lassus, this volume). For example, fast-growing metros of the Southwest saw aggressive development strategies and huge speculation-driven inflation of housing prices while other locations saw more modest increases (Gerardi, Ross, and Willen 2011). Similarly, subprime, zero-down, and other risky and high-cost loans were more common in some areas than in others, particularly in areas with highly inflated housing prices (Immergluck 2008). Finally, some areas were much harder hit than others by job losses (Kuehn 2011) and housing-price declines (Zillow 2011) brought about by the general economic recession. These geographic disparities are likely to have been exacerbated by variation in state policies related to the administration of foreclosures and lender strategies for dealing with defaulted loans and repossessed units (Collins, Lam, and Herbert 2011; Immergluck 2010, 2012).
Geographic patterns, along with sharp variations in the risk of foreclosure, highlight the highly racialized dynamics of the foreclosure crisis. In the years leading up to the foreclosure crisis, Latino and African American homeowners were substantially more likely than whites to hold high-interest or otherwise risky mortgages (Faber 2013; Cheng, Lin, and Liu 2014). Minorities were also hit hardest by layoffs when the recession began (Hoynes, Miller, and Schaller 2012) and in a weaker position than whites to weather the financial burden of these layoffs. The result has been substantially higher levels of foreclosure among ethnic minorities than among whites during the crisis (Bocian, Li, and Ernst 2010).
There is substantial evidence that these racial disparities were a function of—and exacerbated by—the explicit targeting of minority communities by subprime lenders (Engel and McCoy 2011). A U.S. Housing and Urban Development/U.S. Treasury report (2000) found that subprime loans were five times more frequent in predominately black neighborhoods than predominately white ones, and during the 1990s, the annual percentage of all subprime loans signed by those in minority neighborhoods increased from 2 to 18 percent. There is also consistent evidence that the disproportionate concentration of risky loans in minority-populated areas was facilitated by broader patterns of racial stratification, with residential segregation by race leaving whole communities vulnerable to predatory lending practices and the subsequent collapse of the housing market during the recession (Hyra et al. 2013; Rugh and Massey 2010). Moreover, the processes through which lenders have addressed the glut of repossessed properties since the end of the recession has been substantially slower in minority-populated communities than in areas occupied mostly by whites (Ellen, Madar, and Weselcouch 2014), leaving these same minority communities vulnerable to the prolonged impacts of weakened housing dynamics.
The role of race in the foreclosure crisis is particularly troublesome given what we know about the impacts of foreclosures on individuals, families, and communities. Most obviously, the foreclosure crisis has entailed substantial decreases in individual and family wealth and expanded the already large racial-wealth gap (Pfeffer, Danziger, and Schoeni 2013; Saegert, Fields, and Libman 2011). Moreover, the process of foreclosure by itself is associated with elevated levels of stress (Bennett, Scharoun-Lee, and Tucker-Seeley 2009; Nettleton and Burrows 1998) and often triggers other taxing life changes, including residential mobility, school change, and family disruption (see Been, Ellen, et al 2011; Stoll 2014). This increased stress is implicated in the apparent link between foreclosure and both physical and mental health at the individual level (see Houle 2014; Osypuk et al. 2012; Pollack and Lynch 2009).
Even for those not experiencing foreclosure, the concentration of foreclosures in a neighborhood has potentially important impacts on a variety of outcomes. Available research indicates important links between local foreclosures and public health (see Arcaya et al. 2014; Houle and Light 2014). In addition to foreclosures diminishing the value of surrounding properties (see Daneshvary and Clauretie 2012; Wassmer 2011), they are also likely to have profound impacts on neighborhood distress and instability, leading to a density of vacant, neglected, and abandoned properties; heightening the appearance of neighborhood deterioration; driving up crime; and increasing the likelihood of racial transition (see Capone and Metz 2003; Ellen, Lacoe, and Sharygin 2013; Williams, Galster, and Verma 2014). The concentration of foreclosures in neighborhoods may thus erode residential satisfaction and propel residents who are financially able to out-migrate. These changes in neighborhood social conditions emerging from high foreclosure concentrations may significantly alter patterns of neighborhood integration by differentially affecting patterns of in- and out-migration for members of different racial groups (Hall, Crowder, and Spring 2014).
Data and Methods
To explore our main research questions, we combined data from a variety of sources. Our main source of foreclosure data comes from RealtyTrac, which collects local foreclosure listings and documents from county assessor’s offices across the United States. The complete database includes virtually all preforeclosure filings, public auction notices, and bank repossessions since 2005, which provide the universe of foreclosure filings for nearly all metropolitan counties. Most important for our purposes, these data include the physical addresses of all properties in the foreclosure process and the timing of the filings.
Utilizing the address-level RealtyTrac file, we compiled a complete listing of residential foreclosures between 2005 and 2012. With these data, we created a panel file of unique foreclosure events that tracked individual properties through the foreclosure process. To do so, we used a fuzzy-matching algorithm based on multiple fields—including address, tax parcel number, transaction and judicial case IDs—that identified unique properties, removed potential sources of redundancy, and imputed any incomplete information (e.g., property type recorded on the lis pendens but not on the Notice of Trustee Sale). Although our panel file includes all events in the foreclosure process, we restricted our analyses to cases representing the first visible sign of housing distress; a listing for public auction or bank repossession. The final file included 9.5 million visible foreclosures over the 2005 to 2012 period.
Geographic longitude and latitude of each record were determined using Bing Maps REST Services API. With these geocodes, we used GIS tools to attach census geography to each observation. Specifically, for each foreclosure event, we identified its census division, metropolitan area (using the 2010 CBSA definitions), and census block group. The metropolitan location—city or suburb—of each block group was determined by the U.S. Census Bureau’s central city indicator. We used this information to aggregate the number of foreclosures in each census division, metropolitan area, central city, suburban ring, and block group between 2005 and 2012. Dividing the annual or cumulative number of foreclosures during this period by the number of housing units at the start of each interval produced our foreclosure rate measure (expressed in 100s of housing units). For some descriptive purposes, we also classified foreclosure rates into one of five categories: none; low (0–1 foreclosures per 100 homes); moderate (1–5); high (5–10); very high (10+). Demographic information on area racial compositions comes from Summary File 1 of Census 2000. To summarize the racial/ethnic structure of each block group, we used a modified version of the typology developed by Farrell and Lee (2011) who define neighborhood racial/ethnic types consistently across metropolitan areas using information for five racial groups: Hispanics, non-Hispanic whites, blacks, and Asian and Pacific Islanders (see Hall, Crowder, and Spring 2014 for more information).
To describe foreclosure risk for individual households, we used data from the Panel Study of Income Dynamics (PSID). Started in 1968, the PSID collected detailed information of the economic and social well-being of households annually until 2001 and biennially since. The PSID is well suited for the analysis because starting in 2009, it incorporated a set of questions on recent experience with mortgage distress and housing foreclosure. Specifically, we used the 2009, 2011, and (preliminary) 2013 releases of the PSID data on mortgage distress, but were able to construct foreclosure histories back to 2001. We restricted our analytic sample to white, black, and Latino heads of PSID households. 1
Foreclosure in the PSID is assessed via a set of questions on whether household members have faced difficulty in maintaining their mortgages. In 2009, 2011, and 2013, householders were asked if a bank had begun the foreclosure process on their current home; they were also asked about whether a foreclosure was initialized on any other residential property dating back to 2001. We used this information, along with the foreclosure start date and interview date, to determine whether a householder was ever in foreclosure between the two-year observation intervals since 2001. These data were used to calculate rates of foreclosure for PSID householders by dividing the number of foreclosures into the number of households who either owned their home or lost their home through foreclosure during the interval. We also used this information to calculate cumulative foreclosure rates by keeping a running indicator of whether a household ever experienced foreclosure.
Reflecting our interest in documenting the patterns of and trends in foreclosure, our analytic approach is strictly descriptive. We first summarized the temporal patterns of the foreclosure crisis, then documented regional and metropolitan variation in the levels and timing of the foreclosure crisis and explored whether foreclosure rates differed by metropolitan racial compositions. We considered similar processes of foreclosure in the central cities and suburban rings of metro areas and then moved down to the neighborhood level where we assessed how foreclosure concentrations were related to racial/ethnic structures of census block groups. We then moved down to the household level and considered how foreclosure risk evolved over time and differed by race.
Results
We start by documenting basic geographic patterns of foreclosures between 2005 and 2012. To illustrate the variation in foreclosure risk across the national landscape, we show cumulative and quarter-specific foreclosure rates in U.S. census divisions, respectively, in Figures 1 and 2. Differences across census divisions in the cumulative rates (Figure 1) show that the Mountain division (AZ, CO, NM, NV, UT) had the highest cumulative rate of housing foreclosures: by the middle of 2010, more than one in ten homes in the Mountain division had been foreclosed on, and by the end of 2012, nearly one in six had. The exceedingly high rates of foreclosure in the Mountain division should not distract from the very high rates in other divisions: by the end of 2012, one in eight homes in the Pacific and one in eleven homes in the Southern Atlantic had been foreclosed on. By contrast, rates of foreclosure—while still inflated—were comparatively low in the Northeast, West North Central, and East South Central areas. The quarterly rates in Figure 2 better illustrate the variability across divisions in the timing of the crisis. Not surprisingly, most divisions hit their peak foreclosure levels between the end of 2009 and the middle of 2010. Yet the onset of the crisis was quite variable, with foreclosure rates starting to climb in the Mountain and Pacific divisions in 2006 but later in the South. In the Middle Atlantic division (PA, NJ, NY), foreclosure rates were actually higher in the precrisis years (2005–6) than during the crisis.

Trend in Cumulative Foreclosure Rates by Census Division, 2005–12

Trend in Quarterly Foreclosure Rates by Census Division, 2005–12
We now shift scales and describe patterns of foreclosure in metropolitan areas for the 291 metros with complete coverage of foreclosure data as of 2005. 2 Foreclosure rates for the ten metropolitan areas with the highest rates in 2005, 2007, 2009, and 2011 are shown in Table 1. Indianapolis posted the highest foreclosure rate in 2005, with 2.8 foreclosures for every 100 homes. Several other Midwestern metros—Anderson (IN), Dayton, Akron, and South Bend—were among the 2005 top ten. By the end of 2007, Western metros—including four in California—dominated the top ten. At the height of the crisis in 2009, the highest rates were seen in Phoenix, Las Vegas, and Atlanta, where about eight out of every 100 homes were foreclosed on. As the housing market started to recover in 2011, foreclosure rates declined modestly, but the general ranking of metropolitan foreclosure rates mostly persisted.
Metropolitan Areas with Highest Foreclosure Rates, by Year

NOTE: Foreclosure rates expressed as annual number of foreclosures per 100 housing units.
Racial context of foreclosure in metropolitan areas
We next consider the extent to which these variations in foreclosure rates across metropolitan areas were associated with the racial/ethnic composition of metropolitan areas. Specifically, Table 2 summarizes eight-year foreclosure rates—expressed as the sum of foreclosures in each metro between 2005 and 2012 divided by the number of housing units (in 100s) in 2005—across metropolitan areas with differing shares of blacks and Hispanics in 2000. Table 2 shows that during the crisis period, the typical metropolitan area had 6.26 foreclosures for every 100 housing units; it also shows that about half of the 291 metros fell in the “moderate” foreclosure range (between 1 and 5), a quarter in the high range (between 5 and 10) and about one in six in the very high range (above 10). Most importantly, average foreclosure rates differed by metropolitan racial shares, with the lowest rates observed in metros with very small black or Latino shares. The pattern, however, across areas with varying levels of percent black is not especially pronounced; the foreclosures rates in the most-black metros are only slightly higher, on average, than those in the least-black metros. In contrast, foreclosure rates across metros with differing Hispanic populations are striking; metros with Hispanic shares exceeding 20 percent have average foreclosure rates (mean = 13.80) more than three times as high as metros where Hispanics make up less than 5 percent of the population (mean = 3.95). The foreclosure level profiles indicate that while just 5 percent of the least-Hispanic metros have “very high” foreclosure rates, nearly two-thirds of the most-Hispanic metros do. This is one of the first signs that Hispanics were particularly hard hit by the foreclosure crisis.
Foreclosures in 2005–12, by Metro Racial/Ethnic Composition (in 2000)

NOTE: N = 291 metropolitan areas with complete foreclosure data in 2005; “Area” refers to metro areas, central cities, and suburban rings.
The popular story of the crisis often includes narratives of foreclosures in white Western suburbs (Economist 2011) and minority-heavy central cities in the Midwest (Haughney and Roberts 2009). We explore this portrayal descriptively in the two right columns of Table 2, which show average foreclosure rates over 2005–12 in metropolitan central cities and their suburban rings. On average, foreclosure rates were slightly higher in cities than suburbs during the crisis period, but there is a substantial regional patterning to this difference. In Northeastern and Midwestern metros, foreclosure rates were considerably higher in central cities than in suburban areas. In Metro Cleveland, for example, its central city foreclosure rate of 14.0 was twice as high as its suburban rate (7.0). However, in Southern and Western metropolises, foreclosures were noticeably higher in suburban areas than in cities. While foreclosures in Phoenix-Mesa-Glendale were prevalent throughout the metro, the central city foreclosure rate (30.4) was a third smaller than its suburban foreclosure rate (45.5).
Table 2 also shows that the same racial/ethnic patterning of foreclosures observed at the metro levels existed at the city and suburban levels. While black concentrations were mostly unrelated to average foreclosure rates in cities and suburbs, they were strongly conditioned by Hispanic shares. In both cities and suburbs, foreclosure rates were considerably higher in areas with larger Hispanic populations, with the highest rates being observed in suburban areas that were more than one-fifth Hispanic.
Foreclosures and race in metropolitan neighborhoods
The concentration of foreclosures in particular metropolises, and their distribution across central-city and suburban zones of these metros, offers suggestive evidence of substantial group differences in exposure to heightened foreclosure levels in residential environments. However, even within these metropolitan segments, levels of foreclosure likely varied substantially across neighborhoods. We assess this possibility in the next set of tables, summarizing foreclosure rates across block groups with varying racial/ethnic structures. Table 3 shows that in the 291 metros analyzed, there were 8.5 foreclosures per 100 housing units in the average neighborhood during the 2005 to 2012 period. The categorical breakdown shows that less than 5 percent of block groups reported no foreclosures, about half were in the low to moderate range, one-fifth had high rates, and about one-fourth had very high rates. Average foreclosure rates, however, varied substantially by neighborhood racial composition. In all-white and Asian neighborhoods, there were fewer than 5 foreclosures for every 100 homes, and just 1 in 8 of such neighborhoods had foreclosure rates over 10 (“very high”). By contrast, mostly black and mostly Hispanic neighborhoods had foreclosures over 12.9 and 11.4, respectively, and nearly half of these neighborhoods had very high rates. For the most part, most neighborhood types, including a mix of whites and minority groups, fell somewhere between all-white and all-minority neighborhoods. The exceptions are Hispanic-white and integrated neighborhoods, which experienced especially high rates of foreclosure (14.0 and 15.1) and were very likely to fall in the “high” or “very high” foreclosure classification.
Foreclosures in 2005–12, by Neighborhood Racial/Ethnic Structure (in 2000)

NOTE: Table 3 includes block groups with total populations of at least 20 in 1990, 2000, and 2010 that are located in the 291 metropolitan areas with complete foreclosure data in 2005.
We break these patterns down further by metropolitan location in the two right columns of Table 3, showing average neighborhood foreclosure rates in central city and suburban areas. Despite that central cities, as a whole, had slightly higher foreclosure rates than did suburban zones (see Table 2), the average suburban block group had a modestly higher foreclosure rate than the average city block group. More importantly, the racial patterning to foreclosure levels is similar in city and suburban neighborhoods, with all-white and Asian neighborhoods having the lowest foreclosure rates in both locations. In other types of neighborhoods, it is generally true that foreclosure rates were higher in suburban than city neighborhoods with similar racial make-ups. In mostly black neighborhoods, for example, suburban neighborhoods had mean foreclosure rates that were 21 percent higher than their counterparts in central cities (17.21 percent vs. 12.07 percent). Overall, however, black- and Latino-populated neighborhoods—whether in the suburbs or a central city—tended to have higher rates of foreclosure than did similarly located neighborhoods occupied largely by whites and Asians. Thus, despite media accounts of the crisis primarily targeting suburban white and urban minority neighborhoods, the descriptive patterns in Table 3 suggest that white neighborhoods were mostly shielded from the worst of the foreclosure crisis, while black, racially mixed, and especially Hispanic neighborhoods were hit especially hard. 3
We repeat these analyses separately by census division in Table 4 to assess whether the differences in neighborhood foreclosure rates across racial/ethnic types simply reflect the general regional concentration of foreclosures documented earlier. To facilitate interpretation of the table, the neighborhood type within each division that has the highest and second-highest foreclosure rate is highlighted in dark grey and light grey, respectively. (Foreclosure rates for types with fewer than fifty neighborhoods in a division have been suppressed.) Table 4 not only reinforces that there was strong regional clustering of foreclosures but also buttresses the racialized context of the crisis. Specifically, in all divisions, the lowest average foreclosure rates are observed in all-white or Asian neighborhoods. By contrast, racially mixed and solidly minority neighborhoods—e.g., mostly black and all-minority areas—consistently recorded some of the highest rates. Foreclosure rates among black-white and white-mixed neighborhoods in the Mountain division were in excess of one in four homes over the 2005 to 2012 period. The highest average rates were observed in Southern Atlantic integrated neighborhoods where one foreclosure for every three homes was logged. In all but one division where there were a sufficient number of block groups, mostly black neighborhoods had the highest or second-highest average foreclosure rate, followed by black-white neighborhoods, which ranked second-highest in four divisions. Mostly Hispanic and Hispanic-white neighborhoods also recorded exceptionally high rates of foreclosure in several divisions, including the Mountain West and South. A central point to take away from this analysis is that in each region, neighborhoods containing sizable shares of African American and Latino populations tended to be the most heavily burdened by foreclosures in almost every division of the country. Only in the South Central and Mountain divisions did white-dominated—or, more specifically, white-mixed—neighborhoods register as a category with especially high foreclosure concentration, and even there, black and Latino neighborhoods were not far behind.
Foreclosures Rates in 2005–12, by Neighborhood Racial/Ethnic Structure (2000) and Census Division
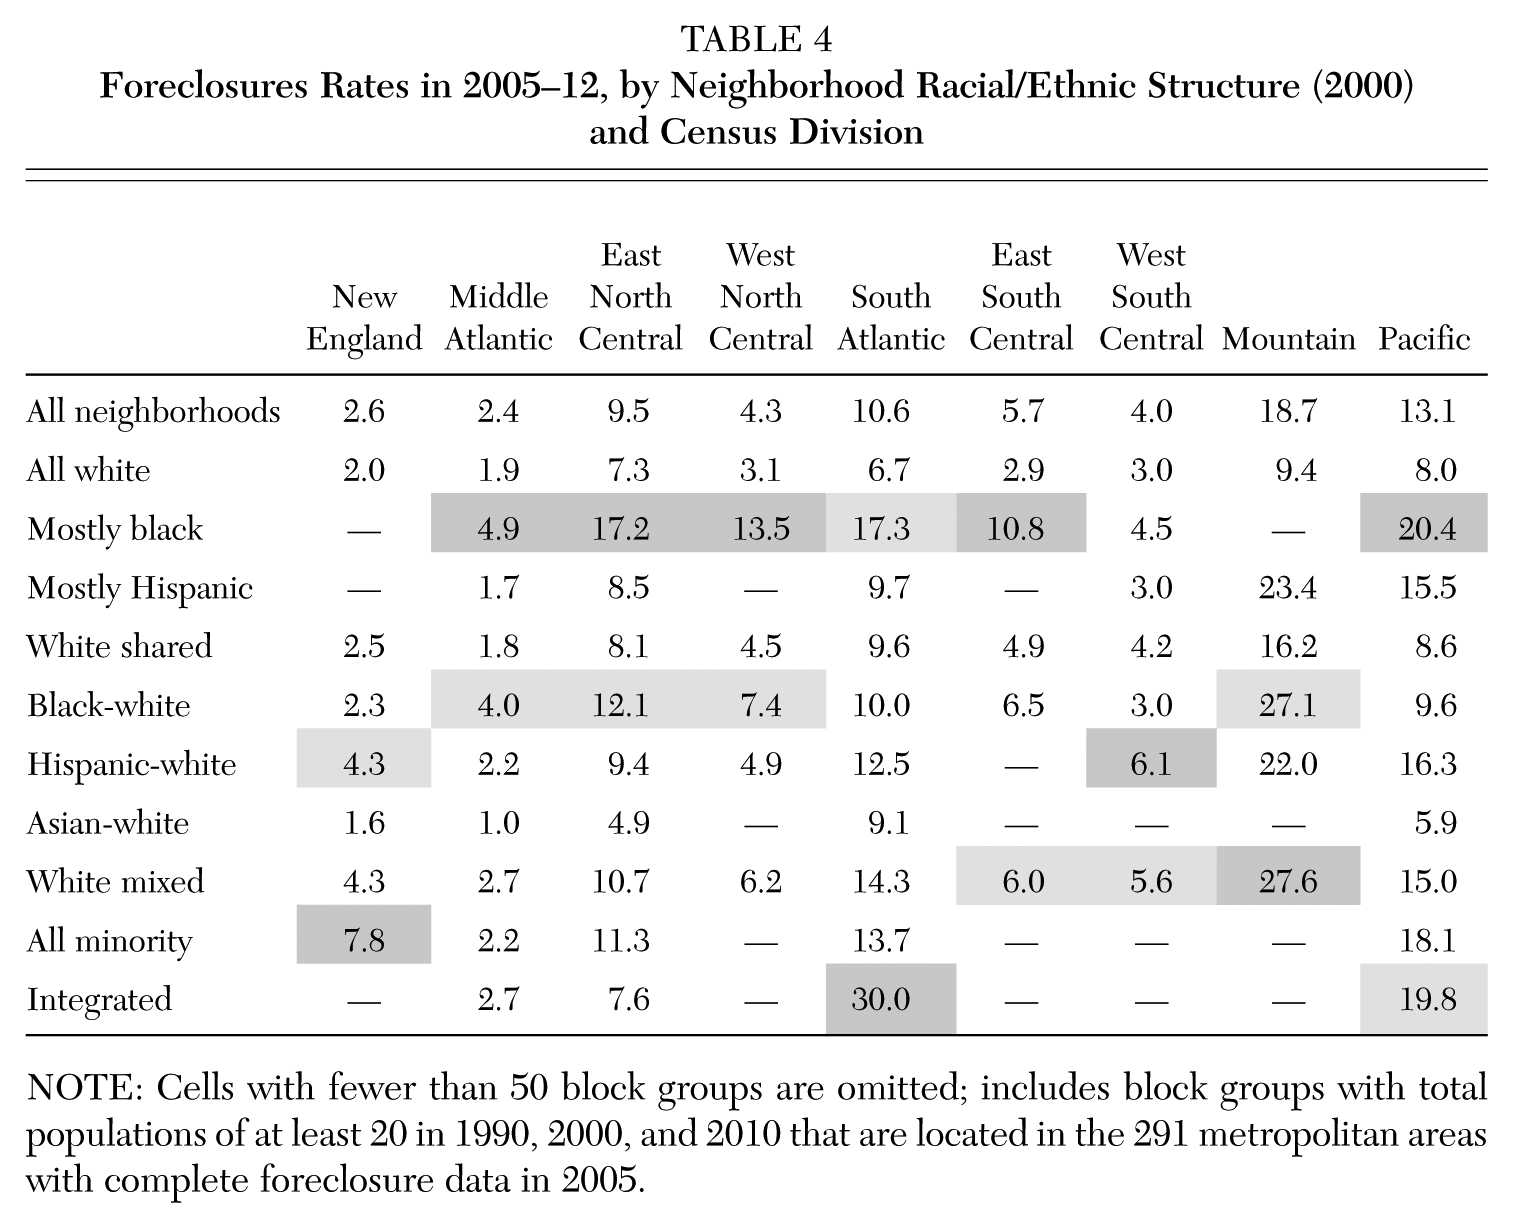
NOTE: Cells with fewer than 50 block groups are omitted; includes block groups with total populations of at least 20 in 1990, 2000, and 2010 that are located in the 291 metropolitan areas with complete foreclosure data in 2005.
Household-level rates of foreclosure
Metropolitan and neighborhood level analyses point to a strong racial patterning of foreclosures, with rates of foreclosure being substantially higher in minority neighborhoods, especially those with large concentrations of blacks or Latinos. These descriptive patterns raise several important questions about the extent to which the incidence of foreclosure differs by race. We explore this issue in even greater detail in the final stage of our analysis using household-level data from the PSID to calculate racial differences in household-level rates of foreclosure.
Table 5 summarizes foreclosure rates for non-Hispanic white, non-Hispanic black, and Hispanic householders in the PSID during the 2000s. The upper panel of Table 5 shows rates of foreclosure starts between successive interviews and thus refers to rates over each two-year interval (e.g., rates for 2009 refer to foreclosures between the 2007 and 2009 interviews). The lower panel in Table 5 shows cumulative rates over the 2001–13 period, reflecting, in a given year, whether homeowners (or previous homeowners) had entered foreclosure on a home at any time since 2001.
Foreclosure Starts for PSID Householders, by Race and Year, 2001–13

preliminary 2013 data.
The values in Table 5 underscore the racialized nature of the foreclosure crisis: in every year, foreclosure rates for minority households exceeded those for whites, and as the crisis unfolded, the racial gaps expanded. In the 2005–7 period just preceding the crisis, 1.2 percent of whites, 1.7 percent of Hispanics, and 2.4 percent of blacks had experienced a foreclosure start. At the height of the crisis, blacks were more than twice as likely as whites to enter foreclosure and Hispanics nearly three times as likely, with about one out of every thirteen Hispanic homeowners entering the foreclosure process. Table 5 also shows that household foreclosure rates peaked for white and black owners in 2009 but reached their height for Latino owners in 2011. The most recent data, covering the 2011–13 period, indicate that foreclosure rates have declined modestly but remain at quite high levels. Indeed, foreclosure rates for black owners appear to have rebounded, potentially reflecting the resolution of so-called zombie foreclosures—units with mortgages in default for an extended time that lenders were slow to take action on.
Arguably more striking than the racial differences in the interval rates are the cumulative rates summarized in the lower portion of Table 5. The cumulative numbers underscore the enormity of the crisis as well as the substantial racial variation is foreclosure risk. By 2013, about one in thirteen whites had experienced a foreclosure start, more than one in six black homeowners did, and nearly one in four Hispanic homeowners had gone through a foreclosure.
Conclusion
Using a combination of data from individual foreclosure filings, household records of mortgage stress, and census data on the neighborhood and metropolitan characteristics, this article provides a comprehensive view of variations in the timing and depth of the housing crisis across multiple levels of aggregation. Several key conclusions emerge from this examination. First, the foreclosure crisis that began in 2007 clearly played out quite differently across the country, in terms of both the timing of the housing crash and the depth of the crisis. Foreclosures began to rise much earlier in the Midwest region than in other parts of the country, but the crisis was ultimately more intense in southern and western parts of the country, especially in the Mountain, Pacific, and South Atlantic divisions. Yet even within these regions, there was substantial metropolitan-level variations in both the timing and magnitude of the foreclosure crisis, presumably reflecting variations across markets in the specific ingredients of the crash: prerecession inflation of housing prices; the popularity of risky mortgage vehicles; the prevalence of negative equity; the magnitude of the general economic slowdown; and variations in the legal processes related to the processing of foreclosures and lenders’ strategies for dealing with repossessed homes.
Most apparent in the data examined here, however, are the important roles of race and ethnicity in shaping patterns of the foreclosures during the crisis. Racialized patterns of foreclosure are observed at all levels of aggregation: concentrations of foreclosures were substantially higher in metropolitan areas—as well as their cities and suburbs—with the highest concentration of blacks. Most importantly, in comparison to whites, individual black householders were much more likely to have experienced foreclosure in their own home and, because of their residential location, were also likely to have been exposed to much higher levels of foreclosure at the neighborhood level.
Less appreciated in the discourse on stratified foreclosure processes is the even more extreme burden borne by the Latino population during the foreclosure crisis. Individual Latino householders had the highest cumulative risk of foreclosure during the crisis, and neighborhoods and metropolitan areas where Latino populations were present in significant numbers recorded some of the highest rates of foreclosure. This Latino disadvantage has been apparent in both suburban and central city neighborhoods of metropolitan areas across virtually all regions of the country. Thus, geographic patterns of foreclosure during the crisis, as well as the underlying patterns of stratification that fed these disparities, were substantially more complicated than is indicated by depictions of unique disadvantages for black households.
The racial and ethnic stratification revealed here likely reflects, at least in part, the specific targeting of minority populations and neighborhoods by predatory and subprime lenders, and it has potentially profound implications for broader patterns of racial inequality. We know, for example, that personal experiences of foreclosure typically entail significant loss of wealth-building capacity, and often precipitate residential mobility, family instability, and stress, all with important repercussions for health. And those living in high-foreclosure neighborhoods, regardless of their own housing situation, face the prospect of declining property values, rising crime, and growing disorganization in their neighborhood. Thus, by disproportionately impacting minority individuals and communities of color, the foreclosure crisis has likely affected substantial changes to racial disparities in well-being along a variety of dimensions. The downstream impacts of these effects are likely to unfold slowly, potentially reshaping patterns of racial stratifications for decades.
By delineating these racially stratified patterns, the research presented here highlights the importance of several key areas for policy intervention. First, it is clear that programs aimed at preventing individual foreclosures should be aggressively targeted to and—given evidence that the efficacy of policy interventions vary by race (Collins, Schmeiser, and Urban 2013)—explicitly designed for Latino and black homeowners. In a similar way, efforts to mollify the effects of concentrated foreclosure on local housing values, vacancy rates, crime, and population instability should be focused on neighborhoods of color—places at a vulnerable position in the geography of disadvantage even in the best economic times (Peterson and Krivo 2010; Sampson 2012). Finally, the extreme racial disparities documented here underscore the importance of identifying and redressing the underlying processes of stratification and discrimination—including those demonstrated by predatory lenders—that precipitated the crisis and its uneven impacts.
Footnotes
Notes
Matthew Hall is an assistant professor in the Department of Policy Analysis and Management and a faculty affiliate of the Cornell Population Center at Cornell University. His research centers on racial/ethnic inequality in housing and labor markets, and immigrant incorporation in new destination areas.
Kyle Crowder is a professor in the Department of Sociology and a faculty affiliate of the Center for Studies in Demography and Ecology at the University of Washington. His research focuses on the causes and consequences of residential segregation, neighborhood stratification, and environmental inequality.
Amy Spring is an assistant professor in the Department of Sociology at Georgia State University. Her research is directed at understanding spatial inequality, residential mobility, and population aging.