
Abstract
In recent years, an increasing number of analyses in learning analytics and educational data mining (EDM) have adopted a “discovery with models” approach, where an existing model is used as a key component in a new EDM or analytics analysis. This article presents a theoretical discussion on the emergence of discovery with models, its potential to enhance research on learning and learners, and key lessons learned in how discovery with models can be conducted validly and effectively. We illustrate these issues through discussion of a case study where discovery with models was used to investigate a form of disengaged behavior (i.e., carelessness) in the context of middle school computer-based science inquiry. This behavior was acknowledged as a problem in education as early as the 1920s. With the increasing use of high-stakes testing, the cost of student carelessness can be higher. For instance, within computer-based learning environments, careless errors can result in reduced educational effectiveness, with students continuing to receive material they have already mastered. Despite the importance of this problem, it has received minimal research attention, in part because of difficulties in operationalizing carelessness as a construct. Building from theory on carelessness and a Bayesian framework for knowledge modeling, we use machine-learned detectors to predict carelessness within authentic use of a computer-based learning environment. We then use a discovery with models approach to link these validated carelessness measures to survey data to study the correlations between the prevalence of carelessness and student goal orientation.
Keywords
The recent explosion of student interaction data derived from educational software has resulted in a proliferation of models developed through educational data mining (Baker & Yacef, 2009; Romero & Ventura, 2007, 2010) and learning analytics (Siemens & Long, 2011) techniques. These relatively new fields provide analytic techniques to operationalize a range of learner behaviors, attributes, and states during the learning process. In recent years, these models have proven to be useful for providing formative data to instructors and for the design and implementation of automated learning interventions (cf. Arnold, 2010; Arroyo, Woolf, Cooper, Burleson, & Muldner, 2011; Militello & Heffernan, 2009). Increasingly, the establishment of these models has also become a powerful tool for making scientific discoveries about learning and learners, through studying the contexts in which a learning-related behavior occurs or construct emerges, and through examining its relationships with other constructs. Baker and Yacef (2009) termed the use of an existing EDM or analytics model as a component in a new EDM or analytics analysis “discovery with models” and noted its increasing prevalence in EDM research. Discovery with models has been used to study a range of constructs, including help-seeking strategies (Aleven, Mclaren, Roll, & Koedinger, 2006), off-task behavior (Baker, 2007b; Baker & Gowda, 2010), patterns of usage of online resources (Jeong & Biswas, 2008; Kinnebrew, Biswas, & Sulcer, 2010), and social networks (Dawson, Macfadyen, Lockyer, & Mazzochi-Jones, 2011).
In this article, we illustrate discovery with models methods drawing on examples involving two constructs: gaming the system (Baker, 2007b; Baker, Corbett, & Koedinger, 2004; Baker & Gowda, 2010; Baker, Walonoski, et al., 2008; Muldner, Burleson, Van de Sande, & VanLehn, 2011) and carelessness (cf. Georges, 1929; McClure, 1929). Gaming the system is a student’s behavior aiming at succeeding in an educational task by systematically taking advantage of properties and regularities in the system used to complete that task, rather than by thinking through the material (e.g., by systematically guessing answers to obtain the correct response or repeatedly requesting hints until the software presents the answer; Baker et al., 2004). The second construct, carelessness, refers to incorrect answers given by a student on material that the student should be able to answer correctly (Newman, 1977). Careless errors are possibly the result of answering impulsively or with insufficient effort (cf. Rodríguez-Fornells & Maydeu-Olivares, 2000).
The application of discovery with models involves two main phases. First, a model of a construct is developed using machine learning or knowledge engineering techniques and is then validated, as discussed below. Second, this validated model is applied to data and used as a component in another analysis: for example, for identifying outliers through model predictions; examining which variables best predict the modeled construct; finding relationships between the construct and other variables using correlations, predictions, associations rules, causal relationships, or other methods; or studying the contexts where the construct occurs, including its prevalence across domains, systems, or populations. For example, in Baker, Walonoski, et al. (2008), data from a validated machine-learned model of gaming the system were applied to data from an online learning system and used in a correlational analysis, in combination with survey data, to determine which of a range of motivational and attitudinal variables were associated with gaming.
One essential question to pose prior to a discovery with model analysis is whether the model adopted is valid, both overall and for the specific situation in which it is being used. Ideally, a model should be validated using an approach such as cross validation, where the model is repeatedly trained on one portion of the data and tested on a different portion, with model predictions compared to appropriate external measures, for example, assessments made by humans with acceptably high interrater reliability, such as field observations of student behavior for gaming the system (cf. Baker et al., 2004; Baker, Corbett, Roll, & Koedinger, 2008), or future student performance. Validating using measures external to the model itself increases the confidence that the model is genuinely assessing what it was intended to measure. By testing generalizability to unseen data, one can ensure that a model will be usable in new contexts. When testing a model’s generalizability using an approach such as cross validation, it is important to divide the data into training and test folds at the appropriate level. For example, to ensure that a model can be validly applied to new students, the model should be cross-validated at the student level; for example, each student appears in either the training or the test set at a specific time. Even after validating in this fashion, validity should be reconsidered if the model is used for a substantially different population or context than was used when developing the model.
An alternative approach is to use a simpler knowledge-engineered definition, rationally deriving a function or rule that is then applied to the data. In this case, the model can be inferred to have face validity. However, knowledge-engineered models often produce different results than do machine learning-based models, for example, in the case of gaming the system. Research studying whether student or content is a better predictor of gaming the system identified different results, depending on which model was applied (cf. Baker, 2007a; Gong, Beck, Heffernan, & Forbes-Summers, 2010; Muldner et al., 2011). Of course, knowledge-engineered and machine-learned models do not always disagree; for instance, both types of models have shown similar relationships between gaming and learning or motivation–attitude (Aleven et al., 2006; Baker, Walonoski, et al., 2008; Cocea, Hershkovitz, & Baker, 2009). When differences emerge, it is often because knowledge-engineered models and machine-learned models do not quite predict the same constructs: There is a trade-off between the knowledge-engineered models’ clarity and the machine learning models’ precise prediction, which is based on finding complex and unexpected relationships.
Discovery with models has several advantages as a method. First, it allows for scientific investigation to be made using definitions that can be discussed and inspected, so long as models used in this fashion are published. Second, discovery with models leaves clear data trails that can be reinspected later; for example, Muldner and colleagues (2011) disagreed with Baker’s (2007a) definition of gaming the system and ran their alternate model on the same data set to compare the two models’ predictions in detail. Third, some constructs that are difficult for humans to label by hand (such as latent student knowledge) can be modeled and then studied. Fourth, discovery with models enables analyses to occur at scales or for conditions that are otherwise infeasible. Collecting human labels of constructs such as the ones above can be very time-consuming; but once a model is developed, it can be quickly applied at a wide scale on additional data. For example, Baker and Gowda (2010) analyzed gaming the system and off-task behaviors across an entire year of data from three schools, representing approximately 1 million data points.
The potential of discovery with models methods for studying learning and engagement in computer-based learning can be seen in the context of researching gaming the system (Baker et al., 2004), where a range of research that would be close to intractable to conduct through other methods has been possible for this construct. Models for gaming the system have been developed by multiple groups using both machine learning (Baker, Corbett, Roll, et al., 2008; Baker et al., 2004; Baker, Mitrovic, & Mathews, 2010; Beal, Qu, & Lee, 2008; Walonoski & Heffernan, 2006) and knowledge engineering approaches (Aleven et al., 2006; Beck, 2005; Johns & Woolf, 2006; Muldner et al., 2011). These models have then been used to study how the prevalence of gaming changes during the year (Beck, 2005), what the relationships are between a range of motivational and attitudinal variables and gaming (Baker, Walonoski, et al., 2008; Beal et al., 2008), the mechanisms through which gaming affects learning (Cocea et al., 2009), whether gaming is more determined by the student or the content (Baker, 2007a; Gong et al., 2010; Muldner et al., 2011), and the degree to which students in different settings game the system to different degrees (Baker & Gowda, 2010).
A Case Study on Discovery With Models: Carelessness and Student Motivation
In this article, we demonstrate the potential of discovery with models for contributing to theory on learning through its use in researching carelessness. Despite accounts arguing for its prevalence and importance for almost a century (cf. Georges, 1929; McClure, 1929), carelessness has been lightly researched, in part because of the complexity of operationalizing it. Generally, carelessness is described as giving the wrong answer despite having the needed skills for answering correctly. Better understanding the motivations that lead students to engage in careless behavior may lead to interventions that can reduce carelessness’s frequency or mitigate its negative effects.
Prior research has inferred carelessness based on an individual’s performance on repeated assessments (Clements, 1982; Newman, 1977), observations and interviews (Georges, 1929), and self-report measures, or teachers’ judgments, that treat carelessness as a stable learner characteristic (Hurlock & McDonald, 1934; Maydeu-Olivares & D’Zurilla, 1996; McClure, 1929; Rodríguez-Fornells & Maydeu-Olivares, 2000). In the behavioral assessment of carelessness used in Clements (1982) and Newman (1977), the student is administered the same item multiple times. This method is time-consuming and requires a special assessment outside of the regular learning task. It also may not be representative of carelessness occurring in other contexts: Students might get bored of answering the same item, potentially inducing carelessness that would not have occurred otherwise.
Treating carelessness as a stable individual difference, besides reducing opportunities to understand the role of context in carelessness, is prone to demand effects (participants may perceive that there is an expectation of them to behave in a certain fashion) and self-presentation effects (answers given are influenced by research respondents’ desire to present themselves positively).
However, recent work in data mining and machine learning has made it possible to study carelessness within specific computer-based learning tasks, without modifying the learning task, using automated carelessness detectors (cf. San Pedro, Baker, & Rodrigo, 2011) and discovery with models methods. We utilize this approach to study the relationships between carelessness and students’ motivation, in particular their self-identified learning goals. In particular, we study the correlations between the prevalence of carelessness and student goals, and how student carelessness changed over time.
These issues are studied in the context of students engaging in scientific inquiry in a computer-based learning environment, Science Assistments (www.scienceassistments.org; Sao Pedro, Baker, Gobert, Montalvo, & Nakama, in press). In this context, carelessness is defined as failing to demonstrate a certain inquiry-related skill (specifically, control for variables strategy and hypothesis testing) despite knowing the skill (as measured by a Bayesian model of student knowledge). Carelessness is modeled by a machine-learned decision tree, which is used for discovering relationships between carelessness and student attributes (goals, beliefs, and motivation).
Method
Participants
Participants were 148 eighth grade students, 12 to 14 years old, from a public middle school in suburban Massachusetts. This school is majority White, with about 30% of the students from low-income families and 30% on a free or reduced-price lunch program. The town where the school is located has a median income much higher than the U.S. median, and fewer than 2% of the families in the town are below poverty level (compared to about 10% in the United States). School achievement in science is slightly lower than the state average, with 35% of the students categorized as proficient or higher on the state standardized exam, the MCAS (state average = 40%). Students belonged to one of six class sections and had one of two science teachers. Students had no previous experience using microworlds with Science Assistments.
Materials and Design
Phase Change Microworld
The study was conducted in the context of students’ scientific inquiry within a physical science “microworld,” a virtual laboratory or simulation in which the student can run guided scientific experiments (cf. Sao Pedro et al., in press). In this study, we used a phase change microworld, where students explore how a particular substance, such as water, changes phases from solid to liquid to gas as it is heated. Each task in the microworld requires students to conduct experiments to determine if a particular independent variable (container size, heat level, substance amount, and cover status) affects various outcomes (melting point, boiling point, time to melt, and time to boil). For a given independent variable, students demonstrated proficiency by hypothesizing, collecting data, reasoning with tables and graphs, analyzing data, and communicating their findings. For this microworld, automated detectors of two key scientific inquiry skills—designing a controlled experiment and testing the stated hypothesis—were developed and validated (Sao Pedro et al., in press).
Motivation and Goal Orientation Measures
Students completed the Patterns of Adaptive Learning Scales (PALS) survey (Midgley et al., 2000) in class as baseline data collected at the beginning of the school year, 3 months prior to using the phase change microworld. We analyze data from two scales capturing students’ goal orientation and their beliefs and attitudes toward learning. The first is the Personal Achievement Goal Orientation (PALS1), including learning goal orientation, the goal of developing skill or learning (five items), performance–approach goal orientation, the goal of demonstrating competence (five items), and performance–avoid goal orientation, the goal of avoiding demonstrating incompetence (four items). The second scale measures Academic-Related Perceptions, Beliefs, and Strategies (PALS4), including academic efficacy (five items), avoiding novelty (five items), disruptive behavior (five items), self-presentation of low achievement, the desire to prevent peers from knowing how well the student is performing (seven items), and skepticism about the relevance of school for future success (six items). Each item has a 5-point Likert-type scale, and each of the above eight subscales was calculated using the mean of each student’s answers to the items for that subscale.
Procedure
After receiving a short introduction on using the tutor and on the activity, all students were engaged in the phase change learning activities over two class periods, about 70 minutes in total. During this time, Science Assistments logged all students’ interactions within the learning environment. In the following sections, we show how we used these fine-grained interaction data to construct and validate machine-learned detectors of carelessness, based on existing detectors of systematic data collection behavior (Sao Pedro, Baker, Montalvo, Nakama, & Gobert, 2010; Sao Pedro et al., in press). Next, we analyze carelessness and its manifestation over consecutive activities, with regard to differences between students in motivation and goal orientation.
Carelessness Model Development
The process of building an automated detector of carelessness involves several steps. In the final step, a detector of carelessness is developed using machine learning. To reach this step, we compute training labels for carelessness, developed based on (a) information on student correctness over time (e.g., whether the student succeeds or fails to demonstrate inquiry skills) and (b) information from an automated assessment of student knowledge, called Bayesian knowledge tracing (BKT; see Corbett & Anderson, 1995). These labels of correctness–incorrectness are developed by aggregating students’ actions in Science Assistments into “clips” (discussed next), which are labeled by machine-learned models of inquiry skill(s). These machine-learned models of inquiry skill(s) are derived from hand-coded assessments of correct or incorrect application of science inquiry skills. In the following sections, we discuss each of these steps.
Moving From Fine-Grained Log Files to Coarse-Grained Clips
As students used Science Assistments, each individual’s actions within the microworld were logged at a fine-grained level, with a focus on student actions while experimenting. Each action’s type, current and previous values (where applicable—e.g., an independent variable’s value before and after the action), and time stamp were recorded. In all, 27,257 relevant actions were logged, from 148 students. These data served as the basis for generating representations of student behavior that could be coded by humans in terms of inquiry skill, and then for generating machine-learned models of these inquiry skills.
Student behavior was segmented into a set of 1,503 clips, each of which consisted of all student experimentation between the time the student entered and left the experimentation phase of the microworld. (Students could have multiple clips for a specific activity if they chose to exit and reenter experimentation, either to create new hypotheses or collect more data.)
These clips were formatted as “text replays” (cf. Baker, Corbett, & Wagner, 2006) and labeled by two human coders based on whether a student demonstrated scientific inquiry skill during the scope of that clip (a binary variable). For example, one indication of skill in designing controlled experiments is the use of the control of variables strategy, a method for creating experiments in which the value of a single variable is changed between consecutive steps (Chen & Klahr, 1999). However, other methods that generate unconfounded comparisons were also treated as evidence of skill in designing controlled experiments, for example, modifying three variables and then changing two variables. The coders separately coded a second skill, whether the student tested his or her stated hypothesis (Collins & Stevens, 1991). The coders trained together on a set of clips, discussing their definitions of the construct based on specific examples and past literature (cf. Chen & Klahr, 1999; Collins & Stevens, 1991). They then coded clips separately to establish interrater reliability. The corpus of hand-coded clips contained exactly one randomly selected clip from each problem each student encountered, resulting in 571 clips; the two coders each coded the same subset of clips and attained acceptable interrater reliability (κ = .69 for designing controlled experiments, κ = 1.00 for testing stated hypothesis).
The labels were then used as a basis for developing machine-learned models of these two inquiry skills (Sao Pedro et al., 2010; Sao Pedro et al., in press). The detectors produced were able to distinguish each of these behaviors 85% of the time (i.e., area under the curve [AUC] = 0.85 for each skill). Afterward, a BKT model (Corbett & Anderson, 1995) was created to predict a student’s latent knowledge of these skills. The BKT models were able to predict future correctness on these skills more than 70% of the time (AUC = 0.74, 0.79).
Feature Distillation
Each clip had a set of 73 features extracted for the machine-learning process (cf. Sao Pedro et al., 2010), including the numbers of different types of actions that occurred during the clip (including the number of complete and student-interrupted trials and the number of variable changes made while designing each experiment), the timing of each action (including the average time per variable change and the maximum time the student spent studying the simulation), and the probability that the student knew the skill involved with the relevant problem set before his or her first attempt on action N, P(Ln-1), calculated using BKT (Corbett & Anderson, 1995).
Carelessness Detector
Our operational measure of carelessness is based on a detector of whether an incorrect answer was a result of a lack of knowledge or not, based on features of the student response, previously termed contextual slip (cf. Baker, Corbett, & Aleven, 2008). This model was previously used to estimate carelessness in intelligent tutors for mathematics (Baker & Gowda, 2010; San Pedro et al., 2011). The term slip is used within multiple student modeling approaches, in both the Bayesian modeling literature and the psychometrics literature, to denote when the student makes an error despite knowing the requisite skills for correct performance (Corbett & Anderson, 1995; De La Torre & Douglas, 2004; Junker & Sijtsma, 2001; Morgan, 1979). This definition is essentially the same definition used for carelessness by Newman (1977). Although slipping may not be a perfect indicator of carelessness (as a student could still obtain the correct answer despite being careless, if Maydeu-Olivares’s definition is used rather than Newman’s), there are relatively few explanations for student errors on well-known skills, thereby making slipping a sound indicator of carelessness, if not a complete one. Slips can also imply a poor knowledge model (an issue studied by De La Torre & Douglas, 2004). We circumvent this possibility by studying slipping within a learning system that has a validated knowledge model to accurately predict future correctness 74% of the time (cf. Sao Pedro et al., in press), a level of correctness within the range of the current state of the art (cf. Pardos, Baker, Gowda, & Heffernan, 2011). Within our approach, training labels are computed by taking the probability that the student knew the skill prior to the attempt (computed using BKT) and integrating this probability with data on future correctness on the next two problem solving attempts, using derivatives of Bayes’s theorem (the full mathematics for this process is outlined in Baker, Corbett, & Aleven, 2008). Next, machine learning is used to develop detectors that predict carelessness without using future data.
A detector predicting carelessness was developed using the REPTree (Reduced Error Pruning Tree) algorithm within the Weka extension package (Witten, Frank, & Hall, 2011) in RapidMiner 5.0 (Mierswa, Wurst, Klinkenberg, Scholz, & Euler, 2006). REPTree is a fast algorithm for constructing a decision tree for predicting the value of a numerical variable based on a set of other variables. Sixfold cross validation was conducted at the student level (i.e., the detector is trained on five groups of students and tested on the sixth group) to assess whether the detector would remain accurate for new groups of students. An alternate algorithm, linear regression, was found to have systematic patterns in the model residuals for subsets of the data, which suggested that a nonlinear model might be more effective. Indeed, REPTree outperformed linear regression, achieving a better cross-validated correlation (r = .62 for REPTree, r = .56 for linear regression) and root mean square error (RMSE = .16 for REPTree, RMSE = .18 for linear regression).
The resulting REPTree had a size of 13 (including both interior nodes—decision points—and leaves—linear regression models) and a total depth of 6. Overall, the model used three variables:
P(Ln-1) the probability the student knew the inquiry skill before the action
Cumulated count of conducting two consecutive trials that vary in terms of only one variable
Sum of timing for variable changes while constructing hypotheses
A prediction about carelessness was made for each clip, and then each student’s predicted carelessness was computed by taking the average values over all of that student’s clips. Overall, the mean carelessness probability across the studied clips (N = 1,282) was 0.08 (SD = 0.14), which means that 8% of the errors across clips were detected as careless errors. When averaged across students, the mean carelessness was 0.12 (SD = 0.16), which indicates that, on average, 12% of students’ errors were detected as careless errors. This value represents considerably lower levels of carelessness than were seen in mathematics intelligence tutors or mathematics tests, in which carelessness levels were between 12% and 50% (Baker & Gowda, 2010; Casey, 1979; Clarkson, 1983; Clements, 1980; Newman, 1977; San Pedro et al., 2011). Further exploration is needed to understand this difference.
Findings
The Relationship Between Carelessness and Motivational Measures
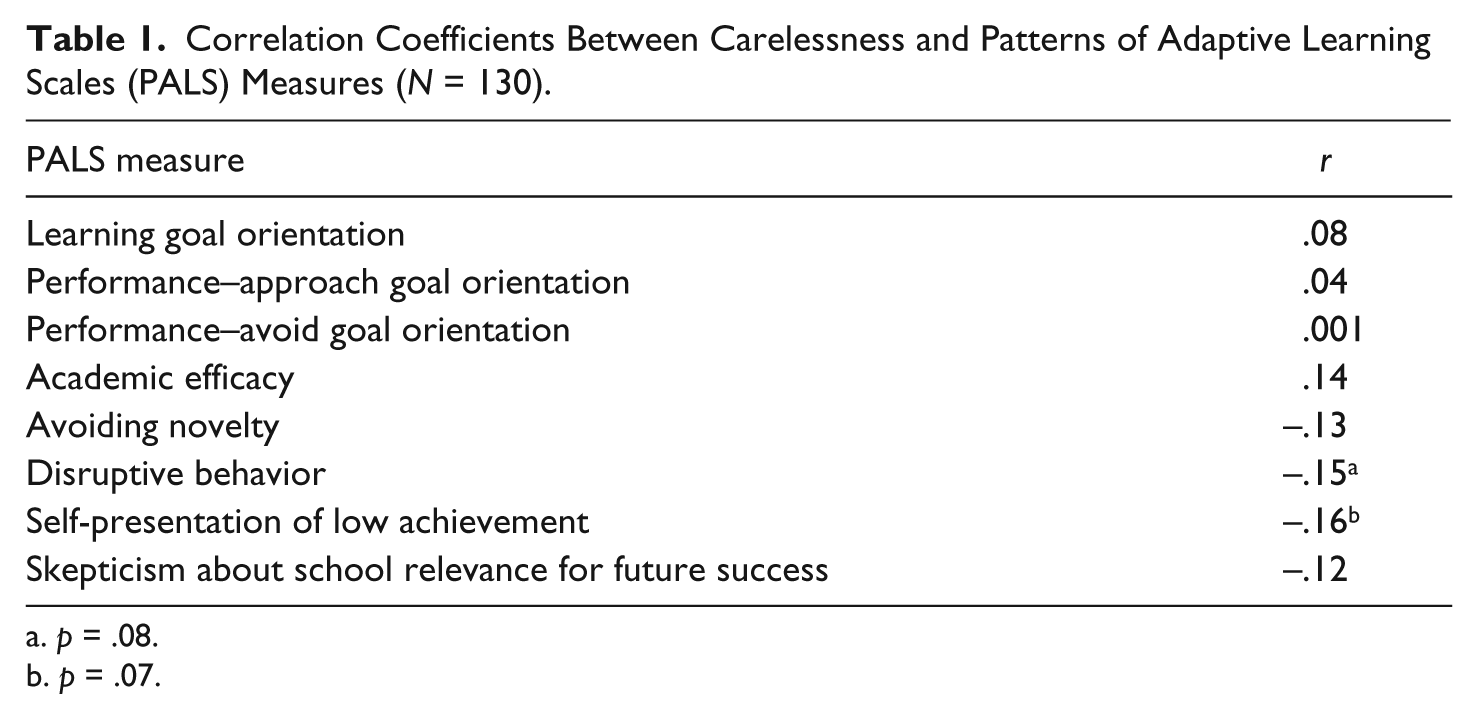
To examine the relationships between careless and motivation, we calculated the correlations between carelessness and the eight subscales of the PALS discussed above; the results are summarized in Table 1. Two of the subscales were marginally significantly correlated with carelessness:
Carelessness was marginally negatively correlated with disruptive behavior, r = –.15, F(1, 128) = 3.02, p = .08; that is, more careless students tended to report less tendency to engage in disruptive behavior.
Carelessness was marginally negatively correlated with self-presentation of low achievement, r = –.16, F(1, 128) = 3.45, p = .07; that is, those with higher scores on carelessness tended to have lower scores on self-presentation of low achievement.
Correlation Coefficients Between Carelessness and Patterns of Adaptive Learning Scales (PALS) Measures (N = 130).
p = .08.
p = .07.
Both disruptive behavior and self-presentation of low achievement have been previously shown to be related to low achievement (Ketter, 2006). Hence, one possible interpretation of the negative correlation between these constructs and carelessness is that these constructs lead to students making incorrect answers resulting from insufficient inquiry skill, instead of carelessness. We present an analysis of this possibility later in the article.
As seen in Table 1, none of the three goal orientations assessed by PALS were statistically significantly correlated with carelessness: r = .08 for learning goals, F(1, 128) = 0.68, p = .36; r = .04 for performance–approach goals, F(1, 128) = 0.20, p = .65; and r = .001 for performance–avoidance goals, F(1, 128) = 0.00, p = .995. However, it may be that a straightforward linear correlation does not capture the relationships between goal orientation and carelessness. Thus, to explore this possibility, in the following section we examine whether there are more complex relationships between these constructs. Such complex relationships might be expressed when subsets of variables are considered (as opposed to single-variable-based calculations).
Relationships Between Carelessness and PALS-Based Clusters
We can investigate the relationship between motivation and carelessness by looking at whether combinations of student motivations can predict carelessness. To analyze this, we conducted analyses to search for clusters of students who were similar in terms of responses on multiple motivational and goal measures and studied whether there were differences in carelessness between these groups. This was done using cluster analysis (Everitt, Landau, Leese, & Stahl, 2011), where data points (in this case students) are assigned to data subsets (called clusters) based on intergroup similarities.
Based on a log-likelihood distance measure and the Bayesian information criterion (BIC; Raftery, 1995), using two clusters provided the optimal explanation of the data (BIC = 705.6). However, using three clusters led to only minor degradation in the BIC value (BIC = 711.9). The set of three clusters led to more interesting separations between aspects of the PALS (using two clusters essentially merged Clusters 2 and 3); therefore, we analyze the three-cluster model, as shown in Table 2.
Center Values (means) of Each Construct for the Clusters.
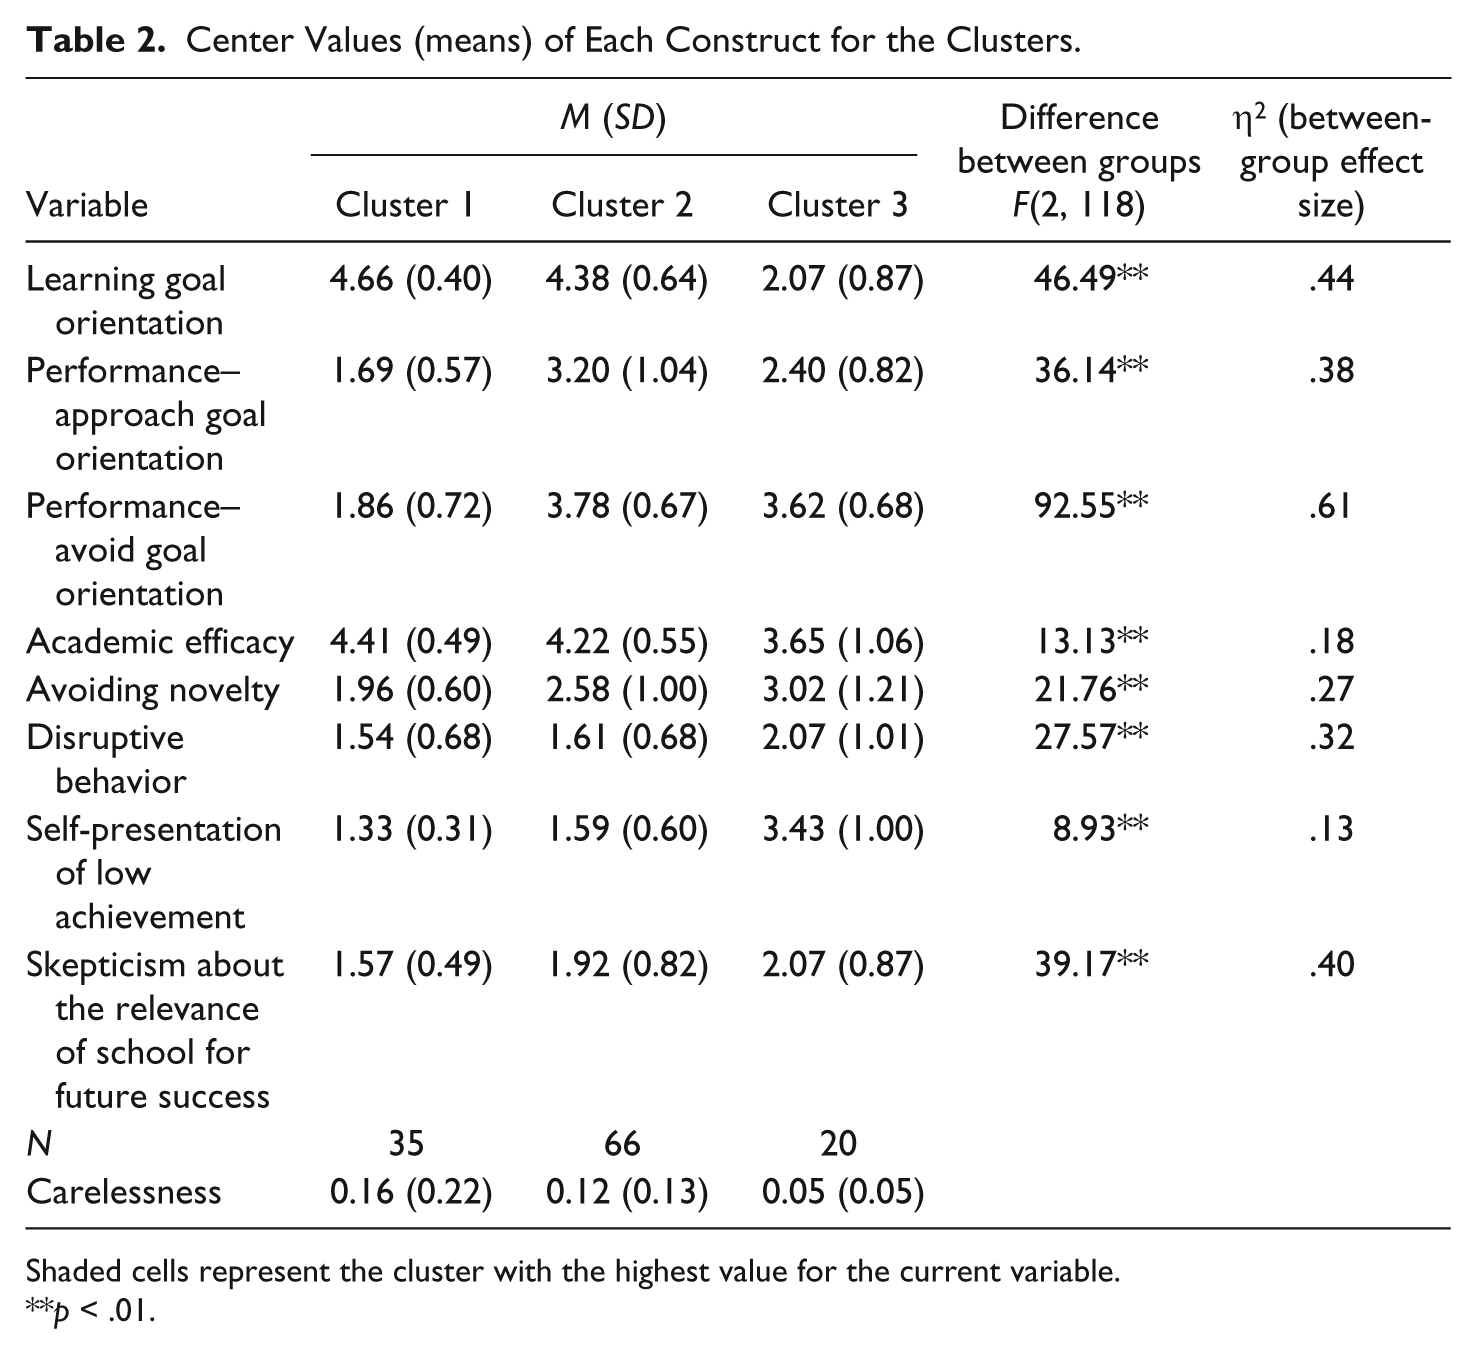
Shaded cells represent the cluster with the highest value for the current variable.
p < .01.
Cluster 1 (n = 35) includes students who have high values for both learning goal orientation and academic efficacy and can be referred to as the learning goal orientation cluster. Cluster 2 (n = 66) includes students with (relatively) high values for both performance–approach and performance–avoid goal orientations; these two types of goal orientation are often possessed by the same students (Bong, 2001; Darnon, Harackiewicz, Butera, Mugny, & Quiamzade, 2007; Elliot & Church, 1997; Middleton & Midgley, 1997; Ross, Shannon, Salisbury-Glennon, & Guarino, 2002). Though Cluster 2 also has high values for learning goals, its values for performance goals are substantially higher than the values of the other clusters. We refer to Cluster 2 as the performance goal orientation cluster. Finally, Cluster 3 (n = 20) includes students with high values for avoiding novelty, disruptive behavior, self-presentation of low achievement, and skepticism about the relevance of school for future success. Cluster 3’s values for performance–avoidance goals are also almost as high as Cluster 2’s values, but the values for learning goals and performance–approach goals are substantially lower. As such, we refer to this cluster as having a lower tendency of either goal orientation.
The proportion of carelessness was marginally significantly different across the three clusters, F(2, 118) = 3.05, p = .051. The mean carelessness in Cluster 3 (5%) was significantly lower than the mean carelessness in Cluster 2 (12%), t(82.3) = 3.45, p < .01, and in Cluster 1 (16%), t(38.9) = 2.8, p < .01. No significant differences were found between Clusters 1 and 2, t(47.1) = 1.0, p = .32. In all cases, the F of Levene’s test of equality of variances was significant at p < .05, hence equal variances were not assumed.
Taken together, our results suggest that students with strong goal orientation toward learning (Cluster 1) or performance (Cluster 2) were on average twice as careless as those demonstrating a lower tendency to either type of goal orientation (Cluster 3)—a surprising finding. One possible interpretation for this finding is that lower carelessness in students without learning or performance goals is a result of these students having lower inquiry skills in general. By our operational definition, students completely lacking in a skill cannot demonstrate carelessness. Similarly, Clements (1982) found that carelessness was associated with better knowledge.
To address this possibility, we can compare students’ inquiry skills over consecutive activities in each condition, measured as the mean values of P(Ln-1)—averaged over consecutive activities for each student—over the different clusters. P(Ln-1) was in fact significantly lower in Cluster 3 (M = 12%, SD = 10%) than in Cluster 1 (M = 24%, SD = 27%), t(47.1) = 2.4, p < .05, or Cluster 2 (M = 22%, SD = 22%), t(71.3) = 2.7, p < .01. Hence, these results imply that the differences in carelessness between clusters may be a result of the observed differences in student inquiry skills. Further evidence for this can be seen in the changes in carelessness over time in the three clusters. The subset of 106 students who completed the first three activities was taken, and carelessness was plotted over time. As shown in Figure 1, carelessness increases considerably over the course of the three activities for Cluster 1 and Cluster 2 but does not increase over time for Cluster 3. Students in Cluster 3 are not developing the degree of inquiry skill that makes careless errors feasible.
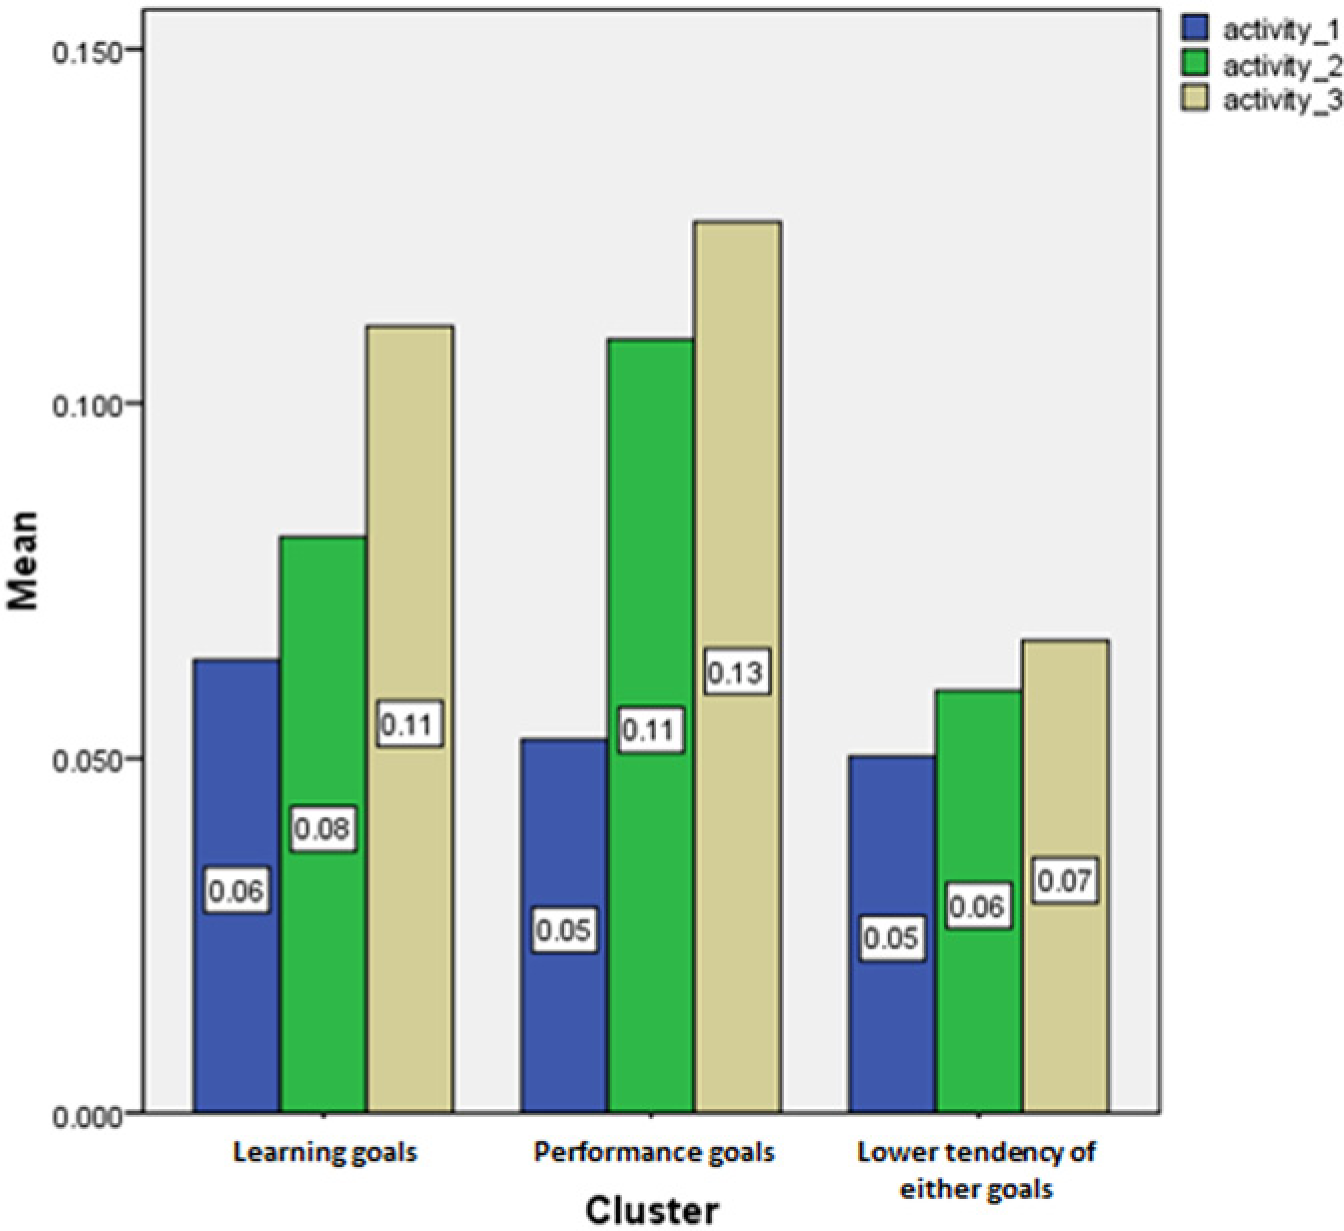
Students’ mean carelessness values over consecutive activities by clusters.
Discussion
In this article, we have presented a case study in discovery with models: studying the motivations associated with carelessness in computer-based science inquiry. In discovery with models, a model is developed and applied to data and then used as a component in other analyses, typically to discover aspects of the construct in the model. In this case, we developed and applied a machine-learned detector of student carelessness to log files and correlated its outputs to motivational questionnaires to discover the relationships between motivational measures and carelessness.
A key benefit of discovery with models is being able to study behavioral constructs in a nondisruptive fashion that is scalable, longitudinal, and fine-grained. In this specific case, using the automated detector allowed us to study carelessness in a more naturalistic and scalable fashion than was possible through interviews and repeated assessment of the same items (cf. Clements, 1982; Newman, 1977) and in a finer-grained fashion than was possible through questionnaire measures of carelessness (Maydeu-Olivares & D’Zurilla, 1996; Rodríguez-Fornells & Maydeu-Olivares, 2000). Carelessness is a difficult construct to label by hand but can be inferred—as it is here—by the pattern of student correctness and the probability that student errors were not a result of a lack of knowledge. In this article, both the carelessness model and the student knowledge model used in analyses were explicitly validated in the data set where they were applied, an essential step for validly using a model in an analysis of this nature. Models can be applied more widely as well, if attention is paid to demonstrating generalizability for the type of transfer being conducted. Our carelessness model is based on the concept and mathematics of BKT, a widely used algorithm for modeling student knowledge, which can be reconstructed in any learning environment in which students repeatedly interact with problems that have correct answers (or behaviors) that can be automatically detected. Hence, it is feasible to extend the work presented here to a variety of topics, domains, and populations.
Our results (the “discovery” in discovery with models) indicate that certain types of students are linked with carelessness but simultaneously suggest a substantial role for student knowledge in carelessness. We find that student learning orientation can be described by three clusters: students characterized by high levels of learning goal orientation and academic efficacy, students characterized by high levels of both performance–approach and performance–avoid goals, and students lower in both types of goals. Students in the clusters characterized by learning or performance goals have (on average) double the probability of carelessness as students in the third cluster. One potential interpretation is that students with higher mastery or performance goals succeed in learning and correspondingly become more confident, as suggested by Clements (1982), and that this confidence leads to carelessness, despite their identified goal orientations. Our results suggest that students in these two clusters achieve higher learning, particularly over time, and that this factor may drive the differences in carelessness. It is also worth noting that academic efficacy, also measured by PALS (Midgley et al., 2000), is higher in these two clusters.
It is surprising that carelessness was substantially less common in our data set than in previous research (cf. Baker & Gowda, 2010; Clements, 1982; San Pedro et al., 2011). It may be that students solving problems in mathematics—the domain used by Baker (Baker & Gowda, 2010; San Pedro et al., 2011) and by Clements (1982)—tend to be more careless than students in science inquiry because of differences between these two domains. By its very nature, scientific inquiry is exploratory and involves active self-direction in searching for knowledge (Anderson, 2002; Haury, 1993; Novak, 1964), potentially reducing carelessness. Alternatively, some aspect of the science microworld or its novelty may have reduced the amount of carelessness exhibited.
The relationships found here between goal orientation and carelessness worth are comparing to those found in previous research on other disengaged behaviors, much of it also conducted with a discovery with models approach. Neither gaming the system nor off-task behaviors were found to be correlated with performance and learning goals (Baker, 2007b; Baker, Walonoski, et al., 2008). Hence, our results provide somewhat of a contrast to these previous results. One difference between carelessness and these behaviors may be the situations in which carelessness occurs: Although gaming often occurs when a student has not yet learned a skill (Baker et al., 2004) and off-task behavior is distributed throughout the learning experience, careless errors occur after a skill has been learned. Similarly, other measures of disengagement appear to have different relationships to goal orientation than seen here for carelessness. Luo, Paris, Hogan, and Luo (2011) found that students with performance–approach goals report paying more attention to work in class and homework than students with neither learning goals nor performance–approach goals (e.g., the students corresponding to the third cluster). These findings are seemingly inconsistent with the findings in this article; one possible explanation is that the different results stem from using a very different measurement approach (self-report questionnaires) or the difference in domain. Overall, these results demonstrate that carelessness and learning orientation have surprising relationships, which merit further investigation. Understanding the factors that lead successful students to become careless may support the design of interventions to assist these students in maintaining high performance even when they have learned the material.
More broadly, this article demonstrates the potential of discovery with models analyses for conducting analyses of learning behaviors that are difficult to study with more traditional methods. In the current article, the learning behavior examined is carelessness, the model used to study it is a machine-learned decision tree, and our “discovery” is evidence on the relationships between a student’s carelessness and his or her goals, beliefs, and attitudes. By using discovery with models in combination with other methods, we may be able to shed light on questions that have thus far been intractable. As such, we view discovery with models as a key learning analytics method for 21st-century learning science.
Footnotes
Acknowledgements
We would like to thank Matthew Bachmann for his help in data coding.
Declaration of Conflicting Interests
The author(s) declared no potential conflicts of interest with respect to the research, authorship, and/or publication of this article.
Funding
The author(s) disclosed receipt of the following financial support for the research, authorship, and/or publication of this article: This research was funded by National Science Foundation Grant DRL-1008649, “Empirical Research: Emerging Research: Using Automated Detectors to Examine the Relationships Between Learner Attributes and Behaviors During Inquiry in Science Microworlds,” awarded to Janice Gobert and Ryan Baker. Any opinions are those of the authors and do not necessarily reflect those of the funding agency.
Author Biographies
![]() ). Until December 2007, she served as North American editor for the International Journal of Science Education. She has been principal investigator on many projects that address technology-based science learning and assessment.
). Until December 2007, she served as North American editor for the International Journal of Science Education. She has been principal investigator on many projects that address technology-based science learning and assessment.