
Abstract
The current study introduces a method to assess hate crime classification error in a state Incident-Based Reporting System. The study identifies and quantifies the “statistical accuracy” of aggregate hate crime data and provides insight from frontline officers about thought processes involved with classifying bias offenses. Random samples of records from two city and two county agencies provided data for the study. A systematic review of official case narratives determined hate crime classification error using state and federal definitions. A focus group sought to inquire about officers’ handling of hate crimes. Undercounting of hate crimes in official data was evident. When error rates were extrapolated, National Incident-Based Reporting System Group A hate crimes were undercounted by 67%. Officers’ responses validated complications involved with classifying hate crimes, particularly, incidents motivated “in part” by bias. Classification errors in reporting hate crimes have an impact on the statistical accuracy of official hate crime statistics. Officers’ offense descriptions provided greater awareness to issues with accurately interpreting and classifying hate crimes. The results yield useful information for officer training, understanding the true magnitude of these crimes, and a precursor for adjusting crime statistics to better estimate the “true” number of hate crimes in the population.
Introduction
Crimes involving bias have been of particular interest to criminologists over the 23 years since the passage of the Hate Crime Statistics Act (Nolan & Akiyama, 1999). However, identifying hate crimes pose a distinct challenge to police because, by their very nature, they involve a unique set of issues that converge when seeking to properly classify them (Boyd, Berk, & Hamner, 1996; Martin, 1995; McDevitt et al., 2003; Nolan & Akiyama, 1999). Most notably, the offenders’ intention and/or motivation for committing a crime must be taken into account by officers when determining whether a particular incident constitutes a hate crime. For this reason and others, it is often speculated that many hate crimes are not accurately recorded in official records. Both the Uniform Crime Reporting (UCR) and modernized National Incident-Based Reporting System (NIBRS) are national data collection programs critical to understanding crime; however, there are known limitations and errors such as underreporting and misclassification (Gove, Hughes, & Geerken, 1985; Levitt, 1998; Nolan, Haas, & Napier, 2011). Although it is unlikely that all errors will be eliminated from the data, it is important to understand its structure and be able to measure it.
The purpose of the current study is to examine the accuracy of NIBRS hate crime classifications. Classification error occurs in the process of naming the crime type. These errors can occur for many reasons including the inaccurate interpretation of definitions, reliance on criminal rather than statistical definitions, record automation issues, and even purposive actions in an attempt to downgrade crime.
To focus a study on the accuracy of hate crime reporting is noteworthy because the term itself, as well as the comprehensive data collection efforts, are relatively recent. Assessing classification error is particularly important since it can ultimately affect the accuracy of reported crime statistics (Nolan et al., 2011). While there are some studies that have examined hate crime classification, their scope and focus vary (see Boyd et al., 1996; Martin, 1995, 1999; McDevitt et al., 2003). None of the existing studies have considered the impact of classification errors on statistical accuracy by measuring over- and undercounts of hate crimes in all crime categories.
Utilizing a methodology previously used by the authors (Nolan et al., 2011; Nolan, Haas, Lester, Kirby, & Jira, 2006), this study assesses the level of classification error in aggregate NIBRS hate crime data from three law enforcement agencies in a large and diverse portion of a southeastern state. The researchers randomly selected cases, systematically reviewed written narratives, and classified cases according to state and Federal Bureau of Investigation (FBI) hate crime definitions. Though this approach has been applied to examine classification error and statistical accuracy across general crime types, no study to date has thoroughly focused on identifying sources of error (i.e., over- and undercounts) contained in a crime category as widely believed to be underreported as hate crimes (Nolan et al., 2011).
Since passage of the Hate Crime Statistics Act, 1990, bias-motivated crimes have been reported to the FBI’s UCR Program using the Quarterly Hate Crime Report or the hate crime data element of NIBRS (FBI, 1999). Although the hate crime reporting trend published by the FBI appears relatively stable over time, it can be easily shown that that the data do not accurately depict the volume of the problem (Balboni & McDevitt, 2001; McDevitt et al., 2003; Shively & Mulford, 2007). While victim and advocacy-group data provide important insight, the UCR hate crime data are generally considered one of the best sources of national hate crime data (McDevitt et al., 2000).
Issues of Definition and Interpretation
Hate crimes are traditional crimes that involve some element of bias (FBI, 1999). The FBI defines a hate crime as a “criminal offense committed against a person or property which is motivated, in whole or in part, by the offender’s bias against race, religion, disability, ethnic/national origin group, or sexual orientation group” (FBI, 1999, p. 2). In addition to the federal definition, all but one state (Wyoming) and various localities have their own definitions and statutes regarding hate crime (Shively & Mulford, 2007). Variations in state and local hate crime statutes often differ in the groups that are protected, offenses involved, and whether the bias-motivated offense includes penalty enhancements. For example, hate crime laws in the state where this study took place do not include disability or sexual orientation as protected classes, but they do include crimes committed based on political affiliation. Since political affiliation bias crime is included in the state’s legal definition, those crimes are also being captured in state’s hate crime statistics. However, when data are submitted to the FBI, hate crimes involving political affiliation are removed. The lack of a standard definition can complicate the classification of hate crimes at all levels of reporting. In addition to definitional issues, various typologies exist for interpreting whether hate crimes occurred. The following section examines these types of issues that law enforcement officers often struggle with.
New words and phrases emerge all the time and they appear to develop over time in a two-stage process of “intension” and “extension” (Dewey, 1910/1997). The first stage is intension, marking of by definition what the term is supposed to mean. After defining the term, it is applied via “extension” to real-life events that help make the distinction between what is and what is not meant by the word. The process continues until a shared understanding of the term is achieved.
This process of intension and extension relating to hate crime reporting by the police was examined by Nolan, McDevitt, Cronin, and Farrell in 2004. In this study, it was uncovered that the FBI’s definition of hate crime, particularly the phrase “motivated in whole or in part by bias” created ambiguity and often frustrated officers who wanted to report hate crimes accurately. To deal with these ambiguities, standard practices are often created and develop by habit to help apply definitions (intension) to real-life scenarios (extension). In a study conducted by McDevitt et al. (2000), crimes “motivated in part by bias” appeared in two as two categories of events: (a) Response/ Retaliation events and (b) Target-Selection events.
Response/Retaliation events are defined as offenses that are first triggered by something other than bias; then, at some point, bias exacerbates the incident and fuels a crime. For example, if Motorist A and Motorist B become engaged in a dispute over a parking space, which develops into an assault, one could argue that the fight was the result of an argument and not bias. However, if the noncriminal argument escalates into a fight because of the real or perceived differences between the drivers, such as race, ethnicity, sexual orientation, as examples, this event can now be classified as a hate crime. The question for police officers would be this: Would the incident (the fight not the initial argument) have occurred if the two motorists were from the same group, such as White males. If the answer is “no,” that it would not have occurred, then one can say that the incident is motivated “in part” by bias.
The second type of ambiguous hate crime comes from Target-Selection events, which involve perpetrators who are motivated to commit some act—criminal or non-criminal—which itself does not involve bias. For example, a burglar may select a middle-class neighborhood to target during the daytime because he or she thinks residents are more likely to be at work and not at home. The decision to target this neighborhood is derived from a rational thought process and careful consideration. The offender’s selection of this neighborhood is not influenced by any bias against race, religion, sexual orientation, and so on. However, there are other criminal offenses where the selection of a target does include bias against the victim group. For example, a criminal offender may be motivated to commit robbery because of a drug habit or because of mounting bills. If this person selects as his or her target members of certain groups, such as gay men coming out of a bar or members of a Jewish group leaving a synagogue because of bias against the group, this act could also be classified as a hate crime.
The typology of hate crime reports including Response/Retaliation events, Target-Selection events, and protected groups are depicted in Figure 1 as overlapping circles representing sets of crime types that are recorded in a police database. Set A includes all police reports that fit the FBI definition of hate crime or the definition provided by the State criminal code. Set B includes all police reports that involve Response/Retaliation events, and Set C includes all reports of Target-Selection events. Notice that some, but not all, of the Response/Retaliation events (Set B) involve hate crimes (Set A). Also, notice that some of the Target Selection events (Set C) are also hate crimes (Set A). Our work in uncovering hate crimes in the police department records division involved locating reports that would fit into Regions 2, 3, and 4 of Figure 1. Police reports that fit into Region 2 are hate crimes that were motivated by some other event but escalated into a crime because of bias. Reports that fit into Region 3 are those crimes that are motivated in whole by bias. Region 4 contains police reports that described the targeting of a victim because of bias but not necessarily as the primary motivation for the crime. Examples of criminal offenses that fit into the five regions are also described in Figure 1.
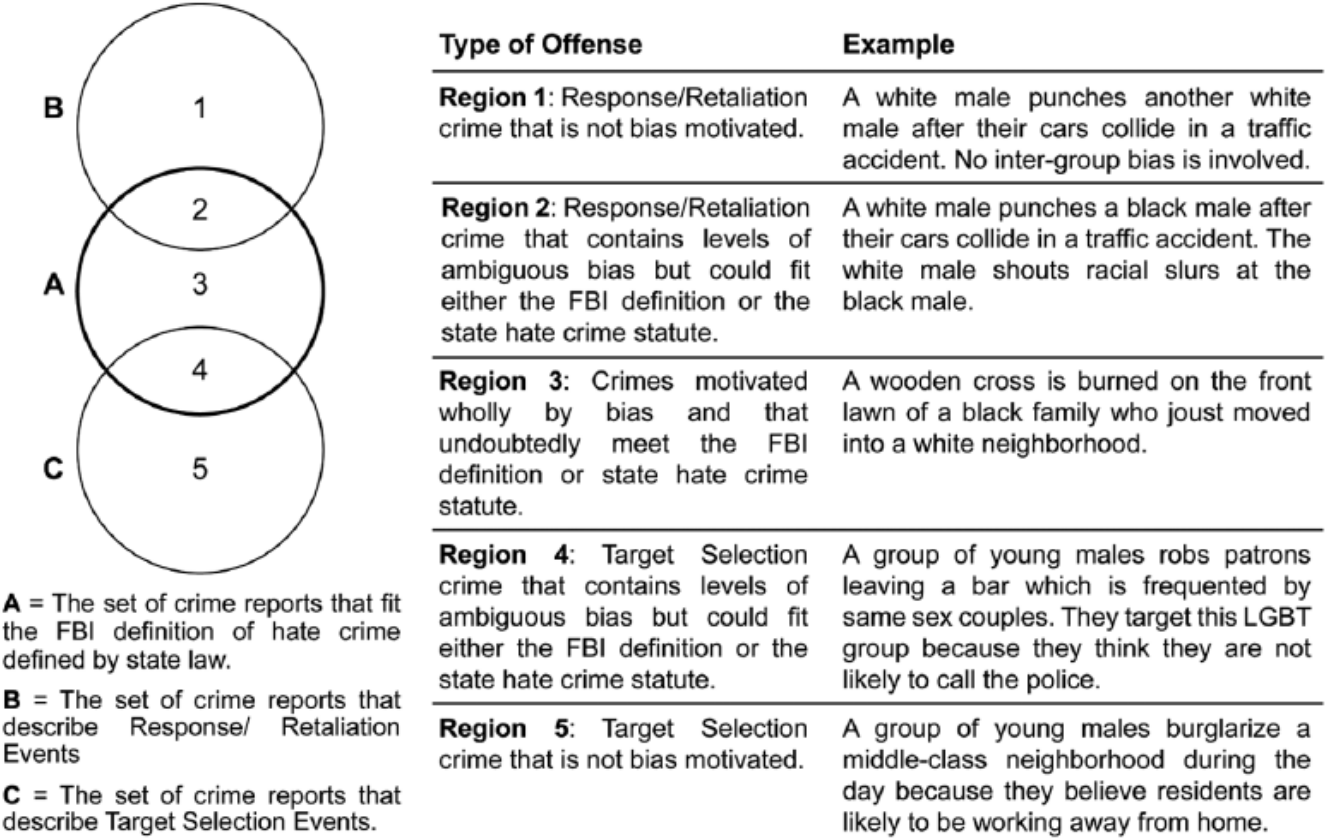
Typology of hate crime reports and examples of police reports relating to bias crime reporting.
Sources of Error in Hate Crime Reporting
In order for any type of crime to be officially recorded, a multistep process must take place. The process of hate crime reporting includes seven key decision points as described by McDevitt et al. (2000). First, the victim understands that a crime has been committed. Second, the victim must recognize a real or perceived notion that bias may have been a motive in committing the crime. Third, the victim (or another party) notifies the police. Fourth, the victim or other party communicates the motivation of the crime to the police. Fifth, the police recognize element of bias. Sixth, the element of bias is documented by police and the suspect is charged with a bias offense (as appropriate). Finally, the bias offense is recorded and submitted to a central data collection agency which is then submitted to the FBI’s Hate Crime Reporting Unit. Each phase of the reporting process is susceptible to error (McDevitt et al., 2000; Nolan et al., 2011).
Issues affecting hate crime reporting accuracy can be broadly categorized into individual/victim inhibitors and police dis/incentives. Victim or individual barriers are related to “a person’s willingness and likelihood of contacting law enforcement” (McDevitt et al., 2000). Approximately 56% of hate crime victims did not notify the police according to the 2005 National Crime Victimization Survey, and similarly, 55% did not report according to the 2011 report (Harlow, 2005; Langton & Planty, 2011). When asked why the victims did not report the crime to the police, the top two responses from both studies were that “the incident was handled in another way” and “it was not important enough” (Harlow, 2005; Langton & Planty, 2011). McDevitt et al. (2000) also cite cultural and language barriers as concerns that may prevent victims from realizing and/or communicating criminal offenses. Furthermore, members from minority groups have a history of mistrust with law enforcement which may impede reporting crimes. Victims may not feel comfortable stating their suspicion of bias to the police out of fear of not being believed, retaliation by the offender, secondary victimization, the reaction due to certain characteristics being exposed, or being deported (McDevitt et al., 2000). While it is initially necessary for the victim to recognize that a bias crime has been committed, the most important factor for crime reporting is the relationship between the victim and the police (McDevitt et al., 2000).
Once an alleged hate crime is reported to the police, it is the responsibility of law enforcement to investigate and verify the claim. Prior studies have shed light on social forces that influence hate crime reporting by law enforcement agencies and police officers. To an individual officer, these forces can come externally (e.g., organizational climate) and internally (e.g., personal prejudices). In the same manner, an entire agency’s handling of hate crime reporting is also shaped by forces from both inside and outside the organization. These departmental (organizational) and personal factors that interfere with accurately identifying or recording bias crimes are referred to as police dis/incentives (McDevitt et al., 2000).
The culture and norms of a police department are perhaps the strongest influences on individual officer behavior. They mold the actions of everyone within the organization, from patrol officers to detectives to upper-level management. Organizational norms set a standard for how members of a police force are supposed to act on the job (Bell, 2002). Furthermore, organizational norms guide police on how to treat victims, offenders, and witnesses; prioritize cases; and decide which charges to seek in a case (Ericson, 1981). Organizational factors can sway hate crime reporting in either direction. Some police departments provide an environment conducive for accurate hate crime reporting: they commit resources to the cause, establish special bias crime units, and urge officers to treat possible hate crime cases with care and precision. Other agencies, on the contrary, hold a more negative view of hate crime reporting. These organizations believe that interpreting and applying hate crime laws creates an additional burden for police on the scene, or they erroneously label hate crime policies as unjust, believing that they give special protection only to minorities (McDevitt et al., 2003).
Researchers Nolan and Akiyama (1999) empirically assessed the organizational climate for hate crime reporting using focus groups interviews of police departments across the country. In their research, they identified a list of forces—categorized as “encouragers” and “discouragers”—that affect hate crime reporting on both the agency level and the individual level. As the names suggest, encouragers support participation in hate crime reporting while discouragers dissuade it. Their analysis concluded that the list of 60 variables could be summarized by five agency-level and five individual-level constructs that affect hate crime reporting. Using Nolan and Akiyama’s model as a base combined with additional variables, McDevitt et al. (2000) surveyed law enforcement officers and found that many of the encouraging and discouraging forces were highly correlated. The variables could be summarized by four common factors according to encouraging and discouraging forces at the agency and individual levels. Encouraging forces included (a) overt departmental influences, which the department makes a concerted effort to recognize hate crimes as a unique problem, and (b) right thing to do, which relates to the officer’s personal belief that reporting hate crimes is a political and moral duty. Factors that discourage hate crime reporting included (a) exogenous factors such as extra work involved, unwanted media attention, or fear of further violence and (b) an officer’s intrinsic definition including personal prejudices and the belief that hate crimes are not serious or different from non-bias crimes.
It is evident that leadership plays a crucial role in establishing the norms and priorities of a police department. The same perspectives held by police administrators regarding hate crime reporting trickles down throughout the entire agency. In fact, with regard to hate crime reporting, a majority of surveyed officers indicated that they would support departmental policy and that “maintaining a policy could positively affect an officer’s decision whether or not to investigate bias” (McDevitt et al., 2000). Despite officer compliance, front line officers are confronted with issues of personal influences, employing discretion, and interpreting laws and definitions which can also affect hate crime reporting accuracy.
Previous Research on Classification Error
Though empirical research focusing on ambiguity and classification error has been evolving, it is relatively sparse in terms of affecting statistical accuracy. Research conducted by Boyd et al. (1996) and Martin (1995, 1999) were the first to conclude that challenges with interpretation, classification, and definitional ambiguities may consequently result in misleading statistical reports. Boyd et al. (1996) studied hate crime investigation and classification decision-making practices of two divisions of a large police department. The authors attributed differences in categorization practices to issues with reliability and validity of hate crime data. Both of Martin’s studies sought to characterize hate crime cases and the verification process by reviewing hate crime incident reports from one jurisdiction (Martin, 1995, 1999). Both studies cited that difficulties in determining motivation, the role of bias, and classification of incidents impact statistical reporting. Though these studies suggest the presence of classification error, they do not go on to quantify it. These studies provide reasonable support to the presence of classification error in hate crime data, however, they do not quantifying it.
The process and quality of hate crime reporting were investigated by McDevitt et al. (2003) in a study of eight jurisdictions across the United States funded by the Bureau of Justice Statistics. This was the only study to date that considered quantifying errors in hate crime reporting. While the process review involved inspecting practices and examining why information may be overlooked or misclassified, data quality was examined by reviewing incident reports while looking for reporting errors. The researchers sought to quantify overcounts—bias incidents that did not fit the FBI definition—and undercounts—the failure to recognize a reported crime as a bias crime. Assaults were singled out because they are among the most common crime to involve bias, according to national statistics, and more likely to have completed, sufficient narratives. The number of assault incidents reviewed varied by jurisdiction; random samples of reports were reviewed for jurisdictions with ample records while the universe of records was reviewed for smaller jurisdictions. In all but one jurisdiction, full populations of verified bias crimes were reviewed. Overcounted bias incidents were few. Since full populations were reviewed in all but one jurisdiction, extrapolation was not appropriate, and the resulting numbers of potential bias crime overcounts signify the total. There was an issue of undercounting potential bias crimes realized in the review of assault cases. Although the percentage of undercounts in assault records was relatively small, ranging from 0% to 2% for potentially bias and 0.5% to 5% for ambiguously bias, extrapolating the results to the full population of assault records could yield a significant number of bias crime that are not included in official statistics.
McDevitt and colleagues’ study was one of the first to quantify classification error in bias crime reporting; however, results are limited to one crime type. While undercounts of bias crimes are specific to assaults, overcounts encompass all crime types. As a result, the statistical accuracy of the data, which accounts for over- and undercounting hate crimes, is not clear. The current study sought to comprehensively quantify bias crime classification error across all crime types and its impact on statistical accuracy. The study used systematic, established methods that have been used to quantify classification errors and gauge statistical accuracy among general crime categories. Challenges involving identifying and classifying hate crimes were also investigated using a focus group consisting of law enforcement. It is anticipated that this study will not only yield an estimate of the error contained in officially reported hate crime statistics, but shed light on the inherent difficulties officers face in interpreting these incidents.
Method
Statewide Incident-Based Reporting System (IBRS) data files were used to examine the annual number of hate crimes reported and incident location (cities/counties). Hate crimes are identified in the IBRS data by a designated variable used to indicate that an offender’s actions were motivated, in whole or in part, by bias against a specific group. Incidents involving any offense type can be flagged as being motivated by bias. The specific types of crimes reported as having hate or bias factors were noted to assist with data partitioning.
Classification error among hate crimes was assessed using methods previously developed for evaluating classification error and statistical accuracy across general crime types (see Nolan et al., 2006; Nolan et al., 2011). The methodology consisted of three distinct stages: presampling, randomly selecting and reviewing records, and calculating statistical accuracy. For the purposes of this study, the FBI and state hate crime definitions were considered during case review.
Presampling
The presampling stage required partitioning records and calculating appropriate sample sizes. Of the 92,939 incidents reported to law enforcement in 2008 in the study area, only 60 were identified as involving a hate crime. Because of the relatively low volume, but widespread geographical distribution of reported hate crimes, the study focused on reviewing records from four law enforcement agencies within the state. The agencies selected included two larger municipal police departments and the sheriff’s departments for the counties in which the cities are located. These agencies provided an ample records population to conduct the study and represent two of the more heterogeneous communities in state.
The records from the selected agencies (27,982 incidents) were partitioned into four distinct categories (or stratum) using SPSS. The first category consisted of all records that included the hate crime indicator (i.e., Hate Crime). Incidents that appeared to be the most likely Group A offenses to have hate or bias identified as a motivating factor included assaults, robberies, burglary/breaking and entering, and destruction of property/vandalism. These offenses were grouped separately from all other Group A crimes reported to NIBRS (i.e., Group A). The remaining Group A offenses formed the third category (i.e., Other Group A). Last, Group B offenses (which are only recorded when an arrest is made and thus do not include the hate crime indicator) comprised the final group of offenses (i.e., Group B). Variables were created in SPSS to separate the Hate Crime, Group A, and Other Group A offenses while a separate file of Group B arrest reports was created.
In addition to the records included in the IBRS data, the research team felt it was important to obtain and review a sample of cases that law enforcement considered as general information incidents (i.e., reports filed by the police for noncriminal matters) and unfounded reports (i.e., reported crimes that were subsequently found to be false) to determine whether some hate crimes were being missed in reporting. Since these records are not included in IBRS data files, however, it was not possible to presample cases in this category.
Prior to randomly selecting the IBRS records for review, the sample size for each offense stratum i was determined based on Equation 1, where k is the z score associated with the desired level of confidence, Ni is the stratum population, Pi is the estimated proportion of hate crimes in the stratum population, Qi = (1 − Pi), and E is the margin of error.
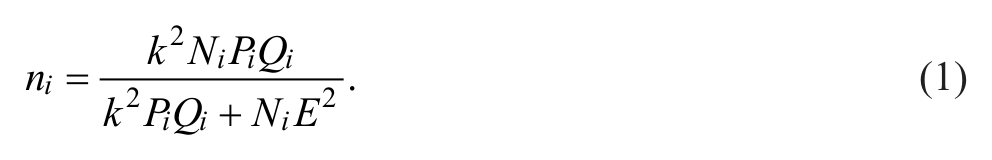
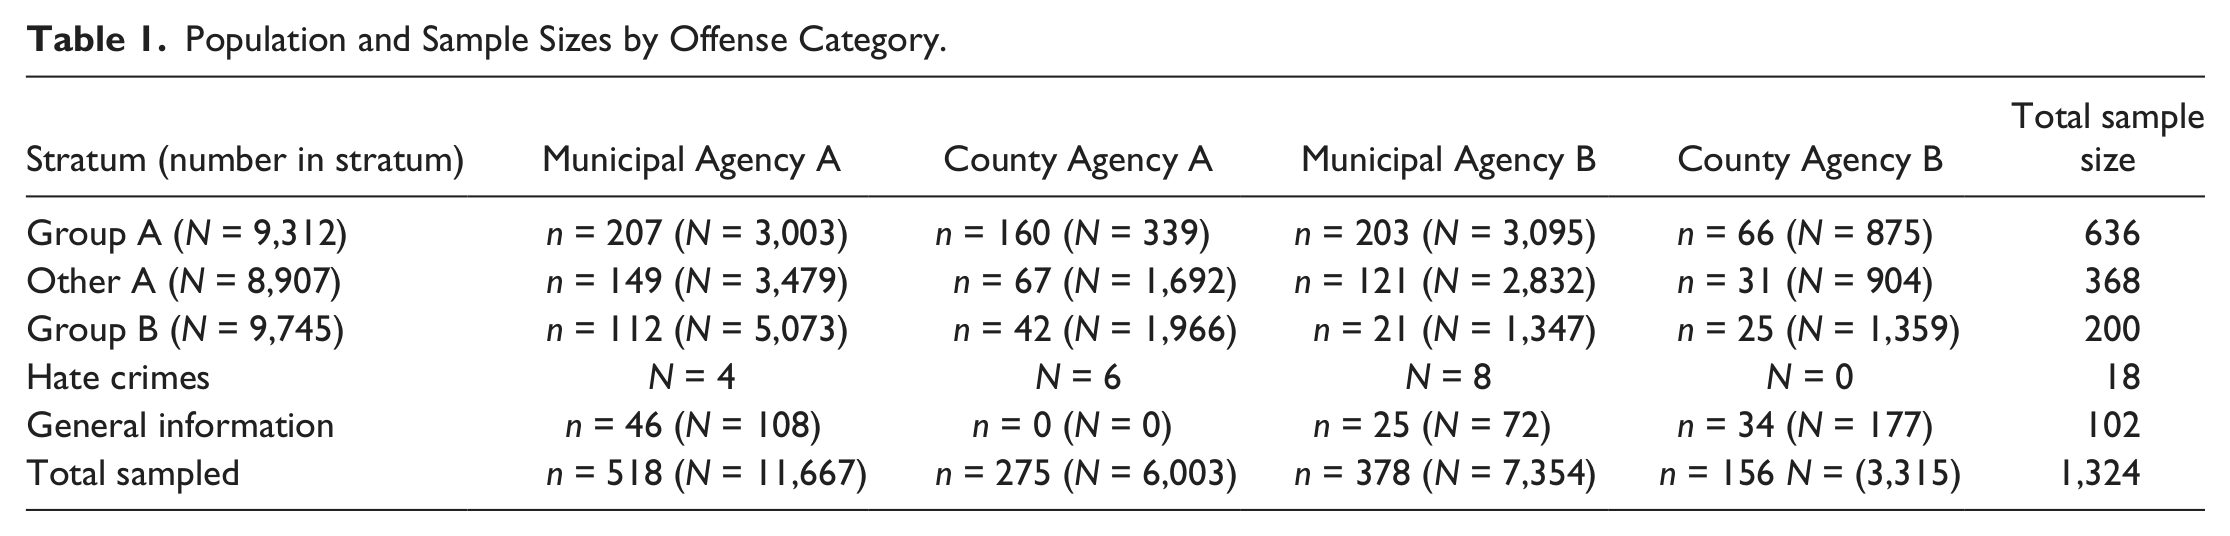
For this study, a 95% confidence level (z score of 1.96) and 3% margin of error were chosen. The proportions Pi were estimated based on prior experience with the reporting of hate crimes: PGroupA was 0.2, POtherGroupA was 0.1, and PGroupB was 0.05. The corresponding Ni and ni breakdown for each selected agency along with each offense category are shown in Table 1.
Population and Sample Sizes by Offense Category.
The research team reviewed the total population of Hate Crime records from the selected agencies since they were the focus of the study and low in volume. In addition, the sample of general incidents records was determined during the review process by each respective agency. A total of 102 general information records were randomly selected by the agencies for review. The researchers also inquired about unfounded case files; however, all agencies indicated that no such cases were available.
Sample Selection and Reviewing Records
From the partitioned data files, an automated random sample of records was produced for each agency based on the determined sample size (Table 1). A list of the selected cases identified by incident or arrest number was compiled and forwarded to each agency’s records division supervisor where hardcopies of the identified cases were manually pulled for the research team to review. Agencies were also asked to randomly pull a sample of cases from their general incident/information files to be assessed. The requested records were to be read and assessed by a team of reviewers. 1
A team of eight reviewers spent 3 days reading and assessing files on site and another day reviewing records at their offices. Records were categorized into the following strata: Group A offenses (A), Group A Hate Crimes (AHC), Other Group A offenses (OA), Other Group A Hate Crimes (OAHC), Group B arrests (B), General Incidents (GI), General Incidents Hate Incidents (GIHI), and Unfounded (U). To ensure a high level of reliability between reviewers, a systematic procedure for the records assessment was established by randomly selecting 10% of the incident files from each crime category to receive a second review from a different team member. 2 All 18 hate crime cases were reviewed by the full research team. The records assessment conducted by the research team resulted in the number of over- and undercounts of crimes from classification error.
Calculating Statistical Accuracy
After the sampled records were reviewed and classified, the error rates in the sample were extended to estimate the number of classification errors in the population. The number of classification errors in the population of records Ci|j were estimated according to Equation 2, where i represents the original reported crime category, j represents the recommended crime category, ci|j is the number of classification errors observed in the sample for crimes originally reported as i but recommended as j, ni is the number of crimes originally reported in the stratum sample, and Ni is the number of crimes originally reported in the stratum population.
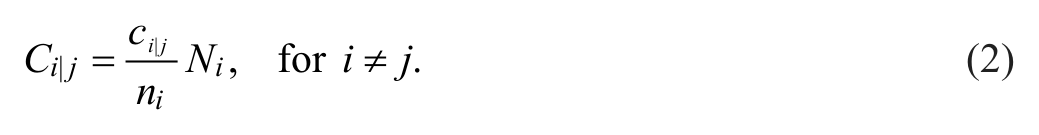
The classification errors are used to determine the number of over- and undercounts for each crime stratum. Overcounts are incidents that were originally reported as one crime type but categorized into a different crime stratum by the reviewers. Undercounts are incidents that should have been reported as a particular crime type but were originally reported as something different. The population overcounts for a particular stratum s are tallied by adding all Ci|j while holding i constant (denoted Ox where i = x) and undercounts are the sum of all Ci|j while holding j constant (denoted Ux where i = x); the same process can be applied to determine the over- and undercounts in the sample using ci|j.
Statistical accuracy refers to the “measuring of both over counting and under counting of a particular crime category” (Nolan et al., 2011). To calculate statistical accuracy, an estimate of the true number of crimes in the population of a particular crime category is compared with the total reported. Establishing the true number of crimes requires estimates of the number of over- and undercounts in the population for each crime stratum. The point estimate of true crimes for the stratum Tx was estimated by subtracting the number of overcounts Ox from the total number originally reported Nx then adding the number of undercounts Ux according to Equation 3, where s is the stratum of interest.

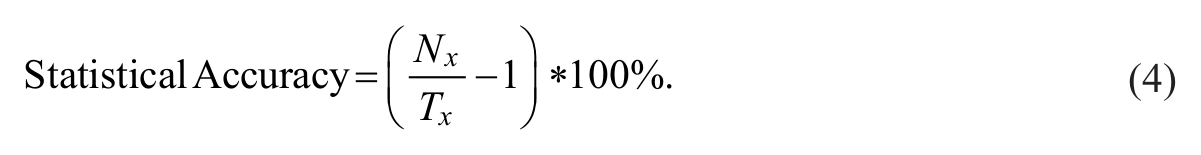
Using the original number of reported Nx and estimated true total Tx of crimes, statistical accuracy for each crime stratum x is calculated according to Equation 4 and is represented as a percentage. When the statistical accuracy percentage is negative, it represents that the crime category was undercounted; likewise, a positive percentage represents that the crime category was overcounted.
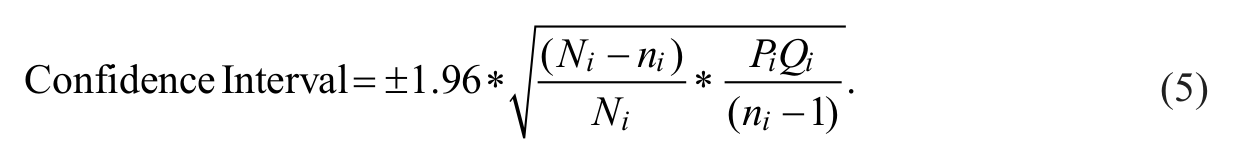
A 95% confidence interval for each point estimate Tx can be calculated using Equation 5, where i is the crime stratum (i = x), Ni is the stratum population size, ni is the stratum sample size, Pi is the estimated proportion of hate crimes in the stratum population, and Qi = (1 − Pi). The confidence intervals were used to determine the significance of the error estimates.
After all records were reviewed and classified by the research team, a focus group with law enforcement officers was conducted to qualitatively assess the thought process involved with classifying hate crimes. The participants were asked general questions regarding hate crime policing and discussed some of the case scenarios reviewed by the research team.
Results
The results of this study focused on the statistical accuracy of bias-related incidents reported by the selected law enforcement agencies in the state. The findings centered on the degree to which offsetting overcounts and undercounts found in the classification of hate crimes impact crime totals, while responses from law enforcement focus groups provided insight into the thought processes involved with classifying these crimes.
Assessing Overcounts and Undercounts
The results of the records assessment and number of overcounts and undercounts found in each crime category are illustrated in a matrix format found in Table 2. Each row depicts the original classification assigned to the incident by the law enforcement agency. The columns reflect the classification recommended based on the reviewers’ assessment using bias crime definitions and indicators. Each cell of the matrix 3 includes the classification results with respect to its original report and recommended category denoted as original|recommended (or i|j using the notation from Equation 2).
Hate Crime Matrix of Overcounts and Undercounts.

The diagonal of the matrix in Table 2 (shown in bold) are the number of records in the sample where the reviewers and the police agree in their crime classification. 4 The total undercounts in the sample and estimated in the population are located in the last row of the matrix. The last column denotes overcounts in the sample and estimated in the population. The intersection of the last row and column indicates that there were 70 records in the sample with classification errors; therefore, it is estimated that a total of 653 classification errors were contained in the population of 28,084 records.
The occurrences of errors in bias-motivated incidents are analyzed in detail. In total, 5 undercounting errors and 13 overcounting errors were identified in the study sample. Specifically, 5 records which were not originally identified as hate crimes/incidents by the police were determined by the reviewers to have sufficient indicators to be counted as hate crimes/incidents. On the other hand, 13 records which the police did indicate as bias motivated were not judged to be hate crimes/incidents by the review team (see Table 2).
Most of the undercounted hate crimes come from the “A” crime category, cell A|AHC, where 3 of the records originally reported as Group A crimes were assessed to be Group A hate crimes. Another undercounting error is shown in cell GI|AHC which indicted that reviewers believed that one of the reports originally classified as general information was actually a Group A hate crime. The estimates number of undercounting errors in the “AHC” category is 44 after applying the error rates to the stratum populations. The final undercount is shown in the cell GI|GIHI which indicates that while it did not rise to the level of a hate crime it was a racially charged noncriminal incident. The overcounts are shown in cells AHC|A (11) and OAHC|OA (2). Both the population of general incidents and hate crimes were assessed by the reviews, and the corresponding population point estimates are equal to the sample.
The remaining cells above and below the main diagonal contain zeros when no errors were found across the intersecting categories. Since the focus of this study involves examining errors in the identification and classification of hate crimes, reviewers were less concerned with verifying the specific offense recorded. While these types of errors were less likely to show up in our analysis of broad offense categories, some are recorded in the matrix but will not be discussed in detail.
It is important, however, to note that 33 cases coded as Group A or Other Group A by police were judged to be unfounded by the research team. Many of these cases were originally recorded as unfounded on the paper copies of the police records; however, were mistakenly counted as crimes in the state IBRS electronic files from which the sample was selected. Based on the review, these cases often involved situations where police arrived at a domestic incident but no signs of physical violence were present. Both parties indicated that it was only an argument, did not wish to pursue charges or seek protection, and one party voluntarily left the scene to end the confrontation.
While these 33 cases do not contribute to the error in hate crime reporting (because the errors are not due to bias motivation), they do represent a fairly large number of overcounts in the sample. In this particular case, such error resulted in an estimate of 498 records in the population of Group A and Other A crimes that may actually be unfounded. This additional source of error was not anticipated, but uncovered through the process of reviewing records. In the end, this type of error resulted in a large number of estimated overcounts in the population and is likely to inflate estimates of crime substantially—if it is widespread across police agencies.
Illustrative Examples of Undercounted Hate Crimes
To further examine the specifics of the cases in which reviewers identified hate crime undercounts, case narratives depicting the four offenses reclassified as Group A hate crimes are presented in Figure 2. Recall, undercounts represent cases where law enforcement did not recognize and record an incident as a possible hate crime.
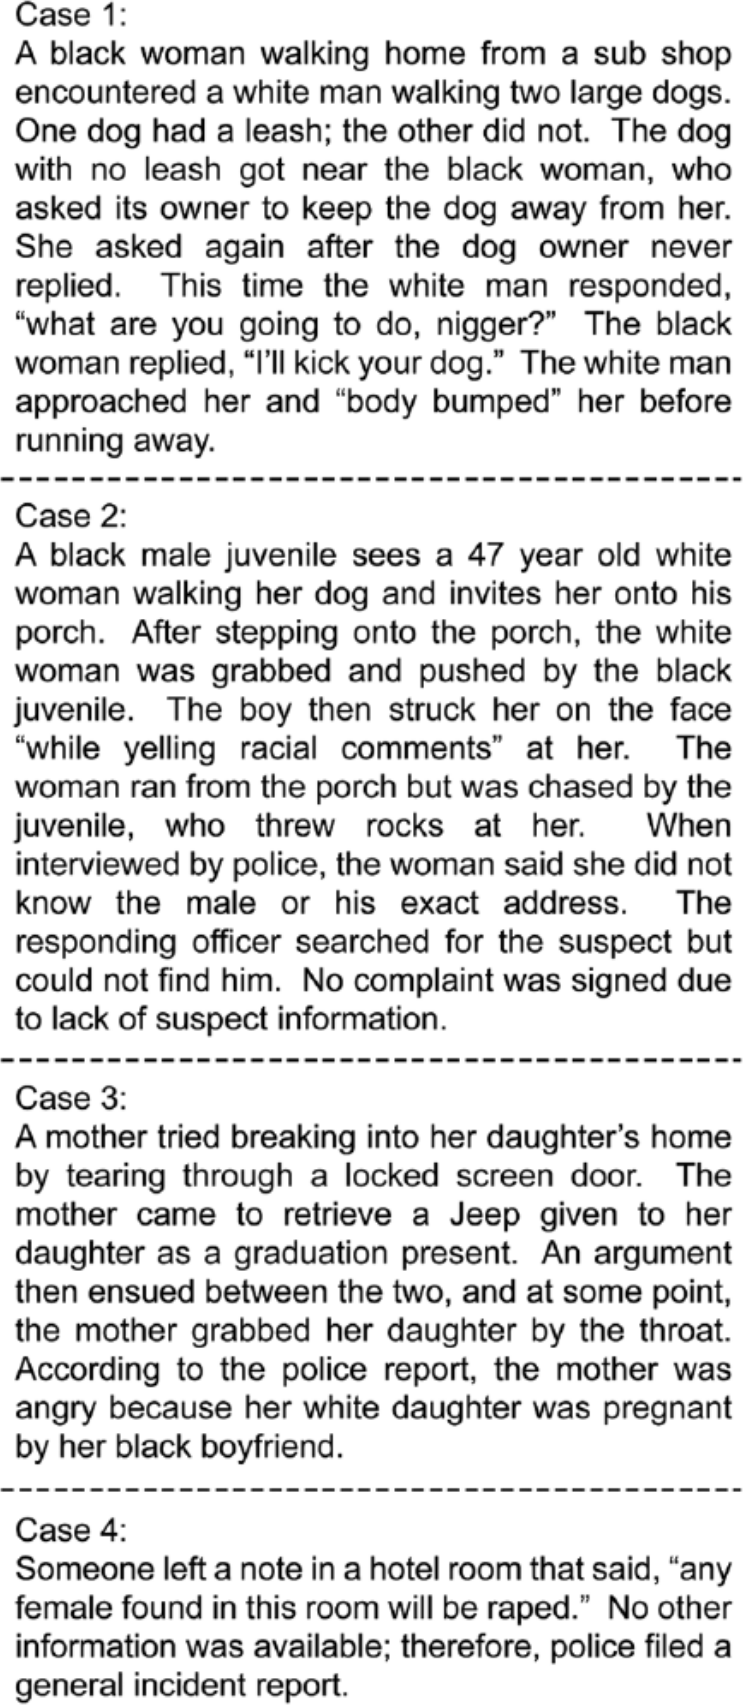
Case narratives of hate crime undercounts.
Three of the four cases contained bias indicators related to race. In Case 1, the responding officer’s narrative noted the difference in race between the two persons involved. In addition, along with the physical assault, the dog owner used a racial slur for the victim. Similarly in Case 2, the difference in race was noted and racial slurs were present. Moreover, no additional information was provided to establish any alternative motive. Although the victim and offender were both White in Case 3, it was suggested that race was a motivating factor for the assault. The report stated that the mother’s anger with her daughter was the result of her being pregnant by her boyfriend of a different race. Each of these three cases were originally coded as Group A offenses with no indicator of bias and thus considered undercounts of bias crimes by the research team.
Based on a review of Case 4, which was found in general incident reports, the researchers determined that leaving a threatening note could constitute as intimidation. Also, this threat was not specific to one person but instead targeted all females. The research team reclassified this case as a Group A offense rather than simply a general incident because a crime was involved, even though no suspect was reported. Furthermore, this case did fit the definition of a bias motivated act since gender is a protected class under State Code.
In addition to the four case narratives involving bias crimes in Figure 2, one more undercount was identified as a hate incident (refer to GI|GIHI, Table 2). Because this incident does not impact the statistical accuracy of crime reports, it is only briefly mentioned here. The incident involved a neighborhood disturbance with a man who frequently used racial slurs and, on this occasion, made inappropriate sexual comments about a group of teenage Black females. While this man’s comments and actions were racially charged, they were not criminal. Therefore, this case was classified as a hate incident.
Illustrative Examples of Accurately Reported Hate Crimes
The reviewers agreed with the police classification of five reports that were bias-related crimes. A brief description of these cases is provided in Figure 3. While Case 1 is more detailed and the bias indicators may be more pronounced, the narrative from Case 2 is not that different from the previous undercount cases discussed in Figure 2. The last three case examples contain language suggesting bias against particular groups.
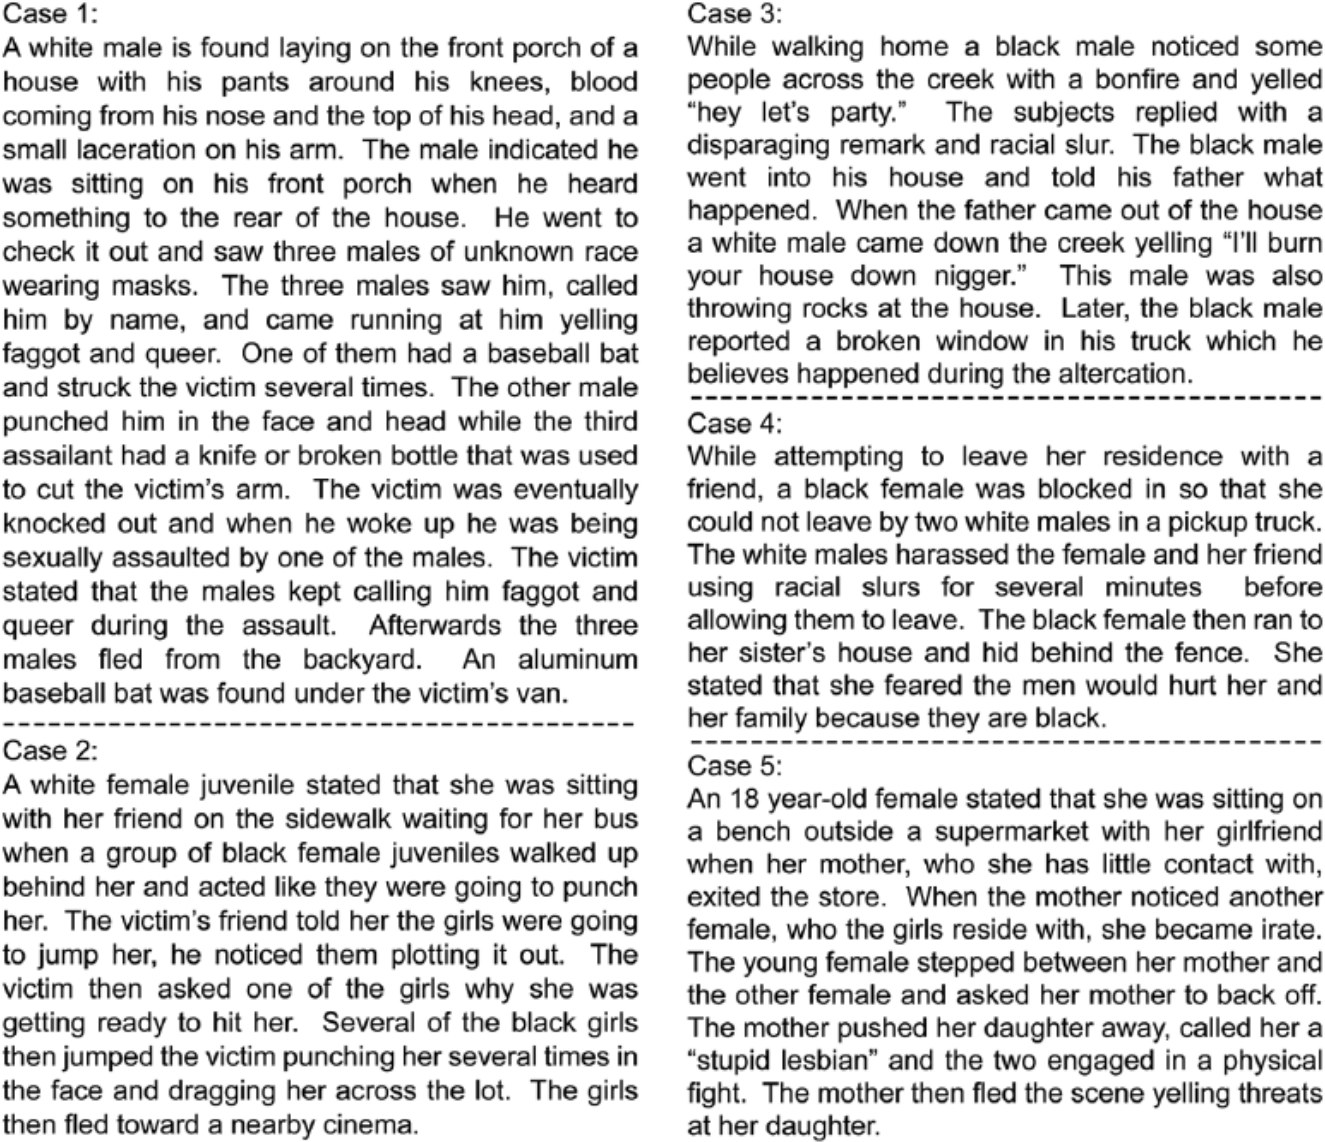
Case narratives of accurately reported hate crimes.
Case 1 describes that the victim is violently assaulted both physically and sexually (Figure 3). The assailants were wearing masks but apparently knew the victim since they called him by name. During the assault, offensive names were used which implied bias toward the victim’s sexual orientation. From the available details, it appeared that the victim was targeted for this reason. Hence, researchers agreed with the law enforcement agency that this was a hate crime.
Similar to three of the four crimes previously described as undercounts, Case 2 identifies the different races of the victim and her offenders. A White juvenile girl was jumped and assaulted by a group of Black juvenile girls for unknown reasons. The victim did not indicate or appear to know the girls. Given the available information and lack of other motivation, the incident seems to be at least partially motivated by race and is considered a hate crime both by the police and the research team.
Cases 3 and 4 were reported by the police as anti-Black hate crimes. In both cases, the Black victims appear to be harassed by White assailants who repeatedly use the “N” word to address their victims. The Black male’s property was damaged in Case 3, while the Black female in Case 4 was assaulted. The research team agreed with the police that both cases are hate crimes.
In Case 5, the domestic assault appears to be the result of a mother’s intolerance for her daughter’s sexual preference and living situation. Even though the mother is not the legal guardian and has had little contact with her daughter, she initiated an altercation on seeing the females together. The mother’s language confirmed her disapproval of her daughter’s lifestyle and indicated that her actions were bias motivated.
Explanation of Overcounted Hate Crimes
In terms of overcounts, a total of 13 records originally classified by police as hate crimes were reclassified by the research team. In each of these incidents, no evidence of bias motivation was found in the officer’s narrative. It is important to note, however, that further investigation into these cases beyond the examination of incident reports and narratives may have led to other pertinent information not available at the time of review. 5 Regardless, these records were considered overcounts and reclassified to Group A or Other Group A offenses. These overcounts are identified in Table 2, and classified accordingly. Descriptions of these overcounts would provide no meaningful information since they simply describe crimes—with the absence of any description of bias or hate motivation.
The Impact of Classification Error on Hate Crime Totals
Table 3 provides a summary of the point estimates and confidence intervals for each crime category. 6 The “reported” column illustrates the population of incidents originally reported in each category. The “estimate” column provides the point estimate of crimes based on the review of sampled records using Equations 2 and 3.
Hate Crime Estimates and Error Rates.
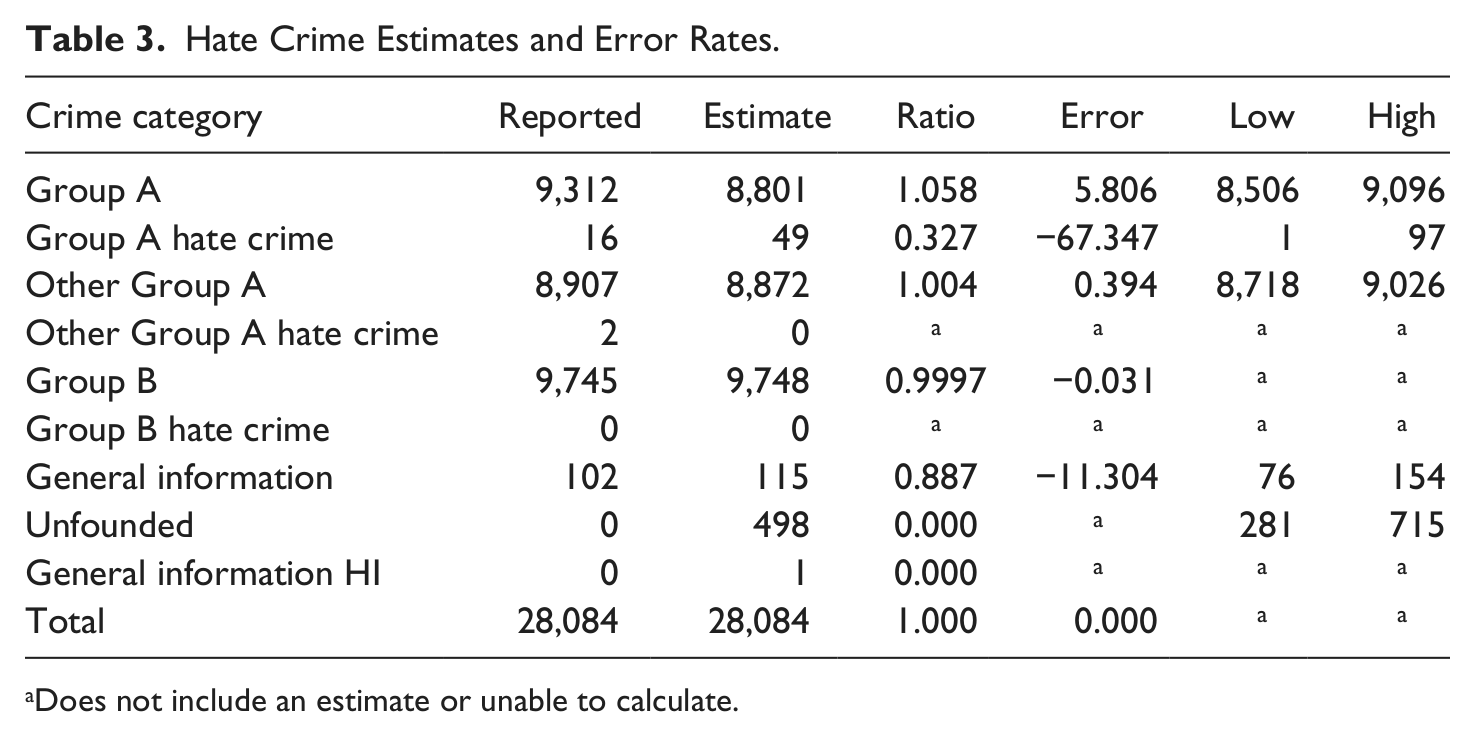
Does not include an estimate or unable to calculate.
“Statistical accuracy” refers to the errors found in the crime totals after all crime types have been examined and offsetting misclassifications (i.e., undercounts and overcounts) have been taken into account. Therefore, statistical accuracy, the “Error” column in Table 3, compares the reported and estimated total which accounts for over- and undercounts due to classification error (see Equation 4). Error for some categories could not be calculated (denoted N/A) because no records were reported or assessed to belong to the category.
Despite the small number of errors found in the 1,308 reports sampled, the resulting error estimates can become quite pronounced. As shown in Table 3, most of the error in crime reporting was predominately from undercounting given that the two most sizable errors were negative. The largest measure of error involved the undercounting of Group A hate crimes (−67.35%). The magnitude of this error is due to the number of hate crimes estimated in the population relative to the number reported. The findings also suggest an overall undercounting error in the General Incident category by −11.30%.
Error associated with overcounting was found in Group A (5.81%) and Other Group A (0.39%) offenses. The effect of the overcounts is minor due to two factors: the small population of hate crime records and the small number of nonbias crimes reclassified. Although the error for Unfounded cases could not be estimated, it is predicted that 498 Unfounded cases may exist in the population (based on the 33 cases found in Group A and Other Group A crimes that were reclassified as Unfounded). These classification errors imply that Unfounded cases are undercounted to some extent, but more importantly, Unfounded cases appear to be contributing to the overcounting of actual crimes.
Officer Explanations for Classification Error
Law enforcement officers from one of the agencies involved in the study participated in a focus group to gain insight on hate crime policing from the front lines after the research team reviewed and classified records. The interview lasted over 1 hour and included four patrol officers and a lieutenant with varying levels of experience. Participants were asked specific questions related to hate crime reporting and were to discuss case scenarios reviewed by the research team.
Several themes stood out during the discussion with the officers. One overriding theme seemed to be that if they encountered a hate crime, it would be obvious and they would easily recognize it as such. While they acknowledged that hate crimes do occur everywhere, these officers did not think that they had seen one. The consensus seemed to be that “when you do see a hate crime, it is the type that makes the national headlines.” This is what the officers referred to as a “clear-cut case.”
From the perspective of officers, lack of a relationship between parties involving serious injuries or death was an important characteristic for determining whether a case involved a hate crime. They felt that “if the parties did not know each other, then the bias might be the only reason for the crime.” Furthermore, it was necessary for the relationship to be coupled with serious injury or death. Other indicators for officers involved the presence of graffiti or racial slurs spray painted on someone or at the scene. Cited examples included swastikas, cross-burning, or setting a synagogue on fire.
In their experience, however, these officers seemed to agree that most crimes could be attributed to other factors such as location or even prior dealings “gone bad” between the parties. For example, in the case of the White female walking her dog who goes onto the porch of the Black male juvenile (see Figure 2, Case 2), the officers felt certain that there was more to the story. They believed that she must have had some reason to go there, particularly in the neighborhood where this incident occurred. The officers indicated that “people just do not go onto a stranger’s porch for no reason.” Likewise, disputes over drugs and/or money were mentioned repeatedly by the officers as instigators for many crimes.
Officers further indicated that one of the biggest hurdles they face in classifying crimes is simply “getting to the truth of the matter.” Officers stated that they “often get one story from the victim and another story from the offender and often the truth falls somewhere in between.” For instance, they suggested it is not possible to depend on victim statements by themselves. In terms of indicating whether a crime was motivated by bias, the officers felt they simply could not solely rely on the victim statements. One officer stated that “even though a victim may believe they were targeted due to a bias, that doesn’t prove the offender’s motivation.” In the case involving the mother whose daughter was pregnant with her Black boyfriend’s baby (Figure 2, Case 3), this was clearly an example. The officers’ said “the narrative only provided why the daughter thought her mother was angry.” Therefore, the officers rejected this, as well as other cases questioned by the reviewers, since they considered the reports to be victim statements.
In addition, the general consensus was that hate crime incidents were not spontaneous events. In order for a person to be motivated by a bias to commit a crime, they believed that “the crime would have to be premeditated.” For example, if a person looked for someone to assault simply because they are Black. In the case of the Black female who was called a racial slur by a White male walking his dogs, the officers said “the slur was probably out of anger over the confrontation” (Figure 2, Case 1). They did not believe that the man simply went walking with the intent to call a Black person a disparaging name.
It should be noted that participants in the focus group were mainly frontline officers taking initial reports and ensuring safety at the scene. The officers routinely stated that such incidents are followed-up on by the Criminal Investigative Division where additional inquiry would take place. Many of the officers stated that “it would be the detectives who would obtain the additional information, if it existed, to classify the incident as a hate crime.” Moreover, officers seemed to suggest that the decision to classify an incident as bias-motivated seemed somewhat outcome based. That is, several agreed that “if the victim is not willing to cooperate or to ensure that charges will be pressed, it isn’t important to record it.” In their experience, as one officer put it, “suspects are often back on the street before we can even get the paperwork completed.”
When asked whether additional training would help officers identify hate crimes, the group did not believe it was necessary. Generally, this group of officers felt that “if a hate crime occurred, it would be easy to recognize, just common sense.” All the officers indicated that they had received some training related to hate crimes at the academy. The Lieutenant reported that “some hate crime training had been done probably 15 years ago.” In their day-to-day dealings with the public, many of the officers stated they “hear racial slurs all the time but that doesn’t make it a hate crime.” Thus, officers stated they “do not consider most situations involving racial slurs as hate crimes but rather just the way people talk.”
On the whole, the officers seemed to understand that hate crimes are a special category and believed that they should be treated as such. They agreed that “it is the motivation that makes these crimes different.” One officer noted and others agreed that “victims of hate crimes can’t really protect themselves from being targeted.” A person may be able to lessen their likelihood of becoming a victim of certain crimes by avoiding areas where violence is known to take place. However, “hate crime victims can’t protect themselves against being female, Black, or gay” one officer stated, for example. In fact, the officers indicated that they would check the box (referring to the hate crime indicator on the IBRS form noting incident was bias motivated), if they were certain. There seemed to be the perception that if an incident involved a hate crime, the outcome may be harsher. Specifically, a serious hate crime case could be prosecuted in federal court rather than ending up in magistrate court.
Discussion and Conclusions
Classification error resulting from undercounting hate crimes in official records was the largest measure of error found in this study to impact statistical accuracy. During the systematic review of records, the researchers found evidence of bias in incidents which were never classified or identified as hate crimes by officers. In all the cases underreported, the reviewers identified distinctive racially charged comments and/or perceived differences between the victim and offender. The result of undercounting of bias crimes in official records is similar to what McDevitt et al. (2003) observed while reviewing assault incident reports. Furthermore, the implication of extending error rates to the population suggest that the estimated number of bias crimes that go uncounted is noticeable.
Complications in documenting bias crimes may rest in discrepancies between local and federal hate crime definitions. One of the most notable differences is the separate groups protected under state and federal statutes. The records review resulted in commensurate compliance to federal hate crime terms, specifically regarding recognizing bias against sexual orientation. While federal hate crime laws extend to sexual orientation, the State Code does not. In reviewing the official police narratives, two incidents were accurately classified as hate crimes based bias toward sexual orientation. Although it seems promising that both state and federal protected classes are realized in official statistics, there are still other complicated conditions that muddle hate crime classification.
Prior research suggests that some elements of bias are more easily recognized than others (Martin, 1995, 1999; McDevitt et al., 2003; Nolan et al., 2004). A particular challenge is recognizing incidents which are motivated “in part” by bias. Several of the undercounted hate crimes identified in this study are examples Response/Retaliation offenses (i.e., offenses that are first triggered by something other than bias), as described by Nolan et al. (2004). For example, the incident where a “body-bump,” accompanied by a racial epithet, that resulted from a Black woman asking a White male to keep his dog away. Offenses that are more ambiguous or have additional caveats can be harder to distinguish than crimes motivated in whole by offender bias.
As described by other researchers, the focus group discussions clearly point to the thought processes that can impact officer judgments when deciding whether a particular incident is a hate crime (Cronin, McDevitt, Farrell, & Nolan, 2007; Martin, 1995, 1999; McDevitt et al., 2003; Nolan & Akiyama, 1999). The results of the focus group suggest inherent difficulties in defining what is (and what is not) a hate crime which seems to contribute to undercounting hate crimes. In some regards, our focus group officers seemed to indicate that hate crimes are “obvious” when they occur, remarks consistent with decision-making routines that are dependent on the construct of a “normal” hate crime (Boyd et al., 1996). These comments also appear to be tied to the thought that most hate crimes are severe in nature. However, as seen from the case narratives, indicators of bias can be slight and the crimes do not have to be serious in order to be motivated by bias, thereby making the classification of hate crimes a very difficult task.
In addition, officers point to various factors such as the prior relationship between parties, conflicting stories among the victim and offender, as well as whether the victim is likely to participate in the prosecution when determining whether a crime should be flagged as a hate crime. These comments echo officers’ responses from Martin’s 1995 and 1999 studies citing multiple explanations that lead to uncertainty and interfere with verifying hate crimes. Overall, the responses from the focus group seem to support the notion that as the severity of crime and extent of bias become ambiguous, classifying bias and nonbias crimes becomes challenging (McDevitt et al., 2003).
As officers enter these difficult situations, against a backdrop of organizational and personal factors that predispose their thoughts about hate crimes, the inherent difficulties in defining what is (and what is not) a hate crime becomes more apparent. In the classification of such crimes, organizational (i.e., culture and norms of police departments) as well as personal factors (i.e., internalized beliefs of officers) merge and provide a context in which decisions need to be made by officers. These organizational and personal factors are elements for which officers eventually determine the intentions and motivations of the people involved, and make a judgment as to whether the crime was motivated by bias.
This study further demonstrated the usefulness of this previously established methodology for exploring errors in specific types of crimes (i.e., hate crime). In utilizing a methodology that “goes to the source” (i.e., original agency documents recorded by officers), we were able to directly assess the presence or absence of key bias indicators. In addition, sampling from all crime types, rather than specific crime types suspected to contain bias indicators, allowed inferences to be made about the population of records. The results clearly illustrate that classification errors can, and in fact do, impact the statistical accuracy of official hate crime statistics. Our findings showed that the true number of hate crimes in the population is likely much greater than official crime reports suggest, largely due to the undercounting of these crimes.
It is important to note, however, the approach of reviewing documents for the presence or absence of a hate crime is not without limitations. In some instances, the “written word” may not truly reflect the “realities” and “dynamics” of the situation, nor the cognitive intentions or motivations of the persons involved. Future research should build on this study’s approach by identifying ways to incorporate the perspectives of officers and others involved in the specific incidents. Seeking additional data from victims, and if possible perpetrators of hate crimes, would enhance efforts for determining the role of bias given that this study illustrated that officers are likely to encounter situations with their own biases. Aside, the methods used offer a readily available and feasible mechanism for allowing law enforcement agencies themselves to monitor reporting and measure error. Therefore, it is anticipated that by highlighting the difficulties associated with defining hate crimes, this study will yield useful information for the training of officers on the reporting of hate crimes. Finally, it is hoped that this research will contribute to more accurate hate crime reporting in the future. It is only through the training of law enforcement personnel, and helping officers better recognize the indicators of bias, that we can obtain more accurate statistics on the number of crimes motivated by hate in the United States. Perhaps this research will get us a step closer to estimating the true magnitude of these crimes and ultimately lead to new methods for statistically adjusting crime statistics. In this sense, we will gain a more accurate measure for the actual number of hate crimes in the population.
Footnotes
Acknowledgements
This study would not have been possible without the cooperation and support of the local police agency’s officials and staff. The authors greatly appreciate the time spent pulling records, answering questions, and participating in the focus group. A special thank you is also extended to Simon Bauer-Leffler, Jessica S. Napier, and Monika Sterling with the West Virginia Statistical Analysis Center; Susie Bennett and Rachel Stein of West Virginia University; and Stacia Gilliard-Maatthews of Rutgers University for their invaluable assistance in reviewing records. Finally, we must acknowledge and thank Dr. Yoshio Akiyama for developing the methods used in this article.
Authors’ Note
The views expressed in this report are those of the authors and do not necessarily reflect the opinions of the U.S. Department of Justice, the Bureau of Justice Statistics, or the West Virginia Division of Justice and Community Services.
Declaration of Conflicting Interests
The author(s) declared no potential conflicts of interest with respect to the research, authorship, and/or publication of this article.
Funding
The author(s) disclosed receipt of the following financial support for the research, authorship, and/or publication of this article: This project was supported by Subaward Agreement #WV12-2009-001, awarded by the Justice Research and Statistics Association (JRSA). This agreement is for the performance of a portion of the work originally awarded to JRSA from the Bureau of Justice Statistics, U.S. Department of Justice, Award #2009-BJ-CX-K034.