




Abstract
The digital sphere and social media platforms have prompted new logics regarding information access and influence flows among media, politicians, and citizens. In this exploratory study, via a machine learning software and with data visualization methods, we analyzed social media data in order to find patterns that can contribute to comprehend the new dynamics of influence between the media, politicians, and citizenship in the context of social media and digital communication, specifically on Twitter. We analyzed who the top 50 Spanish generalist media with most followers started following in 2017, 2018, and 2019 on Twitter, the quintessential informational network. To do so, we melded data visualization computational and manual methods. We used an artificial intelligence big data analysis software to visualize the network of media from Spain in order to identify the sample. Afterward, we extracted the top followed accounts by the sample and categorized them in types of accounts, institution/citizenship, country, number of followers, and gender, to proceed with the data visualization to identify trends and patterns. The results show that these media accounts started following mainly accounts that belonged to male politicians from Spain. We could also spot among the years of the study an inversely proportional trend from the media that went from following mainly institutions to following a majority of citizens, and to start following more accounts with a smaller number of followers every year. The tendency to follow accounts from Spain that belong to men grew or remained a majority among the years of the study.
Introduction
New technologies and the web 2.0 gave way to a new hybrid media logic between traditional media and new media, and among mass media, politicians, and citizens (Chadwick, 2013; Jenkins, 2006; Weimann & Brosius, 2017). The mainstream media still exercises power in the agenda setting process (Harder et al., 2017; Soler & Micó Sanz, 2019; Tran, 2014), but they are not the only ones anymore due to the fact that social media, online media, political blogs, and many other types of online channels have gained weight and are becoming initiators or shapers of the media agenda (Camacho-Markina et al., 2019; Dang-Xuan et al., 2013; Guo & Vargo, 2017; Meraz, 2009, 2014; Soler & Micó Sanz, 2019; Tran, 2014; Vargo, 2018).
On the other hand, citizens have become a less passive audience than ever, and if in the past they could be critical and read into the contents (Canclini, 1991; Morley, 1992), they are now cocreators (Lasorsa et al., 2012), produsers and/or prosumers (Deuze, 2011), taking news, media and information in their own hands (Camacho-Markina et al., 2019; Tran, 2014) in a citizen journalism context (Hermida, 2010). Digital media enables the environment for them to have a more active role in the selection of the information they consume (Feezell, 2018), as well as in its dissemination and in the production of the information itself. Nowadays, most people have a smartphone that allows them to record and spread through their social media accounts any event they witness. Therefore, information that perhaps a few decades ago would have never get published, today can become public and viral, without the filter of either the politicians or the mass media (McCombs & Shaw, 1972).
Nonetheless, a new filter has emerged with digital platforms: interfaces and algorithms (Finn, 2017; Finn et al., 2016; Golbeck et al., 2010; Martínez Figuerola & Marzo, 2016), characterized as the gatekeepers of the 21st century (Wallace, 2018), a notion we recommend to further explore in future research in the matter.
However, even though traditional media has lost part of the power they used to have in comparison to the predigital networks world, they still have influence and relevance in reference to selecting the topics of public interest (Harder et al., 2017; Martin, 2014; Soler & Micó Sanz, 2019), and “journalists and politicians, whether in conflict, regular dialogue, or working in coalitions, contribute to issue agendas and policy debate” (Davis, 2007, p. 184). Hence, who influences who in this new logic? How are the new dynamics in the relations between media, politicians and citizens regarding information flows?
The Information Network
Twitter has been described as an information network by its own former CEO, Evan Williams, (Kramer, 2010), and as a news source or an information service more than a social network (Verweij, 2012). This microblog is also understood as a political tool (Pérez-Curiel & Limón Naharro, 2019; Redek & Godnov, 2018) or even as a political network (Conway & Wang, 2015; Fernández Gómez et al., 2018) with a significant use by opinion leaders (Bengoechea et al., 2019); 83% of the world’s leaders are estimated to be on Twitter (Smith, 2020).
As a digital platform, it has received the emancipating attribute of enhancing freedom (Shirky, 2008). However, some authors claim that the democratization of access to information and tools for dissemination should not be misunderstood as democratization on a society level (Morozov, 2011). Previous research indicates that the main receptors of the messages of politicians are other politicians or the media, which has led to interpret Twitter as an echo chamber of the elites (Bruns & Highfield, 2013). In the same line of thought, some authors claim that the platform emulates the social dynamic of stratified attention characteristic of the capitalist culture, concentrating the message and amplifying power in a few users, where those who hold power like media and politicians, sustain it (Dubois & Gaffney, 2014; Fuchs, 2017). Twitter has acquired an increasingly relevant role in political communication campaigns (Alonso-Muñoz et al., 2016) and in journalism (Hermida, 2010; Lasorsa et al., 2012; Soler & Micó Sanz, 2019). The main political actors use it for political debate to spread their messages and interact with other key actors (Ausserhofer & Maireder, 2013). Whereas regarding the use of Twitter in Journalism, previous research suggests that journalists and mass media use it mainly to share their contents (Ausserhofer & Maireder, 2013; Holcomb et al., 2011; Soler & Micó Sanz, 2019). Other studies show that Twitter has become an information source for journalists and media, as users upload the events they witness, becoming on-site sources of many relevant sociopolitical events (Artwick, 2013; Felt, 2016; Suárez Villegas & Cruz Álvarez, 2016; Verweij, 2012; Zimmer & Proferes, 2014).
The Influence
A new relevant figure has emerged in social platforms in the past few years: the social media influencers (SMIs). The name itself brings the influential role into account. They have been characterized as people that combine a personification of values, preferences or beliefs, specific competences or skills, and in occasions, a strategic location in a network (Tanase et al., 2018). Moreover, they have been described as content creators that have accumulated a large amount of followers and as more accessible, believable, and intimate than celebrities (De Veirman et al., 2017). Other definitions and authors describe SMIs as “third party endorsers” who form audience’s opinions through the use of social media platforms and tools (Freberg et al., 2011).
There is a discussion regarding how to measure influence. For instance, in social media, the number of followers has been used as a measure or at least as one of the parameters to measure influence (Dubois & Gaffney, 2014; Freberg et al., 2011; Nebot et al., 2018) as it is considered to reflect the size of the audience of an account. Moreover, the number of followers can be thought as the size in a network, which besides of being considered as a measure of influence by itself (De Veirman et al., 2017), it can represent popularity and the possibility of a larger reach (Casaló et al., 2018; De Veirman et al., 2017; Esteve Del Valle & Borge Bravo, 2018; Kwak et al., 2010). In like manner, a large number of followers generates the perception of importance to other users, and therefore an increased perceived influential capacity (Cresci et al., 2015). Some studies imply a clear connection between the number of followers and opinion influence and leadership (Feng, 2016; Hwang, 2015), whereas others consider that the number of followers is a parameter of popularity but does not necessarily indicate influence (Cha et al., 2010). We can also find a vast amount of articles that come from mass media and the business environment in which they write about the number of followers that determine if a person is an influencer in social media networks, and even categories of economic remuneration per post depending on the number of followers (Agrawal, 2019; Espinosa, 2018; Maheshwari, 2018). In like manner, the engagement rate is also considered as relevant to determine possible revenue from an influencer (Ritvars, 2020).
Other aspects of social media influence measurement include the amount of retweets and mentions a user receives (Cha et al., 2010), which relates to the engagement rate, and who follows the user (Dubois & Gaffney, 2014). Some authors argue that it is problematic to describe someone as influential due to the lack of tools, strategies, and unique social connections structures to determine who is influential (Dubois & Gaffney, 2014).
The Following
“Twitter is only as good as the people you follow” (Hawley, 2019). Not only can we find numerous lists, posts, and web entries talking about who to follow (Hawley, 2019; Lacy, 2019; Wix Blog, 2019) but also Twitter has an algorithm to recommend their users accounts to start following (Gupta et al., 2013; Hutchinson, 2017; Twitter, 2019). Who the users follow, is central in the experience they have in this (and most) user generated social media platforms. Previous research shows that the information the users see on their feeds on social media platforms has an impact on their perceived relevance of these issues (Feezell, 2018).
Does it matter who the media follow? When the Twitter algorithm suggests a user who to follow, it does it responding to many possible criterion, which includes shared connections, common interests (Gupta et al., 2013) and who the people you follow are following (Twitter, 2019), meaning it recommends the accounts followed by the accounts a user follows. Given the fact that we are studying the most followed media, we can consider that the accounts followed by them may appear suggested more frequently. Therefore, they may receive more visibility among other Twitter users, becoming more relevant in the network. By analyzing who the Media started following, we are able to comprehend which accounts the media shows publicly they believe is worth following or which accounts will be more likely recommended by Twitter’s recommendation algorithm.
Objectives
In this complex new communicational scenario in which we can see new power and influence flows, this study seeks to analyze data in order to find patterns that can contribute to comprehend the new dynamics in the relations between media, politicians, and citizens in the context of social media and digital communication, specifically on Twitter as it is considered to be the quintessential informational network (Pérez-Soler, 2018).
This is an exploratory research where we aimed to analyze data from the social network in order to obtain trends and be able to answer our research questions.
We aim to understand what types of accounts the media began to follow. We seek to find out if they tended to start following other media, politicians, and if they followed accounts that belong to citizens. We pursue to identify if the accounts that the media began to follow belong mainly to institutions/organizations or to people/citizens. And in the case of the latter, we want to know if they follow mostly accounts from women, men or nonbinary. We intend to explore to which countries the accounts that the media began to follow belong, as well as understand whether the accounts they started following are large in number of followers.
Methodology
In order to analyze who the media started following, we determined a sample of 50 accounts that belong to the top most followed generalist media from Spain. The sample includes both traditional mass media accounts and smaller, newer digital media, as both types constitute the map of the most followed Spanish generalist media accounts on Twitter.
According to the intermediate agenda setting theory and with previous research, media influence other media, especially highly regarded media (Harder et al., 2017). This is the reason why we analyzed the most followed media, as we believe the scope of their influence can reach, at least, citizens and smaller media.
We analyzed the 50 accounts the sample started to follow in 2017, 2018, and 2019. We considered 50 in order to have significant data to analyze but taking into account that analyzing more accounts than that would add up to a high dispersion.
In order to access to the data, we used an artificial intelligence big data analysis software from where we were able to identify the sample and from where we extracted the most followed accounts by the accounts of this sample as a network.
In this software that processes big data, we worked with a dataset that contained most Spanish Media accounts on Twitter. Via this software we could access and visualize the social network and the relation between the accounts. We could see which are the central nodes and who follows who within the context. From this graph we were able to extract the most followed media. We then categorized these media and filtered them selecting only the ones with generalist Spanish contents. We double-checked the number of followers in each of the accounts’ Twitter profiles.
Afterward, we created a new context with these 50 media, to visualize only the sample’s data. In this new context, we consulted the data regarding who the accounts started to follow in three different periods: 2017, 2018, and 2019. This was the data we then proceeded to analyze in order to find trends. Once we collected the data, we categorized it in.
Types of Accounts
We divided the accounts in three categories: political, media, and citizenship. Political accounts include politicians, political parties and public institutions. Public institutions were included in the political category as “public institutions are political devices” (Thoenig, 2003, p. 134). There are different theories regarding whether public institutions influence politics or vice versa. Historical Institutionalism rejects the idea of a hands-off, neutral state that functions separated from the political scenery (Thoenig, 2003). According to this theory, public administration is a part of politics postulating that politics and policies shape public institutions and not the other way around.
Nevertheless, and according to sociological institutionalism, institutions can also shape the conduct of politics as they shape and frame their action stating that bureaucracy models how things are perceived and understood by a social group (Thoenig, 2003).
However, the way the public institutions work may respond to the political frameworks in which they were created and developed among the years. For a user to choose whether to follow or not determined public institutions may imply a political position as, according to the theory of cognitive dissonance (Festinger, 1957) people tend to avoid information they do not agree with (Shaw et al., 1999). Moreover, online social networks could polarize people as they tend to homophily, searching to reinforce their opinions instead of searching or following accounts that could provide new or different points of view (Christakis & Fowler, 2009; Katz et al., 2004; Lazarsfeld & Merton, 1954; Mcpherson et al., 2001; Perl et al., 2015). Nonetheless, users can choose to follow accounts they don’t agree with in order to monitor them or be informed about what they say. This could be especially the case of the Media, as they may choose to follow an account for public relations or informational purposes—we propose to study how the media chooses who to follow in Twitter for further researches.
The media category included journalists and media institutions. The citizenship category included the rest of accounts, which we categorized in: users (which include, among others, entrepreneurs, influencers, scholars, artists, celebrities, activists, etc.) and civil institutions (which include, among others, companies, nongovernmental organizations, civilian associations, etc.).
Institution/Citizenship
We divided the accounts the media started following in institutions and citizens, regarding whether the account belongs to a person or an institution/organization.
Country
We analyzed from which countries are the accounts the media started to follow.
Number of Followers
We divided the number of followers into five categories in order to analyze if we could find trends related to the number of followers of the accounts the media started to follow. To create these categories, we merged concepts from a variety of authors.
Some are talking about the rise of nano-influencers to refer accounts with a 1.000 to 5.000 followers (Agrawal, 2019; Maheshwari, 2018; Stokel-Walker, 2019). Micro-influencers have been classified as accounts that have between 10,000 and 100,000 followers (Tankovska, 2020) and also as accounts with a number between 10,0000 and 50,000 followers (Lieber, 2018). Agrawal (2019) classifies influencers in nano-influencers (1,000-5,000 followers); micro (5,000-20,000 followers ); midtier (20,000-100,000 followers); Macro (100,000-1,000,000 followers) and mega (more than 10,000; Agrawal, 2019). Macro influencers have also been classified as those with between 100,000 followers and 1,000,000 by Tankovska (2020), who also introduced the name of “icon” influencers for those with above the million followers (Tankovska, 2020).
Taking these classifications into account, and considering that there are some points of agreements but not a total consensus over the exact amount of number of followers that imply different categories of influence on social media, we will categorize the number of followers in five segments: less than 1,000 followers, between 1,001 and 10,000, between 10,001 and 100,000, between 100,001 and 1,000,000 and more than 1,000,000 followers.
Gender
We analyzed whether the accounts that belonged to citizens (not institutions) were from men, women, or nonbinary citizens (Butler, 1988; Richards et al., 2016), in order to understand whether the accounts the media began to follow are gender-balanced or if they respond to other long-lasting patterns of media behavior in relation to gender, such as the disproportion in the use of male sources over female ones (Armstrong, 2004; Armstrong & Gao, 2011; Armstrong & Nelson, 2005; Bustamante, 1994; De Swert & Hooghe, 2010; Moreno-Castro et al., 2019; Zoch & Van Slyke Turk, 1998), or the unbalanced representation of men over women in the news and in the media (Armstrong, 2004; Armstrong & Gao, 2011; Caro González et al., 2014; Len-Ríos et al., 2005; López González, 2002; Shor et al., 2015), which could be related to the underrepresentation of women in power positions (Carli & Eagly, 2002; Connell, 2013; Kubu, 2017; Madsen & Andrade, 2018; Painter-Morland, 2011). We also crossed this data with the types of accounts and with the number of followers.
Once we categorized the data, we proceeded to create graphics in order to visualize possible patterns. The methodology used in this research to analyze the data was quantitative social media data analysis. We applied a quantitative analysis to the data we extracted, we crossed it and worked in data visualization in order to answer our research questions by exploring and identifying trends, patterns, and relationships (Batrinca & Treleaven, 2015; Dodge, 2005; Mahrt & Scharkow, 2013; Vogt et al., 2014).
Lewis et al. (2013) argue that blending computational and manual methods, as well as melding different data analysis techniques may be the key to take advantage of data without losing contextual implications (Lewis et al., 2013; Vogt et al., 2014).
Social media analytics and social media research are gaining relevance as social media data is considered the “largest, richest and most dynamic evidence base of human behavior” (Batrinca & Treleaven, 2015, p. 90). Social media data is being studied from a diverse range of specialties from sociology to physics, going through anthropology, communications, marketing, mathematics, computer science, and so on. Moreover, it has gained relevance in various spheres such as in the academia, politics, and business (Bail, 2014; Gandomi & Haider, 2015; Stieglitz & Dang-Xuan, 2013; Zeng et al., 2010).
There has been an interest in the past few years in Twitter-based researches (Felt, 2016; Zimmer & Proferes, 2014). We can find many quantitative data-based researches about Twitter (Dubois & Gaffney, 2014; Kwak et al., 2010; Pérez-Curiel & Limón Naharro, 2019), as well as other social media data analysis researches (Skogerbø et al., 2015). However, previous research using quantitative social media data analytics methods in communications are still scarce. According to Felt (2016), most communications and mass media researches employ traditional methods like surveys and content analysis and the communications researches that utilize quantitative social media analytics are the minority (Felt, 2016; Zimmer & Proferes, 2014). Most of the Twitter studies focus on content analysis and social network analysis (Cormode et al., 2010; Felt, 2016; Greer & Ferguson, 2011; Pérez-Curiel & Limón Naharro, 2019; Williams et al., 2013). Many researchers argue the importance of including big data analysis and social media data analytics in social and communications research (Bail, 2014; Batrinca & Treleaven, 2015; Felt, 2016; Gandomi & Haider, 2015; Lewis et al., 2013; Zeng et al., 2010). Big data is data that by being collected, added, and crossed, allows us to obtain other Data (Pérez, 2015). It can bring comprehensive information about the relationships among social actors (Bail, 2014; Felt, 2016). By searching big scale patterns, we can find tendencies. It is data that allows us to create new knowledge and its value relies on what we can extract and learn from it (Mayer-Schönberger & Cukier, 2013; Provost & Fawcett, 2013).
Results
Types of Accounts
The type of account that the 50 generalist Spanish media with the most followers on Twitter started to follow, if we add the 3 years we are studying, corresponds to political accounts.
Except in 2017, most of the accounts the media started following were political accounts, being this the most followed category by the media with around and above 50% in both 2018 and 2019.
In 2017, the most followed type of account were other media. However, the tendency to follow other media dropped in 2018 and in 2019, reaching by 2019 the 24% of the accounts, the same percentage of citizenship accounts, which used to be the least type of account that the media started to follow the previous years. One of the reasons could be the saturation of the accounts as there is not an infinite number of media or political accounts. However, it can also be explained by a growing tendency from the users to follow influencer accounts, who are becoming more and more relevant in the digital sphere.
Political Subcategories
In 2017, the majority of the political accounts that the media we are studying started following, belonged to public institutions. When analyzing the public institutions they started to follow that year, we can find the White House, possibly related to the fact that there were elections in the United States of America. They also started following accounts related to the Congress and Spain’s government, and accounts related to the Spanish Police and the U.K. Police. We could think that this is a result of the terrorist attacks perpetuated in Europe, specifically in the United Kingdom, in that same year.
In 2018 and 2019, the media we are studying started following mainly politicians. One possible explanation may be that there are more accounts of politicians than those of political parties as there are many politicians per party. In the same line of thought, there are also fewer public institutions than politicians. However, there is also a tendency regarding whether to follow institutions or people that has changed over the years we are studying, as will be explained in the institutions versus citizens section.
Media Subcategories
The media category included journalists and media accounts. In this segment, we analyze the percentage in which the media started following these subcategories. We can see how in 2017 the media started following a far higher percentage of media institutions; 21.7% versus 78.3%. In 2018, the percentage of journalist accounts the media started following augmented. However, it remained lower than the media institutions they started following (38.5% vs. 61.5%). By 2019, the percentage of journalist’s accounts had grown higher than the one of the media institutions; reaching the 58.3%.
Among the 3 years the difference decreased, and the media presented an inverse tendency in percentage terms, going from following more media institutions to following more journalists accounts.
Citizenship Subcategories
The citizenship category included the subcategories: users and civil institutions. These categories include entrepreneurs, influencers, scholars, artists, celebrities, activists, and so forth, for the users; and companies, nongovernmental organizations, civilian associations for the civil institutions.
The years 2017 and 2019 presented the same percentages, there being a relationship of 60% to 40% more users than civil institutions. In 2018, the distribution was half-and-half. In this subcategory, users are equally or more followed than the civil institutions.
Institutions Versus Citizens
At the beginning of the period this study covers, 70% of the accounts the media started following belonged to institutions. This number decreased to 36% in 2018 and kept decreasing to 34% in 2019.
There has been an inversely proportional tendency regarding whether the accounts the media started following corresponded to institutions or citizens accounts.
We can ask ourselves whether there are no more institutions to follow, or if the relevance or belief in institutions is decaying. Why are institutions being less followed? Is this a trend only among the media or is the media reflecting a more general trend? Could this represent a change in the role or trust that different social actors are giving to institutions?
Country
Spanish media started to follow mainly Spanish accounts in all the years we are studying. Moreover, the tendency is to follow a higher percentage of Spanish accounts every year.
During 2017, the accounts the top 50 Spanish generalist media started to follow belonged to accounts from five different origins, Spanish accounts representing the 74% of the accounts. The second most followed origin of accounts were from the United States of America, being this the year when Donald Trump started his presidential term. We can assume this is the reason why the Spanish media started following accounts from the United States, as more than half of the accounts they started to follow from this country correspond to the White House and Donald Trump. The other half belong to media accounts and a scholar. Besides, in the other years of this study, they did not start following any account from the United States. The third origin with more accounts followed in 2017 was the United Kingdom, from where the Spanish media started to follow two accounts related to security, which we can relate to the terrorist attacks that took place in that year in the United Kingdom. Media also started following a media account and a user. In the same period, they started following one account from New Zealand, which belongs to a user, and one account tagged as global, that belongs to a civil institution.
In 2018, the 94% of the accounts the media started to follow were from Spain. Only three accounts were from other countries; a Politician from Greece, a user from the United Kingdom and a user from the Netherlands.
We can find a similar percentage in 2019, though it kept showing a growth, with a 96% of Spanish accounts, one account from Venezuela which belonged to a politician and one account from Sweden which belongs to a user, an environmental activist.
From the accounts the top 50 Spanish generalist media started to follow from origins that were not Spain, a 43.75% belong to men and 43.75% to institutions, and they all have more than 100,000 followers. The only exceptions are an account from a female scholar with 48,000 followers from the United States and from a female environmental activist from Sweden that has over 4,000,000 followers.
Number of Followers
The number of followers the media started following have also presented some variations among the years we are studying. It is important to clarify that the number of followers we are analyzing corresponds to the moment this article was being written, meaning it does not correspond to the number of followers the accounts had at the moment the media started following them, as this is data we cannot access to.
In 2017, the majority of the accounts the media started to follow had between 100,000 and 1,000,000 followers, or more than one million followers, considered the segments of macro-influencers and icon-influencers. In 2018, the majority also belonged to accounts that had between 100,001 and 1,000,000 followers, but the rest of the accounts they started to follow were more distributed between accounts with more than one million followers and accounts with less than 100,000 or even less than followers. In 2019, the most followed type of account by the media was the middle segment which corresponds to the mid and macro influencers; accounts with to 100,000 followers and with 100,001 to 1,000,000 followers. There seems to be a tendency from the media to start following accounts with a smaller number of followers, to switch the attention from the largest accounts in terms of number of followers or icon-influencers to the mid-influencers and macro-influencers. However, the smallest accounts in numerical terms did not get followed by the media. We cannot find accounts with less than a thousand followers among the accounts the media started to follow from 2017 to 2019. However, 2018 was the year were the micro-influencers were more followed, and the year were the icon-influencers were the less followed.
Gender
Men represent around 70% of the accounts the media started following from the accounts that belong to citizenship (as opposed to Institutions) in all the 3 years of this study. This percentage presented an increase of a 5% between 2017 and 2018 and a 2% decrease in the following year. According to Statista (Fernandez, 2019), the percentage distribution by gender of Twitter users in Spain in 2019 is 50% of women and 50% of men, and 62% men and 38% women worldwide (Clement, 2020). It is important to express that this numbers do not include nonbinary (Butler, 1988; Richards et al., 2016) accounts. Nonetheless, as we can see, a 50 to 50 distribution of men and women accounts is clearly not represented in the 70 to 30 of the accounts the media started to follow between 2017 and 2019. Moreover, given that the majority of the accounts the media began to follow corresponded to politicians, we must take into account the fact that the Spanish senate is composed of 38% of women senators and 62% of men, and has had a similar distribution in the past five legislatures (Senado, 2020).
In the visualized tendency, regarding the gender of the owners of the accounts the media started to follow, the gender gap is not getting closer. Moreover, the difference has shown a tendency first to grow and then decrease, but in a smaller proportion than at the beginning of the studied period.
The accounts that belong to women generally correspond to politicians or journalists, as opposed to accounts that belong to men, where we can find besides these subcategories, more user type accounts which include entrepreneurs, celebrities, influencers, and scholars. This could mean that for women to be followed by the media, they have to have an established political or media role, or due to the fact that there are less women in leadership and power positions (Carli & Eagly, 2002; Connell, 2013; Painter-Morland, 2011), or that the media perpetuates gender underrepresentation of women (Armstrong, 2004; Len-Ríos et al., 2005; Shor et al., 2015).
The women the media started to follow tended to have a lower percentage of number of followers than the accounts they started to follow that belonged to men. We can find more women’s accounts in the segments from 1001 to 10,000 and from 10,001 to 100,000 followers, whereas we find a higher percentage of men’s accounts in the segment from 100,001 and 1,000,000 followers. Nevertheless, we can find a higher percentage of women’s accounts with more than a million followers.
Conclusions/Discussion
The question about the relationship between the media and politicians and their correlation to the agenda setting (Aruguete, 2017; Davis, 2007; Parmelee, 2014) is not a new one. Likewise, arises the issue about this relationship with the changes introduced by new technologies, such as the internet 2.0, social networks and Twitter in particular (Bengoechea et al., 2019; Gómez et al., 2018; Kramer, 2010; Pérez-Curiel & Limón Naharro, 2019; Redek & Godnov, 2018; Verweij, 2012) as online media has changed the dynamics and flows of influence and power between politicians, the media and the citizenship (Chadwick, 2013; Dang-Xuan et al., 2013; Guo & Vargo, 2017; Jenkins, 2006; Meraz, 2009, 2014; Soler & Micó Sanz, 2019; Vargo, 2018).
In the present study, we found that the most followed generalist media from Spain (see Figure 1) started to follow a majority of political accounts during the years 2017 to 2019 as visualized in Figure 2, representing more than the 50% of the accounts that the sample began to follow in 2018 and 2019. We cannot asseverate that this means that the political sphere setts the agenda, but we do believe it constitutes an element with which further explore this notion in the digital sphere. Otherwise, the tendency to follow other media accounts decreased from 2017 to 2019, going from a 46% to a 24% in the studied period. The tendency to follow accounts that belong to the citizenship slightly increased in this same period, representing a 20% in 2017 and a 24% in 2019 (see Figure 1).

Percentages of the types of accounts the top 50 generalist Spanish media with the most followers on Twitter started to follow in 2017, 2018, and 2019.

Tendencies of the types of accounts the top 50 generalist Spanish media with the most followers on Twitter started to follow in 2017, 2018, and 2019.
One of the trends that we were able to observe in most of the categories and subcategories that we studied is the passage from following institutions to citizens (see Figure 6). The tendency to follow accounts that belonged to either citizens or institutions was inversely proportional as we can observe in Figure 7, going from a majority of institutions in 2017 to a majority of citizens in 2019. This can be observed in all the categories we analyzed with the exception of the citizenship ones, where users accounts were already a majority at the beginning of the studied period. By 2019, over the 60% of the political accounts the media started to follow belonged to politicians in contraposition to political parties and public institutions, and as opposed to the beginning of the studied period, when politicians represented less than the 30% (see Figure 3). Likewise, 58% of the media accounts belonged to journalists by 2019, as opposed to a 42% of media institution accounts, and in contrast with 2017, when only the 21.7% of the accounts the media began to follow corresponded to journalists (Figure 4). On the other hand, within the citizenship category, users represented between 50 and 60% in all 3 years of the study, in contraposition to civil institutions (Figure 5).
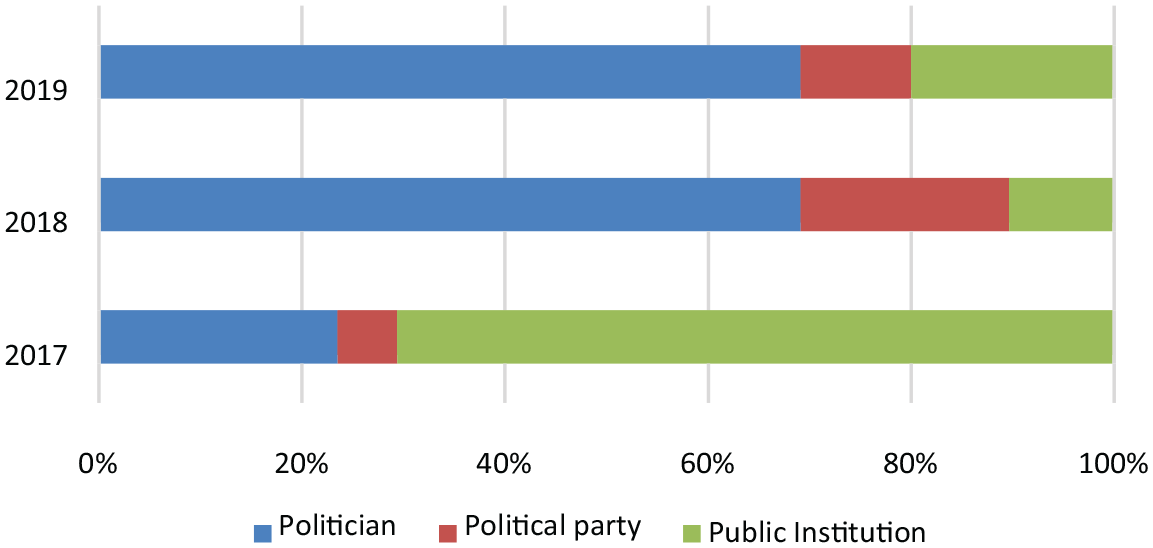
Political subcategories the top 50 generalist Spanish media with the most followers on Twitter started following in 2017, 2018, and 2019.
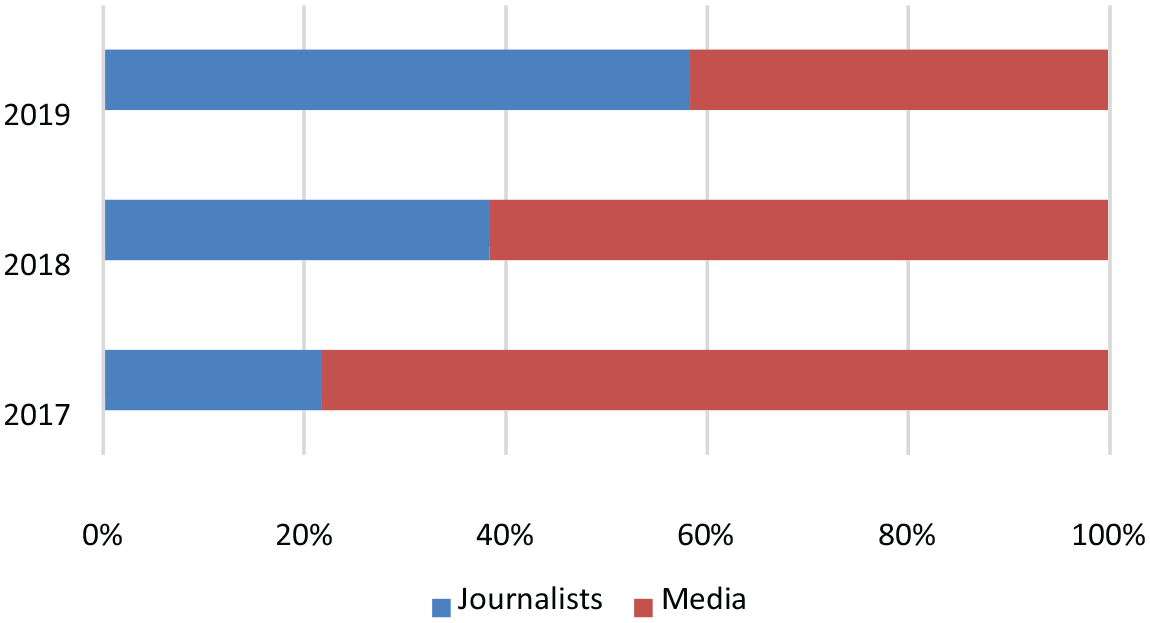
Percentage of media subcategories the top 50 generalist Spanish media with the most followers on Twitter started following in 2017, 2018, and 2019.
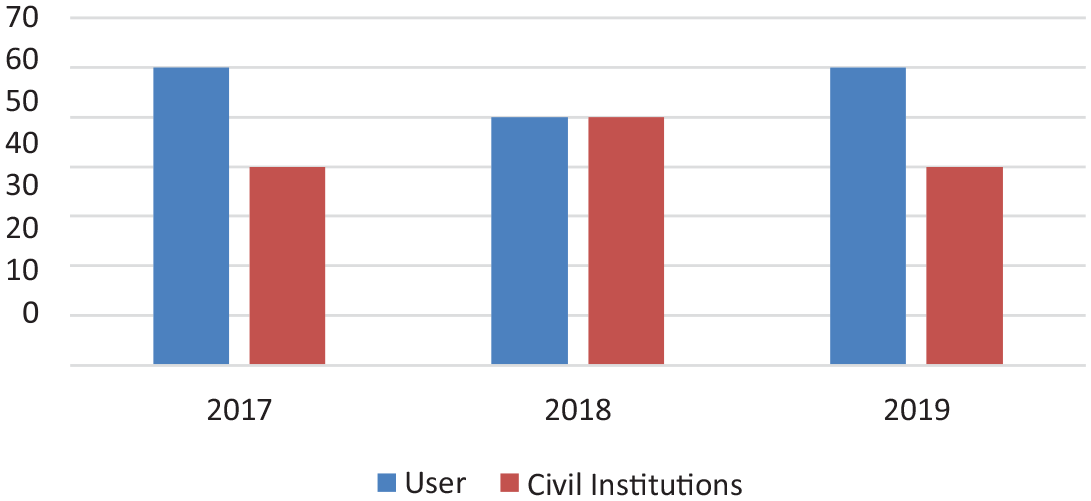
Percentage of citizenship subcategories the Top 50 generalist Spanish media with the most followers on Twitter started following in 2017, 2018, and 2019.

Percentage of accounts that belong to institutions or citizens of the accounts the top 50 generalist Spanish media with the most followers on Twitter started following in 2017, 2018, and 2019.
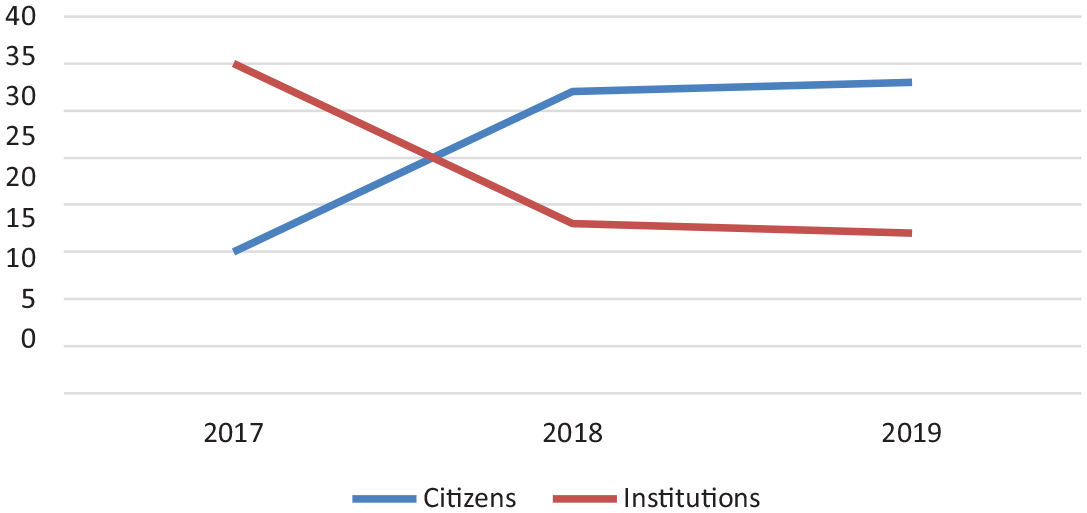
Tendency to follow institutions or people’s accounts by the top 50 generalist Spanish media with the most followers on Twitter in 2017, 2018, and 2019.
We wonder if this trend to follow more citizens than Institutions every year responds to a practical reason such as the fact that there are more citizens than institutions, bearing in mind that for each institution there are likely to be several people, or if it answers to a deeper matter. Perchance it suggests a shift in the role of institutions in public opinion, the agenda setting and/or in leadership. We wonder if this trend may be shedding to light a more active role of the citizenship (Deuze, 2011) as cocreators of the news and agenda (Lasorsa et al., 2012) and even as influencers (De Veirman et al., 2017). Is this a trend only among the Spanish media or is it a more comprehensive tendency? We suggest deepening this angle in future research.
The Spanish media we studied tended to follow a majority of Spanish accounts as exposed in Figure 8. Moreover, the tendency grew every year, going from the 74% in 2017 to the 96% in 2019, showing an inbreeding behavior regarding the precedence country of the accounts they started to follow.

Tendency to follow Spanish accounts or from other countries by the top 50 generalist Spanish media with the most followers on Twitter.
The analyzed media showed a variation in the tendency to follow accounts with larger number of followers to accounts with less followers. They went from following mainly icon and macro-influencers to following predominantly macro-influencers and mid-influencers (Agrawal, 2019; Lieber, 2018; Maheshwari, 2018; Stokel-Walker, 2019; Tankovska, 2020). The number of followers of the accounts that the media started to follow the most was, on one hand, the macro-influencers (between 100,000 and 1,000,000 followers) which remained the more stable during the years of our study, and on the other the mid-influencers (accounts that have between 10,000 and 100,000 followers), which range have been growing yearly (see Table 1). We could relate this tendency to the one of institutions versus citizens in a way. The attention seems to be shifting focus from the established, the institutions, the large-scale referents, to people that even though have a large number of followers, they are not the ones with the greatest number of followers. We can see in Figure 9 how accounts with larger number of followers were the most followed in 2017 and how these segments reduced their percentage versus the segments in the middle which grew in proportion. There seems to be a shift from following big institutional accounts and very relevant people’s accounts, to following a wider variety of types of accounts that include more citizens with a smaller number of followers (Figures 10 and 11).
Influencer Categorization by Number of Followers*.
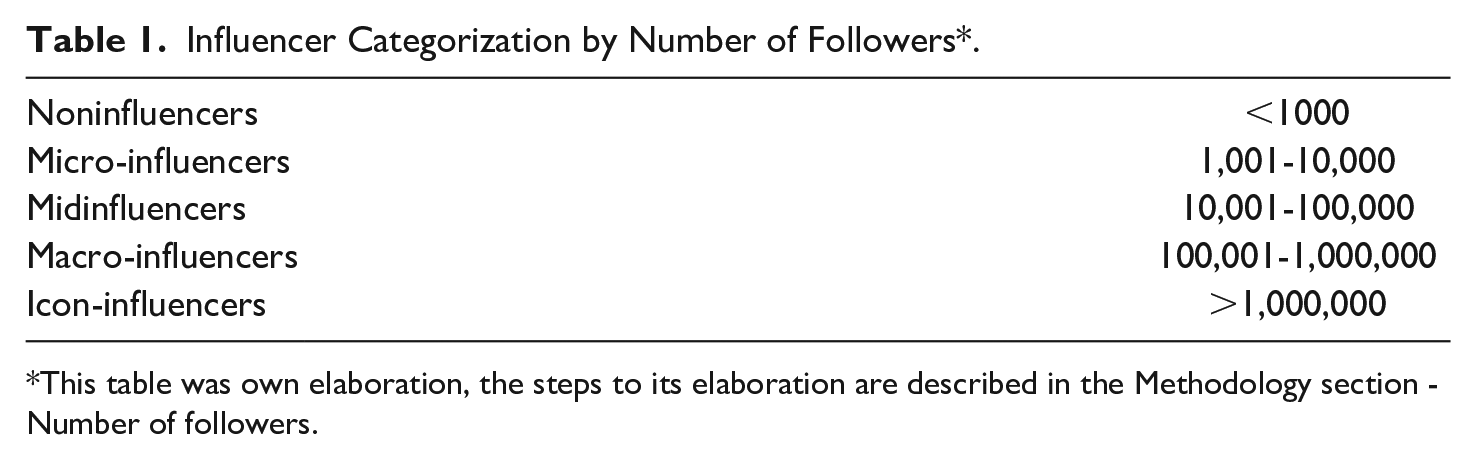
This table was own elaboration, the steps to its elaboration are described in the Methodology section - Number of followers.
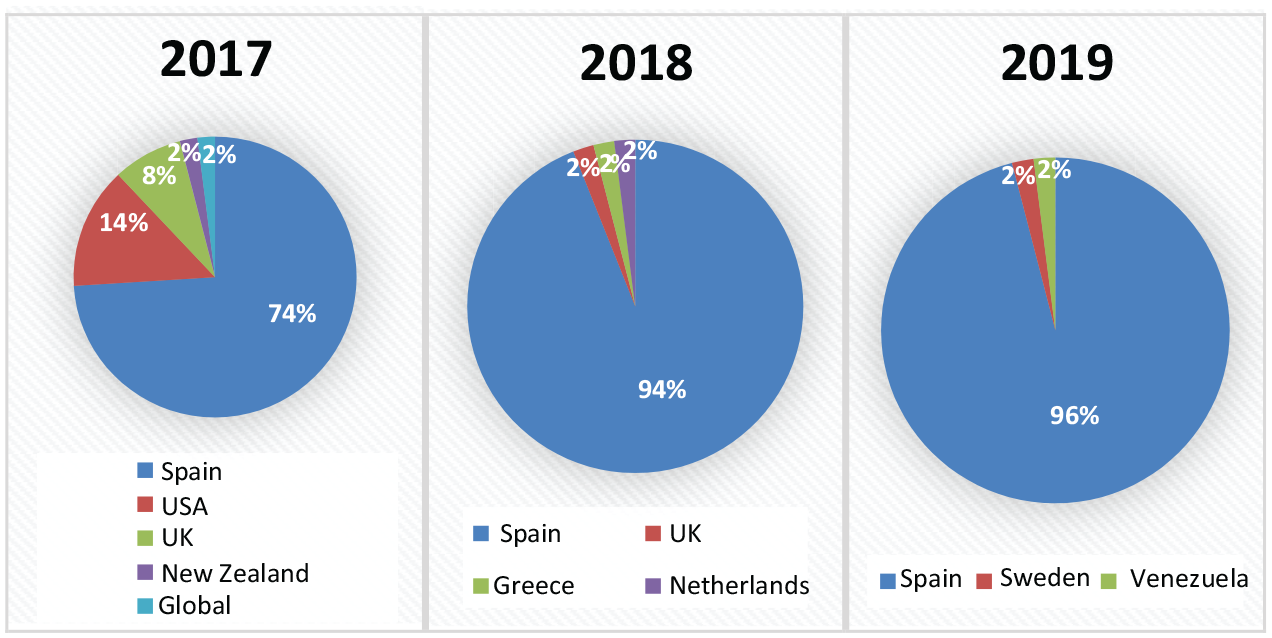
Country of origin of the accounts that the top 50 Spanish generalist media began to follow in 2017, 2018, and 2019.
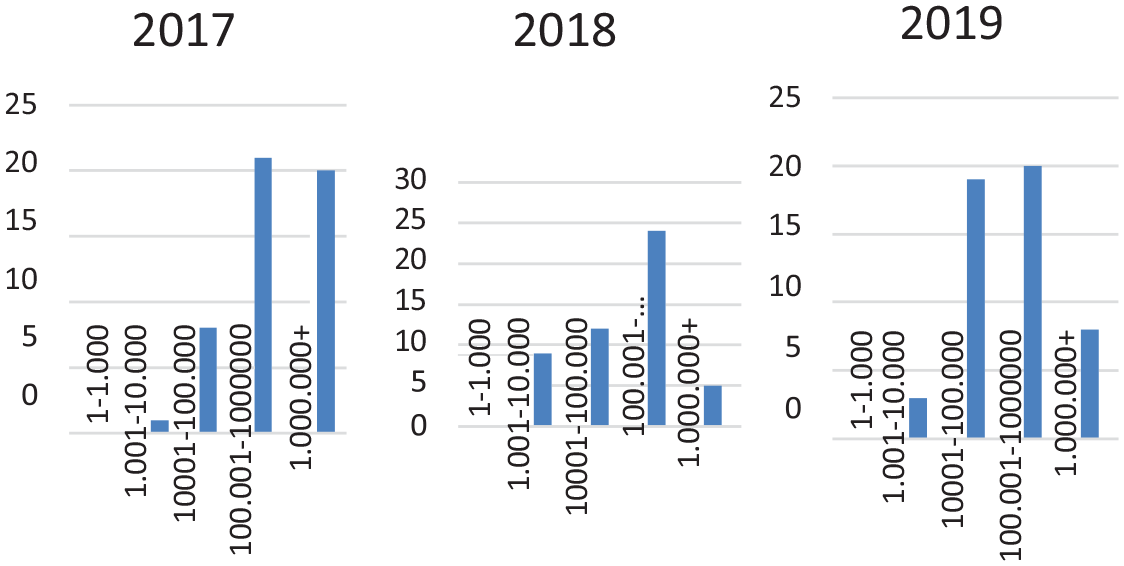
Number of followers of the accounts the top 50 generalist Spanish media with the most followers on Twitter started to follow in 2017, 2018, and 2019.

Percentage of the number of followers of the accounts the top 50 generalist Spanish media with the most followers on Twitter started to follow in 2017, 2018, and 2019.
Could this be read as a search to hear other voices? The emergence of the figure of the SMI could be interpreted as an analogous process, manifesting a social disposition toward listening to new, less institutional, less famous voices, more relatable to the citizenship (De Veirman et al., 2017). More people, less well-known, seem to be becoming more relevant.
The majority of the accounts the media started following belong to men. The tendency to follow men grew in 2018 and slightly decreased in 2019, with a ratio close to 70% to 30% in all the 3 years we analyzed (Figure 12). This seems to be in line with the fact that men tend to be more represented and have more presence in the media and the news (Armstrong, 2004; Armstrong & Gao, 2011; Caro González et al., 2014; Len-Ríos et al., 2005; López González, 2002; Shor et al., 2015), and in line with the fact that most of the sources used by the media tend to belong to man (Armstrong, 2004; Armstrong & Gao, 2011; Armstrong & Nelson, 2005; Bustamante, 1994; de Bruin, 2014; De Swert & Hooghe, 2010; Moreno-Castro et al., 2019; Zoch & Van Slyke Turk, 1998; Figures 13 and 14).
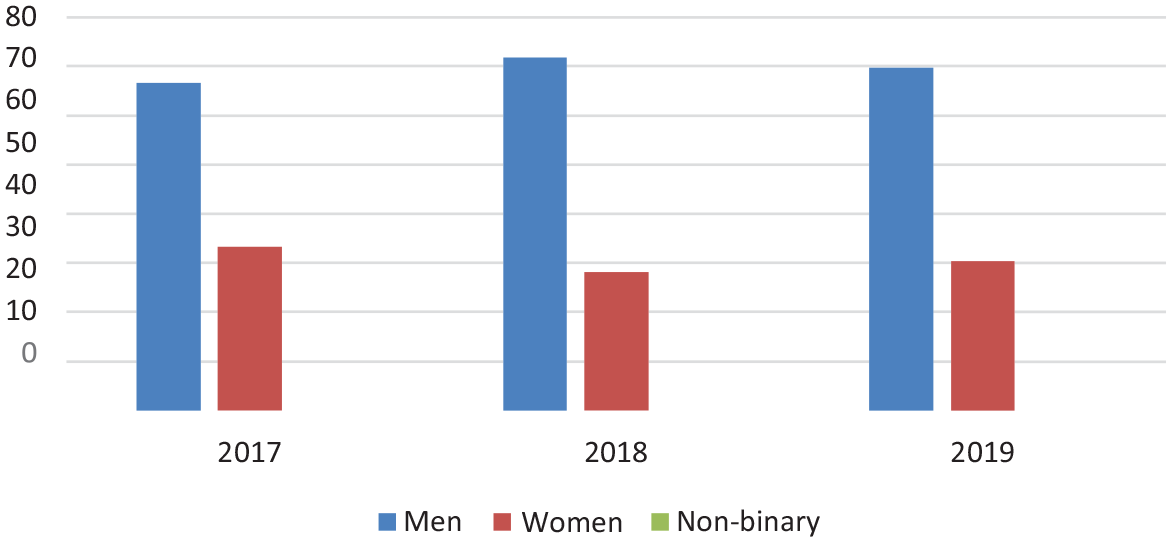
Gender type percentage in the citizenship accounts the top 50 generalist Spanish media with the most followers on Twitter started to follow in 2017, 2018, and 2019.

Gender tendency in the people accounts the top 50 generalist Spanish media with the most followers on Twitter started to follow in 2017, 2018, and 2019.
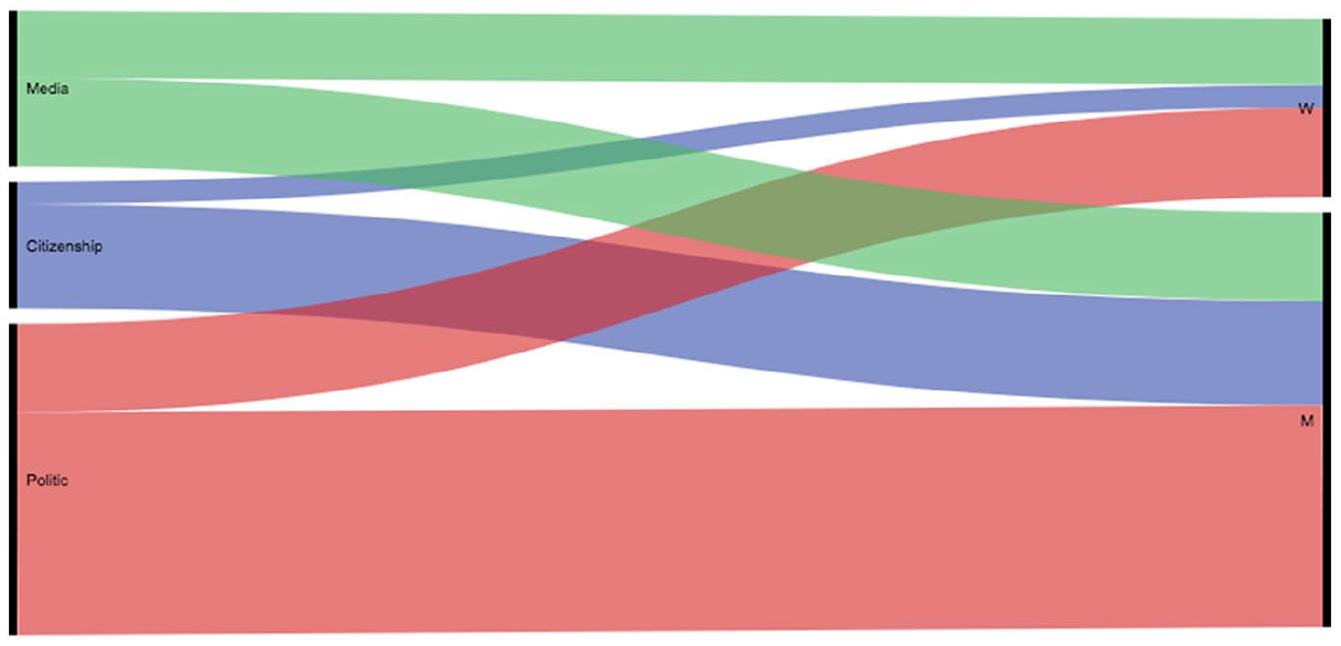
Gender per categories the top 50 generalist Spanish media with the most followers on Twitter started to follow in 2017, 2018, and 2019.
From the accounts that belong to women, most correspond to politicians (50%) and journalists (38%), whereas in the men accounts, even though the politicians accounts represent the 54% of the male citizens accounts, we can find a 25% of users compared with the 13% of users among women, as presented in Figure 15. Users include entrepreneurs, celebrities, influencers, and scholars among others. We can interpret this in relation to the fact that women may need to have a more established role to be followed by the media, while men may be followed for accomplishments in a broader range of areas, or it responds to the fact that women are underrepresented in power positions (Aaldering & Van Der Pas, 2018; Bode, 2016; Carli & Eagly, 2002; Connell, 2013; Kubu, 2017; Lombardo, 2008; Lovenduski, 2005; Madsen & Andrade, 2018; Painter-Morland, 2011), and media may follow the ones in power positions (Figure 16).

Percentage of subcategories per gender that the Top 50 generalist Spanish media with the most followers on Twitter started to follow.
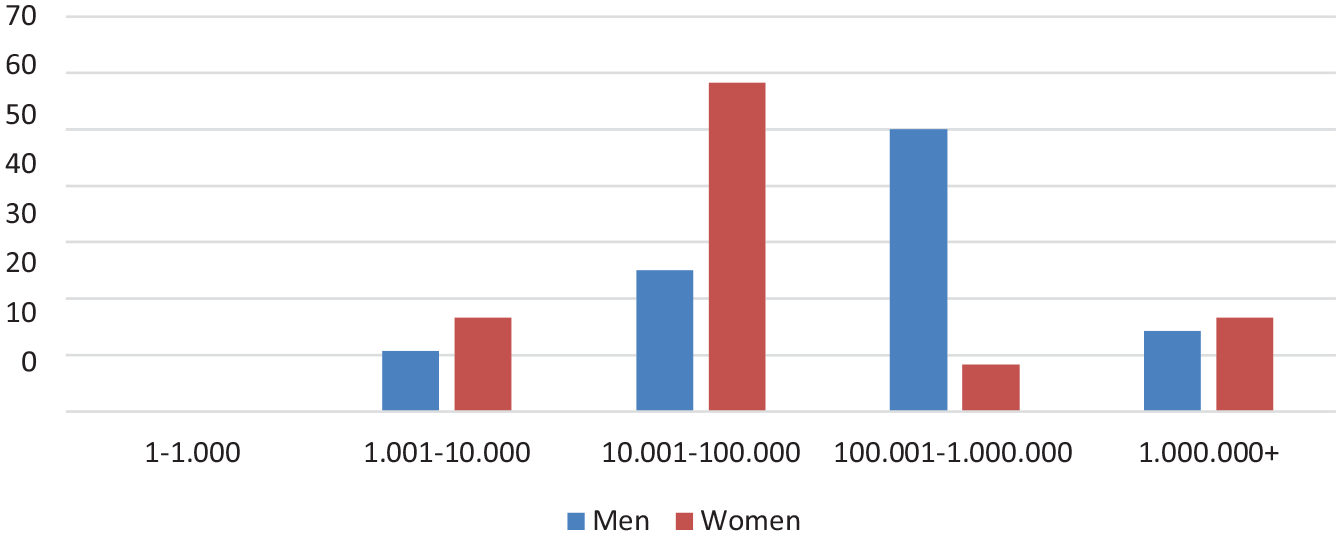
Percentage of number of followers per gender that the Top 50 generalist Spanish media with the most followers on Twitter started to follow.
Nonetheless, it has been pointed that the media not only responds and represents social and gender inequalities but magnify them with their misrepresentations and underrepresentations (Armstrong & Gao, 2011), perpetuating a symbolic annihilation of women (Tuchman, 1978, 2000). Moreover, contributing to maintain or even enlarge the inequalities as “Media attention has significant consequences in social stratification” (Shor et al., 2015, p. 960). These results also show concordance with previous research where it was found that despite the existence of a vast number of women experts in different areas (academia, business, science), they are usually much less consulted as experts or as sources than men (Caro González et al., 2014). There are many studies that demonstrate the fact that the media and journalists have predominantly used male sources over female sources over the years, which in turn has reinforced the male role in leadership and authority (Armstrong, 2004; Armstrong & Gao, 2011; Armstrong & Nelson, 2005; De Swert & Hooghe, 2010; Moreno-Castro et al., 2019; Zoch & Van Slyke Turk, 1998), as well as the mentioned overrepresentation of men in the core content of the news (Armstrong & Gao, 2011; Caro González et al., 2014; López González, 2002; Shor et al., 2015). In recent years, there has been an increase in female publishers and journalists (Caro González et al., 2014), however, in our study, we see how the media began to follow more men than women every year. We wonder who decides which accounts to follow in the media. Is it the media directors? The journalists or the intern on duty? Is it a strategic or an intuitive decision? Do they follow Twitter’s algorithmic recommendations? Does the gender of the person that decide who to follow affect who the media starts following?
In conclusion, between 2017 and 2019, the generalist media from Spain with the most followers on Twitter began to follow mostly political accounts from Spain and predominantly owned by men. An inversely proportional trend could be found between the following of accounts that belong to citizens or institutions, the latter representing the majority at the beginning of the studied period, whereas by 2019, we could see how the media began to follow a majority of citizenship accounts.
Congruently, the analyzed media mostly followed macro-influencers, and showed a tendency to follow less icon-influencers or accounts with more than a million followers, and to start following more accounts in the mid-influencers segment by the end of the studied period.
Footnotes
Declaration of Conflicting Interests
The author(s) declared no potential conflicts of interest with respect to the research, authorship, and/or publication of this article.
Funding
The author(s) disclosed receipt of the following financial support for the research, authorship, and/or publication of this article: The authors have received financial support from the Spanish Ministry of Economy, Industry, and Competitiveness, for this research as part of the project “Influencers in Political Communication in Spain. Analysis of the Relationships Between Opinion Leaders 2.0, Media, Parties, Institutions, and Audiences in the Digital Environment (R + D + Project). CSO2017-88620-PF.