
Abstract
Americans are convinced that employment stability has declined in recent decades, but previous research on this question has led to mixed conclusions. A key challenge is that trends for men and women are in opposite directions and appear to cancel each other out. We clarify this situation by examining trends in employer tenure by sex, marital status, and parental status. We find that married mothers are behind the increase in women’s job tenure, but men and never-married women have seen declines in tenure. Furthermore, we show that the timing of tenure trends for women parallels periods of increased labor force attachment. Finally, we find that shifts in industry and occupation composition can account for the decline in tenure among men and never-married women before 1996 but not afterward. We situate these diverging trends in two broad shifts in expectations, norms, and behaviors in the labor market: the end-of-work discourse and the revolution in women’s identification with paid work. Our findings support the view that job tenure is declining for all groups, but women’s greater labor force attachment, especially their more continuous employment around childbirth, countered and masked this trend.
Most Americans believe employment has become less stable over the past few decades. Initial research on the topic, however, has produced mixed results. In recent years, a more consistent picture has emerged, but diverging patterns by gender continue to present a puzzling element (Hollister 2011b; Marcotte 1995). Research indicates declining employment stability, specifically employer tenure (the number of years working for the same employer), for men but increasing tenure for women.
This article examines gendered patterns in employer tenure in closer detail, an undertaking vital to our interpretation of overall trends in the labor market. There are currently two competing views on these patterns. The first view combines results for men and women and therefore sees little overall change in the labor market. The second view perceives diverging patterns by gender as indicative of something specific to women. From this perspective, the results for men reflect the “true” trend in the labor market, while the effects of increasing labor force attachment counter this trend for women.
Adjudicating between these two perspectives is central to understanding recent labor market trends. We gain leverage on this question by comparing tenure trends among men and women separately by marital and parental status to distinguish the impact of women’s increasing labor force attachment from general labor market trends. We show that men’s tenure declined across marital and parental groups, but trends for women diverged sharply by marital and parental status: never-married non-mothers saw declines in employer tenure while married mothers saw increases. We further show that differences in these trends between the periods before and after 1996 parallel patterns in mothers’ labor force participation rates. These findings support the view that labor market stability is declining for all workers, but mothers’ increasing labor force attachment masks this trend.
In addition to documenting trends by marital and parental status, we explore how these changes came about. Advocates of the end-of-work perspective view the growth of employment instability as evidence of a fundamental change in employment relationships. It is possible, though, that job tenure trends are simply the byproduct of shifts in the mix of industries and occupations in today’s economy. The increase in job tenure among married mothers poses a similar question: Is this increase in tenure due to this group’s access to new types of jobs or does it reflect a broader change in labor market behaviors? We assess these competing explanations by examining whether composition shifts across occupations and industries can explain trends in tenure. We find that occupation and industry composition played a role in declining job tenure before 1996, but these factors cannot explain the rise in tenure among married mothers before 1996, nor the continued decline in tenure among men and never-married non-mothers after 1996.
We argue that these divergent patterns in job tenure point to two broad and fundamental shifts in expectations, norms, and behaviors in the U.S. labor market. The first shift is employers’ and workers’ increasing belief that they are no longer expected nor obligated to pursue long-term employment relationships. The second shift is a revolution in mothers’ behaviors and labor market expectations.
Two Fundamental Labor Market Shifts?
In the mid-1990s, a number of researchers began studying trends in employer tenure (Farber 1995; Neumark 2000; Rose 1995; Swinnerton and Wial 1995). These studies were in response to a growing sense in U.S. public opinion that a fundamental change had occurred in the U.S. labor market: in particular, a loss of stable jobs and a move toward employment instability. Many believed that practices such as corporate downsizing had broken the implicit contract of long-term commitment between employers and workers (Stone 2004). Once a few employers violated this contract, it created a widespread revolution in employers’ and workers’ expectations (Cappelli 1999; Osterman 1999; Uchitelle 2006). McKinley, Mone, and Barker (1998) point to the rise in an ideology of employee self-reliance based on the idea that workers should no longer count on employers for job security.
This ideology of employee self-reliance was not driven solely by employer practices but also reflected U.S. workers’ new expectations and behaviors. Scholars have pointed to new career models, all of which emphasize that in today’s labor market, employment instability is not only inevitable but can also be favorable, leading to upward mobility and personal fulfillment (Arthur and Rousseau 1996; Hall 2002; Handy 1989; Saxenian 1996). Much of the U.S. public and many scholars thus believe we have seen a fundamental change in how both employers and employees view the labor market and their roles in it. We will refer to this belief in a broad and widespread shift toward instability as the end-of-work perspective (Strangleman 2007).
Early studies on job tenure sought to empirically verify these claims, but results were not as clear-cut as expected. Researchers generally found declines in long-term employer tenure among men but little change or even increases in tenure among women (Bidwell 2013; Farber 1995; Hollister 2011a; Marcotte 1995; Neumark 2000; Rose 1995; Swinnerton and Wial 1995). Overall the studies did not find the drastic disappearance of stable jobs predicted by the end-of-work proponents, leading to the conclusion that “reports of the death of ‘the great American Job’ are greatly exaggerated” (Farber 1995:26; see also Neumark 2000).
If one accepts the position that combining results for men and women is the best indicator of job tenure in the labor market, then diverging trends by gender imply a shift in men’s and women’s relative labor market positions, with women possibly gaining at the expense of men. It suggests a limited number of stable jobs in the economy, and that men had high tenure in the past because they had a monopoly on these positions and excluded women. Indeed, segmented labor market theories posit that women and minorities were trapped in unstable secondary labor markets (Tolbert, Horan, and Beck 1980; Wallace and Kalleberg 1981). Women’s growing job tenure could thus reflect their movement out of the secondary labor market and into more favorable jobs.
In recent years, researchers have begun to express a new perspective on these findings (Farber 2009). In contrast to the earlier quote, Farber’s (2009:37) most recent analysis led him to a very different conclusion, namely that “job tenure and the incidence of long-term employment have declined sharply in the United States.” This reversal of opinion is partially due to new data analyses, however it also reflects a new interpretation of the results. Similar to his earlier analysis, Farber found in 2009 that tenure decreased for men but was level for women. Rather than combine results for men and women, Farber suggested this time that the women’s outcomes might be attributable to their increasing labor force attachment, which countered the general labor market shift toward decreasing tenure. His statements suggest that the trends for men reflect the “true” labor market situation.
Farber’s new stance implies that women’s tenure patterns reflect a shift independent from the broad trend toward employment instability, but he does not explore this question further. The increase in women’s labor force participation is a well-known and well-documented fact. Studies point to numerous factors contributing to increased employment (Casper and Bianchi 2002; Goldin 2006; Goldin and Katz 2002; Levy 1998; Sayer, Cohen, and Casper 2004; Shelton and John 1996; Williams and Cohen Cooper 2004), but scholars also note a fundamental cultural shift in work expectations for women. Goldin (2006) argues that long-term trends throughout the twentieth century laid the groundwork for women’s participation in the labor market, but the period since the 1970s marks a true (but quiet) revolution in women’s relationships to the labor market:
It was a change from [women] who work because they and their families “need the money” to those who are employed, at least in part, because occupation and employment define one’s fundamental identity and societal worth. (Goldin 2006:12)
Women’s increased job tenure, which we examine here, may reflect this fundamental change in women’s orientations toward work. We will use Goldin’s term revolution to refer to this possibility.
Figure 1 presents the proportion of men and women age 25 to 54 years who were employed over time by marital status and (for women) age of youngest child. 1 The figure clearly demonstrates the dramatic rise in women’s labor force attachment since the 1970s, but with some interesting variation by marital and parental status. Married women (top panel) saw large increases in employment between the 1970s and mid-1990s. Married women with infants saw a particularly dramatic 35 percentage point increase. After the mid-1990s, this progress stalled and employment levels even dropped slightly in recent years. Previous studies have noted this stalling (Cohany and Sok 2007; Cotter, Hermsen, and Vanneman 2004; Percheski 2008; Smith 2008), which also occurred in terms of occupational segregation and wage inequality (Bianchi, Robinson, and Milkie 2007; Cohen, Huffman, and Knauer 2009; England 2006, 2010). Furthermore, Cotter, Hermsen, and Vanneman (2011) found a stalling in the movement toward more equal gender role attitudes among women, which suggests this trend may not solely reflect blocked opportunities within the labor market but may also indicate that the revolution in women’s views toward work lost momentum over the 1990s.

Employment Rates by Marital Status and Age of Youngest Child
Never-married women present very different employment patterns. Never-married mothers saw much smaller increases in employment through the mid-1990s, a dramatic rise in employment after 1996, due in part to welfare reform and a strong economy, and moderate declines since 2000 (Blank 2000; England 2010). Never-married non-mothers exhibited high levels of employment even in the 1970s and actually saw moderate declines in employment levels over time. Results for men are similar to never-married non-mothers, with moderate declines in employment over the entire period, especially for men without children.
Employment trends thus vary by gender, marital status, and parental status, but it is not clear how these trends relate to job tenure. Indeed, mothers’ increasing employment might decrease average tenure levels because newly employed mothers might have low levels of labor force commitment and therefore less stable employment. Similarly, declining employment levels among men and never-married non-mothers may increase job tenure levels if those individuals leaving the labor market have the most tenuous and unstable work histories.
We take a different perspective on the impact of employment rates. We see mothers’ rising employment as an indicator of the underlying revolution in women’s orientation toward paid work identified by Goldin and others. This new orientation toward paid work not only increased employment but also changed women’s employment behaviors, especially around childbirth. Marriage and childbirth historically resulted in job exits for women (Smith, Downs, and O’Connell 2001), reducing job tenure by ending currently held jobs and restarting the tenure clock of mothers reentering the labor market. Changing employment patterns around the period of childbirth, therefore, would likely result in longer tenure.
A number of indicators provide evidence of women’s greater continuity of employment around childbirth. The most obvious is the large increase after the 1970s in labor force participation rates of married mothers with infants (see Figure 1) (Bielby and Bielby 1984; Goldin 2006). Women are also working into their first pregnancy longer and returning to work more quickly after their first birth (Klerman and Leibowitz 1999; Smith et al. 2001). In the 1980s, a job quit around the time of a first birth was common; today, however, women are more likely to maintain employment after childbirth (Laughlin 2011; Sorensen 1983). In addition, studies of trends in women’s work experience have found an increase in the proportion of years worked, providing evidence of greater labor force continuity (O’Neill and Polachek 1993; Rexroat 1992; Rosenfeld 1996). Few researchers, however, have examined job tenure (i.e., remaining with the same employer), the focus of our research. Studies that specifically analyze job returns after the first birth show that the majority of women who continue paid employment return to the same employer (Klerman and Leibowitz 1999; Smith et al. 2001). These trends in combination are suggestive of longer job tenure.
Workplace changes and accommodations have likely supported job continuity among mothers. With a rise in access to job flexibility and family-friendly workplace policies (Golden 2002), working mothers may increasingly have the flexibility they need to remain with the same employer while also caring for children. For example, Glass and Riley (1998) found that formal and informal employer policies and a supportive work environment increased job continuity following childbirth (for similar findings, see Baker and Milligan 2008).
Passage of the Family Medical Leave Act (FMLA) in 1993 should, in theory, have increased job tenure among women because it guaranteed job protection by mandating up to 12 weeks of unpaid leave at the time of a birth, adoption, or to care for an ill family member. Research on the effect of the FMLA, however, is mixed. Hofferth and Curtin (2006), using longitudinal data, found that women who gave birth post-FMLA returned to work more quickly and usually returned to their same job. Other research, however, found no effect or minimal effects on employment, work, leave-taking, and wages (Baum 2003a, 2003b; Han and Waldfogel 2003; Klerman and Leibowitz 1997; Waldfogel 1999). The FMLA only covers employees of firms with 50 or more employees who have worked with their employer for at least one year and 1,250 hours of work. In addition, several states passed differing versions of the FMLA during the 1980s and 1990s (Baum 2006), and many employers were already providing paid or unpaid leave, so some workers had access to a considerable amount of leave prior to the FMLA’s passage (Klerman and Leibowitz 1999). Another perspective on the FMLA, therefore, is that rather than ushering in dramatic new changes in the workplace, it represents a codification of shifts in society’s attitudes toward women and work that had emerged over several decades.
Such fundamental shifts in attitudes toward women and work, if true, might explain the opposing trends of job tenure by gender and support Farber’s (2009) more recent interpretation of these patterns. Women’s increasing tenure levels over time may be a reflection of their changing outlook and behavior and employer accommodations around childbirth, rather than the result of specific opportunities in the labor market. Although it is tempting to combine results for men and women into a single overall trend in tenure, we argue that these conflicting trends reflect two simultaneous, but separate, broad shifts in the labor market. These two shifts originated from different causes but each brought about a fundamental revolution in labor market norms. Because these shifts have opposing consequences in terms of job tenure, it is possible that the labor market saw a widespread disappearance of stable jobs over time, but mothers’ increasing continuity of employment countered and masked this trend for women.
We test these claims by separating trends in job tenure not only by gender but also by marital and parental status. Research by Stewart (2000) suggests this approach may be fruitful. Stewart examined trends in one-year employment transitions, measuring the percent of workers employed in one year who transitioned to another job (EE), unemployment (EU), or out of the labor force (EN). He found very similar patterns between men and women in EE and EU transitions, but a sharp decline in EN transitions among women. Furthermore, he found this decline in EN transitions occurred only among married women. Stewart’s research, however, did not explore how these short-term transitions affected job tenure levels.
Nor did Stewart examine parental status, a key element of the analysis presented here. The sharp increase in the labor force participation rate of married mothers with infants (see Figure 1) suggests married mothers’ employment patterns may be driving women’s increased tenure. A central prediction of this study, therefore, is that we expect to find diverging patterns in tenure by both marital and parental status, with the increase in tenure driven by married mothers. In contrast, we do not expect marital or parental status to play a major role in men’s tenure patterns.
Figure 1 further suggests that employment trends for women were not constant over time. Married women experienced the greatest increase in labor force attachment before 1996, while never-married mothers saw a large jump in employment after 1996. As discussed earlier, we expect to find a relationship between the increasing labor force participation of these subgroups of women and rising tenure levels due to more continuous work at the time of childbirth. In this study, however, we are not able to directly test whether the increase in tenure is specifically due to employment behaviors around childbirth. Our primary goal is to discern whether these patterns are due to changes among women as a whole or are more specifically linked to martial and parental status.
Changing Jobs or Changing Behaviors?
The end-of-work narrative describes broad shifts in labor market behaviors by both employers and workers due to the breaking of the implicit contract of long-term commitment and the emergence of new expectations and norms. However, even if job tenure has declined, this trend may not be due to such sweeping changes in behaviors. Perhaps some jobs are more intrinsically stable than others because of the skills required for the job or the nature of the production process. It is possible that job tenure levels within occupations and industries have remained the same, and change has only occurred because of a shift in the mix of jobs held by workers. The dramatic decline in manufacturing and the rise of service industries (Smith and Tickamyer 2011) would be an obvious source of such change. Preliminary analysis confirmed that manufacturing jobs tend to have longer tenure and service jobs have shorter average tenure; this sectoral shift should therefore reduce tenure. To explain the diverging trends by gender, these industry and occupation shifts would have to disproportionately affect one group over the other. In the case of the transition from manufacturing to service industries, men may have been disproportionately affected because they were more likely to hold manufacturing jobs. Therefore, while the end-of-work narrative predicts broad changes occurring within all job types, an alternative explanation is that the decline in tenure was due to shifts in the prevalence of different jobs.
A similar phenomenon could be behind the rise in job tenure among women. Research shows that occupations are highly segregated by gender (Bielby and Baron 1986; Cotter et al. 2001; England 1981; Jacobs 1989). Recent decades have brought improvements in labor market opportunities for women, including declining occupational and workplace segregation (Jacobs 1989; Tomaskovic-Devey et al. 2006). If women’s new opportunities tend to be in intrinsically more stable occupations, this may explain their longer tenures. If this were the case, women’s rising tenures would still reflect changing gender norms in society (e.g., the fact that society is now willing to accept female professors), but it would imply a different sort of change. The increase in job tenure would be less about women’s changing employment patterns within all jobs, and more about their access to specific new positions that typically have longer tenure.
It is not a given, though, that traditionally male jobs are more stable. Our preliminary analysis found that the percent of an occupation that is female does have a small negative correlation with tenure, but semi-professional occupations, primarily teachers and nurses, have relatively high levels of tenure. The impact of any occupation and industry shifts on women’s tenure is therefore unclear and needs to be assessed empirically.
In addition, to explain differences in tenure trends by parental and marital status among women, occupation or industry changes would have to be specific to the marital and parental group. A central question explored in this article, therefore, is the extent to which occupation and industry shifts can explain the tenure patterns we identify. This analysis will provide insights into the extent to which these trends are really the result of broad revolutions in labor market behavior.
Data
The Current Population Survey (CPS) has included questions about employer tenure in a number of survey supplements. The most consistent of these series are data collected in the January and February CPS supplements in 1983, 1987, 1991, and even years 1996 to 2012 (Unicon Research Corporation 2013). We used the 1983 to 2008 years of this series for our regression analysis. We chose to omit 2010 and 2012 from the regressions due to the 2007 to 2009 recession’s impact on tenure levels, which we discuss as a separate topic at the end of the results section.
The descriptive analysis presented in the figures includes data from a number of additional CPS supplements, but the employer tenure questions in these additional series are not consistent. As the results make clear, these variations do have an effect on the tenure measure, so we kept each data source separate in the graphs. At the same time, the story that emerges across these sources is quite consistent. Inclusion of these multiple sources, therefore, provides reassurance on the findings as well as a longer time span. Additional data sources include (1) January/February supplements in 1971, 1978, and 1981 (Unicon Research Corporation 2013); (2) data from the pension and benefit supplements collected in April or May of 1979, 1983, 1988, and 1993 (National Bureau of Economic Research 2011); and (3) contingent work supplements from February 1995, 1997, 1999, 2001, and 2005 (Unicon Research Corporation 2013).
We limited the sample to respondents age 30 to 50 years old to capture individuals in their prime working years. Younger workers have not had time to build up job tenure, so they have very low average tenure across all time periods with little room for change over time. This lack of trends for younger workers becomes particularly problematic when comparing marital and parental status because of differences in these groups’ age compositions. Our models control for age and will therefore account for the effects of shifts over time in age compositions, but measures of trends in job tenure will still average these trends across age groups, putting more weight on ages with greater numbers in the marital and parental group. Never-married individuals tend to be younger and therefore estimates of trends over time for never-married groups will be dominated by these younger individuals who have seen little change in tenure over time. We also excluded older workers because, as we will discuss, our parental status measure does not capture parents with older children and therefore may misclassify older adults. We reran the analysis using a wider age range of 25 to 54 years and found only small differences in the results. 2 For further justification of our choice of ages and for the full results from the 25- to 54-year-old sample, see the online supplement (http://asr.sagepub.com/supplemental).
We further limited the analysis to individuals who were currently employed and not self-employed. Limiting the analysis to employed individuals may create a selection problem. We partially addressed this problem by controlling for national and state unemployment rates. In terms of long-term trends in labor force participation, one would expect men’s declining labor force participation to, if anything, increase average tenure levels, and women’s increasing labor force participation should reduce their tenure. Selection due to labor force participation, therefore, should actually create a more stringent test of our hypotheses.
Measures
Tenure
The dependent variable in this study is employer tenure measured in years. The main data series used in the regression analysis measures tenure by asking respondents about the number of years spent working continuously for the current employer. For individuals who reported less than a year, we assigned them a value of half a year.
Year
The purpose of this study is to measure change over time, as captured by the year variable. In regression models, this measure is years elapsed since 1983.
Marital status
We divided marital status into four categories: married, separated, divorced/widowed, and never married. We included all four categories in our regression models; we only report results for married and never-married individuals because they are the focus of this study and estimates for separated and widowed/divorced fall in between these two groups.
Parental status
We determined parental status using household composition and relationship variables. We prioritized uniformity of measurement over time, and therefore based the measure on the more limited household relationship information available in earlier survey years. We created the variable by identifying children (under age 18) in each family group and counted as parents any individual in the family who was between 14 and 40 years older than that child. We tested our measure against a more sophisticated one using detailed household relationship information available in later survey years. The two measures agreed in 98 percent of cases. The two earliest surveys used in the graphs, 1973 and 1978, do not include children under age 14, so parental status cannot be assessed in those years.
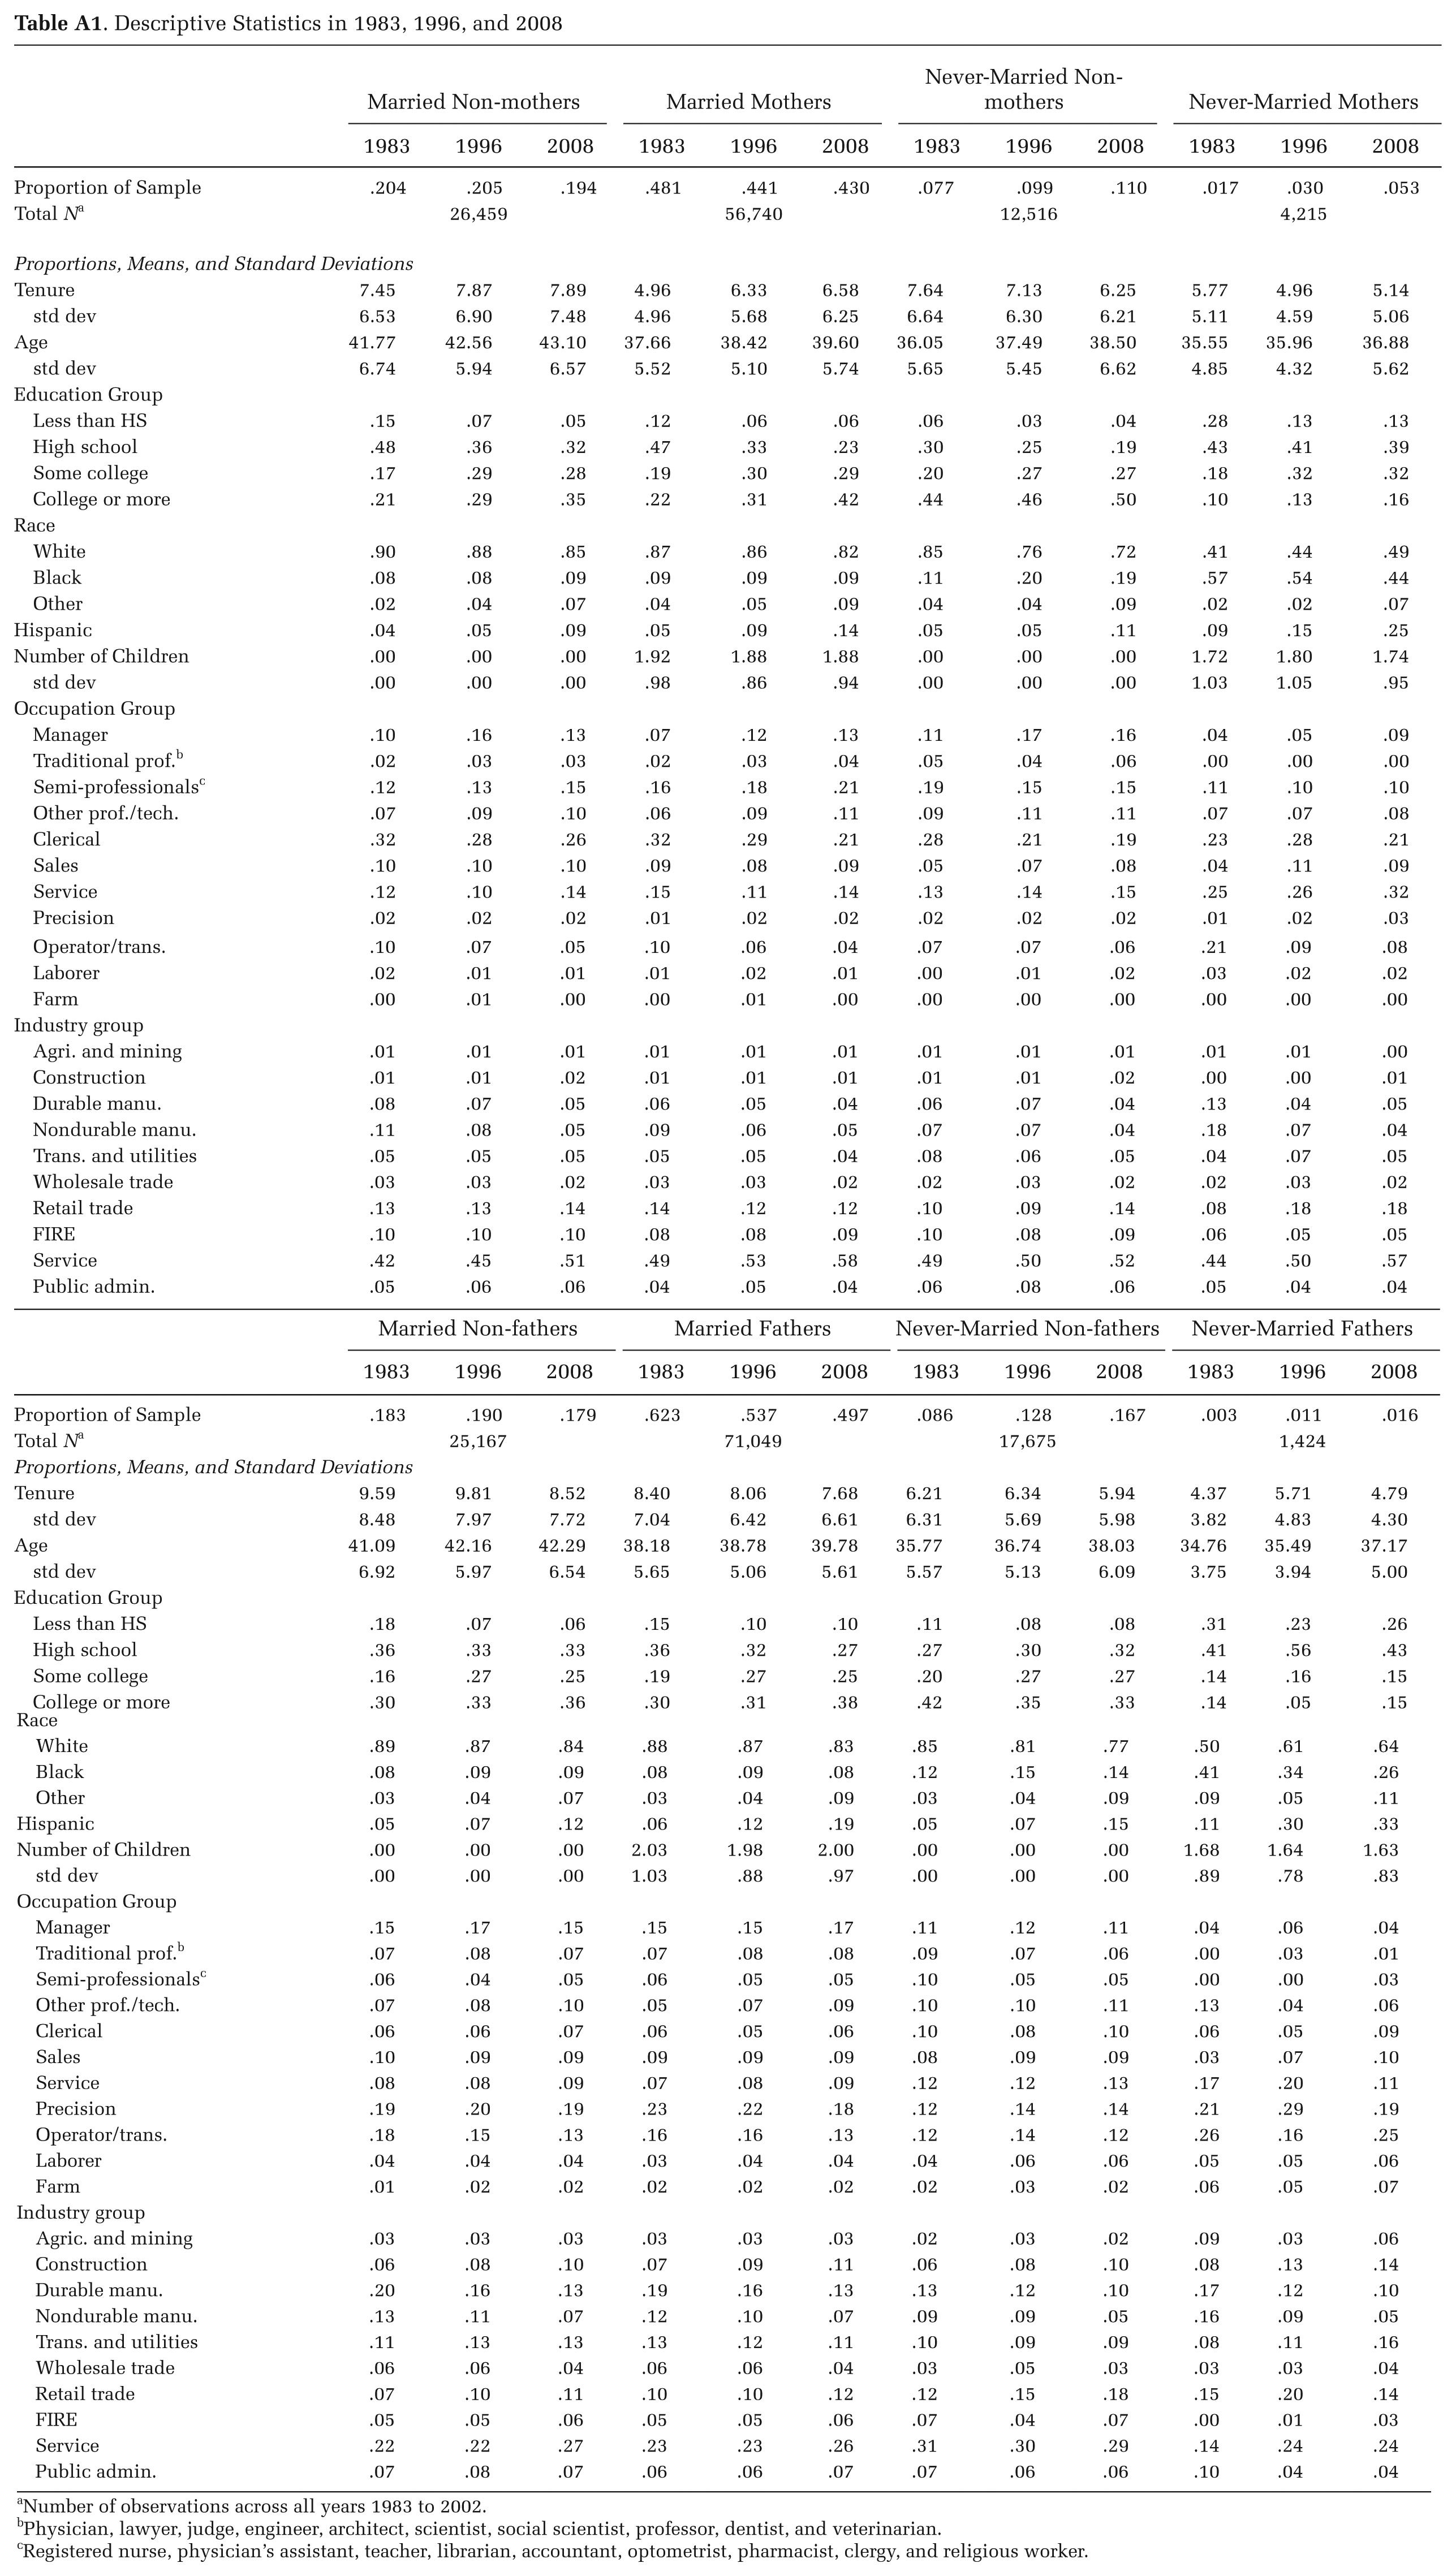
Note that the parental status measure relies on the presence of children under age 18 in the household and therefore will not count parents with adult children or children who are not living in the household. This restriction means we miss most never-married fathers because they do not typically live with their children. Indeed, only 1 percent of male respondents were counted as never-married fathers. Results for this group are therefore unreliable and we do not report them in the figures or tables. Table A1 in the Appendix provides information on sample sizes for each of the marital by parental status groups.
Occupations and industries
We included controls for detailed occupation and industry codes in the regression models (382 occupation codes and 236 industries). We used a common coding scheme developed by Integrated Public Use Microdata Series (IPUMS-USA 2011) to account for changes in coding systems over the study period. 3
Additional control variables
We included a number of control variables in the analysis due to their potential relationship to job tenure and to account for changes in patterns of marriage and childbirth over time that are not uniform across levels of socioeconomic status. Controls include measures of age (and the square of age), four levels of education (less than high school, high school, some college, and college or more), and indicator variables for race (white, black, and other) and Hispanic origin. We also controlled for the number of children (and number of children squared). This measure accounts for declines in the fertility rate over time. 4 Finally, we included as a control a measure of the unemployment rate in January of the survey year at the national and state levels. Table A1 in the Appendix provides the means and standard deviations of the variables in 1983, 1996, and 2008 by gender, marital status, and parental status.
Methods
We measured trends in employer tenure by estimating regression models with years of tenure as the dependent variable and a linear spline of survey year as the key independent variable. The slope of the year variables estimates the annual change in average job tenure, controlling for the other variables in the model. The linear spline allows the slope of the year variable to take on different values before and after 1996. 5 The first model estimates tenure trends by gender:

Where
tenure = number of years of tenure
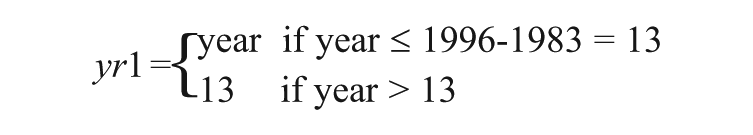

female = dummy variable for female
X = control variables 6
Note two important aspects of this equation. First, the spline creates two year variables. The first variable estimates a linear time trend for the period before 1996, and the second estimates a separate slope after 1996 with the requirement that the two lines join in 1996. We also estimated a spline in which the coefficient for the second period was measured as the difference from the slope in the first period. We used results of this additional analysis to indicate on the tables the cases where slopes in the two time periods are significantly different.
The second important aspect of Equation 1 is that it does not contain baseline effects for the year variables; instead, it includes interactions between these variables and both the male and female dummy variables. This approach is similar to a regression model with no constant. Rather than excluding the constant for the whole model, though, we only exclude the baseline year variables in the interactions. This method leads to exactly the same underlying values as traditional interactions, but here the coefficients represent the annual trend in tenure for each group separately, rather than expressing them as differences from a baseline group. We took this approach because of the large differences in trends between many of the subgroups. For instance, we see a statistically significant increase in job tenure among women but a statistically significant decline among men. The difference between the two groups, which would be captured by a traditional interaction, is obviously statistically significant and our goal is instead to understand each trend independently. This approach is similar to estimating separate regressions for each subgroup, but in this case the remaining control variables are constrained to have the same effects across all groups. We also conducted the analysis using traditional interaction variables and note statistically significant differences between groups in the tables.
A second model examines trends by marital and parental status. We estimated the following model separately by gender:
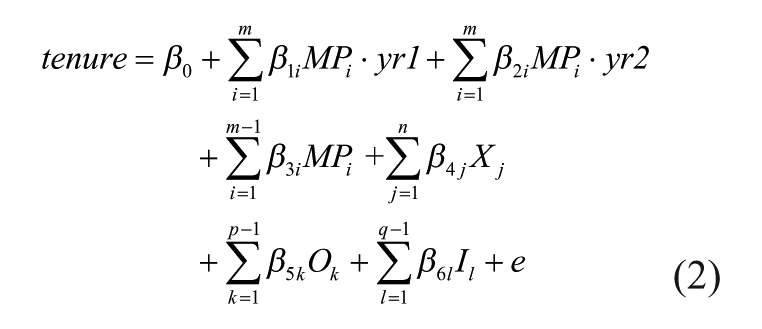
Where
MP = a set of indicator variables for marital and parental status (m = 8, four marital categories by parental status)
O = a set of indicator variables for detailed occupation codes (p = 382)
I = a set of indicator variables for detailed industry codes (q = 236)
This model has a similar structure as Equation 1. In this case it estimates time trends in each period for each of the marital and parental status groups. The model also adds occupation and industry dummy variables as controls. Slopes for these variables measure the average tenure level within each occupation and industry group over the entire time period but do not allow these effects to vary over time. The model therefore accounts for the fact that some occupations and industries may be intrinsically more stable than others. If employment has shifted from more stable toward less stable jobs, for instance, then these occupation and industry controls will account for effects of such shifts on overall tenure levels. Any effect remaining after inclusion of these controls will indicate changes in tenure occurring within detailed occupation and industry groups. In an additional analysis, discussed briefly at the end of this article, we estimated separate trends in tenure within occupation and industry groups.
Our estimates used clustered standard errors by year. We also tested models with random and fixed effects by year and obtained similar results. 7 We used survey weights in the regressions but rescaled the weights so that each year was weighted equally. Finally, in a number of cases we were interested in the change in the year coefficient after the addition of control variables. We used seemingly unrelated estimation techniques to test the statistical significance of such changes. We found that in almost all cases the differences in coefficients were statistically significant, even in situations where the change was not substantively meaningful.
Results
Figure 2 presents the weighted average of employer tenure overall and by gender in the various CPS supplements. Bold lines in the figure highlight the January and February supplements that are the basis of the regression analysis. The other supplements vary slightly in their measures of average tenure, but the overall picture is consistent. The figure’s top panel shows results when men and women were combined into a single average. This is the level trend that led researchers to conclude that concern about employment instability was unjustified. The bottom panel displays results separately by gender: average tenure declined among men, dropping from 8.3 years in 1983 to 7.3 years in 2008, and rose among women, from 5.8 to 6.6 years during this period. Although not huge, the trends are steady and consistent.
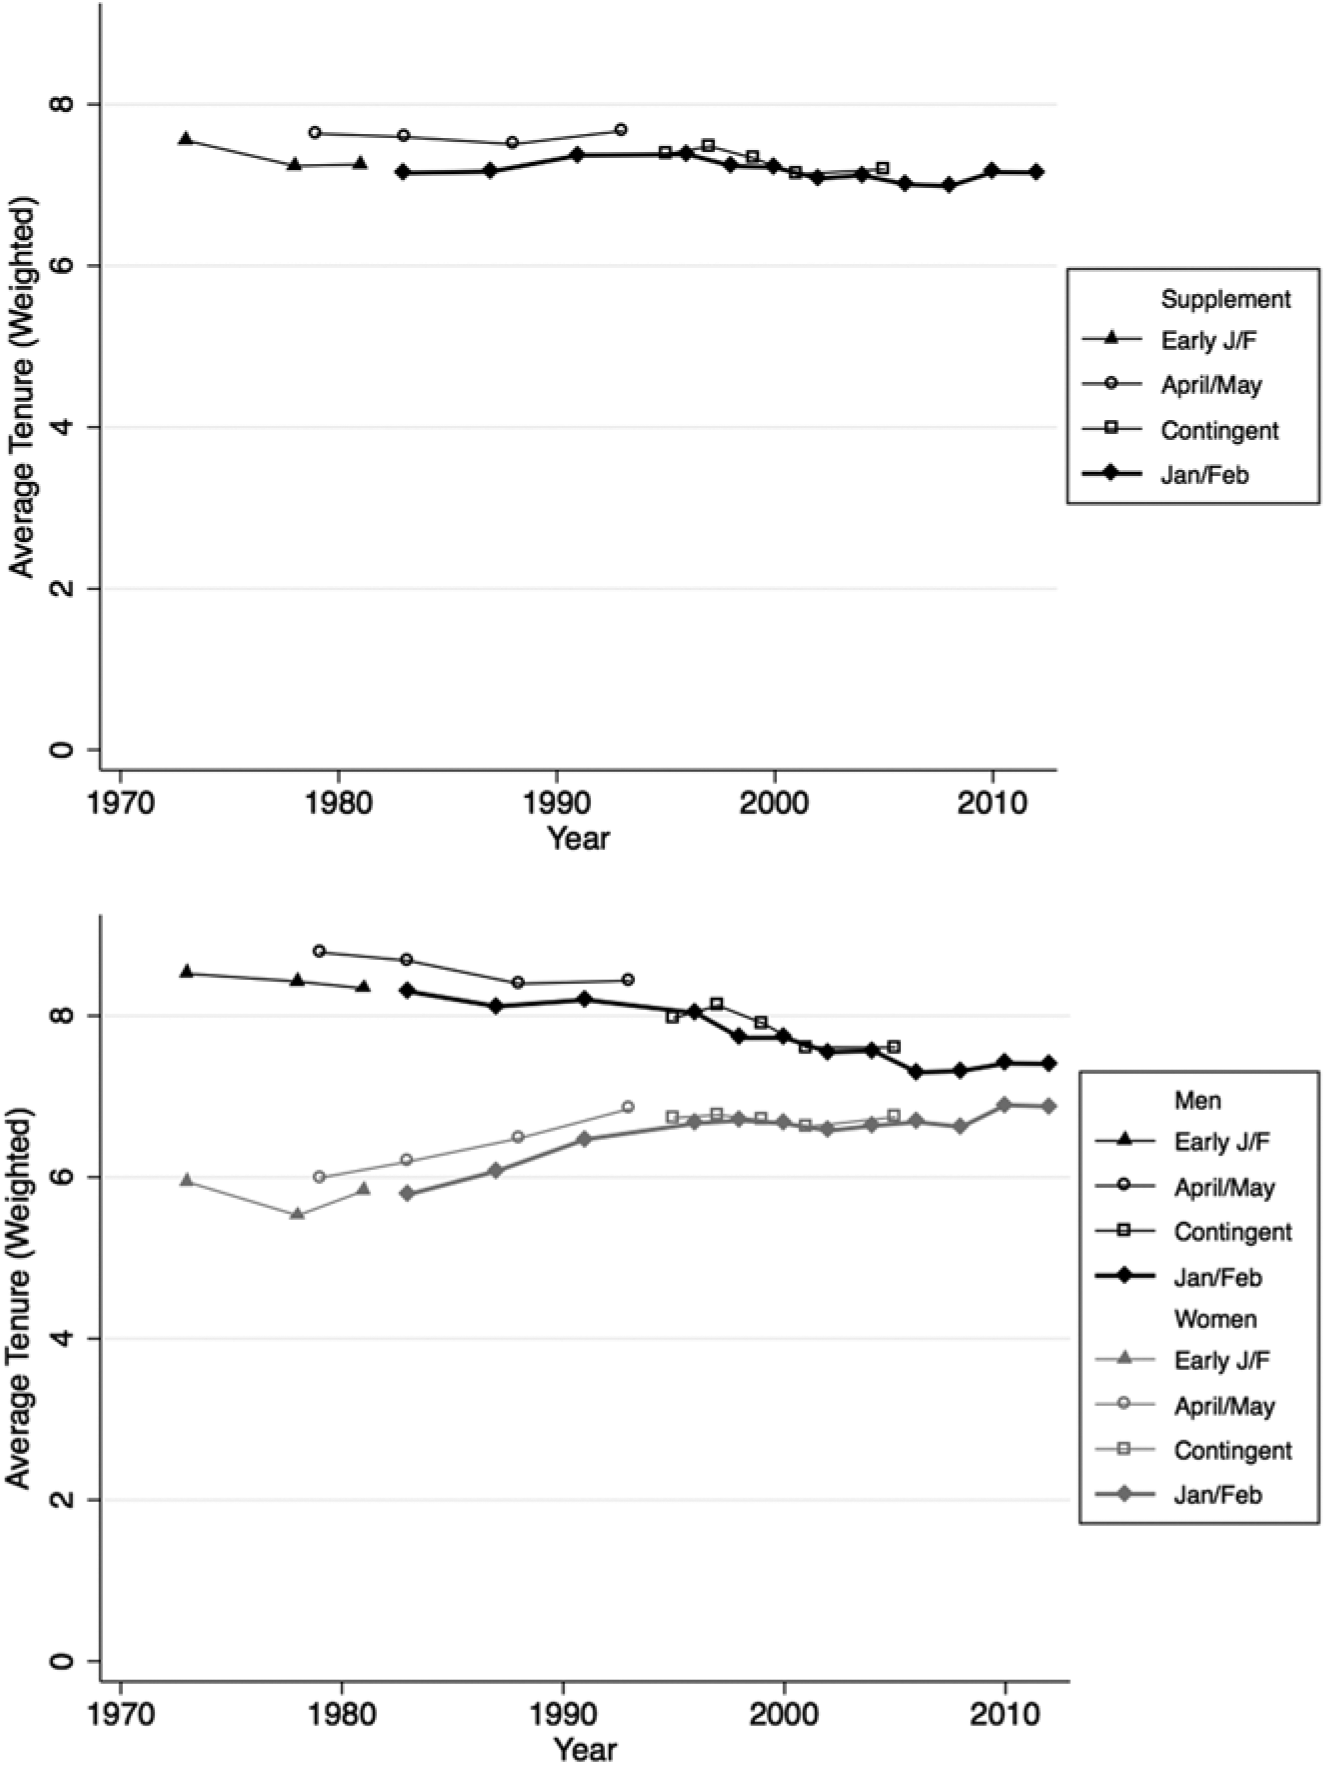
Trends in Average Tenure Overall and by Gender in CPS Supplements, 1973 to 2012, Weighted Values
Table 1 presents results of a regression model estimating separate trends for men and women before and after 1996. Model 1 estimates for the period before 1996 find a moderate but significant decline in job tenure among men and a significant increase among women. The period after 1996 finds larger negative trends for men and no significant trend for women. The slope for women after 1996 is significantly different from its pre-1996 levels (as indicated by the plus sign). In both time periods, slopes for women are significantly different from slopes for men (as indicated by the carets).
Estimates of Annual Change in Job Tenure for Men and Women from an OLS Linear Spline, 1983 to 2008

Note: N = 260,415. Weighted estimates with clustered standard errors by year. Models also include constant and baseline effect for female. Standard errors are in parentheses.
Post-1996 year slope significantly different from pre-1996 year slope.
Year slope significantly different from men in this period.
p < .05 (two-tailed test).
Model 2 in Table 1 adds controls for age, education, racial and ethnic background, number of children, and the unemployment rate. Inclusion of these controls shifts downward all the time trends in both periods. A more detailed analysis (not shown) found that age controls were the main cause of these shifts due to the aging of the baby boom generation increasing the average age of U.S. workers. Because older people tend to have higher levels of job tenure, one would expect the older population would increase average tenure. The negative trend for men is therefore all the more surprising, and the positive trend for women in the first period is partly explained by age. The difference between trends by gender, however, remains statistically significant in both time periods, so the controls do little to explain the diverging trends.
Figure 3 provides a new perspective on these results, breaking down tenure patterns by marital and parental status. The top panel presents results for women. Mothers, both married and never married, had considerably shorter job tenures than their counterparts who were not mothers. Trends for never-married women, both mothers and non-mothers, were slightly negative, and married women clearly saw increases in tenure. Men show clear downward trends for married fathers and married non-fathers and a moderate decline for never-married non-fathers.
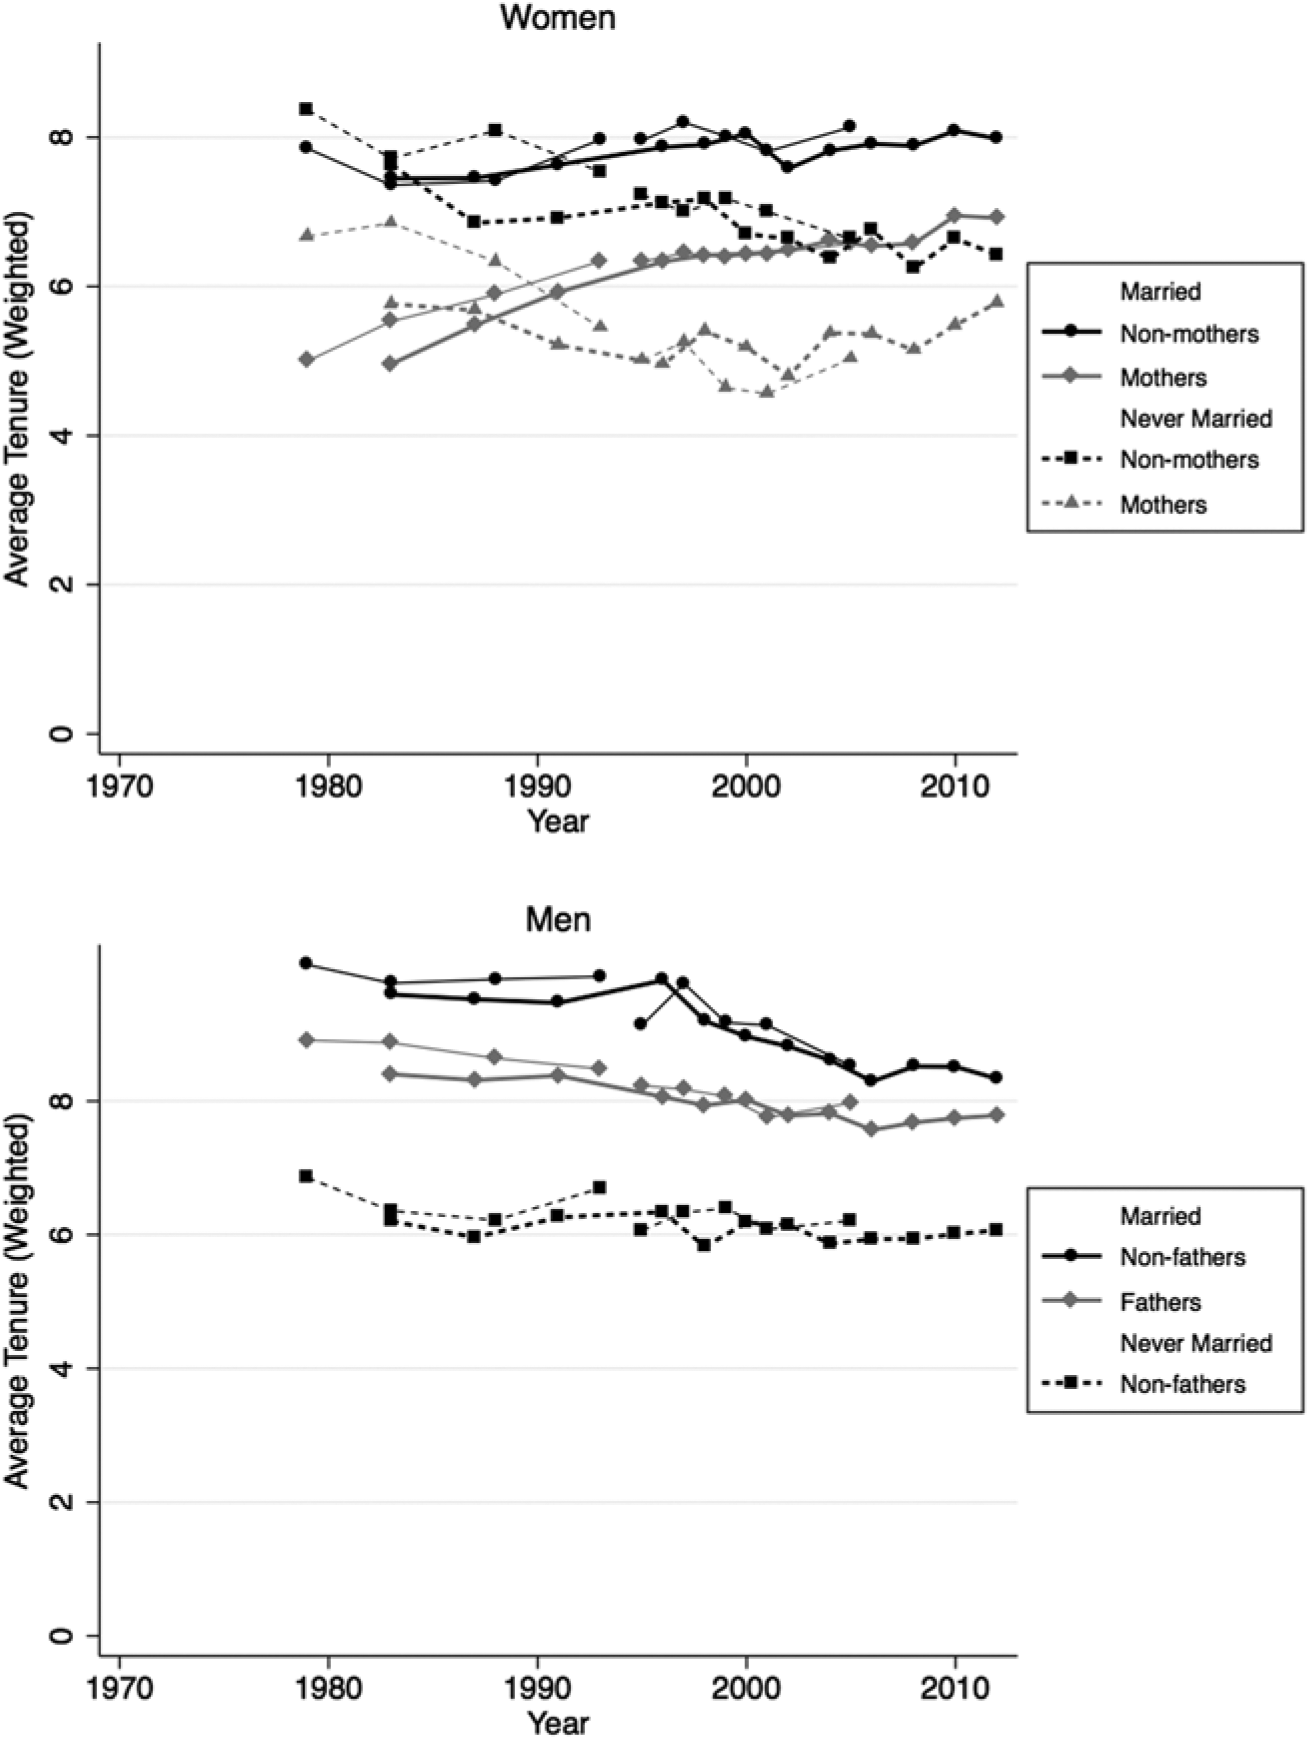
Trends in Average Tenure by Parental and Marital Status in Four CPS Supplement Series, 1973 to 2012, Weighted Values
Tables 2 and 3 present regression results by parental and marital status for women and men, respectively. Model 3 in the tables (3a for women and 3b for men) calculates trends in tenure within each marital and parental group without controls. Focusing first on women during the period before 1996, the first two rows in Model 3a (Table 2) show that married women, mothers and non-mothers, saw statistically significant increases over time in job tenure before 1996. The third and fourth rows find negative slopes for never-married women, although only the slope for never-married mothers is statistically significant.
Estimates of Annual Change in Job Tenure for Women by Parental and Marital Status from an OLS Linear Spline, 1983 to 2008

Note: N = 127,295. Weighted estimates with clustered standard errors by year. Models also include year coefficients for separated and divorced/widowed, baseline effects for marital and parental status, and a constant. Standard errors are in parentheses.
Post-1996 year slope significantly different from pre-1996 year slope.
Year slope significantly different from married non-mother in this period.
p < .05 (two-tailed test).
OLS Estimates for Men of Annual Change in Job Tenure by Parental and Marital Status, 1983 to 2008

Note: N = 133,120. Weighted estimates with clustered standard errors by year. Models also include year coefficients for separated, divorced/widowed, and never-married fathers; baseline effects for marital and parental status; and a constant. Standard errors are in parentheses.
Post-1996 year slope significantly different from pre-1996 year slope.
Year slope significantly different from married non-father in this period.
p < .05 (two-tailed test).
Model 4a in Table 2 adds the control variables to the model. Similar to Table 1, this addition shifts all the time trends to more negative values. The trend for married mothers before 1996 remains positive and statistically significant, but the positive coefficient for married non-mothers during this period becomes statistically insignificant. As the caret symbols in the table show, the coefficient for married non-mothers after addition of the controls is still significantly different from the values for both groups of never-married women. Therefore, although married mothers saw the most dramatic increase in job tenure, results still indicate diverging patterns among women by marital status. For never-married women, the inclusion of controls in Model 4a shifted coefficients for before 1996 even more negative, making the slope for never-married non-mothers statistically significant.
Estimates among women for the period after 1996 display a very interesting pattern. Trends for non-mothers were not significantly different from the pre-1996 period. Both groups of mothers, in contrast, saw significant changes in slopes after 1996 but in opposite directions. The positive trend among married mothers became much smaller after 1996 (Model 3a) and was even slightly negative after inclusion of controls (Model 4a). Never-married mothers, however, went from a negative trend in tenure before 1996 to a slight positive trend after 1996. In both cases these changes in slopes between the two periods are statistically significant, as indicated by the plus symbols in the table. These results are consistent with patterns of mothers’ employment rates shown in Figure 1; the increase in married mothers’ employment leveled off in the late 1990s, and never-married mothers saw large increases in employment in the late 1990s. This correlation between job tenure patterns and labor force participation rates is consistent with the hypothesis that the labor market became less stable over this period for all groups, but periods of sharp increases in orientation toward work among mothers, and therefore their greater continuity of employment, countered this trend.
Models 3b and 4b in Table 3 examine these trends for men. Results for the pre-1996 period find moderate negative trends for men after inclusion of the controls. Results for the second time period find even larger negative trends for men after 1996.
In summary, after inclusion of demographic and education controls, never-married non-mothers and men saw declines in average tenure over both time periods. These results support the end-of-work hypothesis that the overall pattern in the labor market has been a decline in job tenure. Results for married women and mothers suggest that marital and parental status may have countered and masked this decline. Married mothers saw increases in tenure in the period before 1996 when labor force participation was increasing for this group. Never-married mothers similarly diverged from the general decline in tenure, with a small increase after 1996 when their labor force participation increased. The fact that married mothers saw the largest increase in tenure supports the hypothesis of increasing employment continuity around childbirth for women.
Shifts across Occupations and Industries
Models 5 and 6 in Tables 2 and 3 explore whether trends in tenure by gender, marital, and parental status can be explained by shifts in the types of jobs held by one or more of these groups. Model 5 adds a set of dummy variables for detailed occupation groups and Model 6 includes dummy variables for detailed industries as well. Including these variables accounts for trends due to workers shifting between more and less stable occupations and industries. Any remaining trends after inclusion of these variables will be due to changes within detailed occupations and industries.
Results show that in both time periods, for men and women of all marital and parental statuses, adding the occupation and industry controls shifts the year coefficients to less negative values. This result indicates that occupation and industry compositions shifted toward less stable positions in both periods for all groups. Additional analyses (not shown) revealed that approximately one-third to one-half of the effect of industry controls was due to shifts between major industry groups, in particular the decline of manufacturing and the rise of the service industry, supporting the view that sectoral shifts played a role in moving toward less stable jobs. In contrast, effects of the occupation controls primarily occurred at the detailed occupation level, with much smaller effects due to shifts between major occupations.
Because all groups moved toward less stable jobs, the occupation and industry controls do little to explain the diverging trends in tenure between groups. Occupation and industry controls also do not explain the rise in tenure among married mothers before 1996. Counter to the prediction that married mothers increased their tenure by accessing new types of jobs and careers, results show that, if anything, they increased their tenure despite moderate shifts toward less stable jobs.
Regression results do show, though, that a substantial portion of the decline in tenure among never-married women and men can be explained by occupation and industry shifts, especially in the pre-1996 period. Models 6a and 6b show that negative trends before 1996 for these groups are no longer statistically significant after addition of the occupation and industry controls. The decrease in average tenure during this period, therefore, can be attributed to the loss of traditionally stable jobs and the growth of less stable positions. The post-1996 period, however, tells a different story. During this second period, occupation and industry controls still account for some of the negative trends, but negative trends remain for men and never-married non-mothers even after adding these controls in this second period. They therefore cannot fully explain the decline in tenure after 1996; tenure decreased within detailed occupation and industry groups during this period.
Trends within Occupation, Industry, and Education Groups
The fact that significant trends remain after controlling for occupation, industry, and education indicates that changes occurred within job types. This does not necessarily mean, though, that trends were equal within all jobs. The literatures on the end-of-work and the revolution among women both discuss widespread behavioral changes and thus would predict that these trends occurred within a broad range of job types. It is possible, however, that these average trends were instead driven by changes in just a few, select types of jobs. As an additional analysis, we therefore estimated trends in tenure separately by major education, occupation, and industry groups, allowing for separate tenure trends within each group (available upon request). Briefly, the results indicated that the increase in tenure among married mothers before 1996 and the decline in tenure among men in both periods were remarkably consistent within a broad range of education, occupation, and industry groups. 8 These trends were thus not limited to specific types of workers.
The Great Recession
A final question to consider is the impact of the Great Recession on job tenure levels. Research by Hollister (2011b) found that, unexpectedly, job tenure levels increased in 2010 with the recession. She found this increase was due to a combination of fewer people quitting jobs and fewer new hires. As Figures 1, 2, and 3 indicate, this pattern continued through 2012, with particularly strong increases in tenure for women. A separate analysis (available upon request) found that although the recession had slightly different effects by gender, there were few differences by marital or parental status. In contrast to results presented here, these findings suggest that changes in tenure were driven by the economy rather than by family arrangements. The puzzling aspect of these findings is that previous recessions did not seem to have similar effects on job tenure levels (the figures show remarkably little cyclicality). These results thus suggest that the Great Recession has had a distinctive impact on job tenure outcomes, especially for women. Mattingly and Smith (2010) found that wives of husbands who stopped working during the recession increased their labor supply, which may be a contributing factor in women’s increased job tenure during this recession. More time will need to pass before we can assess the recession’s long-term ramifications for job stability.
Conclusions
Previous research found a divergence in tenure patterns by gender. Our analysis illuminates this divergence by demonstrating it was driven by changes specific to married women and mothers. The consistent pattern of declining employer tenure among men and never-married women suggests they represent the broad job tenure pattern in the labor market, and that a separate phenomenon at times countered this decline for married women and mothers. Furthermore, the timing of increases in tenure among mothers corresponds to their periods of rising labor force participation, providing further evidence that the increase in tenure for women was likely tied to increased employment continuity.
The end-of-work narrative describes the decline in job tenure as an economy-wide change in behavior rather than simply the outcome of shifts in types of positions in the labor market. Our analysis provides a mixed conclusion on this question. The results demonstrate that shifts in work across different occupations and industry sectors appear to explain most of the decline in job tenure among men and never-married women in the period before 1996. From 1996 to 2008, however, occupation and industry composition can no longer account for these groups’ continued decline in tenure. This pattern is reminiscent of the two-stage model from organizational institutionalism (Tolbert and Zucker 1983). Under this model, in the first stage, adoption of a practice is correlated with specific predictors, but as adoption spreads the practice gains legitimacy and the initial predictors are no longer relevant. In the case of declining job tenure, it is possible that initial reductions in tenure were tied to economic restructuring. As the disappearance of stable jobs gained public attention, this attention created a much broader end-of-work narrative. The late 1990s and 2000s may have brought a new set of expectations and behaviors by employers and workers alike. Further tests are necessary to confirm this story. Additional research would also be valuable in exploring how the recent recession may have led to yet a new stage of behaviors and expectations around job stability.
Married mothers, meanwhile, experienced a strong increase in job tenure before 1996. The occupation and industry controls were unable to explain this rise, indicating that it occurred within detailed industries and occupations. The widespread nature of this increase, as well as its timing corresponding to the rise in married mothers’ labor force participation before 1996, suggest a fundamental shift in the relationship between marriage, childbirth, and paid work among women. The pattern fits well with Goldin’s (2006) theory of a revolution in women’s employment since the 1970s, in particular a much stronger identification with work and therefore more continuous work around the time of childbirth. Broader societal changes may also have supported this shift, as social norms became more accepting of mothers’ employment and employers felt pressure to adopt more family-friendly policies. One might have expected passage of the FMLA in 1993 to be a particularly important factor in this trend. Instead, we found that job tenure trends leveled off over the 1990s. 9 The FMLA appears to have marked the culmination of societal shifts rather than having acted as the driver, which may also be due to the fact that many workers are not covered by the FMLA. Furthermore, our finding that the rise in married mothers’ job tenure halted after 1996 adds to the growing body of evidence of women’s stalling equality in the 1990s.
The trend of longer tenure among married women points to two areas for future research. First, it would be beneficial to understand the exact relationship between married mothers’ growing labor force participation rates and job tenure. Our hypothesis is that married mothers saw longer tenures primarily due to greater continuity of employment around childbirth. Further research is needed to fully document and understand this relationship. Such analysis would require longitudinal data with information both before and after childbirth to fully assess the process.
A second line of research examining the economic consequences of increasing tenure among married women would add to our growing knowledge about the gender wage gap. Traditionally, longer tenure with an employer brings economic benefits. Women, however, tend to have lower economic returns to tenure than do men (Munasinghe, Reif, and Henriques 2008), and our research indicates married mothers did not increase their tenure by moving into new occupations that might provide better rewards for tenure. On the other hand, married women’s earnings and their earnings relative to their husbands have been increasing (Smith 2012). Future research should consider how married women’s rising tenure might or might not have brought about favorable economic returns.
Finally, our analysis resolves the confusion that arose from initial studies of job tenure. Our findings support Farber’s (2009) later view that combining trends for men and women is not the best approach. The negative trends in job tenure for men and never-married women support the view that the labor market is shifting toward short-term work arrangements and employment instability, but the separate force of increasing job commitment and continuity countered this effect for married women and mothers. During periods of strong increases in labor force attachment, this pattern overwhelmed the underlying negative trend.
Confusion over the early tenure results had the unfortunate impact of stalling further investigation in this field. A number of researchers have theorized about the potential consequences of a decline in stable work for individual careers, families, and society as a whole (Bauman 2005; Kalleberg 2009; Sennett 1998, 2006, 2008). Few of these theories have been tested empirically, however, because it was not clear that the decline in employment stability was real. Our results suggest research on these questions is indeed justified, but one must consider the interaction between this trend of increased employment instability and women’s greater commitment to the labor market.
Footnotes
Appendix
Descriptive Statistics in 1983, 1996, and 2008
| Married Non-mothers |
Married Mothers |
Never-Married Non-mothers |
Never-Married Mothers |
|||||||||
|---|---|---|---|---|---|---|---|---|---|---|---|---|
| 1983 | 1996 | 2008 | 1983 | 1996 | 2008 | 1983 | 1996 | 2008 | 1983 | 1996 | 2008 | |
| Proportion of Sample | .204 | .205 | .194 | .481 | .441 | .430 | .077 | .099 | .110 | .017 | .030 | .053 |
| Total N a | 26,459 | 56,740 | 12,516 | 4,215 | ||||||||
| Proportions, Means, and Standard Deviations | ||||||||||||
| Tenure | 7.45 | 7.87 | 7.89 | 4.96 | 6.33 | 6.58 | 7.64 | 7.13 | 6.25 | 5.77 | 4.96 | 5.14 |
| std dev | 6.53 | 6.90 | 7.48 | 4.96 | 5.68 | 6.25 | 6.64 | 6.30 | 6.21 | 5.11 | 4.59 | 5.06 |
| Age | 41.77 | 42.56 | 43.10 | 37.66 | 38.42 | 39.60 | 36.05 | 37.49 | 38.50 | 35.55 | 35.96 | 36.88 |
| std dev | 6.74 | 5.94 | 6.57 | 5.52 | 5.10 | 5.74 | 5.65 | 5.45 | 6.62 | 4.85 | 4.32 | 5.62 |
| Education Group | ||||||||||||
| Less than HS | .15 | .07 | .05 | .12 | .06 | .06 | .06 | .03 | .04 | .28 | .13 | .13 |
| High school | .48 | .36 | .32 | .47 | .33 | .23 | .30 | .25 | .19 | .43 | .41 | .39 |
| Some college | .17 | .29 | .28 | .19 | .30 | .29 | .20 | .27 | .27 | .18 | .32 | .32 |
| College or more | .21 | .29 | .35 | .22 | .31 | .42 | .44 | .46 | .50 | .10 | .13 | .16 |
| Race | ||||||||||||
| White | .90 | .88 | .85 | .87 | .86 | .82 | .85 | .76 | .72 | .41 | .44 | .49 |
| Black | .08 | .08 | .09 | .09 | .09 | .09 | .11 | .20 | .19 | .57 | .54 | .44 |
| Other | .02 | .04 | .07 | .04 | .05 | .09 | .04 | .04 | .09 | .02 | .02 | .07 |
| Hispanic | .04 | .05 | .09 | .05 | .09 | .14 | .05 | .05 | .11 | .09 | .15 | .25 |
| Number of Children | .00 | .00 | .00 | 1.92 | 1.88 | 1.88 | .00 | .00 | .00 | 1.72 | 1.80 | 1.74 |
| std dev | .00 | .00 | .00 | .98 | .86 | .94 | .00 | .00 | .00 | 1.03 | 1.05 | .95 |
| Occupation Group | ||||||||||||
| Manager | .10 | .16 | .13 | .07 | .12 | .13 | .11 | .17 | .16 | .04 | .05 | .09 |
| Traditional prof. b | .02 | .03 | .03 | .02 | .03 | .04 | .05 | .04 | .06 | .00 | .00 | .00 |
| Semi-professionals c | .12 | .13 | .15 | .16 | .18 | .21 | .19 | .15 | .15 | .11 | .10 | .10 |
| Other prof./tech. | .07 | .09 | .10 | .06 | .09 | .11 | .09 | .11 | .11 | .07 | .07 | .08 |
| Clerical | .32 | .28 | .26 | .32 | .29 | .21 | .28 | .21 | .19 | .23 | .28 | .21 |
| Sales | .10 | .10 | .10 | .09 | .08 | .09 | .05 | .07 | .08 | .04 | .11 | .09 |
| Service | .12 | .10 | .14 | .15 | .11 | .14 | .13 | .14 | .15 | .25 | .26 | .32 |
| Precision | .02 | .02 | .02 | .01 | .02 | .02 | .02 | .02 | .02 | .01 | .02 | .03 |
| Operator/trans. | .10 | .07 | .05 | .10 | .06 | .04 | .07 | .07 | .06 | .21 | .09 | .08 |
| Laborer | .02 | .01 | .01 | .01 | .02 | .01 | .00 | .01 | .02 | .03 | .02 | .02 |
| Farm | .00 | .01 | .00 | .00 | .01 | .00 | .00 | .00 | .00 | .00 | .00 | .00 |
| Industry group | ||||||||||||
| Agri. and mining | .01 | .01 | .01 | .01 | .01 | .01 | .01 | .01 | .01 | .01 | .01 | .00 |
| Construction | .01 | .01 | .02 | .01 | .01 | .01 | .01 | .01 | .02 | .00 | .00 | .01 |
| Durable manu. | .08 | .07 | .05 | .06 | .05 | .04 | .06 | .07 | .04 | .13 | .04 | .05 |
| Nondurable manu. | .11 | .08 | .05 | .09 | .06 | .05 | .07 | .07 | .04 | .18 | .07 | .04 |
| Trans. and utilities | .05 | .05 | .05 | .05 | .05 | .04 | .08 | .06 | .05 | .04 | .07 | .05 |
| Wholesale trade | .03 | .03 | .02 | .03 | .03 | .02 | .02 | .03 | .02 | .02 | .03 | .02 |
| Retail trade | .13 | .13 | .14 | .14 | .12 | .12 | .10 | .09 | .14 | .08 | .18 | .18 |
| FIRE | .10 | .10 | .10 | .08 | .08 | .09 | .10 | .08 | .09 | .06 | .05 | .05 |
| Service | .42 | .45 | .51 | .49 | .53 | .58 | .49 | .50 | .52 | .44 | .50 | .57 |
| Public admin. | .05 | .06 | .06 | .04 | .05 | .04 | .06 | .08 | .06 | .05 | .04 | .04 |
| Married Non-fathers |
Married Fathers |
Never-Married Non-fathers |
Never-Married Fathers |
|||||||||
| 1983 | 1996 | 2008 | 1983 | 1996 | 2008 | 1983 | 1996 | 2008 | 1983 | 1996 | 2008 | |
| Proportion of Sample | .183 | .190 | .179 | .623 | .537 | .497 | .086 | .128 | .167 | .003 | .011 | .016 |
| Total N a | 25,167 | 71,049 | 17,675 | 1,424 | ||||||||
| Proportions, Means, and Standard Deviations | ||||||||||||
| Tenure | 9.59 | 9.81 | 8.52 | 8.40 | 8.06 | 7.68 | 6.21 | 6.34 | 5.94 | 4.37 | 5.71 | 4.79 |
| std dev | 8.48 | 7.97 | 7.72 | 7.04 | 6.42 | 6.61 | 6.31 | 5.69 | 5.98 | 3.82 | 4.83 | 4.30 |
| Age | 41.09 | 42.16 | 42.29 | 38.18 | 38.78 | 39.78 | 35.77 | 36.74 | 38.03 | 34.76 | 35.49 | 37.17 |
| std dev | 6.92 | 5.97 | 6.54 | 5.65 | 5.06 | 5.61 | 5.57 | 5.13 | 6.09 | 3.75 | 3.94 | 5.00 |
| Education Group | ||||||||||||
| Less than HS | .18 | .07 | .06 | .15 | .10 | .10 | .11 | .08 | .08 | .31 | .23 | .26 |
| High school | .36 | .33 | .33 | .36 | .32 | .27 | .27 | .30 | .32 | .41 | .56 | .43 |
| Some college | .16 | .27 | .25 | .19 | .27 | .25 | .20 | .27 | .27 | .14 | .16 | .15 |
| College or more | .30 | .33 | .36 | .30 | .31 | .38 | .42 | .35 | .33 | .14 | .05 | .15 |
| Race | ||||||||||||
| White | .89 | .87 | .84 | .88 | .87 | .83 | .85 | .81 | .77 | .50 | .61 | .64 |
| Black | .08 | .09 | .09 | .08 | .09 | .08 | .12 | .15 | .14 | .41 | .34 | .26 |
| Other | .03 | .04 | .07 | .03 | .04 | .09 | .03 | .04 | .09 | .09 | .05 | .11 |
| Hispanic | .05 | .07 | .12 | .06 | .12 | .19 | .05 | .07 | .15 | .11 | .30 | .33 |
| Number of Children | .00 | .00 | .00 | 2.03 | 1.98 | 2.00 | .00 | .00 | .00 | 1.68 | 1.64 | 1.63 |
| std dev | .00 | .00 | .00 | 1.03 | .88 | .97 | .00 | .00 | .00 | .89 | .78 | .83 |
| Occupation Group | ||||||||||||
| Manager | .15 | .17 | .15 | .15 | .15 | .17 | .11 | .12 | .11 | .04 | .06 | .04 |
| Traditional prof. b | .07 | .08 | .07 | .07 | .08 | .08 | .09 | .07 | .06 | .00 | .03 | .01 |
| Semi-professionals c | .06 | .04 | .05 | .06 | .05 | .05 | .10 | .05 | .05 | .00 | .00 | .03 |
| Other prof./tech. | .07 | .08 | .10 | .05 | .07 | .09 | .10 | .10 | .11 | .13 | .04 | .06 |
| Clerical | .06 | .06 | .07 | .06 | .05 | .06 | .10 | .08 | .10 | .06 | .05 | .09 |
| Sales | .10 | .09 | .09 | .09 | .09 | .09 | .08 | .09 | .09 | .03 | .07 | .10 |
| Service | .08 | .08 | .09 | .07 | .08 | .09 | .12 | .12 | .13 | .17 | .20 | .11 |
| Precision | .19 | .20 | .19 | .23 | .22 | .18 | .12 | .14 | .14 | .21 | .29 | .19 |
| Operator/trans. | .18 | .15 | .13 | .16 | .16 | .13 | .12 | .14 | .12 | .26 | .16 | .25 |
| Laborer | .04 | .04 | .04 | .03 | .04 | .04 | .04 | .06 | .06 | .05 | .05 | .06 |
| Farm | .01 | .02 | .02 | .02 | .02 | .02 | .02 | .03 | .02 | .06 | .05 | .07 |
| Industry group | ||||||||||||
| Agric. and mining | .03 | .03 | .03 | .03 | .03 | .03 | .02 | .03 | .02 | .09 | .03 | .06 |
| Construction | .06 | .08 | .10 | .07 | .09 | .11 | .06 | .08 | .10 | .08 | .13 | .14 |
| Durable manu. | .20 | .16 | .13 | .19 | .16 | .13 | .13 | .12 | .10 | .17 | .12 | .10 |
| Nondurable manu. | .13 | .11 | .07 | .12 | .10 | .07 | .09 | .09 | .05 | .16 | .09 | .05 |
| Trans. and utilities | .11 | .13 | .13 | .13 | .12 | .11 | .10 | .09 | .09 | .08 | .11 | .16 |
| Wholesale trade | .06 | .06 | .04 | .06 | .06 | .04 | .03 | .05 | .03 | .03 | .03 | .04 |
| Retail trade | .07 | .10 | .11 | .10 | .10 | .12 | .12 | .15 | .18 | .15 | .20 | .14 |
| FIRE | .05 | .05 | .06 | .05 | .05 | .06 | .07 | .04 | .07 | .00 | .01 | .03 |
| Service | .22 | .22 | .27 | .23 | .23 | .26 | .31 | .30 | .29 | .14 | .24 | .24 |
| Public admin. | .07 | .08 | .07 | .06 | .06 | .07 | .07 | .06 | .06 | .10 | .04 | .04 |
Number of observations across all years 1983 to 2002.
Physician, lawyer, judge, engineer, architect, scientist, social scientist, professor, dentist, and veterinarian.
Registered nurse, physician’s assistant, teacher, librarian, accountant, optometrist, pharmacist, clergy, and religious worker.
Acknowledgements
The authors would like to thank Arne Kalleberg, the anonymous reviewers, and the editors for their valuable input.
Notes
References
Supplementary Material
Please find the following supplemental material available below.
For Open Access articles published under a Creative Commons License, all supplemental material carries the same license as the article it is associated with.
For non-Open Access articles published, all supplemental material carries a non-exclusive license, and permission requests for re-use of supplemental material or any part of supplemental material shall be sent directly to the copyright owner as specified in the copyright notice associated with the article.