
Abstract
Despite rapid changes in women’s educational attainment and continuous labor force experience, convergence in the gender gap in wages slowed in the 1990s and stalled in the 2000s. Using CPS data from 1979 to 2009, we show that convergence in the gender gap in hourly pay over these three decades was attenuated by the increasing prevalence of “overwork” (defined as working 50 or more hours per week) and the rising hourly wage returns to overwork. Because a greater proportion of men engage in overwork, these changes raised men’s wages relative to women’s and exacerbated the gender wage gap by an estimated 10 percent of the total wage gap. This overwork effect was sufficiently large to offset the wage-equalizing effects of the narrowing gender gap in educational attainment and other forms of human capital. The overwork effect on trends in the gender gap in wages was most pronounced in professional and managerial occupations, where long work hours are especially common and the norm of overwork is deeply embedded in organizational practices and occupational cultures. These results illustrate how new ways of organizing work can perpetuate old forms of gender inequality.
Over the past three decades, many indicators of gender inequality have shown signs of slowing or even stalled convergence: women’s labor force participation has leveled off (Bureau of Labor Statistics 2012), the integration of occupations has slowed (Hegewisch et al. 2010), and egalitarian gender attitudes are no more prevalent now than they were in the mid-1990s (Blau, Brinton, and Grusky 2006; Cotter, Hermsen, and Vanneman 2011). Perhaps no indicator has received as much attention as the gender gap in wages, which, after declining rapidly in the 1970s and 1980s, narrowed only modestly in the 1990s and remained stable through the mid-2000s (Blau 2012; Blau and Kahn 2006; England 2010). These observed trends belied empirical predictions based on late-twentieth-century data (e.g., Shannon and Kidd 2003) and led to a reframing of scholarly debates, from whether women were “destined for equality” (e.g., Jackson 1998) to why the gender revolution stalled (e.g., England 2010).
The stalled convergence in the gender gap in wages is especially puzzling in light of the many social, demographic, and economic changes that, all else being equal, should have attenuated gender inequality in labor market outcomes: the convergence, and for recent birth cohorts reversal, of the gender gap in college completion; the decline and delay in women’s fertility; the convergence in men’s and women’s continuous labor force experience; the decline of manufacturing and other relatively high-paying jobs in traditionally male sectors; and the weakening of male-dominated unions (Blau and Kahn 2006; DiPrete and Buchmann 2013; Goldin, Katz, and Kuziemko 2006). Prior efforts to understand this puzzle have focused on the “stalled revolution” in the domestic division of labor (Hochschild and Machung [1989] 2003; see also Bianchi et al. 2012; Geist and Cohen 2011); the uneven or incomplete adoption of effective anti-discrimination, diversity, and family-friendly personnel policies (e.g.,Dobbin, Kim, and Kalev 2011; Hirsh 2009; Kelly 2010; Williams, Blair-Loy, and Berdahl 2013); deep-rooted cultural beliefs about gender differences in competencies that affect labor supply and demand in high-paying occupations and that often become embodied in organizations (e.g., Acker 1990; Ridgeway 2011); and persistent gender segregation in the workplace (e.g., Charles and Grusky 2004; Weeden and Sørensen 2004).
We build on these general lines of inquiry but shift attention to a more proximate factor affecting trends in the gender gap in wages: changes in the social organization of work, specifically the increasing prevalence of long work hours (“overwork,” defined as 50 or more hours per week) and the growth of relative wages associated with overwork. These changes have occurred against a backdrop of persistent and largely stable differences in the proportion of men and women who are willing or able to put in long hours at work. This stability in the gender gap in overwork, when coupled with the rising payoff of overwork, had the net effect of raising men’s wages relative to women’s, thereby slowing the convergence in the gender wage gap. Moreover, because occupations differ in the extent to which overwork is embedded in their cultures, identities, and work practices, the impact of changes in overwork on trends in the gender gap in earnings varied substantially across occupations. We argue that the relative prevalence of overwork in professional and managerial occupations, and the astonishing growth in the wage returns to overwork in these occupations, can help us understand the essentially constant gender gap in these occupations over the past 20 years.
We assess the relationship between trends in overwork and trends in the gender wage gap using Current Population Survey (CPS) data from 1979 to 2009, supplemented by data from the Survey of Income and Program Participation (SIPP). Our analyses feature a graphical description of trends and formal wage decompositions. These decompositions allow us to tease apart the effects of changes in overwork from the effects of changes in standard covariates of wages, and changes in men’s and women’s distribution across high- and low-paying occupations. More importantly, they allow us to understand the structural source of the overwork effect, in particular whether it stems from changes in the gender gap in overwork, changes in the relative wages associated with overwork, or both. We first offer these analyses for the labor market as a whole, examining both gross and within-occupation effects. We then examine how changes in overwork affected trends in professional and managerial occupations compared to other occupations.
Diffusion of Overwork and the Gender Gap in Wages
The proportion of Americans who work long hours has increased substantially over the past 30 years. In the early 1980s, fewer than 9 percent of workers (13 percent of men, 3 percent of women) worked 50 hours per week or more (see, e.g., Jacobs and Gerson 2004). By 2000, over 14 percent of workers (19 percent of men and 7 percent of women) worked 50 hours per week or more. Overwork began to decline in the mid-2000s, but it remains widespread today.
The trend toward long work hours reflects a normative change as well as a behavioral shift. Not only does a greater proportion of workers put in long work hours per week, but long work hours have also become embedded in organizational practices (Sharone 2004), workplace cultures (Roth 2006), and beliefs about what it means to be an ideal worker in the contemporary economy (Williams 2000). Many employers expect workers to be available whenever clients or supervisors need them, and companies facilitate this 24/7 availability by encouraging or subsidizing the use of mobile communication technologies. Employees are also complicit in ratcheting up expectations surrounding work hours, often treating long work hours as a way to signal loyalty and commitment to an organization or occupation and as a source of status in and outside of work (Blair-Loy 2003; Epstein et al. 1999; Jacobs and Gerson 2004; Sharone 2004).
The effect of the diffusion of overwork on trends in the gender gap in wages depends, logically, on two factors: changes in the relative proportions of men and women who overwork, and changes in the wage returns to overwork relative to full- or part-time employment. These two components may reflect quite different underlying processes. Changes in the gender gap in the proportion of overworkers are intimately tied to the division of household labor and social expectations surrounding men’s and women’s caregiving and breadwinning roles. Changes in the wage returns to overwork, by contrast, reflect processes of labor market restructuring and workplace reorganization that alter the financial rewards associated with overwork. Although conceptually distinct, these two structural components are interdependent: the effect of a change in the gender gap in overwork on the gender gap in wages depends on whether overworkers receive a wage premium or a wage penalty compared to full-time workers. Similarly, the effect of a change in the relative wages accruing to overwork on the gender gap in wages depends on the direction and magnitude of the gender gap in overwork. In the following sections, we discuss potential sources of change, or lack thereof, in each component.
Persistent Gender Gaps in Overwork
In a counterfactual world in which men and women are equally likely to work long hours, the rise in overwork and its associated wages would increase levels of wage inequality but have no effect on the gender gap in wages. We know that this counterfactual does not hold. A much lower proportion of women than men work long hours: women are less likely to enter jobs that require extremely long work hours (Epstein et al. 1999; Hochschild and Machung [1989] 2003; Williams 2000), and they are less likely to stay in such jobs (Cha 2013; Stone 2007).
Most explanations for women’s underrepresentation among overworkers point to women’s greater responsibility for family caregiving (Blair-Loy 2003; Cha 2010, 2013; Clarkberg and Moen 2001; Hochschild and Machung [1989] 2003; Jacobs and Gerson 2004). Although men now spend more time on housework and childcare than in the past (Bianchi et al. 2012; Raley, Bianchi, and Wang 2012), essentialist beliefs about female caregiving continue to be a dominant cultural ideology even among people who endorse gender egalitarianism (Cotter at al. 2011). As a result, decisions about childrearing and family activities still tend to be made and implemented primarily by women (Crittenden 2002; Hochschild and Machung [1989] 2003; Stone 2007), women spend the same or a greater amount of time with their children as they did in prior decades (Bianchi et al. 2012), and the rising time requirements of elder care also disproportionately fall on women’s shoulders (Wolff and Kasper 2006).
These gender-specific expectations create stickiness in the gender gap in overwork. Indeed, as we will show, although the proportion of men and women who work long hours increased in the 1980s through the mid-2000s and declined thereafter, the gender gap in overwork stayed remarkably constant. Assuming overwork pays more per hour than full-time work, the lack of convergence in the gender gap in overwork will perpetuate the aggregate gender gap in wages, ceteris paribus. The gender gap in overwork can lead to a further increase in the gender wage gap if hourly wages of overworkers increase more than those of full-time workers. We discuss potential sources of this change in wage returns to overwork in the next section.
Rising Returns to Overwork
Much prior scholarship argues that overwork is an increasingly important signal of worker productivity and commitment to jobs (Blair-Loy 2003; Epstein et al. 1999; Jacobs and Gerson 2004; Sharone 2004). If true, it is reasonable to assume that the wage payoff to overwork has increased relative to full- or part-time work. Despite recent attention to the emergence of nonstandard work hours and their wage implications (e.g., Kalleberg 2001, 2011; Kalleberg, Reskin, and Hudson 2000; Presser 2005), there is surprisingly little systematic evidence about trends in the wages associated with overwork. In one of the few exceptions, Kuhn and Lozano (2008) report rising wage returns to overwork, but their data end in the early 2000s and are restricted to male workers.
Although the relevant empirical record is thin, we have good reason to anticipate that wage returns to overwork have been rising. One reason is a simple composition effect: the average hourly wage returns to overwork may have increased simply because of shifts in the types of workers who overwork and in the types of occupations where overwork is most prevalent. Overwork is more concentrated among highly educated, professional, and managerial workers (Kuhn and Lozano 2008); these workers experienced the greatest wage growth in the past 35 years (Weeden et al. 2007). If overwork has disproportionately increased among college-educated or professional or managerial occupations, the average hourly wage returns to overwork may have increased simply due to compositional shifts among overworkers. Empirically, this argument implies that rising returns to overwork will disappear in models that adjust for individual workers’ human capital attributes and their occupations.
Aside from such composition effects, several other plausible mechanisms imply rising wage returns to overwork. First, growing productivity differences between overworkers and full-time workers may generate rising relative returns to overwork. These productivity differences may emerge because rising demand for skilled labor creates additional incentives for the most productive workers to put in long hours or because workers who put in long hours were most able to benefit from new, productivity-enhancing technologies. Either way, the observed association between overwork and pay should become increasingly positive as this “skill-biased technological change” (see Acemoglu 1998; Katz and Murphy 1992) proceeds.
A similar empirical pattern is anticipated by the diffusion of tournament compensation systems (e.g., “up or out” promotion systems in law and academia, sales competitions, and some CEO pay systems), in which workers’ relative rank, rather than their absolute output, determines pay (Lazear and Rosen 1981; for a recent review, see Connelly et al. 2014) and in which small differences in productivity can result in large differences in pay. In these organizational contexts, employers may rely on work hours as a proxy for productivity because differences in actual productivity are often very small or difficult to measure, creating greater incentives for employees to ratchet up their time at work to “win” the competition and the greater rewards that follow (Biggart and O’Brien 2010; Blair-Loy 2003; Epstein et al. 1999; Landers, Rebitzer, and Taylor 1996; Sharone 2004).
Finally, macrostructural shifts such as deindustrialization, globalization, and the emergence of shareholder value systems pressured employers to stratify their workforces into core employees who work long hours for relatively high pay and contingent workers who work part-time, under subcontracts, or in temporary positions for lower pay (Fligstein and Shin 2004; Kalleberg 2001; Kalleberg et al. 2000; Tilly 1996). This bifurcation of the labor market may have raised the relative pay of overworkers while lowering the hourly wages of contingent workers.
For our purposes, it matters less which of the preceding mechanisms drives rising returns to overwork than that at least one mechanism does. Regardless of its source, any increase in wage returns to overwork will affect trends in the gender gap in wages. Because a greater proportion of men than women overwork, an increase in the hourly wage returns to overwork relative to full-time work will widen the gender gap in wages. Conversely, a decline in the relative wages of overwork will compress it. Rising wage returns to overwork can affect gender wage gap trends even if the gender gap in overwork remains unchanged.
Occupational Heterogeneity in Overwork
In this section, we argue that the overwork effect differs substantially across occupations, and such heterogeneity can also help us understand cross-occupational differences in trends in the gender gap in wages. As we will demonstrate, the slowdown in the convergence of men’s and women’s wages was especially pronounced in professional and managerial occupations. These occupations are precisely those in which convergence in men’s and women’s educational attainment and continuous labor force experience should, in theory, generate an especially sharp decline in the gender wage gap.
One answer to this puzzle, we argue, is the counteracting effects of overwork. Professional and managerial occupations have long been understood to be “greedy” occupations that “seek exclusive and undivided loyalty” from members, including in work hours (Coser 1974:4; see also Epstein et al. 1999; Jacobs and Gerson 2004). To the extent that norms of the ideal worker are especially embedded in professional and managerial identities and organizational practices, we might also anticipate the greatest conflicts with middle-class norms of “intensive mothering” (Hays 1998; Lareau 2003). Professional and managerial women are also especially likely to have overworking spouses, whose limited contributions to non-work responsibilities restrict women’s availability for overwork (Cha 2010). It should thus come as little surprise that the gender gap in overwork is especially pronounced in these occupations and shows little sign of convergence over the period of our data (see also Jacobs and Gerson 2004).
Should we likewise anticipate (1) a higher wage premium to overwork in professional and managerial occupations than in other types of occupations and (2) a sharper increase in these wage premiums? The answer to the first question is, we think, unclear. On the one hand, there is no guarantee that long work hours in greedy occupations will necessarily result in an hourly wage premium. Because professionals and managers are typically salaried, people who work long hours out of loyalty to their occupation or organization, professional identity, or other forms of intrinsic motivation could very well earn lower hourly pay than professionals and managers who “merely” work full-time at the same salary (if employers do not adjust overworkers’ salaries to compensate for the extra time) or, at best, equivalent hourly wages (if employers adjust overworkers’ salaries to compensate for their time, but no more). On the other hand, professional and managerial tasks are typically unstandardized and often carried out in teams, making individual productivity and contributions to organizational profits especially difficult to detect, and the costs of monitoring employees to reduce shirking are especially high. In this context, employers are more likely to use work hours as a signal of productivity (Landers et al. 1996; Sharone 2004). If overworking employees are disproportionately rewarded through better work assignments and more frequent promotions (Biggart and O’Brien 2010; Blair-Loy 2003; Epstein et al. 1999; Landers et al. 1996), this will lead to disproportionately higher relative wage returns to overwork in professional and managerial occupations than in other types of occupations.
Even if the valence of the overwork wage premium at baseline is unclear, we think there is reason to anticipate that trends in the wage payoff to overwork are more extreme in professional and managerial occupations. The emergence of “winner-take-all” labor markets (Frank and Cook 1995) and tournament models of compensation has been most pronounced in professional and managerial occupations, thereby increasing the potential rewards to acquiring “superstar” status within firms and raising incentives for the most productive workers to work long hours. Similarly, global competition and labor market restructuring, which put pressure on employers to have a flexible labor force, may have encouraged a more stratified labor market even in the same occupations, in which a core group of professionals and managers work ever longer hours and secure ever higher pay, and peripheral or contract employees (e.g., freelance accountants or legal consultants from a staffing company) work in temporary or fixed-term contracts (Kalleberg 2011). This, too, would raise the wages of overworkers relative to full-time workers, creating an upward trend in wage returns to overwork.
The upshot is that the diffusion of overwork and its effects on the gender gap in wages will, we think, be especially pronounced in professional and managerial occupations relative to other types of occupations. In these occupations, overwork is more prevalent, the gender gap in overwork especially large, and the increase in wage returns to overwork especially steep.
Data, Methods, and Variables
To assess the overwork effect on trends in the gender gap in wages, we first present graphs of trends in the gender gap in wages, the gender gap in work hours, and net returns to overwork compared to full-time work. Where these analyses rely on any modeling, they use simple OLS wage regressions. We then offer formal wage decompositions developed by Juhn, Murphy, and Pierce (1991, hereafter JMP; see also Blau and Kahn 2006), which allow us to disentangle the effect of changes in the gender composition of overworkers (the composition or “quantity” effect) and the effect of changes in wage returns to overwork (the price effect) on the gender gap in wages.
Data
The data for our main analyses are the Merged Outgoing Rotation Groups of the CPS (MORG; Bureau of Labor Statistics various years). In our graphical presentation of trends, we use all available MORG surveys from 1979 to 2009. The JMP decomposition relies on the 1979, 1989, 1999, and 2007 surveys; we chose 2007, rather than 2009, as the end point to estimate effects using data from years with similar macroeconomic conditions. Additional analyses use SIPP data from 1996 and 2004 (U.S. Census Bureau n.d.).
Our MORG analytic sample is limited to non-institutionalized civilian workers age 18 to 64 years. Self-employed workers, who were not asked the wage questions, are excluded. We present results based on the edited MORG data series, but we also estimated models using unedited data and found substantively identical results for the variables of interest. 1 The final sample sizes are 4,983,875 for the graphical trend analyses and 627,763 for the JMP decompositions. All analyses use the BLS-provided sampling weights.
Decomposition Method
The JMP decomposition method begins with a wage equation for men and assumes that prices for male workers with the observed human capital characteristics prevail for women if discrimination is absent. 2 The JMP model takes the following form:

where yit is the log of wages for individual i in year t;


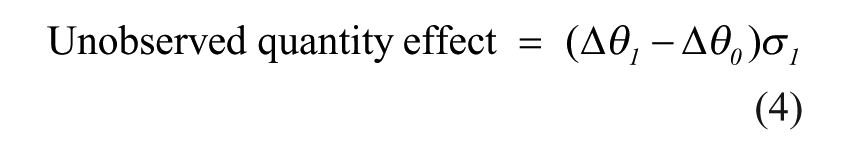

In these equations, Δ denotes the average male-female difference in the variable it precedes. Equations 4 and 5 estimate the contribution of price and composition changes in unobserved variables on the changes in the wage gap. The unobserved quantity effect measures the contribution of changing gender gaps in the relative positions (i.e., percentile rankings) in men’s residual wage distribution. The unobserved price effect measures changes in the gender gap in wages due to changes in men’s residual wage distribution, under the assumption that women’s percentile rankings in this distribution remained constant.
We are primarily interested in estimates from Equations 2 and 3. The observed
Variables
The dependent variable in our analyses is hourly wages, which is logged in all multivariate analyses but, for ease of interpretation, unlogged in the descriptive analyses. Following conventional practice, we calculate hourly wages for non-hourly workers by dividing their weekly wages by the number of hours usually worked per week or, where this information is missing, the number of hours worked in the week preceding the survey; we also exclude workers whose wages fall below $1/hour or above $100/hour in 1979 U.S. dollars (Angrist and Krueger 1999; Card and DiNardo 2002). Wages are adjusted for inflation using the Bureau of Economic Analysis’s Personal Consumption Expenditures Deflator and expressed in 2004 dollars. Wages that are top-coded in the CPS to preserve confidentiality are multiplied by 1.4 (see, e.g., Card and DiNardo 2002).
Work hours are measured with a set of dummy variables that use standard cut points in the work-family and labor economics literatures: fewer than 35 hours per week (part-time), 35 hours or more but fewer than 50 hours (full-time), and 50 hours or more (overwork). 4 Sensitivity checks using alternative specifications of overwork generated substantively similar results (see Figures S3 to S6 and Table S6 in the online supplement). In our multivariate analyses, we further differentiate part-time workers by reason for working part-time (economic, non-economic, and unspecified or missing).
Other covariates include gender, race, age, age squared, education (five categories), marital status (married or unmarried; not used in the decomposition analysis, see below), potential years of work experience (i.e., age – years of schooling – 6), potential work experience squared, region, metropolitan residence, and whether a respondent works in the public sector. Table 1 presents the means and standard deviations of these variables for the survey years used in the JMP decompositions. Table A1 in the Appendix presents these statistics for all survey years.
Means and Standard Deviations of Variables Used in the JMP Decomposition
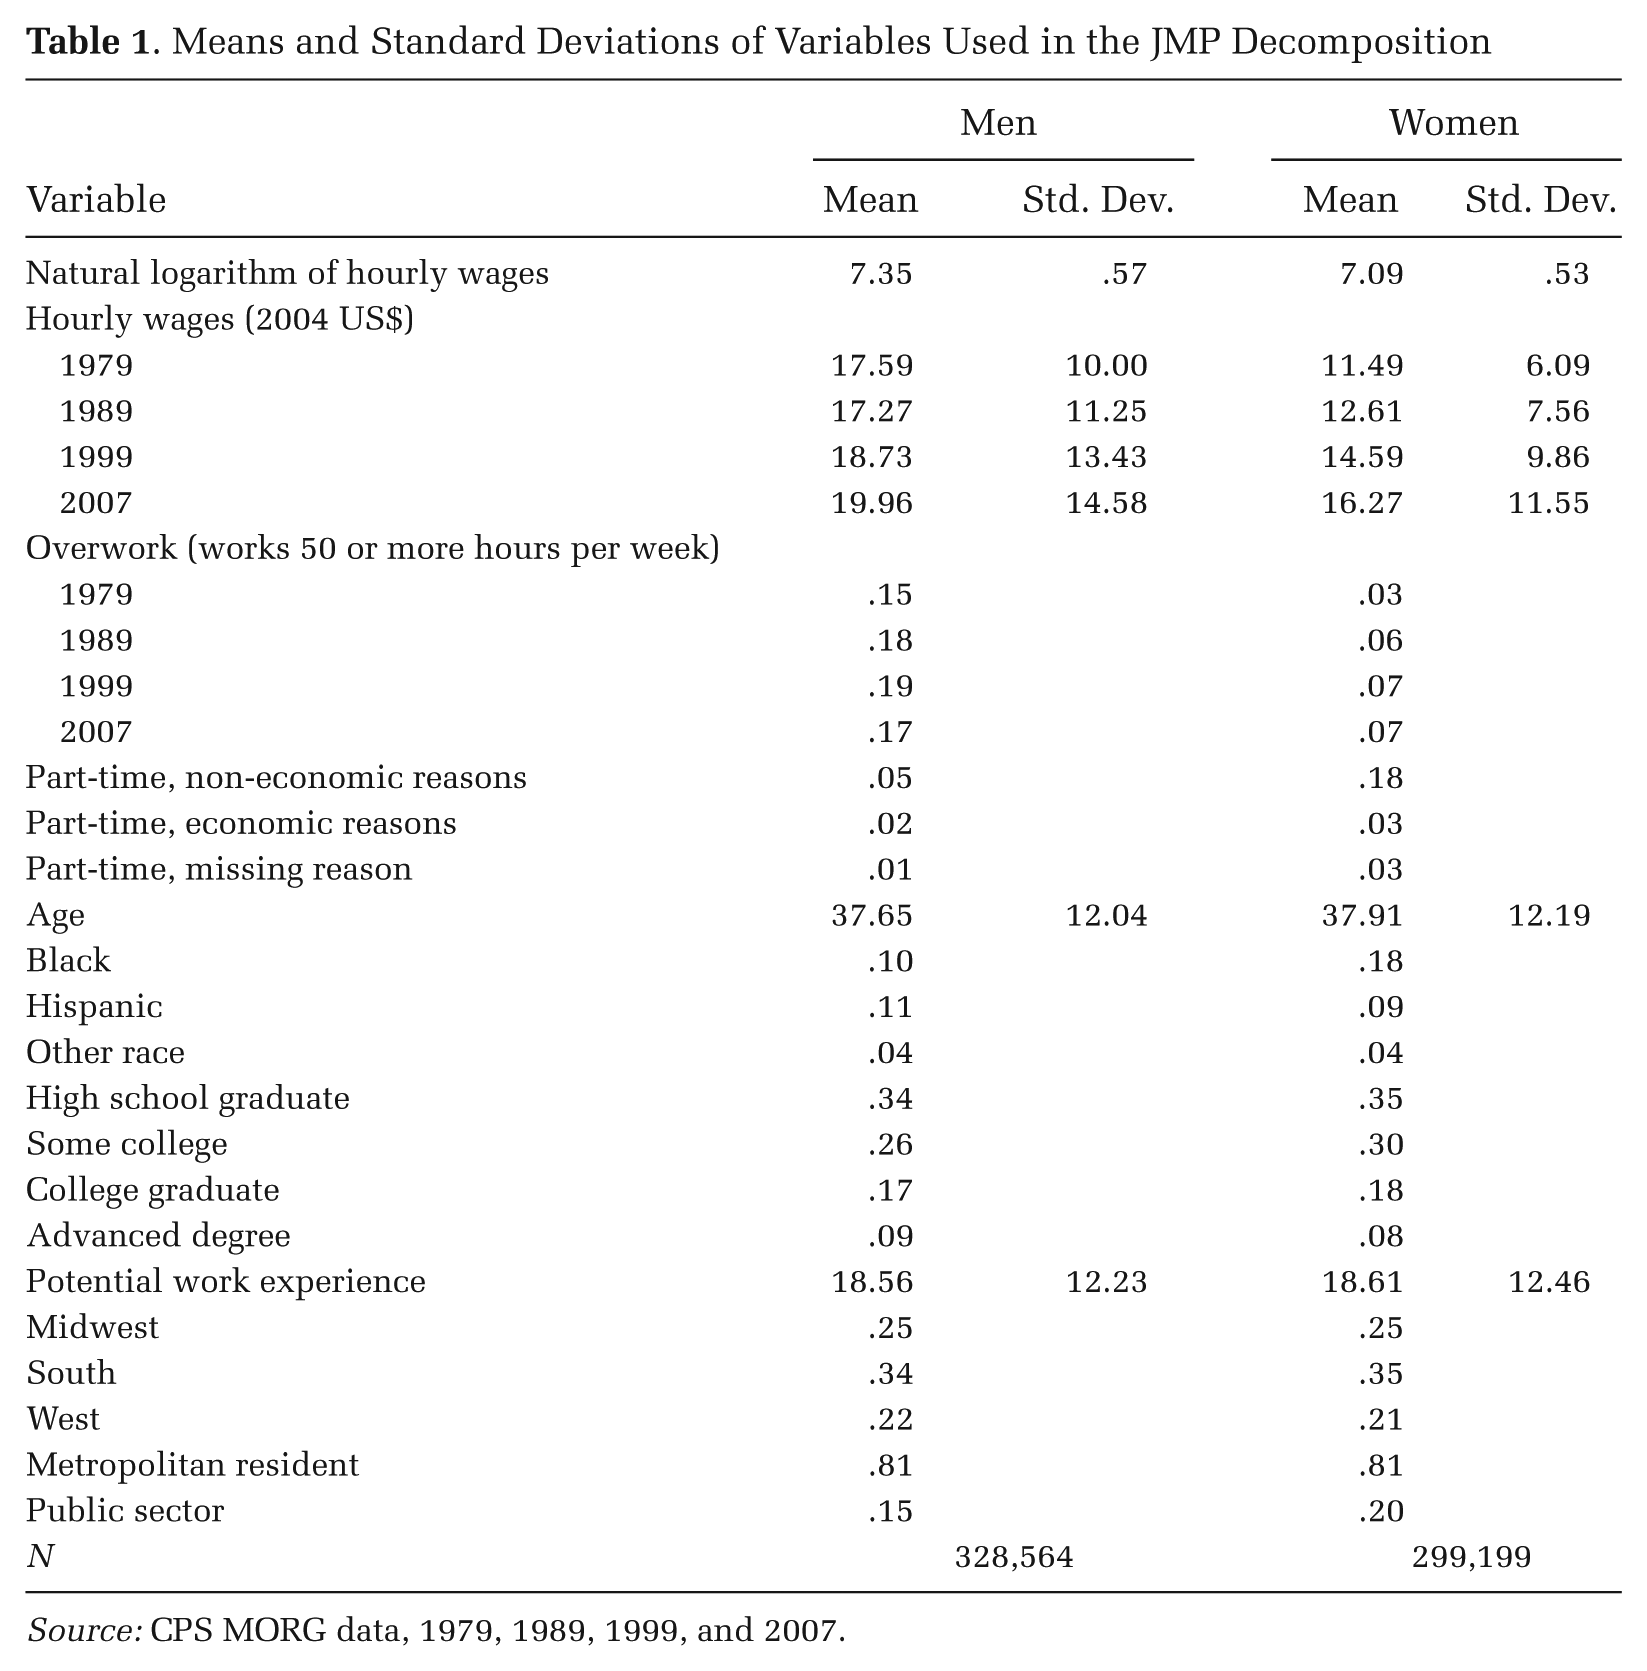
Source: CPS MORG data, 1979, 1989, 1999, and 2007.
Some wage equations also fit a series of dummy variables for detailed occupations (e.g., lawyer, carpenter). Because a consistent occupation coding scheme is not available in the MORG series, we use the codes indigenous to each survey: 421 detailed occupations in 1979, 502 in 1989, 496 in 1999, and 500 in 2007. This strategy minimizes the error introduced when reconciling occupation schemes, but at a cost: JMP decompositions require that each year’s model fits identical variables. We bypass this problem with a two-step analysis: we regress logged wages on the full set of indigenous occupation dummy variables, and then apply the JMP decomposition to the residuals. The resulting estimates of overwork effects can be understood as lower-bound estimates of the “true” effects of overwork, because only wage differences between overworkers and full-time workers remaining after purging all occupation effects can contribute to the estimates of the price and composition effects of overwork.
In our final set of analyses, we present estimates from models applied to data for each of three occupation groups: professionals, managers, and, for comparison, all other occupations. 5 To obtain indicators of professional or managerial occupations that are consistent across MORG surveys, we “backcode” using gender-specific weights to translate 2000, 1990, and 1980 major census occupation classification (COC) codes to a set of 1970 COC codes (see Weeden 2004; see also Weeden 2005a, 2005b). Although aggregating detailed occupations into professional, managerial, and other occupations does not capture the full extent of occupational heterogeneity in work hours or wages, it allows us to identify differences in the overwork effect across the major occupation groups where, according to the occupations literature, “greedy occupations” are most likely to be found. 6
Our estimates of the overwork effect based on CPS data are adjusted for the usual human capital and occupational covariates in CPS-based wage equations, but they do not include four known correlates of wages: marital and parental status, actual work experience (as opposed to potential experience), job tenure, and union status. We exclude marital and parental status because the JMP models assume that price effects of the observed covariates are the same across groups. Because this assumption does not hold for either marital or parental status (see, e.g., Budig and England 2001; Korenman and Neumark 1991; Waldfogel 1997), inclusion of these variables would produce misleading results. 7 Our CPS models also exclude actual work experience, job tenure, and union membership, because these variables are either not available in the CPS or, in the case of union membership, only available in the later years of the series. 8 To assess whether omission of these covariates biases the estimated overwork coefficients, we also analyze SIPP data, which contain the requisite measures but only cover the period between 1996 and 2004. 9
Results
We begin with an overview of gross trends in the gender gap in work hours, the gender gap in wages, and net wage returns to overwork. These analyses set the stage for the subsequent JMP decomposition results.
Trends in Overwork and Returns to Wages
Figure 1 shows the trend of the proportion of men and women who worked at least 50 hours per week (panel a) and, for comparison, the proportion who worked full-time (panel b). The key result is that the proportion of workers who put in long hours rose and then fell, but the gender gap in overwork remained remarkably stable. In 1979, 15 percent of men and 3 percent of women worked 50 hours or more per week; by the late 1990s, these percentages increased to 19 and 7 percent for men and women, respectively (see Figure 1a). The rise in overwork reversed for men in the 2000s and stagnated for women, generating a modest decline in the gender gap in overwork after 2000. The overall story, however, is one of stability in the gender gap in overwork, which stands in marked contrast to the narrowing gender gap in full-time work in the first 15 years of our data (see Figure 1b). 10 This result implies that changes in the gender gap in overwork could not have contributed much to trends in the gender gap in wages, a result we unpack further in the JMP decompositions.
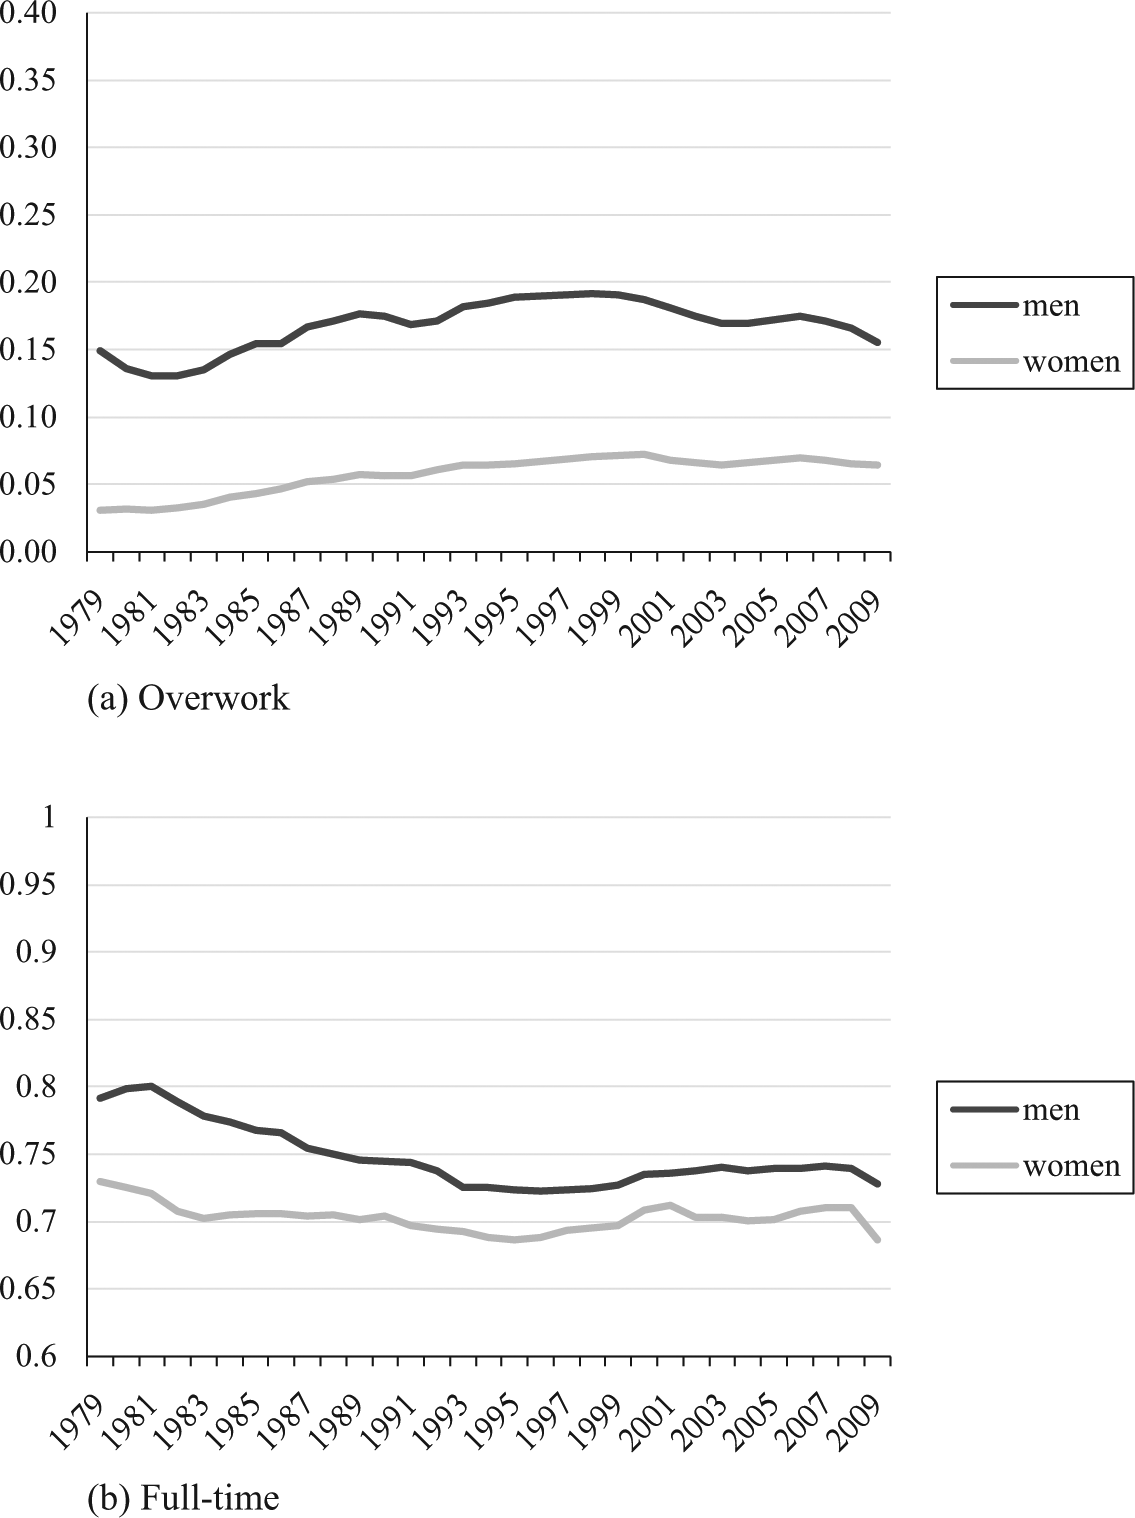
Proportion of Men and Women by Work Hour Status
Figure 2 maps trends in men’s and women’s hourly wages for the entire labor force (panel a), full-time workers (panel b), and overworkers (panel c). Figure 2a shows the familiar pattern of gradual convergence in the gender gap in wages in the 1980s and early 1990s, driven largely by rising wages for women, and stalled convergence in the late 1990s and early 2000s as men’s real wages began to rise again (Blau and Kahn 2006). Our extension of this series reveals that the stagnation in the gender gap in wages continued throughout the latter half of the 2000s. More concretely, among all workers, the ratio of women’s wages as a proportion of men’s increased in the first 15 years of our data from .65 to .78, a change of 20 percent, but in the last 15 years only increased from .78 to .81, a change of 3.8 percent. The gender gap in wages among full-time workers (Figure 2b) shows a similar trend, but with a more substantial narrowing of the gender gap by the mid-1990s. The wage trend for overworkers shows a rather different pattern (see Figure 2c). Overworking men’s hourly wages increased in the 1980s, held steady through the mid-1990s, and rose sharply in the late 1990s and again in the late 2000s. Overworking women’s hourly wages rose substantially and steadily throughout the three decades covered by the CPS. For both men and women, wage growth was much steeper for overworkers than for full-time workers.
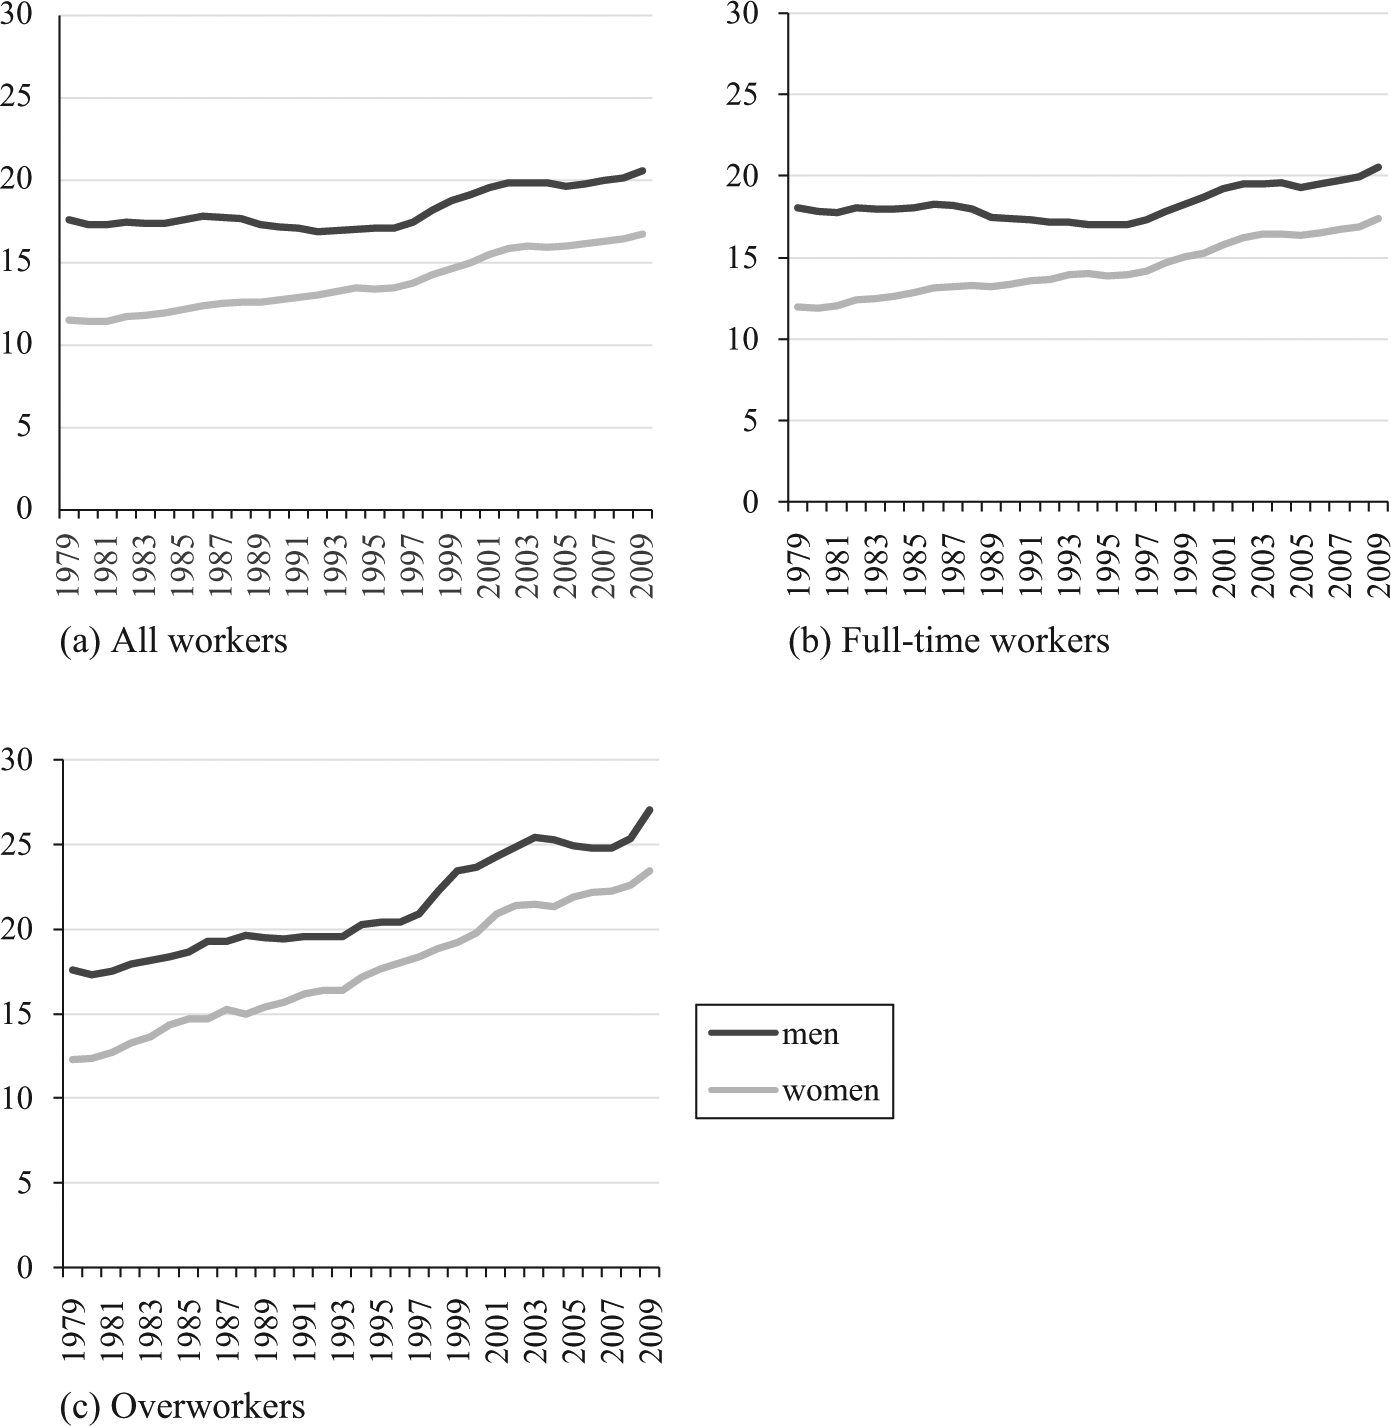
Hourly Wages of Men and Women by Work Hour Status (in 2004 Dollars)
The trends in Figure 2c may be driven by compositional shifts in the pool of overworkers. If, for example, overwork became increasingly concentrated among college-educated workers, the increase in returns to overwork in Figure 2c will disappear once we adjust for rising returns to a college degree. To assess the impact of compositional changes, we regressed logged wages on a full complement of demographic, human capital, and labor market (e.g., region, sector) covariates (see Table A1 in the Appendix). The exponentiated coefficients of overwork, which represent net hourly wage returns to overwork relative to full-time workers, are graphed in Figure 3a. The overwork coefficients are statistically significant (p < .05) in all years except 1994 to 1996 (men) and 1995, 1996, and 1998 (women).
Adjusted Mean Hourly Wages of Overworkers as a Proportion of Full-Time Workers’ Wages
Figure 3a yields three notable findings. First, the slope in adjusted mean hourly wages of overworkers is positive, meaning that the rising wage returns to overwork observed in Figure 2c are not simply a function of compositional changes in the observed human capital attributes of overworkers. Second, within-sex net wage returns to overwork do not differ appreciably for men and women. That is, we find no evidence that overworking women are compensated less for their additional hours relative to full-time women than overworking men are compensated relative to full-time men. Third, net wage returns to overwork changed from negative (i.e., a wage penalty) to positive between 1979 and 2009. In 1979, overworkers’ hourly wages were lower than those of full-time workers by between 14 (women) and 16 (men) percent. 11 By 1989, this wage penalty for overwork had decreased by a third; by the mid-1990s, there were few differences in the hourly wages of overworkers versus full-time workers; and by 1999, overworking men earned 4 percent more, and overworking women earned 2 percent more, than their full-time counterparts. Returns to overwork continued to rise thereafter, such that by 2009, the net wage premium for overwork had increased to 6 percent for both men and women. This increase in the overwork wage premium throughout the 2000s extends trends reported for men by Kuhn and Lozano (2008), and to our knowledge is a novel finding.
Although the results graphed in Figure 3a adjust for a host of individual-level covariates, they do not adjust for occupation, another potential source of compositional changes that generate rising returns to overwork. Indeed, the proportion of overworkers in professional and managerial occupations increased from .45 to .58 between 1979 and 2009. This is consistent with the claim, bolstered by prior research, that the diffusion of overwork norms was especially pronounced in professional and managerial occupations, but it also leaves open the possibility of a spurious trend in wage returns to overwork if these occupations pay higher wages for reasons unrelated to overwork (e.g., occupational closure or rising demand for professional and managerial skills).
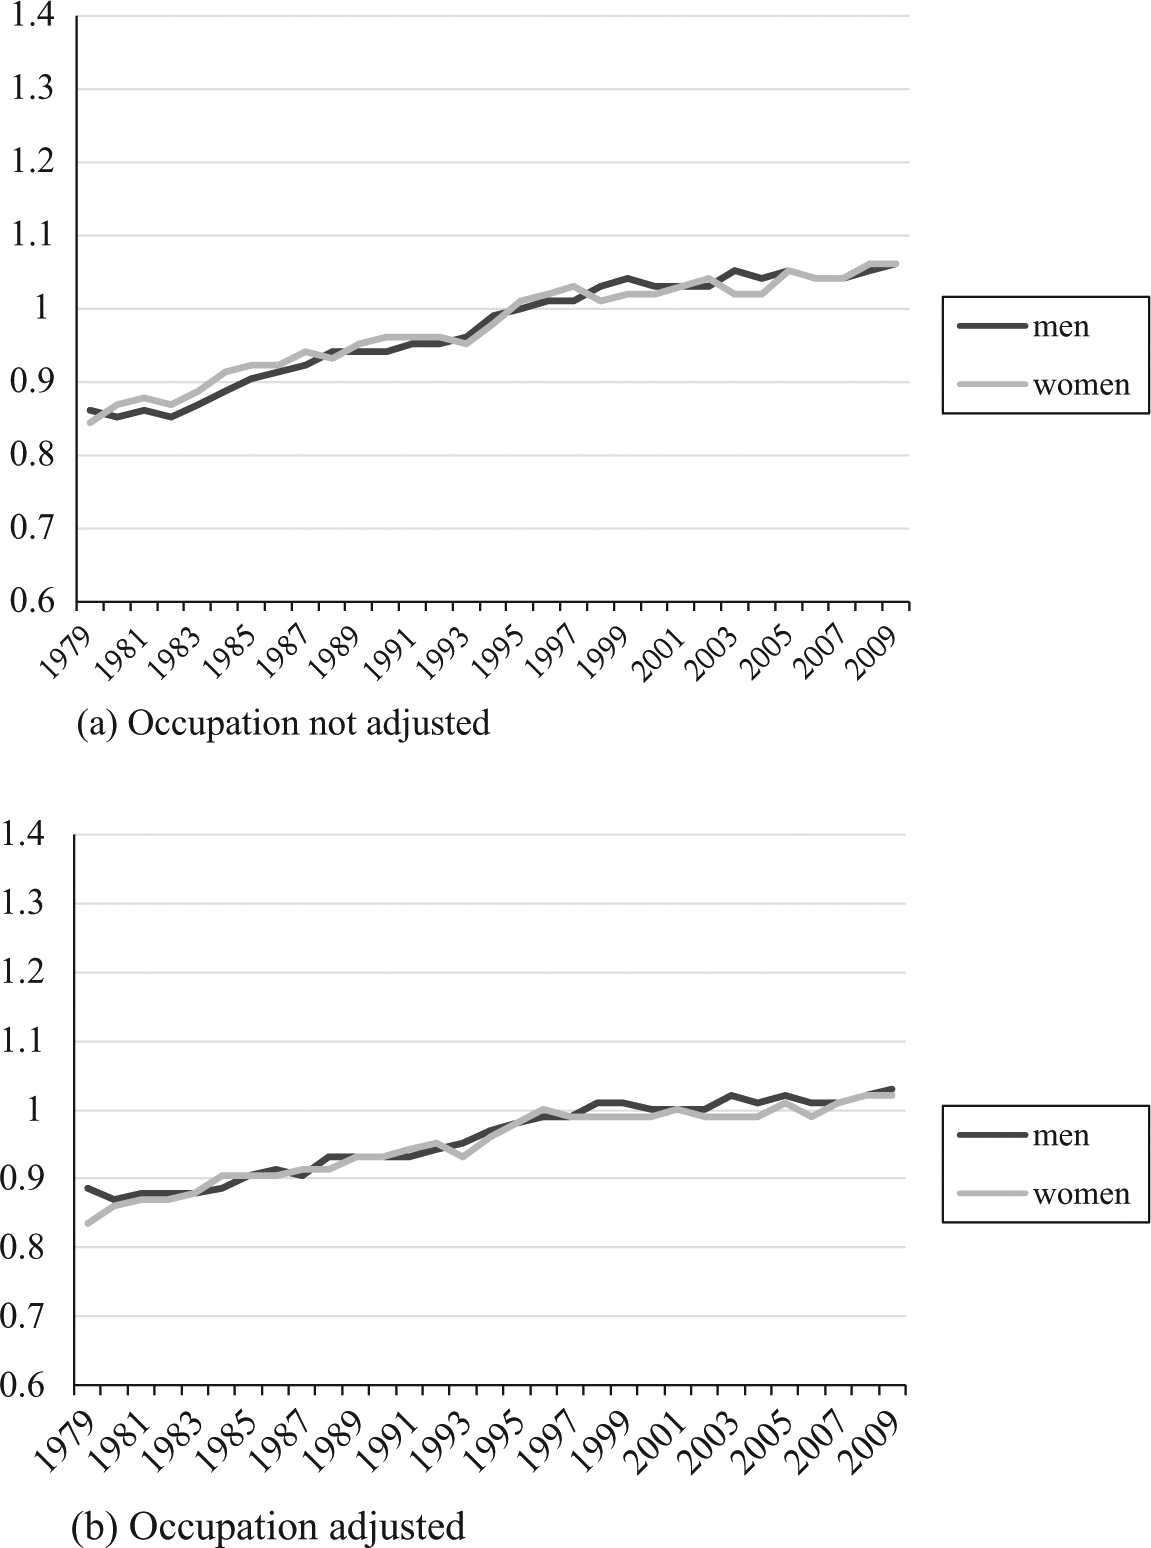
To assess how occupation composition affects trends in returns to overwork, Figure 3b graphs trends in estimated wage returns to overwork based on a model that also includes dummy variables for detailed occupations (coded with the indigenous scheme for each year). These occupation-adjusted coefficients of overwork are statistically significant for all years except 1998 to 2002 (men) and 1996 and 2007 (women). Figure 3b reveals that the increase in the occupation-adjusted wage returns to overwork between 1979 and 2007 is about .15 log points, compared to a .2 log point increase in the unadjusted models (compare Figures 3a and 3b). Put differently, about 30 percent of the increase in the overwork wage premium is associated with occupation composition effects, and about 70 percent is occurring within occupations.
These results offer initial evidence that the trend toward long work hours, coupled with rising returns to overwork and a persistent gender gap in overwork, exacerbated the gender gap in wages. In the JMP decomposition that follows, we estimate the magnitude of the composition and price effects of overwork and compare them to analogous effects of other known covariates of wages.
Decomposition of the Overwork Effect
Table 2 shows the decomposition of changes in the gender gap in wages between 1979 and 2007. Coefficients in the first column are based on a regression of log hourly wages on the work hour variables, age and its square, race, education, potential years of work experience and its square, region, and public sector (see Table 1). Coefficients in the third column also adjust for detailed occupation effects (see Methods section). The regression coefficients used to calculate the decomposition terms are presented in Tables S1 and S2 in the online supplement.
Decomposition of Changes in the Gender Wage Gap, 1979 to 2007
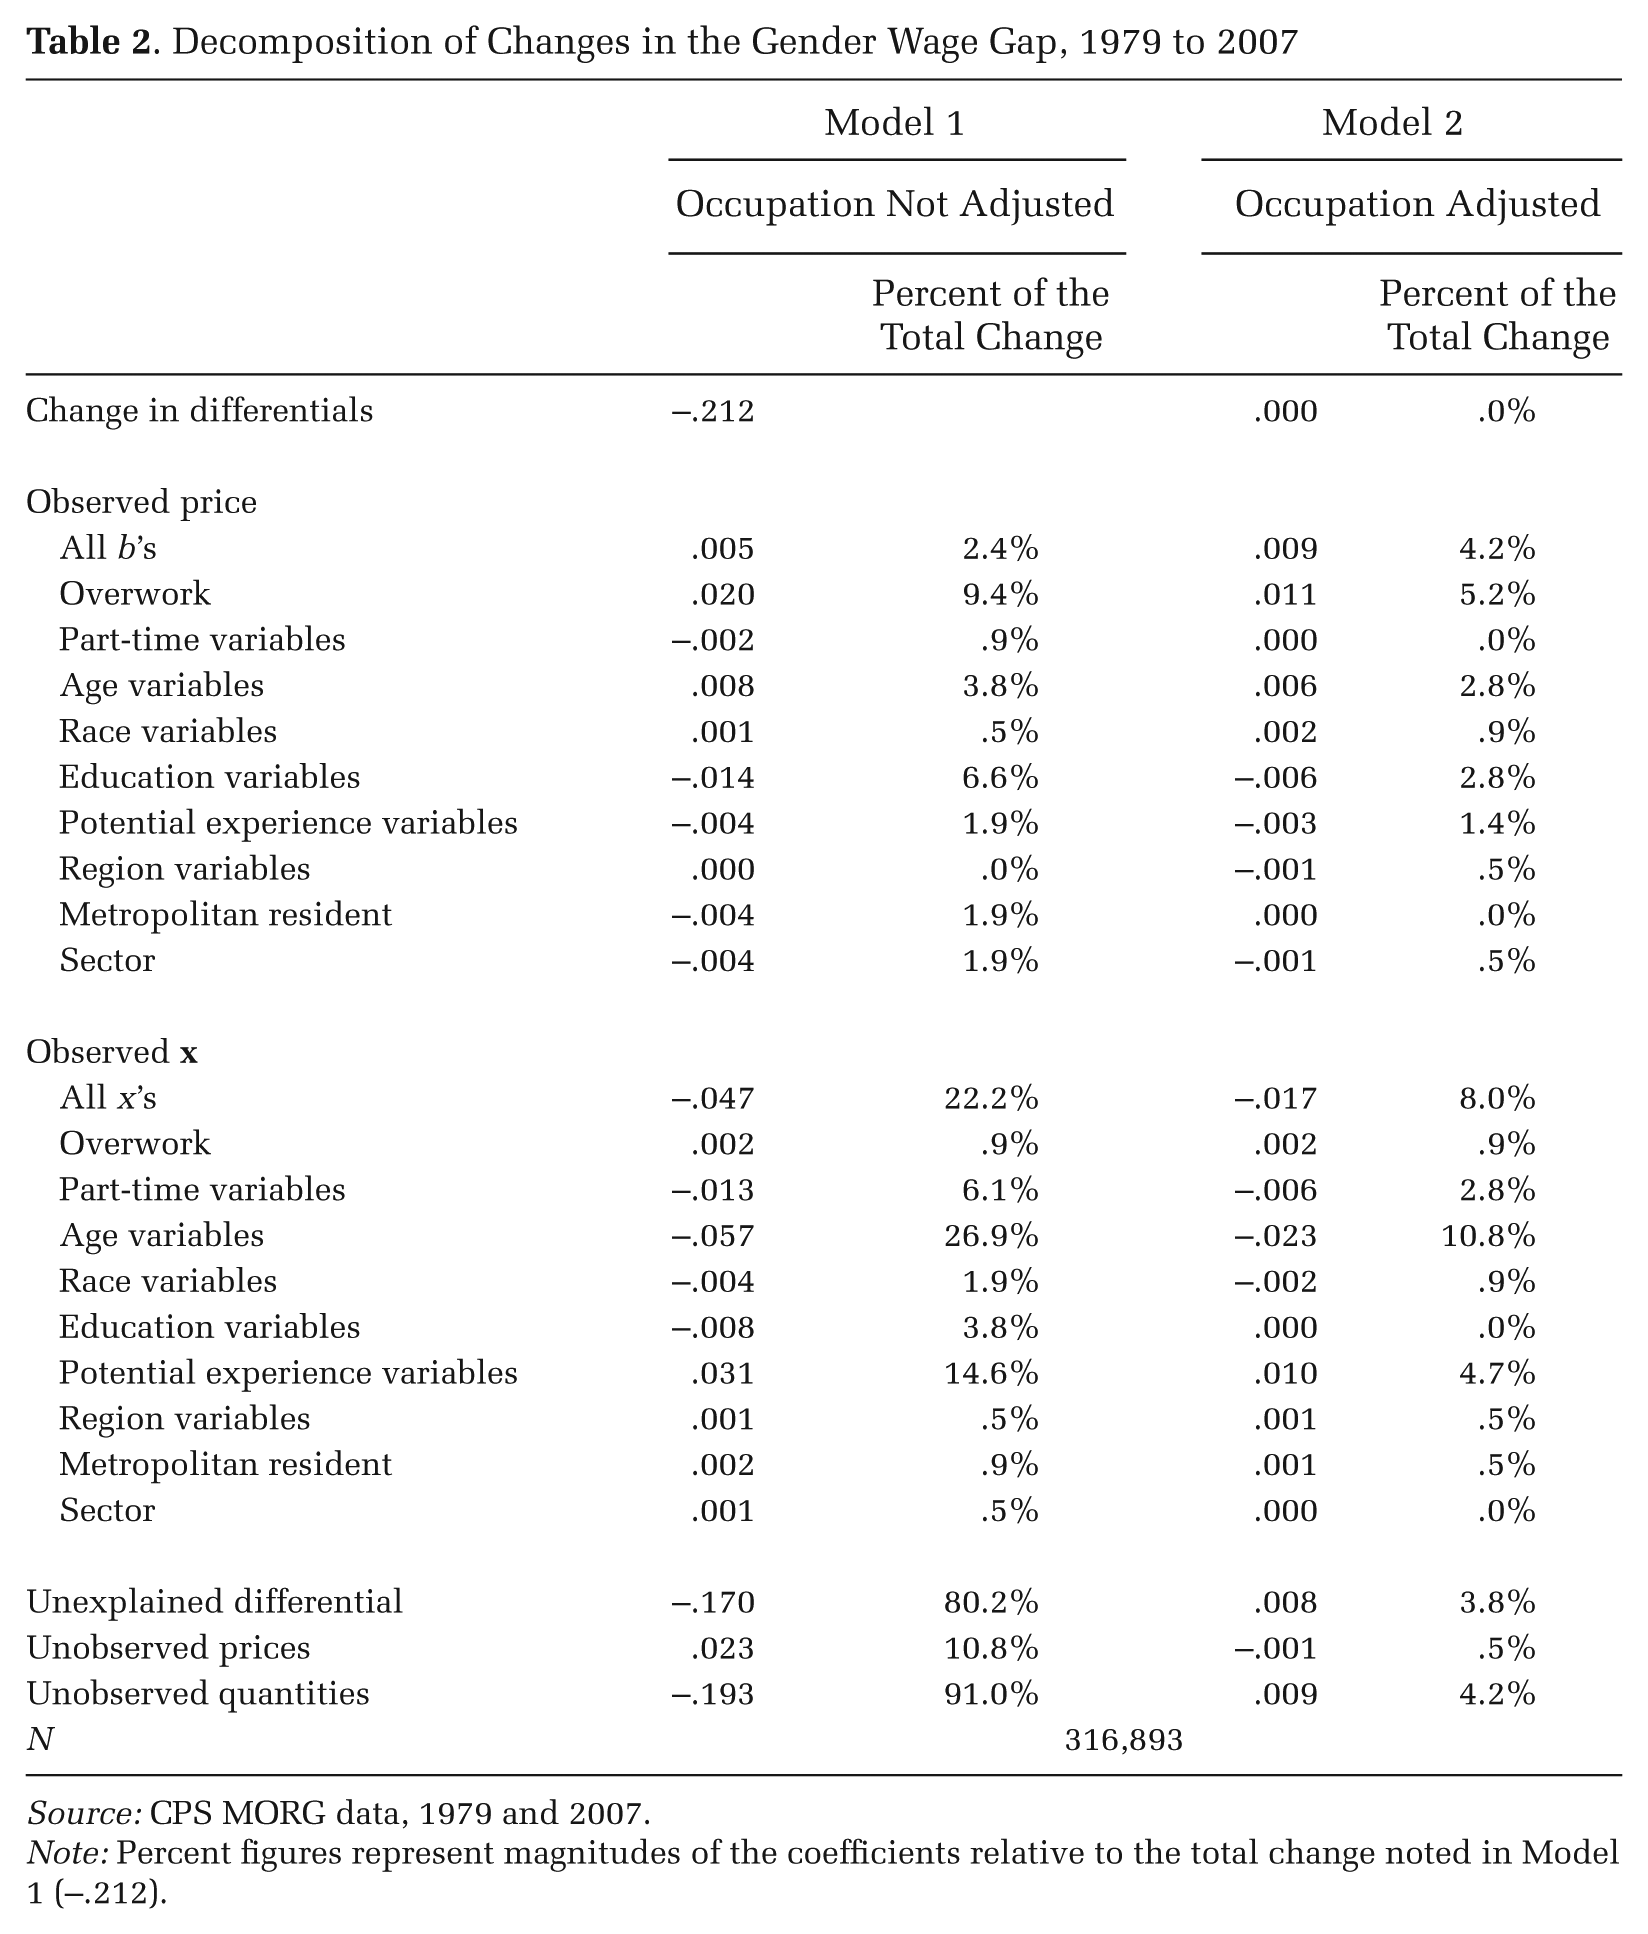
Source: CPS MORG data, 1979 and 2007.
Note: Percent figures represent magnitudes of the coefficients relative to the total change noted in Model 1 (–.212).
Results in the first column show that the gender wage gap decreased by .21 log points, or about 19 percent, between 1979 and 2007 (see Table 2, “change in differentials”). The increase in overwork exacerbated the gender wage gap, as indicated by the positive coefficients for overwork listed under both “observed price” and “observed
How do the estimated effects of overwork compare to other known factors affecting trends in the gender gap in wages? Although we recognize the peril of entering variables that may be measured with more or less error and precision into a horse race, the decomposition results in Table 2 suggest that overwork had a proportionately greater impact on the gender gap in wages than all other observed price and composition factors except age and potential experience (but see the SIPP results below for these variables). Notably, the inequality-exacerbating effects of overwork entirely offset the inequality-reducing effects of education. Rising returns to education equalized the gender gap in wages by an estimated .014 log points, or 6.6 percent of the total change (compared to 9.4 percent for overwork), and the composition effect of education equalized the gender gap in wages by .008 log points, or 3.8 percent of the total change (compared to 1 percent for overwork). Our results suggest that changes in the prevalence and pay associated with overwork are as critical to understanding trends in the gender gap in wages as rising returns to a college degree and the reversal of the gender gap in college completion.
Without downplaying the importance of either overwork or education effects, it also bears noting that most of the change in the gender wage gap between 1979 and 2007 can be attributed to improvement in women’s unobserved labor market qualifications (see Model 1, Table 2). Unobserved price effects, by contrast, would have widened the gender gap in wages in the absence of compositional shifts. The unobserved effects are greater in magnitude than the observed effects.
It is possible that the estimated overwork effects from Model 1 are simply picking up occupational segregation effects: men and women are unevenly distributed across occupations that differ in their pay. To assess this, Model 2 of Table 2 presents estimates from a JMP decomposition model fit to data residualized on detailed occupations. These analyses provide a lower-bound estimate of the net overwork effect, insofar as residualizing on occupations purges these data of between-occupation differences in overwork and the associated wage trend effects. Coefficients in Model 2 show, first, that the “change in differentials” (i.e., the trend in the gender gap in wages) disappears when we purge between-occupation effects. This is consistent with prior research showing the dominant role of occupational segregation in generating the gender gap in pay (e.g., Blau, Ferber, and Winkler 2009). The unobserved price and composition effects in Model 2 also shrink and reverse sign, suggesting their large negative values in Model 1 are due to gender segregation across occupations.
Of key interest, however, are the price and composition effects of overwork. As in Model 1, the composition effect of overwork on trends in the gender gap in wages is quite small (see Model 2, Table 2). The price effect also remains positive, indicating that shifting prices for overwork exacerbated gender inequality in wages. However, it decreases to .011 log points or 5.2 percent of the total change (.011/.212), compared to .020 log points or 9.4 percent of the total change in Model 1. Put differently, at least half of the overwork effect observed in Model 1 can be attributed to rising prices for overwork within occupations, while just under half is associated with between-occupation effects of differences in pay and the prevalence of overwork.
Timing and Robustness Checks
As we noted in our graphical presentation of results, neither the proportion of overworkers nor the wage returns to overwork show a smooth and steady increase between 1979 and 2007. To assess whether the overwork effect varied by decade, Table 3 presents models analogous to Model 1 of Table 2 for three time periods: 1979 to 1989, 1989 to 1999, and 1999 to 2007. These results show that the overwork price factor exacerbated the gender gap in wages in the 1980s (.011 log points, or 10 percent of the total change in the gender wage gap during this period) and 1990s (.011 log points, or 18 percent of the total change in the gender wage gap during the 1990s), but had virtually no effect on the gender gap in wages in the 2000s. In decade-specific models fit to data from which occupation effects have been purged (not shown), the price effect of overwork is positive but reduced by 30 (1990s) to 40 (1980s) percent. These findings suggest that rising wage returns to overwork was a major contributor to the slow convergence of the gender gap in pay in the 1980s and 1990s. Borrowing Blau and Kahn’s (1997:4) analogy, in the earlier periods, women were “swimming upstream” against the adverse effect of overwork: in a counterfactual world in which the wage premium for overwork stayed constant, the gender gap would have narrowed by an additional 10 percent in the 1980s and 18 percent in the 1990s.
Decomposition of Changes in the Gender Wage Gap, 1979 to 1989, 1989 to 1999, and 1999 to 2007
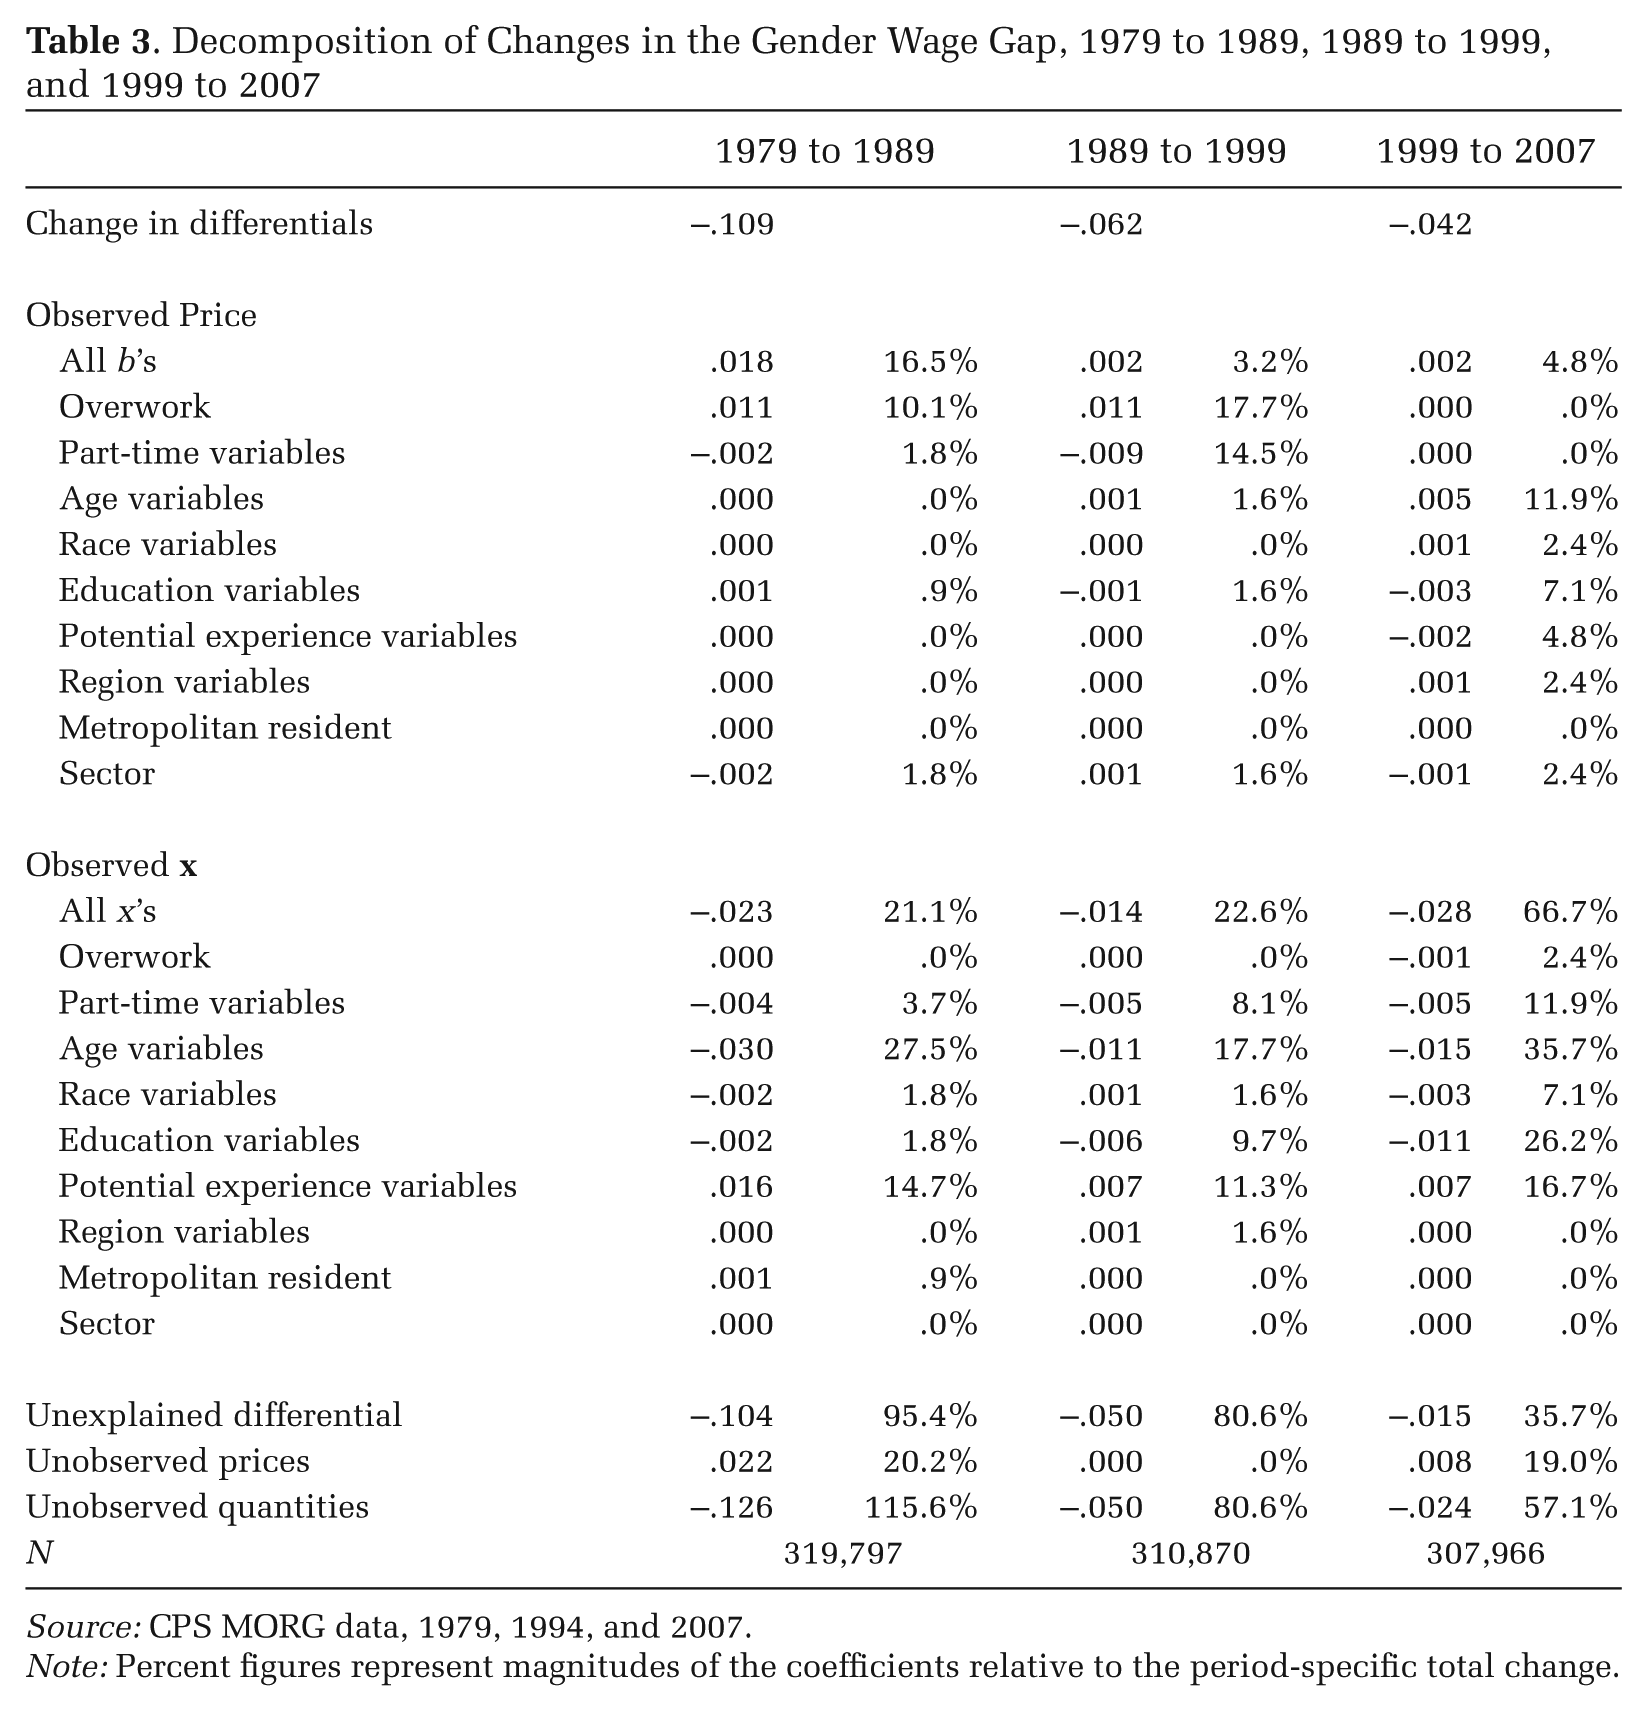
Source: CPS MORG data, 1979, 1994, and 2007.
Note: Percent figures represent magnitudes of the coefficients relative to the period-specific total change.
In the 2000s, by contrast, neither the overwork price effect nor the overwork composition effect had an appreciable impact on trends in the gender gap in wages (see Table 3, columns 5 and 6). Although it is not widely appreciated in the work hours literature, overwork began to decline during this decade, especially among men (see Figure 1a), with a corresponding decrease in its impact on aggregate wage inequality. The growth in the net wage premium for overwork also leveled off in the 2000s, compared to the sharp increase of two prior decades (see Figure 3). The impact of trends in overwork on trends in the gender gap in wages was thus minimal. Instead, the story of the 2000s seems to be the diminishing effect of wage-equalizing composition changes in unmeasured attributes (see Table 3, “unobserved quantities”). Further analysis (not shown) reveals that these unmeasured attributes are strongly associated with detailed occupations, such that the composition effect in the 2000s reverses valence once detailed occupation effects are purged from the data.
We also assess the robustness of our results to biases generated by three known correlates of wages that are not available in the CPS data, but that are plausibly associated with overwork: union membership, actual work experience, and job tenure. Our strategy is to analyze SIPP data from 1996 to 2004 and compare these results to an analysis of CPS data from the same years.
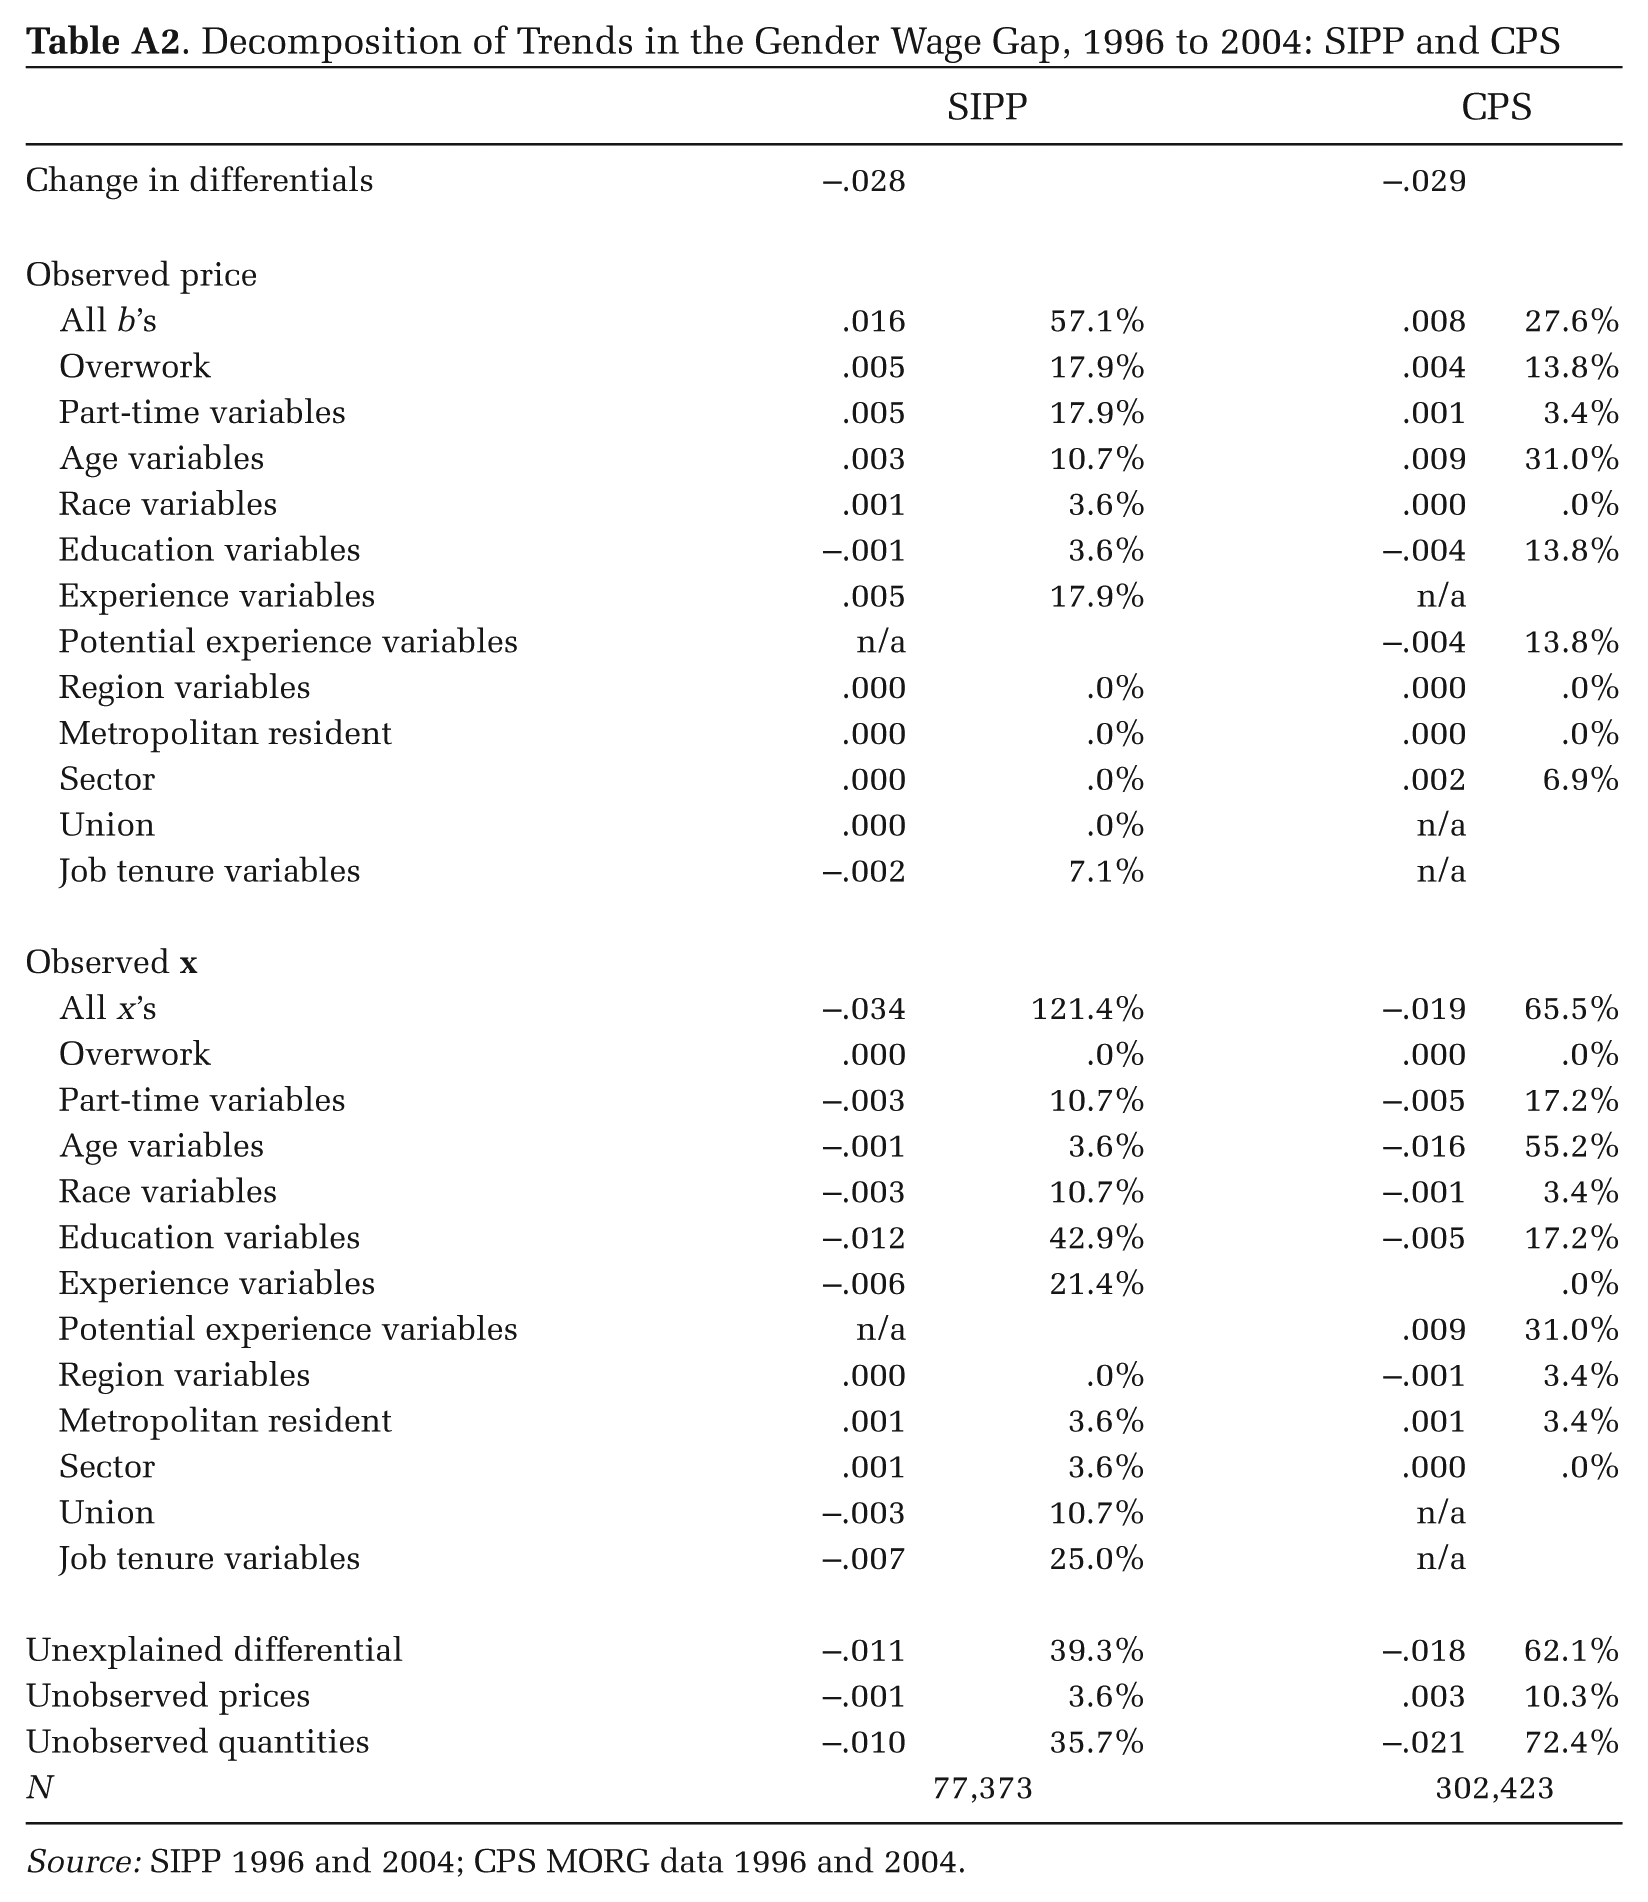
The SIPP data show that declining gender gaps in job tenure and union membership, when coupled with wage premia for union membership and for job tenure, narrowed the gender wage gap, as shown by the composition effects (see Table A2 in the Appendix). Rising prices for each additional year of actual work experience widened the gender wage gap by .005 log points, or 18 percent of the total change in the SIPP data. A decrease in the gender gap in years of work experience, however, compressed the gender wage gap by .006 log points, or 21 percent of the total change in the SIPP data. In the CPS data, by contrast, potential work experience appeared to compress the gender gap in wages through price effects but widen the gender wage gap through composition effects. The SIPP data also show a smaller estimated price effect, a larger composition effect, and a larger combined effect of education than do the CPS data.
Critically, the SIPP and CPS data reveal a very similar pattern of overwork price and composition effects between 1996 and 2004. Neither dataset reveals evidence of an overwork composition effect. The overwork price effect in the SIPP data (.005) is comparably sized to the overwork price effect in the CPS data (.004). It is possible, of course, that estimates from both datasets are biased by unobserved heterogeneity. Even so, the SIPP results are comforting insofar as they demonstrate that the CPS estimates of the overwork price and composition effects are not biased by the absence of measures of union membership, job tenure, or actual work experience in the CPS.
Overwork in Professional and Managerial Occupations
Our final analysis shows that the overwork effect is most pronounced in professional and managerial occupations. We note, first, that trends in the gender gap in wages differ substantially between professional, managerial, and other occupations. In the professions (see Figure 4a), women earned 70 percent of male wages in 1979, a gap that is narrower than for the labor force as a whole. However, the trend in the gender gap in wages was especially flat in the professions: the gender gap remained stable until the late 1980s, narrowed by the mid-1990s, but increased throughout the late 1990s before leveling off in the 2000s. In managerial occupations (Figure 4b), the trend in the gender gap in wages tracked the overall trend, but the magnitude of the gender gap was substantially greater than it was in the professions: in 1979, female managers earned 62 percent of male managers’ wages, and by 2007, they earned 73 percent of male managers’ average wages. The trend in the gender gap in wages in the residual category of “other occupations” (Figure 4c) mirrors the overall trend.
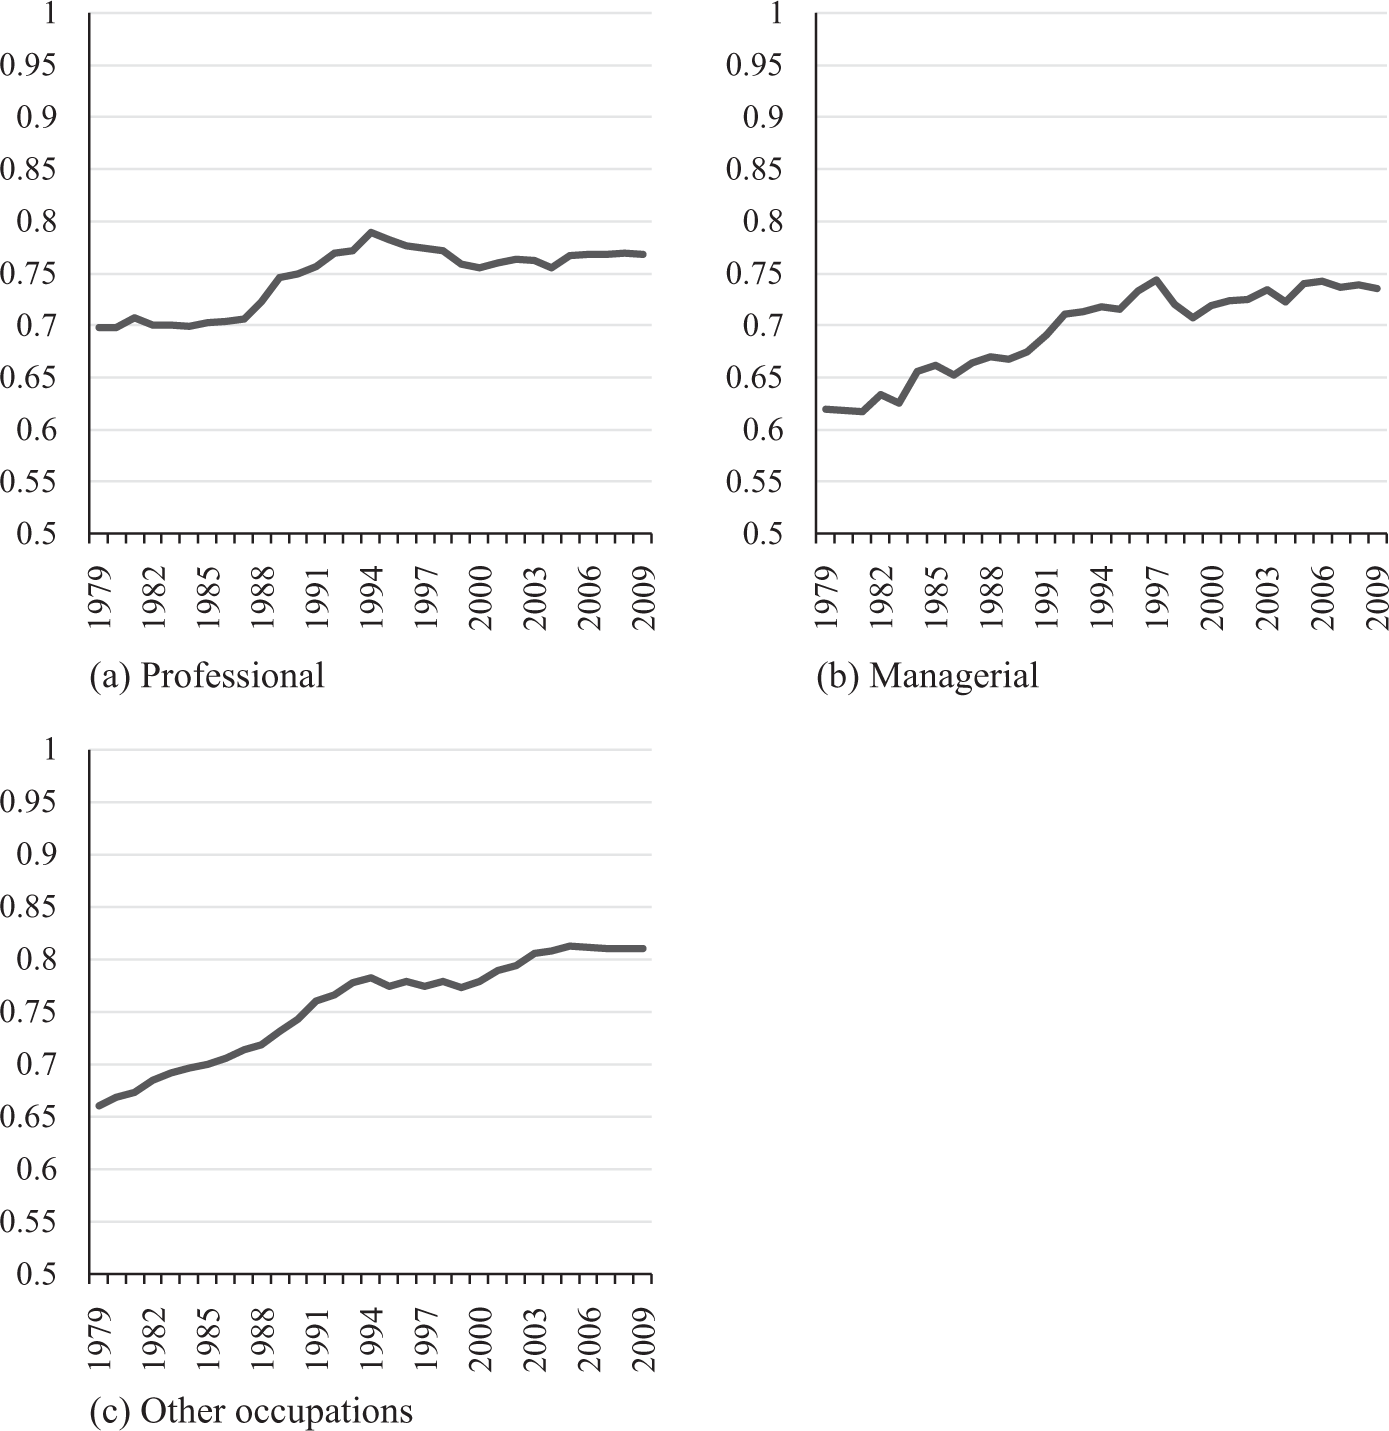
Women’s Mean Hourly Wages as a Proportion of Men’s by Occupation Group
The takeoff in overwork was also more pronounced in professional and managerial occupations. In 1979, 18 percent of men and 8 percent of women in professional occupations overworked; by the late 1990s, these percentages increased to 25 and 12 percent, respectively (see Figure 5a). The rise in overwork in managerial occupations was greater, increasing from 31 percent of male managers in 1979 to 39 percent in 1999, and from 10 percent of female managers in 1979 to 16 percent in 1999 (Figure 5b). The decline in overwork in managerial occupations in the early 2000s was also more pronounced than it was in the professions (compare Figures 5a and 5b). The trend for other occupations (Figure 5c) is less dramatic: the proportion of overworkers is lower throughout, the increase through the 1980s and 1990s smaller, and the post-2000s decline relatively modest. Although the size of the gender gap in overwork varies substantially across the three occupation groups, with the greatest gap in managerial occupations and the smallest in the “other” occupation group, the gender gap in overwork remained fairly stable in each occupation group, with the notable exception of some compression of the gender gap in overwork in managerial occupations between 2000 and 2009 (see Figure 5b).
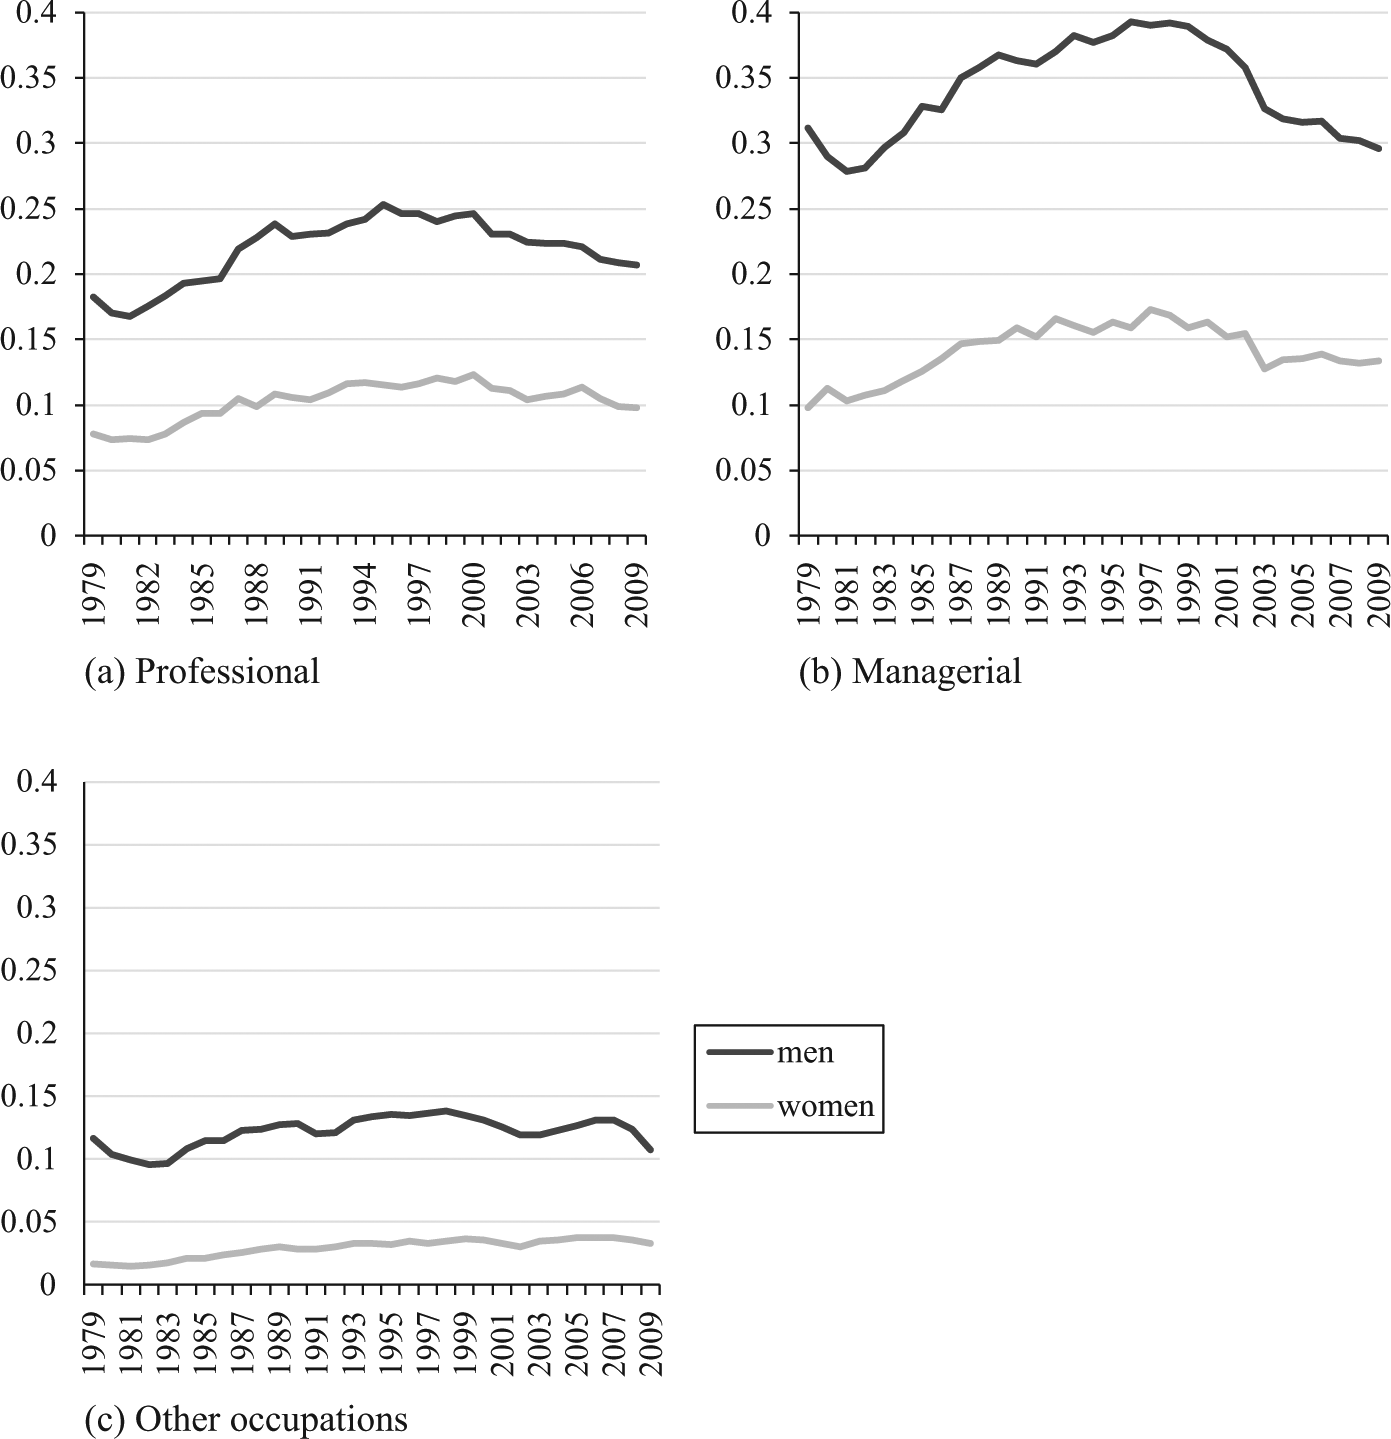
Proportion of Men and Women Who Worked 50 Hours or More by Occupation Group
Figure 6 graphs trends in the overwork wage premium or wage penalty in these three occupation groups after adjusting for demographic and job-related covariates (see Table A1 in the Appendix) and pooling data for men and women to minimize noise. We note, first, that adjusted hourly wage returns to overwork were, on average, lower than hourly wage returns to full-time work in all three occupation groups in the early 1980s, with the overwork wage penalty especially pronounced in the professions and management. This wage penalty for overwork is not surprising, given that professionals and managers are typically salaried but work the longest hours. What is surprising is the astonishing growth in wage returns to overwork in these occupations, where the wage returns to overwork increased by approximately .20 log points, compared to other occupations, where wage returns increased by .15 log points. By 2009, professionals’ wage penalty for overwork decreased to 4 percent from 24 percent in 1979, and overworking managers earned 11 percent more than their full-time counterparts by 2009, up from a 9 percent wage penalty in 1979. This implies that the increase in the wage premium for overwork in professional and managerial occupations had a greater inequality-exacerbating effect on the gender gap in wages in these occupations. Moreover, the greater prevalence of overwork and the larger gender gaps in overwork in managerial and professional occupations implies that the rising payoff to overwork had a stronger effect on the gender gap in wages in these occupations.
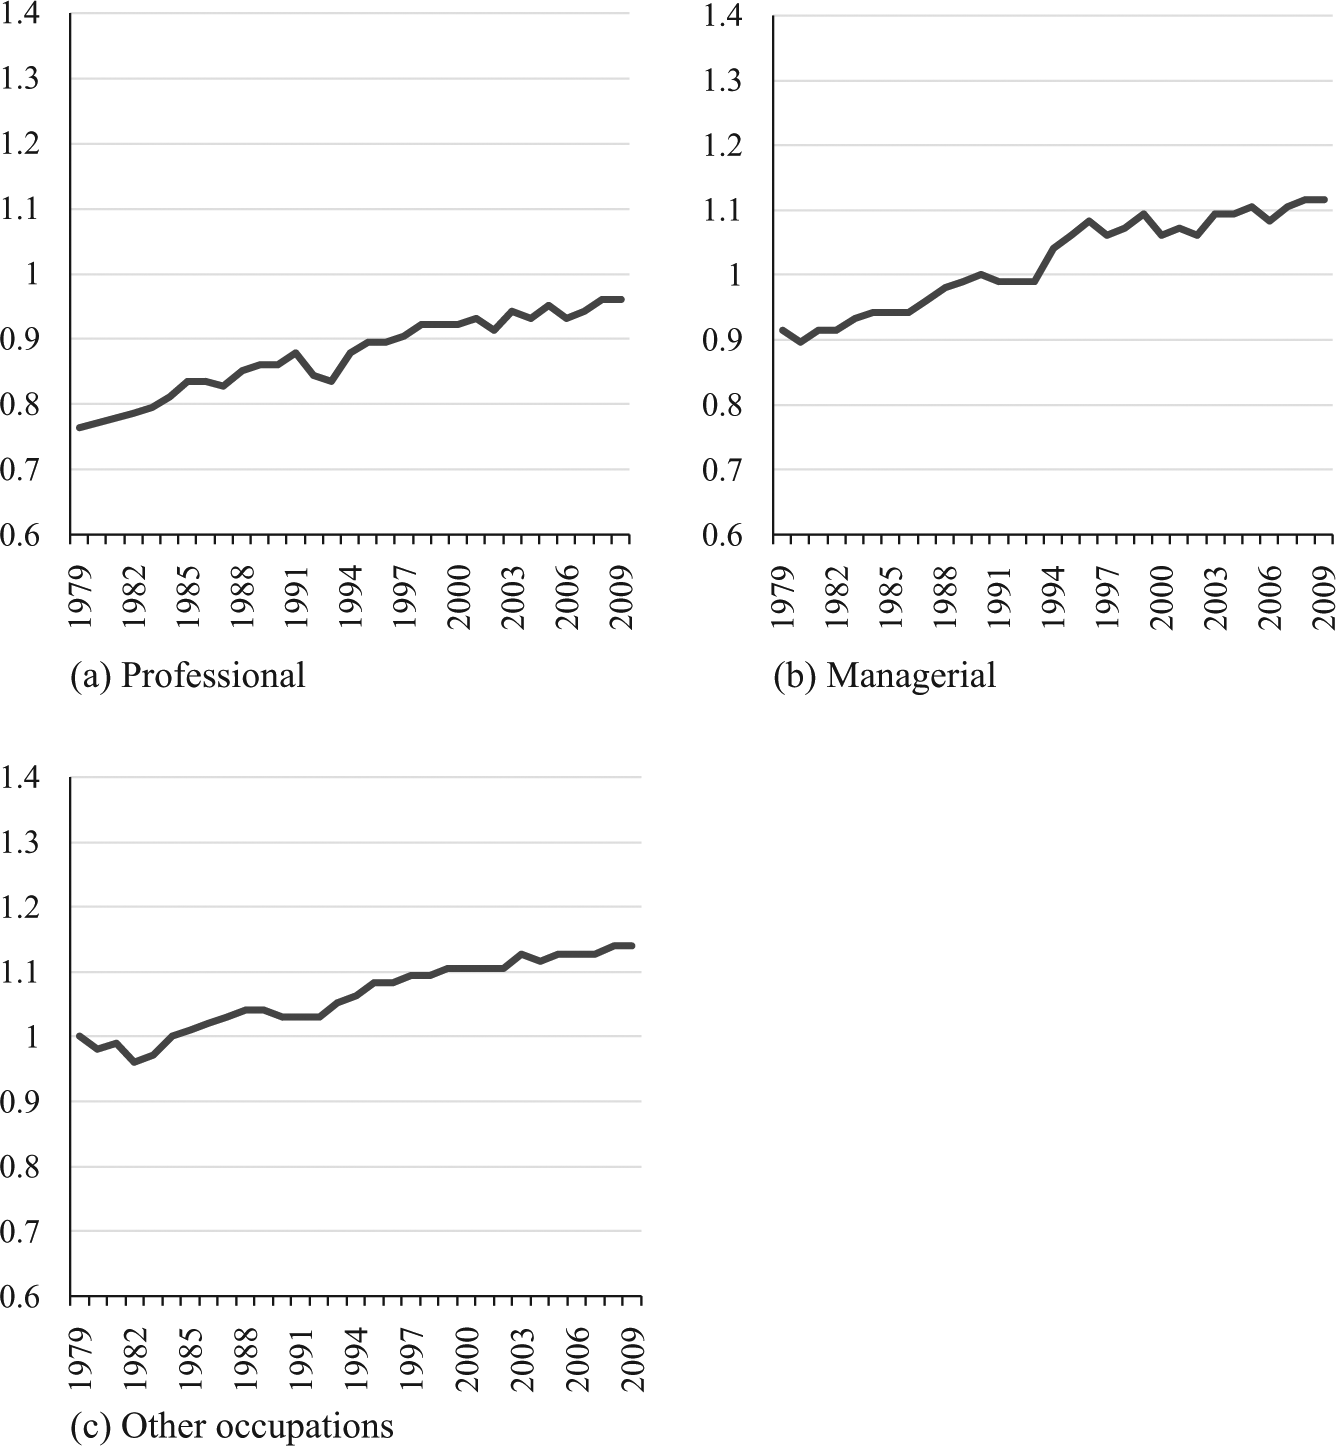
Adjusted Mean of Overworkers’ Hourly Wages as a Proportion of Full-Time Workers’ Wages, by Occupation Group
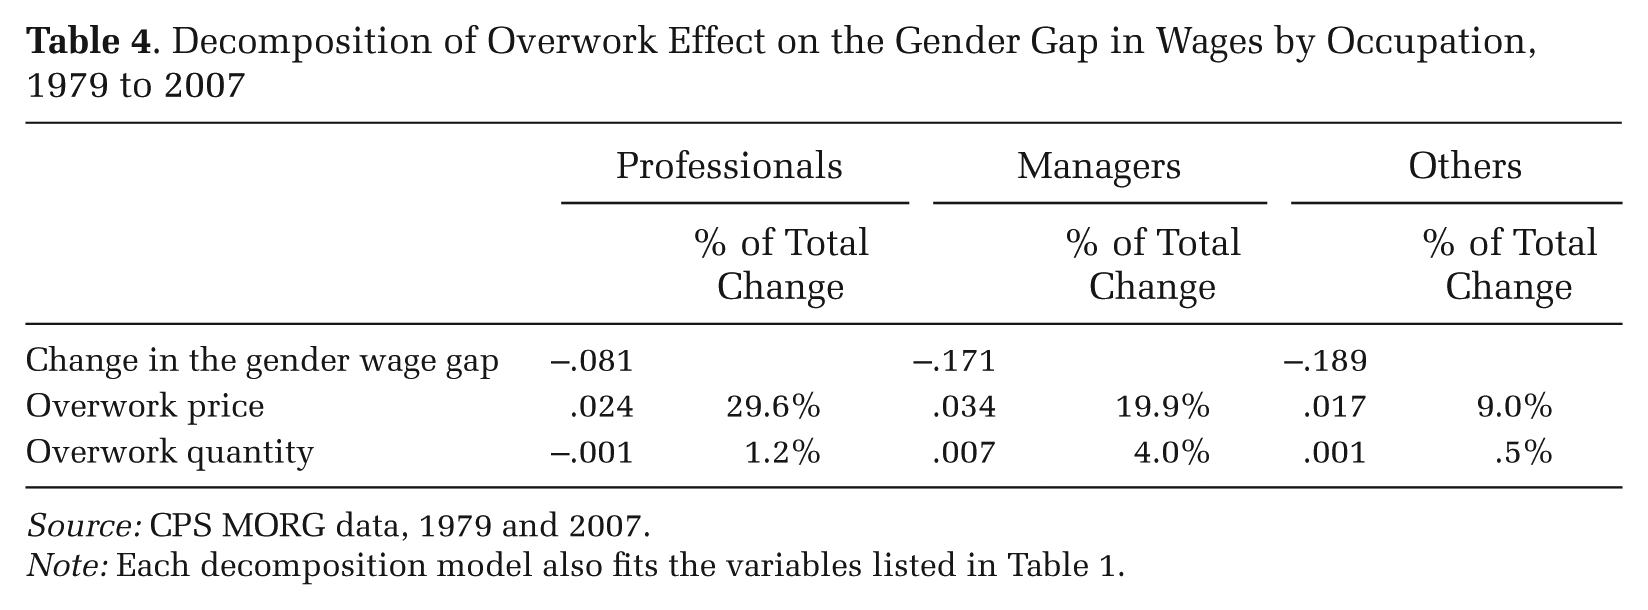
Table 4 formalizes this result, presenting JMP decompositions for the three occupation groups. (The regression coefficients used to calculate the decomposition terms are presented in Tables S3 and S4 in the online supplement.) Between 1979 and 2007, the gender wage gap declined in all three occupation groups (see Table 4, row 1). Convergence in the gender wage gap was more dramatic in managerial occupations (16 percent) than in professional occupations (8 percent), but less than the 17 percent decline in other occupations. As we observed in the full sample, changes in the composition effect of overwork in the three occupation groups are quite small (see Table 4, row 3), ranging from .5 percent (other occupations) to 4 percent (managerial occupations) of the occupation-specific change in the gender pay gap.
Decomposition of Overwork Effect on the Gender Gap in Wages by Occupation, 1979 to 2007
Source: CPS MORG data, 1979 and 2007.
Note: Each decomposition model also fits the variables listed in Table 1.
The composition effect of overwork is dwarfed by the price effect (Table 4, row 2). As we anticipated, the overwork price effects in professional and managerial occupations are especially large. In absolute terms, this price effect is greater in managerial occupations (.034 log points) than in professional occupations (.024 log points). As a percentage of total change in the gender gap in wages, the price effect is greater in professional occupations (30 percent) than in managerial occupations (20 percent). Put differently, if overwork prices had remained constant (and all other covariates’ price and composition effects were unchanged), the gender gap in wages would have declined by 20 percent more in managerial occupations than we observed in the data, and by a third as much in professional occupations. In other occupations, the price effect for overwork is more moderate (.017 log points), accounting for 9 percent of the total change in the gender gap in wages.
Conclusions
This article documents a strong empirical relationship between trends in overwork and trends in the gender gap in wages. The shift toward long work hours exacerbated the gender gap in wages, partially offsetting wage-equalizing trends in men’s and women’s educational attainment and labor force experience. Between 1979 and 2007, the growing prevalence of overwork exacerbated the gender wage gap by about 10 percent of the total wage gap, a magnitude comparable to the inequality-reducing effect of the convergence in the gender gap in education and rising returns to a college degree in our CPS data. 12 For all the attention devoted to education and labor market experience in the gender inequality literature, our findings show that growing work hours and compensation of overwork is equally important to understanding trends in the gender wage gap.
The main source of this overwork effect on the gender gap in wages did not stem from changes in the gender gap in overwork. This gap remained essentially constant over the data period. Rather, it was driven by an increase in wage returns to overwork relative to full-time work, an increase that in some occupations meant a change between a wage penalty (i.e., negative wage returns) for overwork in the 1980s to a wage premium by the 1990s. The takeoff in the hourly wages associated with long work hours was sufficient to exacerbate the gender gap in wages by an estimated 9.4 percent of the total change between 1979 and 2007.
Trends in overwork and their effect on the gender gap in wages are especially consequential for understanding the especially slow change in the gender wage gap in managerial occupations and the slight increase in the gender wage gap in the professions since the early 1990s. This stagnation is especially puzzling because these occupations are most likely to require a college degree, meaning that the rapid convergence, and for younger cohorts reversal, of the gender gap in college degree attainment should have led to unusually rapid wage convergence in these occupations. We show that this puzzle is in large part due to the effect of overwork in these occupations, where levels of overwork are high, the gender gap in overwork large, and the growth in net wage returns to overwork dramatic. Indeed, if hourly wage returns to overwork had remained constant between 1979 and 2007 (but effects of other factors remained as observed) the wage gap would have narrowed by an additional 30 percent among professionals and 20 percent among managers, compared to 9 percent in other occupations.
We also show that price changes of overwork are especially important in understanding gender wage gap trends in the 1980s and 1990s. In these two decades, which were characterized by a dramatic increase in the prevalence of overwork, the magnitude of the overwork price effect was between 10 and 18 percent of the total change in the gender gap in wages for each period (see Table 3). As important as these findings are for establishing an overwork effect on the gender gap in wages, we readily concede that our findings do not explain why convergence in the gender gap in wages all but stalled in the 2000s. During this period, overwork began to decline, and its contribution to trends in the gender wage gap likewise diminished.
Why, then, did the gender gap in wages stall in the 2000s? Our results provide some clues, although no complete answers. None of the observed covariates in the CPS do much to explain the stagnation in the gender wage gap in the 2000s, nor do the additional covariates (actual experience, job tenure, and unionization) in the SIPP data. Instead, this stall seems largely due to the reduced pace of integration of occupations (see Table 3). A second clue emerges from a supplementary analysis of the data from the 2000s (not shown), which continue to show a positive price effect of overwork for parents but not for other workers. This finding is, we think, consistent with the argument that “egalitarian essentialism”—an ideology that emphasizes equal rights but is combined with gender essentialist beliefs about intensive mothering (Charles and Grusky 2004; Cotter et al. 2011; Hays 1998)—now prevails. In the context of rising relative wages for overwork, gender essentialism about caregiving may exacerbate the motherhood penalty in wages and stagnate the gender wage gap trend by limiting mothers’ ability to benefit from these rising prices. 13
Our results also highlight the importance of a broader question for students of labor markets: Why did the hourly wages for overwork increase so spectacularly? Does this increase in the payoff for overwork reflect a change in organizational compensation practices and occupational norms about work hours, or “merely” rising productivity differences between those who overwork and those who do not? Three empirical patterns in our data suggest the trend is not driven solely by productivity changes: (1) hourly wage returns to overwork were lower than those of full-time work for professionals (in all years) and managers (during the 1980s); (2) the increase in wage returns to overwork was steepest in professional and managerial occupations, where overwork is especially prevalent; and (3) the steepest growth in wage returns to overwork occurred in the occupation decile groups with the highest proportion of overworkers (see Figure S7 in the online supplement). If wage premiums or rising wage returns for overwork solely reflect marginal productivity, one would not anticipate negative wage returns to overwork in the professional and managerial occupations at baseline, nor that trends in wage returns to overwork map onto the prevalence of overwork. These patterns are anticipated, however, if rising returns to overwork reflect rising expectations that workers in already-greedy occupations will put in long hours, and that compensation systems penalize workers who fail to meet these expectations and reward those who win the work hours game (see, e.g., Epstein et al. 1999; Landers et al. 1996).
Neither the diffusion of overwork nor changes in the relative pay of overwork took place in a vacuum. Instead, these are part of a broader constellation of changes in the social organization of work driven by macroeconomic shifts. Increased domestic and international competition has introduced new ways of organizing work as employers lay off large numbers of employees to downsize their labor force while expecting higher productivity from the survivors (Bluestone and Rose 1997; Kalleberg 2011). Global markets, and the new technologies that make them possible, have created a 24/7 economy and increased the demand for employees who can be on call any time, any day (Presser 2005). These changes have increased work hours, at least for some workers, and also ratcheted up expectations surrounding what it means to be an ideal worker.
Many of these changes in the social organization of work, including expectations surrounding work hours, appear at first glance to be gender neutral. Employers do not specify separate work hour expectations for their male and female employees, nor do they systematically reward men who overwork more than women who overwork, relative to their full-time counterparts. Nevertheless, overwork rests on a social foundation that is itself highly gendered: employees who work long hours can only do so with the support of other household members, usually women, who shoulder the lion’s share of unpaid-work obligations (Acker 1990; Hochschild [1989] 2003; Lips 2013; Ridgeway 2011). Under this system, women are less likely than men to be able to work long hours or to enjoy the rising wage payoff to long hours. The emergence of long work hours as part of the “new normal” in some occupations, the professions and management in particular, builds on and perpetuates old forms of gender inequality.
Footnotes
Appendix
Decomposition of Trends in the Gender Wage Gap, 1996 to 2004: SIPP and CPS
| SIPP | CPS | |||
|---|---|---|---|---|
| Change in differentials | −.028 | −.029 | ||
| Observed price | ||||
| All b’s | .016 | 57.1% | .008 | 27.6% |
| Overwork | .005 | 17.9% | .004 | 13.8% |
| Part-time variables | .005 | 17.9% | .001 | 3.4% |
| Age variables | .003 | 10.7% | .009 | 31.0% |
| Race variables | .001 | 3.6% | .000 | .0% |
| Education variables | −.001 | 3.6% | −.004 | 13.8% |
| Experience variables | .005 | 17.9% | n/a | |
| Potential experience variables | n/a | −.004 | 13.8% | |
| Region variables | .000 | .0% | .000 | .0% |
| Metropolitan resident | .000 | .0% | .000 | .0% |
| Sector | .000 | .0% | .002 | 6.9% |
| Union | .000 | .0% | n/a | |
| Job tenure variables | −.002 | 7.1% | n/a | |
| Observed |
||||
| All x’s | −.034 | 121.4% | −.019 | 65.5% |
| Overwork | .000 | .0% | .000 | .0% |
| Part-time variables | −.003 | 10.7% | −.005 | 17.2% |
| Age variables | −.001 | 3.6% | −.016 | 55.2% |
| Race variables | −.003 | 10.7% | −.001 | 3.4% |
| Education variables | −.012 | 42.9% | −.005 | 17.2% |
| Experience variables | −.006 | 21.4% | .0% | |
| Potential experience variables | n/a | .009 | 31.0% | |
| Region variables | .000 | .0% | −.001 | 3.4% |
| Metropolitan resident | .001 | 3.6% | .001 | 3.4% |
| Sector | .001 | 3.6% | .000 | .0% |
| Union | −.003 | 10.7% | n/a | |
| Job tenure variables | −.007 | 25.0% | n/a | |
| Unexplained differential | −.011 | 39.3% | −.018 | 62.1% |
| Unobserved prices | −.001 | 3.6% | .003 | 10.3% |
| Unobserved quantities | −.010 | 35.7% | −.021 | 72.4% |
| N | 77,373 | 302,423 | ||
Source: SIPP 1996 and 2004; CPS MORG data 1996 and 2004.
Acknowledgements
We thank Stephen Benard, Shelley Correll, Paula England, Elizabeth Hirsh, Jennifer C. Lee, Stephen L. Morgan, the ASR reviewers, and the participants of the Political, Economy, and Culture Workshop at Indiana University, the Emerging Scholars Conference at Cornell University, and the Center for the Study of Wealth and Inequality at Columbia University for their helpful comments on earlier drafts of this paper.
Funding
This research was supported by the National Science Foundation (SES-0824682), the Center for the Study of Inequality at Cornell University, and the Institute for the Social Sciences at Cornell University.
Notes
References
Supplementary Material
Please find the following supplemental material available below.
For Open Access articles published under a Creative Commons License, all supplemental material carries the same license as the article it is associated with.
For non-Open Access articles published, all supplemental material carries a non-exclusive license, and permission requests for re-use of supplemental material or any part of supplemental material shall be sent directly to the copyright owner as specified in the copyright notice associated with the article.