
Abstract
Korpi and Palme’s (1998) classic “The Paradox of Redistribution and Strategies of Equality” claims that universal social policy better reduces poverty than social policies targeted at the poor. This article revisits Korpi and Palme’s classic, and in the process, explores and informs a set of enduring questions about social policy, politics, and social equality. Specifically, we investigate the relationships between three dimensions of welfare transfers—transfer share (the average share of household income from welfare transfers), low-income targeting, and universalism—and poverty and preferences for redistribution. We analyze rich democracies like Korpi and Palme, but we also generalize to a broader sample of developed and developing countries. Consistent with Korpi and Palme, we show (1) poverty is negatively associated with transfer share and universalism; (2) redistribution preferences are negatively associated with low-income targeting; and (3) universalism is positively associated with transfer share. Contrary to Korpi and Palme, redistribution preferences are not related to transfer share or universalism; and low-income targeting is neither positively associated with poverty nor negatively associated with transfer share. Therefore, instead of the “paradox of redistribution” we propose two new paradoxes of social policy: non-complementarity and undermining. The non-complementarity paradox entails a mismatch between the dimensions that matter to poverty and the dimension that matters to redistribution preferences. The undermining paradox emphasizes that the dimension (transfer share) that most reduces poverty tends to increase with the one dimension (low-income targeting) that reduces support for redistribution.
One of the most influential articles in social policy research is Korpi and Palme’s (1998) classic “The Paradox of Redistribution and Strategies of Equality.” Korpi and Palme (hereafter KP) investigate the salient question of whether social policies should be targeted at the poor or universally distributed to all. Many scholars claim that targeting efficiently concentrates scarce resources on the neediest and better aligns with poverty-reducing incentives like encouraging work (Besley 1990; Kakwani and Subbarao 2007; Le Grand 1982; Saez 2006). Counterintuitively, KP argue that the more countries target welfare transfers at the poor, the less poverty is reduced. 1 Rather, greater equality results when transfers are distributed universally, because universalism encourages political support for a large welfare state (see also Huber and Stephens 2012; Nelson 2004; Skocpol 1992; Wilson 1996).
KP specifically explain that “institutional structures” (e.g., social insurance regimes) enable countries to exercise different “strategies of equality” (i.e., targeted or universal). These strategies create different risks and resources for different groups, which produce different interests and identities, and then manifest in political coalitions. KP (1998:663, 672) claim that “[t]he targeted model creates a zero-sum conflict of interests between the poor and the better-off workers and the middle classes who must pay for the benefits of the poor without receiving any benefits . . . [targeting] drive[s] a wedge between the short-term material interests of the poor and those of the rest of the population.” Conversely, universalism “brings low-income groups and the better-off citizens into the same institutional structures . . . can be expected to have the most favorable outcomes in terms of the formation of cross-class coalitions . . . [and] pool[s] the risks and resources of all citizens and thus create[s] converging definitions of interest” (KP 1998:672, 682).
The resulting political coalitions drive “redistributive budget size,” which is the average percent of household income from transfers (what we call “transfer share”). KP critique past research for focusing on how transfers are distributed and neglecting the amount distributed, and they demonstrate that redistributive budget size reduces poverty and inequality. Because universal welfare states “are expected to generate the broadest base of support for welfare state expansion and the largest budget size” (KP 1998:672), universalism means less poverty and inequality. In contrast, KP demonstrate that low-income targeting reduces the redistributive budget size and increases poverty and inequality. KP (1998:672, 681–82) thus conclude that “we can expect a tradeoff between the degree of low-income targeting and the size of the redistributive budget size, such that the greater the degree of low-income targeting, the smaller the redistributive budget [emphasis in original]. . . . The more we target benefits at the poor . . . the less likely we are to reduce poverty and inequality.”
This article revisits KP’s classic. Moreover, we use this as an opportunity to explore and inform a set of enduring questions about social policy, politics, and social equality. In the process, we advance arguments about the political/institutional sources of poverty and inequality. We apply and extend theories about how social policy feeds back into the politics of social policy. We also engage with debates regarding the measurement of welfare states, and the generality of welfare state theories beyond rich democracies. Concretely, we investigate how three dimensions of welfare transfers—transfer share (i.e., KP’s redistributive budget size), low-income targeting, and universalism—are related to poverty and redistribution preferences. While we ground our empirical results in comparisons with KP’s classic, we address the following broader questions: How do social policies shape both equality and politics? Are effective social policies also politically popular, and are effectiveness and political popularity complementary? Do different dimensions of social policy reinforce or contradict each other?
KP oriented and inspired a great deal of scholarship. 2 While a few have reinvestigated their study, we propose three reasons for doing so. First, the data and methods available have improved considerably. KP’s analyses were based on macro-level correlations in Luxembourg Income Study (LIS) data on 11 rich democracies in the mid-1980s. 3 By including all countries in recent waves of the LIS and International Social Survey Programme (ISSP), we examine a larger sample of rich democracies and a broader sample of developed and developing countries in the mid-2000s. In addition, the ISSP enables us to analyze the individual-level preferences theorized but unobserved by KP (i.e., identities and interests). Relatedly, we move beyond KP’s macro-level analyses to use multilevel models that include both individual- and country-level influences on poverty and redistribution preferences.
Second, there have been fundamental changes since the mid-1980s period KP studied. Social inequality has risen considerably in most rich democracies, and the political coalitions supporting welfare states have been transformed. Partly as a result, the welfare states of the mid-2000s are quite different from the welfare states of the mid-1980s (Brooks and Manza 2007; Emmenegger et al. 2012; Huber and Stephens 2001; Wilensky 2002). Earlier welfare states were often still growing, rested on low unemployment and smaller elderly populations, and covered most residents. By contrast, today’s welfare states face neoliberalism and austerity, a dualization of insiders and outsiders, and daunting demographics. Therefore, even if KP’s arguments were correct in the mid-1980s, it remains an open question if they still apply today.
Third, because data are available for many more countries, we assess whether the paradox of redistribution generalizes to a larger share of the world’s population and countries. Although there is variation across rich democracies, there is even greater variation when incorporating developing countries. Even though developing countries are often nondemocratic, they have social policies, their public has preferences, and public support matters. Indeed, “the overwhelming number of social insurance programs were initially adopted by nondemocratic governments,” and the first social insurance programs were established in nondemocratic Germany and Austria (Mares and Carnes 2009:97). While there is less research on social policy in developing/nondemocratic countries, there has been growing interest in the social sciences and international institutions (Golden and Min 2013; Haggard and Kaufman 2008; Huber and Stephens 2012; Mares and Carnes 2009). Therefore, a broader sample of developed and developing countries is useful for assessing the generality of KP and related theories of social policy, politics, and social equality.
Several of our results are consistent with Korpi and Palme: poverty is negatively associated with transfer share and universalism; redistribution preferences are negatively associated with low-income targeting; and universalism is positively associated with transfer share. Other results are contrary to Korpi and Palme: redistribution preferences are not related to transfer share or universalism; and low-income targeting is neither positively associated with poverty nor negatively associated with transfer share and universalism. Building from these results, we advance a more general argument about the paradoxes of social policy. We define paradoxes as mismatches between the sources of social policies’ effectiveness (i.e., low poverty) and political popularity (i.e., high redistribution preferences), and contradictions between the three dimensions of welfare transfers. Using this definition of paradoxes, we propose two new paradoxes: non-complementarity and undermining. The non-complementarity paradox entails a mismatch between the dimensions that matter to poverty and the dimension that matters to redistribution preferences. The undermining paradox emphasizes that the dimension (transfer share) that most reduces poverty tends to increase with the one dimension (low-income targeting) that reduces support for redistribution. We conclude by discussing implications for a variety of related literatures.
Dimensions of Welfare Transfers
This section accomplishes three tasks. First, we conceptually and operationally define the three dimensions of welfare transfers. Our measures of transfer share and low-income targeting build on KP’s measures. We propose a novel measure of universalism as a third dimension that is distinct from (not simply the opposite of) low-income targeting. To make these dimensions concrete, Table 1 displays countries exemplifying each dimension. Second, we present arguments from KP and the literature for how each dimension should be related to poverty and redistribution preferences. When appropriate, we discuss how these relationships could be different in the broader sample of developed and developing countries. Third, we propose reasons for the plausibility of the two new paradoxes of welfare transfers.
Example Countries for Dimensions of Welfare Transfers Based on Individual-Level Population-Weighted Analyses in LIS
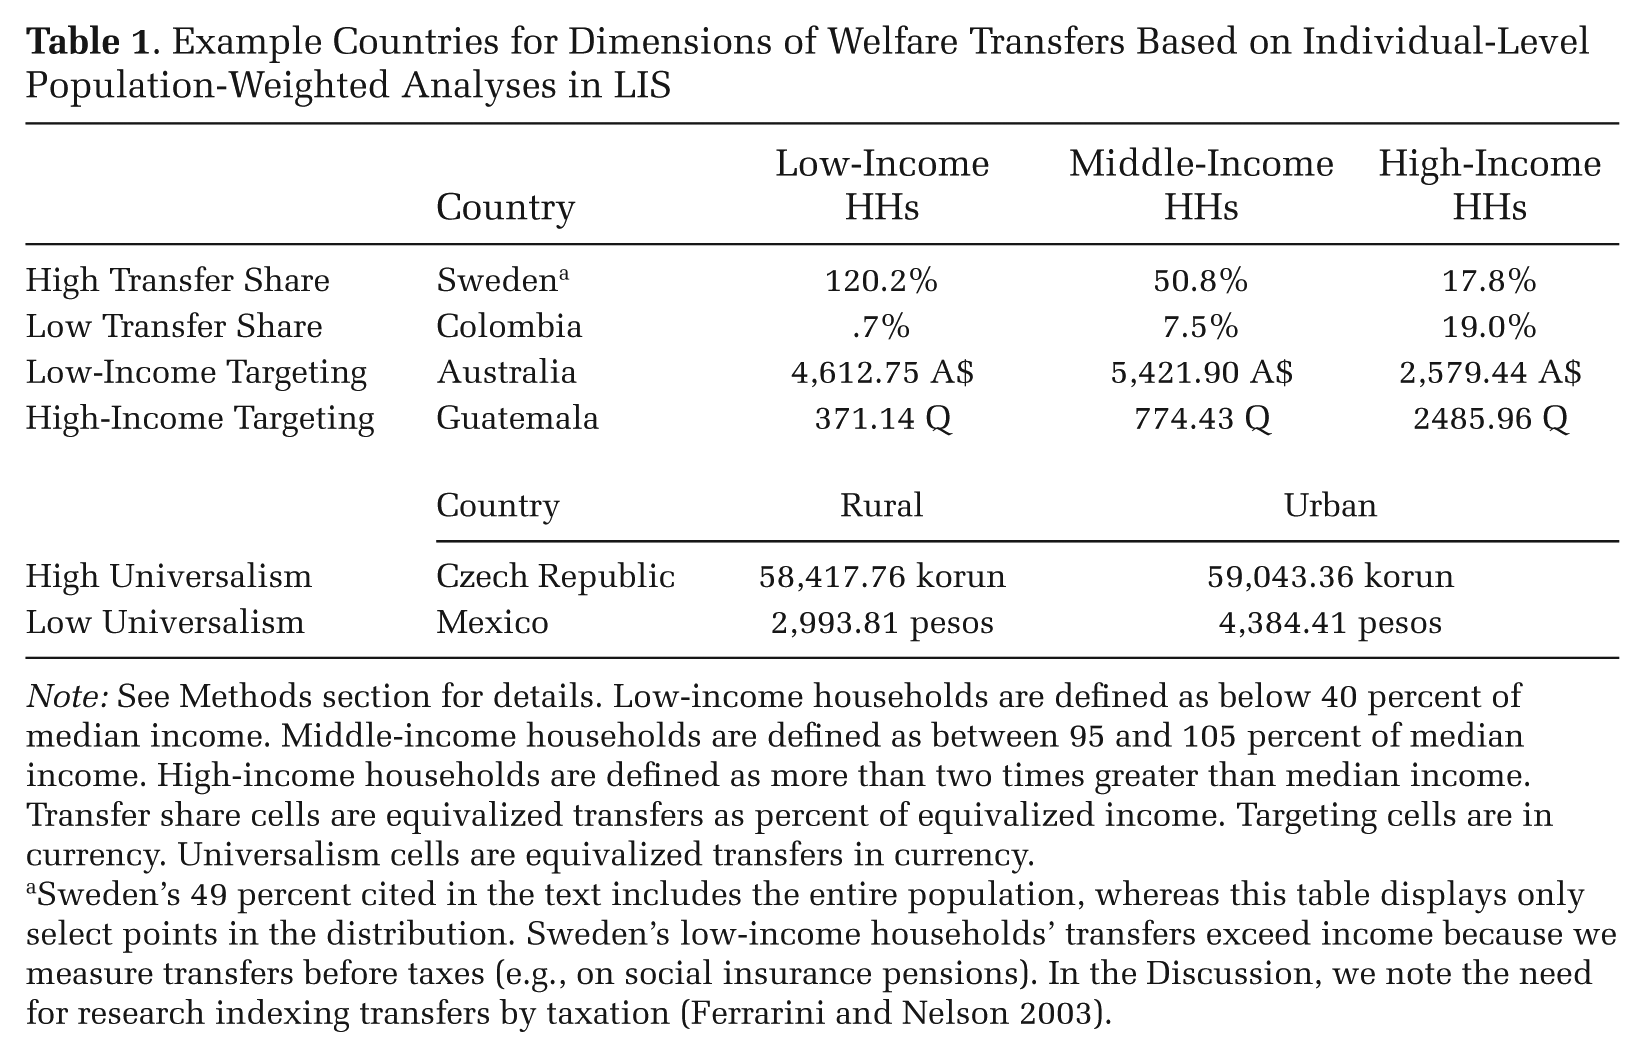
Note: See Methods section for details. Low-income households are defined as below 40 percent of median income. Middle-income households are defined as between 95 and 105 percent of median income. High-income households are defined as more than two times greater than median income. Transfer share cells are equivalized transfers as percent of equivalized income. Targeting cells are in currency. Universalism cells are equivalized transfers in currency.
Sweden’s 49 percent cited in the text includes the entire population, whereas this table displays only select points in the distribution. Sweden’s low-income households’ transfers exceed income because we measure transfers before taxes (e.g., on social insurance pensions). In the Discussion, we note the need for research indexing transfers by taxation (Ferrarini and Nelson 2003).
Transfer Share
We rename KP’s “redistributive budget size” as “transfer share.” Conceptually, transfer share can be understood as the size or extent of the welfare state within the average household’s income. This captures the share of household income that is socialized or publicly provided. Transfer share can be measured as the mean percent of household income from welfare transfers. As Table 1 illustrates, transfers average 49 percent of Swedish household income. Low-income Swedish households receive a very high share from transfers, middle-income households receive a fairly high share, and high-income households receive a moderate share. By contrast, the transfer share is only 7 percent in Colombia.
Transfer share is similar to a household-level version of welfare effort, because both are measures of the size of the welfare state. Indeed, in 29 countries with data, transfer share correlates .70 with welfare expenditures as a percent of GDP. This is noteworthy because many criticize the quantity of welfare effort as less important than the quality of welfare programs (Esping-Andersen 1999; Korpi 1989). Esping-Andersen (1990:19), for example, criticizes welfare effort as “epiphenomenal to the theoretical substance of welfare states.” 4 Purportedly, welfare effort conflates welfare generosity with the needs and composition of the population, and mechanically grows with an aging population or rising unemployment. Similarly, the transfer share reflects both welfare generosity and the prevalence of households with recognized needs.
Despite the many critiques of welfare effort, KP show that transfer share is pivotal to poverty and inequality. Similarly, Brady and Burroway (2012) demonstrate that transfer share, not generous benefits targeted specifically for single mothers, best predicts single mother poverty. 5 Also, recent LIS research shows that welfare effort predicts inequality and poverty quite well, and possibly even better than more sophisticated measures like decommodification (Brady 2009; Brady, Fullerton, and Cross 2009; Moller et al. 2003). Therefore, we expect transfer share to be negatively associated with poverty for at least two reasons. First, household income is composed of (A) less equally distributed market income and (B) more equally distributed public transfers. As household income shifts from A to B, poverty should mechanically decline. Also, as B grows relative to A, public transfers crowd out private transfers and pensions, further reducing poverty and inequality (Huber and Stephens 2012; Korpi and Palme 1998). Second, even though the transfer share may conflate needs and generosity, this criticism obscures the political choices about which needs receive public support. Welfare states politically choose to automatically spend money on the unemployed or elderly, and not to spend money automatically on other risk groups. Thus, by raising the transfer share in response to certain needs, welfare states choose to recognize and legitimate those needs. That is, welfare states choose to publicly cover and publicly provide for (i.e., socialize) those particular risks. If countries choose to socialize more risks and publicly provide for a larger group of people, a greater transfer share and lower poverty should result. Conversely, when welfare states fail to recalibrate or update programs to face new demographic and economic risks, a lower transfer share and greater poverty should result (Hacker 2004).
Moving beyond rich democracies, transfer share could have a weaker relationship with poverty because social policies in developing countries are typically exclusive (Haggard and Kaufman 2008; Huber and Stephens 2012; Mares and Carnes 2009). Developing countries often contain a relatively privileged, formally employed elite—often employed in the public sector and with access to welfare programs—and informally employed masses excluded from such programs (Portes and Hoffman 2003). Therefore, transfer share, measured as the population average, might conceal a highly skewed dualization of transfers (Emmenegger et al. 2012). On the other hand, transfer share might be even more strongly associated with poverty in the broader sample. A high transfer share may be necessary to reach beyond a privileged elite and incorporate low-income households into social policies.
Reflecting the mix of norms and interests driving redistribution preferences, there is uncertainty about the relationship between transfer share and redistribution preferences. Literatures on path dependency suggest large welfare states reflect and amplify egalitarian norms and beliefs (Brooks and Manza 2007; Korpi and Palme 1998; Larsen 2008; Nelson 2007; Pierson 2004; Sachweh and Olafsdottir 2010). Also, a high transfer share means a larger pool of beneficiaries and stakeholders, who have an interest in programs being maintained or expanded (Huber and Stephens 2001; Pierson 2004; Rothstein 1998). Thus, a high transfer share may positively feed back into and increase redistribution preferences. Conversely, a high transfer share requires high taxation, and high taxation should be associated with greater variation between rich and poor in redistribution preferences (Beramendi and Rehm 2011; Wilensky 2002). Such variation should result in a lower mean level of redistribution preferences (Svallfors 2006). Moreover, large government budgets and budget deficits, usually required by a high transfer share, have increasingly been framed as grievances and undermine the popularity of welfare programs (Fernandez and Jaime-Castillo 2013). As a result, there may be negative feedback such that redistribution preferences are negatively associated with transfer share.
Low-Income Targeting
Low-income targeting is conceptually defined as the disproportionate concentration of welfare transfers in low-income households (Besley 1990; Le Grand 1982). Targeting is typically justified because it efficiently focuses scarce public funds on the neediest (Blank 1997) and avoids “leakage,” when the affluent or middle class are the primary beneficiaries. Some scholars claim targeted programs also avoid disincentives to poverty-reducing behaviors like work and marriage (Saez 2006). As Table 1 shows, Australia targets to low-income households more than other countries. Middle-income households in Australia receive more than twice the transfers of high-income households, and low-income households receive about 1.8 times the transfers of high-income households.
The literature, including KP, often treats universalism as the opposite of low-income targeting and places countries on a continuum from targeted to universal (e.g., Kenworthy 2011). However, transfers can be targeted to low- or high-income households, and targeting to high-income households is common in developing countries (Huber and Stephens 2012; Mares and Carnes 2009). Therefore, the opposite of low-income targeting is high-income targeting, not universalism. Indeed, Table 1 shows that Guatemalan high-income households receive about 3.2 times more transfers than do middle-income households and about 6.7 times more transfers than low-income households.
KP (1998:677) argue that low-income targeting should be positively associated with poverty. Partly, this is because targeting should result in a lower transfer share. KP (1998:672) write that “it is impossible to maximize both the degree of low-income targeting and budget size.” While some work highlights targeting’s efficiency, there are several unanticipated ways it ultimately devotes less resources to actual assistance. Targeting requires monitoring and screening of beneficiaries, which is administratively expensive and often results in arbitrary and discriminatory exclusion of beneficiaries and lower take-up (Piven and Cloward 1993; Rothstein 1998; Soss, Fording, and Schram 2011). Contrary to the targeting efficiency literature, other scholars argue that targeting counterproductively discourages work and poverty-reducing behavior by forcing unreasonable choices between employment and welfare (Edin and Lein 1997). Despite these expectations for a positive relationship between targeting and poverty, targeting may have a different relationship in the broader sample. In developing countries, transfers are often biased in favor of middle- or upper-class insiders, and expanding coverage could require reaching downward in the income distribution (Huber and Stephens 2012). Therefore, targeting transfers to the bottom-half or even bottom-two-thirds of the income distribution may better remedy poverty.
As explained by KP, low-income targeting is unpopular and should be negatively associated with redistribution preferences (Esping-Andersen 1999; Skocpol 1992). Targeting stigmatizes the disadvantaged, splits the working class, drives a wedge between the poor and others, and discourages broad coalitions for welfare programs. Scholars often explain the reluctance to support social policy in the United States as an interaction of racial prejudice and the targeting of welfare toward the “undeserving” poor (Katz 2001; Soss et al. 2011; Wilson 1996). Even among economists advocating the efficiency of targeting, there has been little rebuttal to claims that targeting is unpopular, weakens redistribution preferences, and negatively feedbacks into politics (Blank 1997; Saez 2006; but see Sen 1995).
Universalism
Universalism is one of the most widely used concepts in this literature. However, surprisingly few works actually define universalism. KP (1998:669, 672) do not really define universalism but refer to “programs covering all citizens. . . . All citizens in the same programs . . . low-income groups and the better-off citizens in the same institutional structures.” Esping-Andersen (1990:25) alludes to universalism: “All citizens are endowed with similar rights, irrespective of class or market position.” He (1990:69) also characterizes the socialist regime as universal because it “exhibit[s] the lowest level of benefit differentials” and refers to “pooling all risks, bad or good, under one umbrella” (1999:41). Rothstein (1998) describes universalism as uniform rules, non–means-tested benefits, and coverage of the entire population through different stages of life.
We conceptually define universalism as homogeneity across the population in benefits, coverage, and eligibility. 6 We propose a novel measure of universalism as the inverse of the coefficient of variation in the amount of transfers received. To understand this measure, consider welfare transfers linked to employment (i.e., earnings-related benefits), which KP frame as a comparatively universal program. Because of unequal market incomes, KP concede that such programs disproportionally reward high earners. Nevertheless, KP argue that earnings-related benefits have greater homogeneity than do targeted benefits, because earnings-related programs distribute something to nearly everyone. In a context of high employment, such programs also have relatively broad coverage and relatively open eligibility (pp. 672, 680). All this leads to transfer homogeneity.
As noted earlier, universalism is not simply the opposite of low-income targeting. Nor is universalism simply an absence of low- or high-income targeting. While targeting involves heterogeneous benefits across the income distribution, there can be heterogeneity by sex, age, or other categories. These categories are never perfectly associated with income distribution. Therefore, universalism captures a wider variety of sources of heterogeneity and distinctively involves homogeneity of benefits in general and across any and all categories (not just the income distribution). Indeed, as we will demonstrate, universalism and low-income targeting are not correlated in a way that indicates they reflect the same dimension.
Table 1 compares transfers across urban and rural areas to illustrate universalism. In the Czech Republic, both rural and urban households receive transfers of about 59,000 korun. In Mexico, rural households receive less than 3,000 pesos of transfers and urban households receive almost 4,400 pesos. The Czech Republic, where urban households receive only about 1 percent more transfers than rural households, has much greater universalism than Mexico, where urban households receive about 46 percent more transfers than rural households.
According to KP, universalism should reduce poverty more than targeting. Like targeting, universalism should have an indirect relationship with poverty through the intervening effect on transfer share. Thus, omitting transfer share, we expect a negative relationship between universalism and poverty. Universalism should crowd out private insurance and transfers, increasing equality (Huber and Stephens 2012; Korpi and Palme 1998). Furthermore, universalism should be negatively associated with poverty because it delivers more resources to actual assistance and avoids the administrative and supervisory costs of targeting. Universalism also better addresses the heterogeneous risks that vulnerable households face. People become eligible for targeted programs only after falling into poverty, whereas universalism reduces the chances and costs of risks (e.g., illness) and thus prevents descents into poverty (Krishna 2007). Universalism thus reduces poverty because it protects everyone from a wide variety of insecurities and risks (Nelson 2004). Just as some scholars are skeptical that targeting actually reduces disincentives to work and poverty-reducing behavior, other researchers argue that universalism removes such disincentives because more people share basic rights to public services like health care (Lindert 2004). Finally, the literature on developing countries makes similar arguments about universalism’s effectiveness in reducing poverty (Huber and Stephens 2012; Mares and Carnes 2009).
A key reason universalism should be negatively associated with poverty is because it is politically popular (Esping-Andersen 1990, 1999; Gingrich and Ansell 2012; Korpi and Palme 1998; Nelson 2007; Skocpol 1992; Wilson 1996). Similar to transfer share, universalism implies that all are equal stakeholders and constituencies of beneficiaries, who have an interest and normative belief in maintaining social policies (Pierson 2004). Because universalism implies greater homogeneity in the probability of receiving transfers, welfare transfers should have more broadly shared support (Beramendi and Rehm 2011; Gingrich and Ansell 2012). Larsen (2008) argues that universalism suppresses public discussion of the neediness, deservingness, otherness, and worthiness of beneficiaries, and many researchers argue that universalism lessens the stigma of being a recipient (Katz 2001). Therefore, universalism should be positively related to redistribution preferences. In developing and newly democratic countries, Huber and Stephens (2012) show that universalism favors leftist parties and the expansion of social policy. Therefore, universalism should be positively associated with redistribution preferences in the broader sample as well.
Paradoxes of Social Policy
KP’s paradox is that policies designed manifestly to aid the poor (i.e., low-income targeting) undermine the political coalitions supporting a high transfer share and thus ultimately increase poverty. Accordingly, we should observe that (1) transfer share and universalism are negatively and low-income targeting is positively associated with poverty; (2) universalism is positively and low-income targeting is negatively associated with redistribution preferences; and (3) transfer share is negatively associated with low-income targeting and positively associated with universalism. These patterns should occur because the most egalitarian welfare states combine universalism and a high transfer share; and the least egalitarian combine low-income targeting and a lower transfer share. In KP, universalism is self-sustaining and there is a complementarity between universalism’s effectiveness and popularity.
We propose that two other paradoxes are plausible. We define paradoxes as mismatches between the sources of social policies’ effectiveness (i.e., low poverty) and the sources of social policies’ popularity (i.e., high redistribution preferences), and contradictions between the three dimensions of welfare transfers. We view paradoxes as challenges to the mutual alignment of various outcomes of social policies, and as tensions or undercutting dynamics between different aspects of welfare states. We label these two new potential paradoxes non-complementarity and undermining.
The non-complementarity paradox implies a mismatch between the dimensions that matter to poverty and those that matter to redistribution preferences. This paradox could emerge if transfer share is negatively associated with poverty but unrelated to redistribution preferences. This is plausible because although the literature expects that transfer share reduces poverty, this work is uncertain about the relationship between transfer share and redistribution preferences. Unlike KP, this paradox does not present egalitarianism as self-sustaining. Rather, effective social policies do little for the popularity and politics of social policies. In this paradox, there is a lack of alignment, which is salient given KP’s claim of complementarity.
Regarding the undermining paradox, recall that the literature expects the transfer share will reduce poverty and low-income targeting will undermine redistribution preferences. KP contend that transfer share and low-income targeting are inversely related, which avoids a contradiction because an increase in transfer share coexists with less low-income targeting. However, KP’s analyses were based on only 11 rich democracies in the mid-1980s. By contrast, Kenworthy (2011) and Marx, Salanauskaite, and Verbist (2013) provide evidence that transfer share is positively correlated with low-income targeting in recent years. Furthermore, many developing countries target transfers toward high-income households, and such developing countries may also maintain a low transfer share, which suggests a positive relationship between the two. Therefore, it is plausible that the dimension reducing poverty (i.e., a high transfer share) may increase with the dimension reducing redistribution preferences (i.e., greater low-income targeting). In this scenario, a social policy would increase both the transfer share and low-income targeting, which would work at cross-purposes by reducing poverty and weakening redistribution preferences. Weakening redistribution preferences could then undermine the politics and coalitions supporting the transfer share (Brooks and Manza 2007; Korpi and Palme 1998; Nelson 2007).
Methods
The analyses are conducted in two stages. The first stage predicts individual poverty as a function of country-level dimensions of welfare transfers and individual-level characteristics. These individual-level data come from the Luxembourg Income Study (LIS) (2013), and the unit of analysis is an individual of any age. The second stage predicts individual redistribution preferences as a function of country-level dimensions of transfers and individual-level characteristics. These individual-level data come from the International Social Survey Program (ISSP Research Group 2008), and the unit of analysis is an individual adult. Descriptive statistics are displayed in Table A1 in the Appendix.
Each stage initially examines all rich countries with available data that have been stable, free democracies for more than two decades. Then, we examine all countries with available data, regardless of development or democracy. We analyze the rich democracies separately to be comparable with KP. One reading is that the paradox of redistribution was intended to apply only to rich democracies. Indeed, Huber and Stephens (2012) show that it takes 20 years for a democracy to enable public opinion and parties to cohere for or against social policy. So, while it is valuable to assess generalizability in a broader sample, it is also appropriate to analyze rich democracies separately. If readers are skeptical about extending KP’s paradox to a broader sample, the analyses of rich democracies provide a closer comparison with KP.
Because some LIS countries are not available in the ISSP, the samples differ across stages (see Table S1 in the online supplement [http://asr.sagepub.com/supplemental]). The first stage contains analyses of 20 rich democracies (N = 838,019) and 37 countries (N = 1,746,650). The second stage contains analyses of 16 rich democracies (N = 15,887) and 25 countries (N = 26,752).
As we will explain, both dependent variables are binary. Due to the clustering of individuals within countries and the inclusion of country-level variables, we use multilevel logistic regression models. We estimate random-intercept models that can be expressed as two equations (Raudenbush and Bryk 2002). First, the log odds of a dependent variable

Second, each country intercept (β0j) is estimated as a function of a general intercept

Because even the broader sample contains a limited number of countries, we focus on random-intercept models and mostly treat the individual-level variables as fixed effects. Due to the limited number of countries and the occasionally strong correlations between the dimensions of transfers (see the next section), it is essential to be parsimonious at level 2 (Stegmueller 2013). 7
Still, multilevel analyses have two major advantages over the macro-level approach used by KP (also Kenworthy 2011; Marx et al. 2013). First, multilevel models condition covariation in the dependent and level-2 variables by the individual-level variables. For example, poverty is likely associated with marital status, employment, and education. Failing to adjust for such level-1 characteristics conflates the level-2 effects with unobserved differences in population heterogeneity. Because macro-level analyses have limited degrees of freedom, it is not feasible to condition on all the country-level aggregates of these level-1 characteristics. By adjusting for the level-1 variables, the models assess the association between the dependent variables and dimensions of welfare transfers net of countries’ demographic and labor market compositions. Therefore, a multilevel analysis should result in more accurate estimates of level-2 effects. Second, multilevel models more efficiently estimate level-2 effects than do macro-level models by estimating level-2 effects while sharing individual-level information between countries (Gelman and Hill 2006).
To ensure the results are robust and not unduly influenced by any countries, we conducted several sensitivity analyses, summarized on page 3 of the online supplement (Van der Meer, Te Grotenhuis, and Pelzer 2010). We reestimated the final models while dropping one country at a time. We also tested for outlier and particularly influential countries. The conclusions and results are mostly robust, and we discuss any consequential sensitivity analyses within the results.
Country-Level Measures of Dimensions of Welfare Transfers
Like KP, we measure welfare transfers actually received. Much has been learned from precise program criteria and official rules (Esping-Andersen 1990; Korpi 1989; Nelson 2004; Scruggs 2008). Nevertheless, it is essential to also study the take up of transfers (Van Oorschot 1991, 2013). Doing so identifies those who are eligible for benefits but who do not enroll or receive benefits. Many individuals do not receive the transfers they are legally entitled to (Shaefer 2010), and administrative burden and implementation routinely constrain the generosity of welfare programs (Piven and Cloward 1993; Soss et al. 2011). Furthermore, measures based on program criteria are forced to concentrate selectively on a few measurable programs such as unemployment insurance. Unfortunately, spending on different programs is not highly correlated across countries, and focusing on particular programs obscures the distinctive mixes of various countries (Castles 2008). The reality is that households have a variety of strategies to pool a variety of transfers to make ends meet (Edin and Lein 1997; Rainwater and Smeeding 2004). Thus, by comprehensively measuring cash and near cash transfers, one can capture much more of the distribution of interdependent transfers received (Van Oorschot 2013; Wilensky 2002).
The LIS provides data on the dimensions of transfers. The LIS is an archive of individual-level datasets from several dozen countries. It (1) contains fine-grained information on a variety of transfers; 8 (2) is nationally representative; and (3) is cross-nationally harmonized. This is one of the few studies to include all LIS countries (as of April 2014). For Australia, however, it is not possible to differentiate between low and medium education, and Brazil lacks information on marital status. Therefore, we include Australia and Brazil only in the figures but not in the multivariate models. The results, however, are not sensitive to including these countries. Mostly, we use datasets from the mid-2000s (see Table S1 in the online supplement) because this allows us to place the country-level measures slightly prior to the observation of redistribution preferences in 2006. If a dataset was not available for the mid-2000s, we included a dataset as early as 2000 and as late as 2008.
The key measures for calculating the dimensions of transfers are household public transfers and disposable household income (see page 4 of the online supplement for LIS code). For transfers, we use the standardized LIS measures of the value of total government assistance received as cash and near cash transfers. This includes monetary social insurance, monetary universal transfers, and (monetary and nonmonetary) social assistance. Like KP (see their note 6), we cannot include services. We measure disposable household income after taxes and transfers. Transfers and income are equivalized by dividing by the square root of the number of household members.
Transfer share is the mean of transfers as a percent of disposable household income. As noted earlier, this is basically KP’s redistributive budget size. We differ only in that KP measure transfers as a percent of pre-tax gross income. We contend that transfers matter relative to disposable income after taxes and transfers. Plus, in several countries, income data are available only post-tax (i.e., net not gross). Low-income targeting is the Kakwani concentration coefficient of transfers across the distribution of pre-transfer equivalized household income (Besley 1990; Kakwani and Subbarao 2007; Korpi and Palme 1998; Le Grand 1982). 9 This is the same measure KP use. The Kakwani index ranges from −1, which indicates the poorest person receives all transfers, to +1, which indicates the richest person receives all transfers. We reverse code the index so that +1 is maximal low-income targeting. Universalism is calculated as 1 over the coefficient of variation of the absolute amount of transfers. This measures the homogeneity in transfer amount across the population.
In analyses available upon request, we experimented with interactions of the three dimensions. For example, Esping-Andersen (1999:79) argues that social democracies are more egalitarian because of the “fusion” of generosity and universalism. Also, KP (1998:672) imply that redistribution is a function of the interaction of low-income targeting and transfer share. However, all interaction effects were insignificant for both dependent variables.
Individual-Level Measures for Poverty Analyses
The first dependent variable is relative poverty (poor = 1). We define individuals as poor if they reside in a household with less than 50 percent of the median equivalized disposable income after taxes and transfers. Like transfers, income is equivalized by dividing by the square root of the number of household members. This measure follows the vast majority of international poverty research and is the same measure KP used (Brady 2009; Brady, Baker, and Finnigan 2013; Moller et al. 2003; Rainwater and Smeeding 2004). Relative poverty is also most relevant to the paradox of redistribution and more consistent with redistribution preferences. The paradox concerns relative deprivation and inequality within a given income distribution. It is also difficult to construct a cross-nationally reliable absolute measure across such a diverse set of countries. 10 Thus, although absolute poverty could be explored in future research, we concentrate on relative poverty.
As we will discuss, KP were also interested in income inequality. However, because income inequality is typically a country-level variable without a clear individual-level version, the multilevel models focus on poverty. Relative poverty is very highly correlated with income inequality (r > .9), and income inequality correlates with the dimensions similarly to relative poverty.
Following previous research (Brady et al. 2013; Brady and Burroway 2012; Brady et al. 2009; Rainwater and Smeeding 2004), the models adjust for individual- and household-level variables. Both age and age2 are in years for the lead earner in the household. Family structure is measured with binary variables for single mother, female head no children, and male head no children (reference = married and single father households). 11 We also include the number of children and the number of elderly (over age 64) in the household. With secondary degree or some college as the reference, education of the lead earner is measured with binary variables for less than a secondary degree (low education) and university degree or higher (high education). Finally, we measure household employment with binary variables for no workers in household and multiple workers in household (reference = one worker).
Individual-Level Measures for Redistribution Preferences Analyses
Data on redistribution preferences are from the ISSP’s 2006 “role of government” module. The ISSP is a set of standardized, nationally representative surveys from several dozen countries. The second dependent variable is based on the question: “On the whole, do you think it should or should not be the government’s responsibility to reduce income differences between rich and poor?” Response categories were originally ordinal as “definitely should be, probably should be, probably should not be, and definitely should not be.” These are collapsed into the binary of should be (1) and should not be (0). 12
We concentrate on this question for several reasons. First, this question most directly assesses the preference for redistribution (Cusack, Iversen, and Rehm 2005, 2008), which is paramount for KP’s “identities and interests.” Second, international scholars mainly focus on these questions about the “government’s responsibility” and especially this question (Brady and Finnigan 2014). Third, alternative questions about spending preferences are relative to each country’s current spending, which makes them less cross-nationally comparable and conflates attitudes about government responsibilities with perceptions of the efficacy and efficiency of government programs and taxation (Svallfors 2006). Finally, redistribution preferences are substantively important. Past research shows this question predicts party affiliation (Cusack et al. 2005), and the aggregate of this question is associated with inequality (Kelly and Enns 2010; Lupu and Pontusson 2011) and welfare generosity (Brooks and Manza 2007). In the ISSP, we find redistribution preferences are significantly positively associated with left party affiliation. Finally, Table S2 in the online supplement displays similar results with a scale of six related ISSP questions about government’s responsibility.
Following prior research (Brady and Finnigan 2014; Cusack et al. 2005, 2008; Rehm 2011; Stegmueller et al. 2012; Svallfors 2006), the models adjust for several individual-level variables. 13 Age and age2 are in years. With secondary degree or some college as the reference, we include indicators for less than a secondary degree (low education) and a university degree or higher (high education). Female is coded as one. Marital status is measured with binary variables for never married, divorced, and widowed (reference = married). We also include a binary for children in the household. Binary indicators for suburb/town and rural are in reference to urban. Labor market status is measured with binary variables for part-time employment, unemployed, not in the labor force, self-employment, and public employment (reference = private full-time). To facilitate cross-national comparability without currency conversion, relative income is measured with country-specific z-scores. Finally, we include indicators for Protestant, Catholic, and other religion (reference = no religion). We also include an ordinal measure of religious attendance (0 = never . . . 7 = several times a week or more).
Results
Poverty Analyses
We begin with the bivariate associations between poverty and dimensions of welfare transfers (similar to KP). Figure 1 plots the macro-level patterns in poverty in rich democracies (column a) and the broader sample (column b), 14 and also displays the cross-national variation in each of the three dimensions across the x-axes.
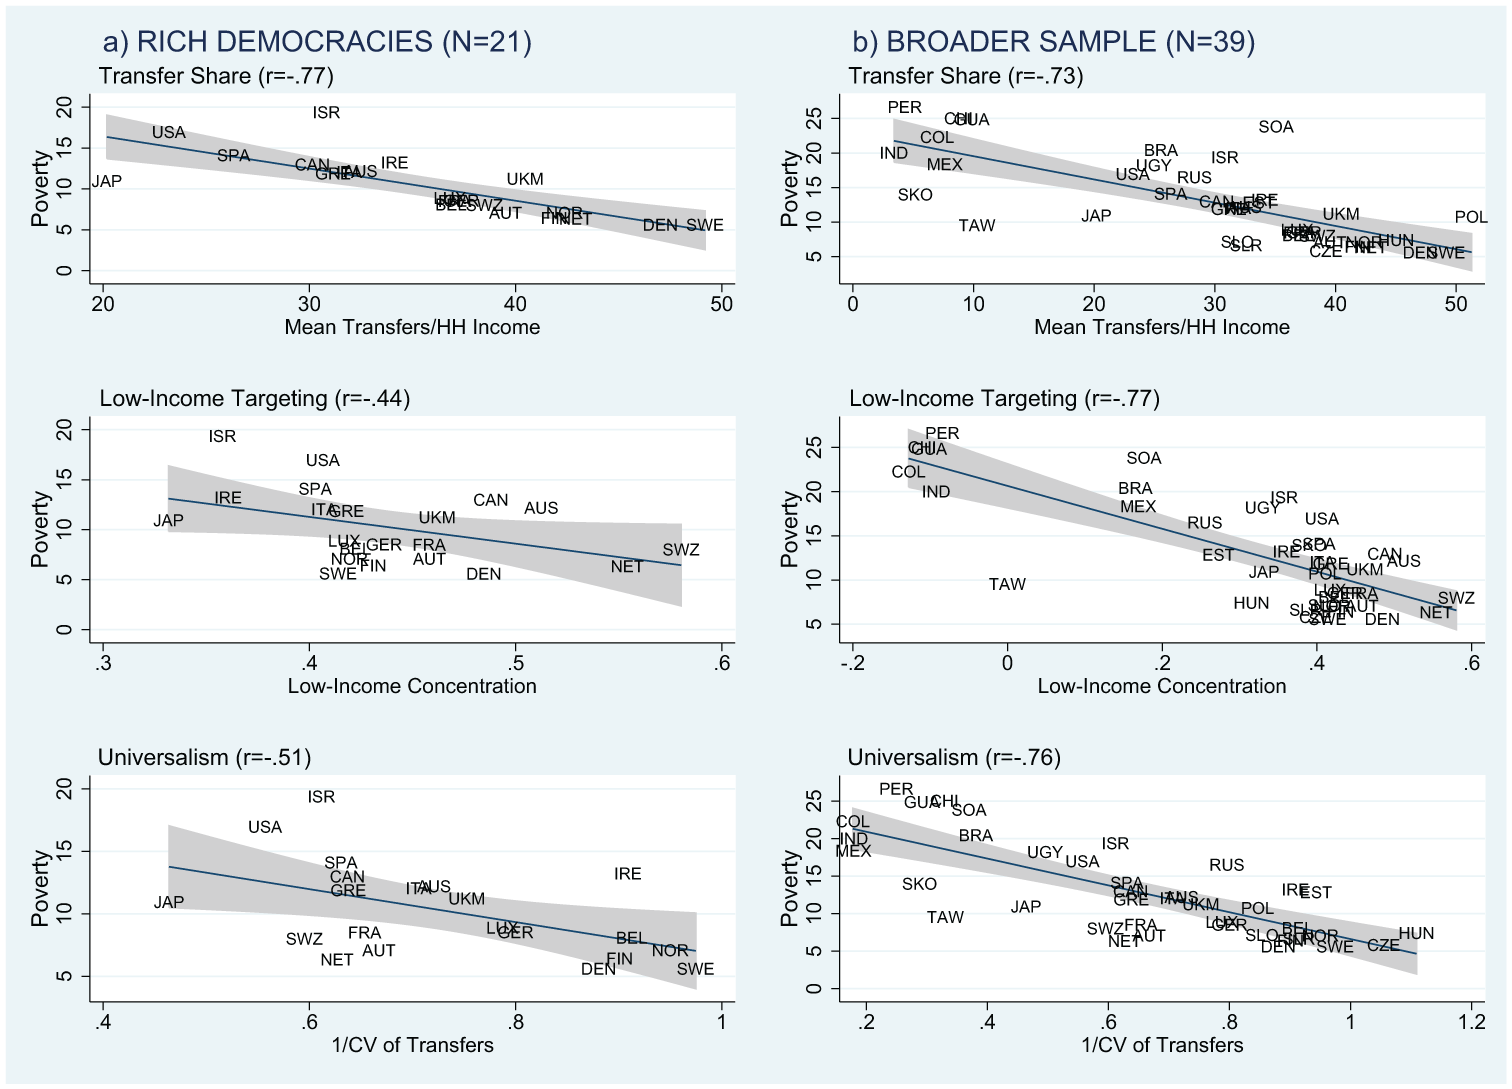
Macro-Level Bivariate Associations between Poverty Rate and Dimensions of Welfare Transfers Based on LIS Data
Figure 1 shows transfer share is strongly negatively correlated with poverty in rich democracies (r = −.77) and the broader sample (r = −.73). Denmark and Sweden have transfer shares near 50 percent—transfers are almost half of the average household’s income—and poverty rates near 5 percent. By contrast, transfer share is near 25 percent in the United States and below 10 percent in Peru. Over 15 percent of households in the United States and 25 percent in Peru are poor.
Contrary to KP, low-income targeting is negatively associated with poverty (r = −.44 in rich democracies and −.77 in the broader sample). The Netherlands and Switzerland concentrate transfers on low-income households and have lower poverty, whereas Israel and Japan are less concentrated on low-income households and have higher poverty. Although often framed as low-income targeted, the United States is actually not particularly so (Kenworthy 2011; Marx et al. 2013). Several developing countries have negative values, indicating high-income targeting. For example, China and Colombia concentrate transfers on high-income households and have high poverty.
Universalism is also strongly negatively correlated with poverty (r = −.51 in rich democracies and −.76 in the broader sample). Sweden and Norway have high universalism and low poverty, whereas the United States has lower universalism and higher poverty. In the broader sample, countries like Peru and Colombia exhibit very low universalism and high poverty.
Table 2 displays the multilevel models of poverty. We report odds ratios for individual-level variables and standardized odds ratios for the country-level dimensions. 15 Models 1 through 4 include the rich democracies, and Models 5 through 8 include the broader sample. We first show separate models for each dimension, and then combine all three dimensions in one model. Partly because of the large sample, the individual-level variables are very robustly significant. Poverty is predictably patterned by age, family structure, education, and employment.
Multilevel Logit Models of Individual Poverty Based on LIS Data: Standardized Odds Ratios for Welfare Dimensions and Odds Ratios for Individual-Level Variables
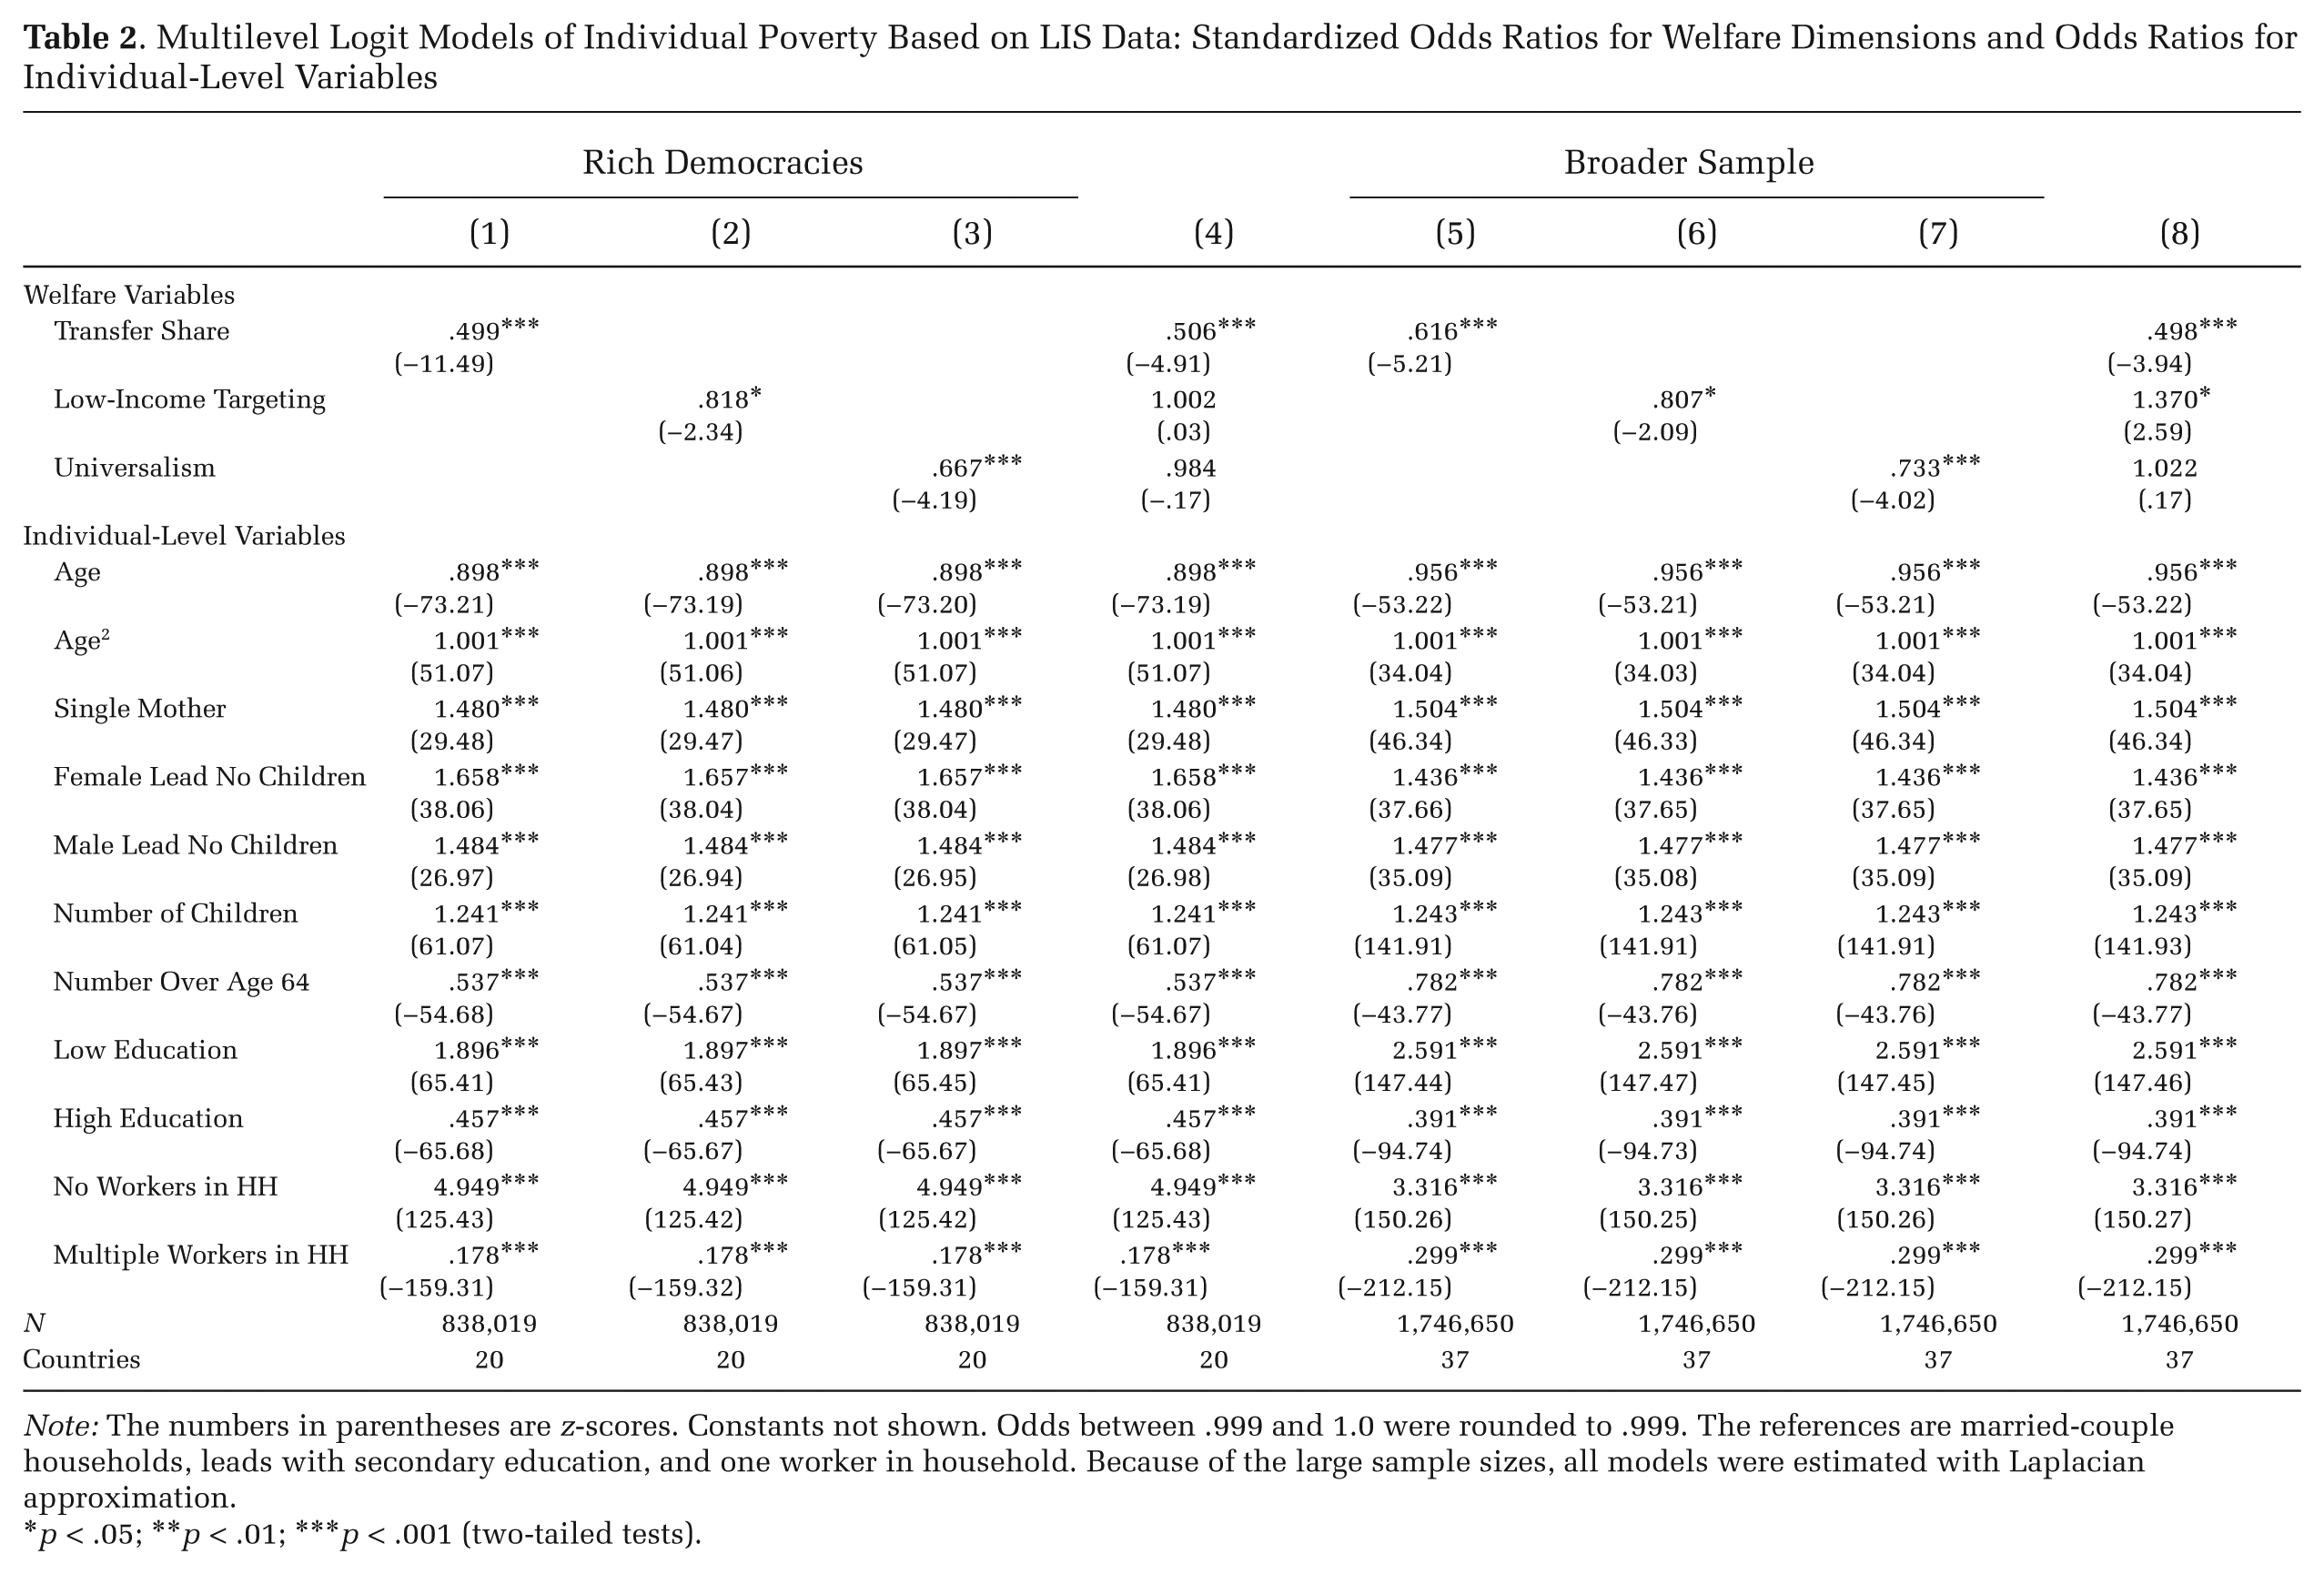
Note: The numbers in parentheses are z-scores. Constants not shown. Odds between .999 and 1.0 were rounded to .999. The references are married-couple households, leads with secondary education, and one worker in household. Because of the large sample sizes, all models were estimated with Laplacian approximation.
p < .05; **p < .01; ***p < .001 (two-tailed tests).
In separate Models 1 and 3, transfer share and universalism are significantly negative, which is consistent with KP. In the second model, low-income targeting is significantly negative, contrary to KP. In Model 4, transfer share remains significantly negative. However, both low-income targeting and universalism become insignificant. This suggests part of the effects of universalism and low-income targeting are mediated through transfer share. 16 Such an indirect relationship for universalism is consistent with KP, but this relationship for low-income targeting is inconsistent with KP.
In addition to being robust in Model 4, transfer share has the largest effect of the three dimensions. For a standard deviation increase in transfer share, the odds of poverty are expected to decline by a factor of about 2.0. This effect is larger than the effect of being in a single mother household, slightly smaller than having a lead with low or high education, and smaller than having no or multiple workers in the household.
In the broader sample, transfer share, low-income targeting, and universalism remain significantly negative in Models 5, 6, and 7 by themselves. In the combined Model 8, transfer share continues to have a significant negative effect and universalism becomes insignificant. These results are consistent with KP. The effect of transfer share remains substantively large—larger than all variables except low/high education and no/multiple workers. Sensitivity analyses described on page 3 of the online supplement confirm that the results of Model 8 are robust.
To illustrate this finding, Figure 2 shows the predicted probability of poverty for each country-level value of transfer share. In India, with the lowest transfer share, the predicted probability of poverty is .19. In the median transfer share country, Italy, the predicted probability of poverty is .07. In the highest transfer share country, Poland, the predicted probability is .03. Thus, the probability of poverty declines considerably across the range of transfer share.
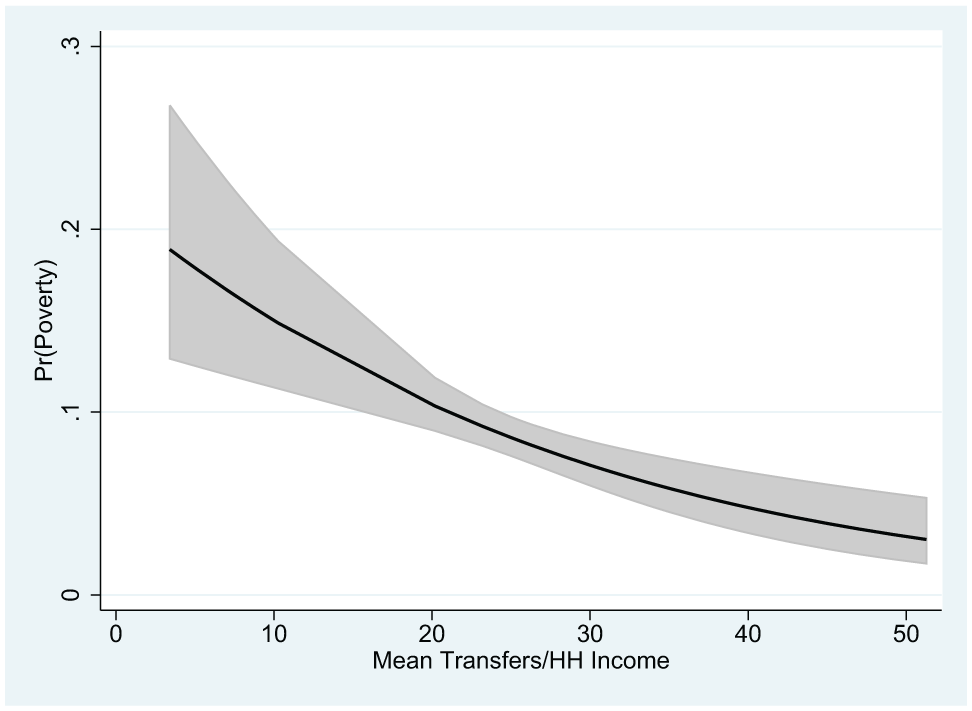
Predicted Poverty from LIS Data in 37 Countries and Model 8 of Table 2 across Levels of Transfer Share (holding all other variables constant at their means)
In this final model, low-income targeting is significantly positive. We interpret this result with equivocation. On one hand, this could be consistent with KP. On the other hand, it is difficult to sort out each dimension’s independent relationship with poverty given that the three dimensions are strongly correlated with each other in the broader sample (see below). Also, because low-income targeting is significantly negative in Models 2 and 6, and insignificant in Model 4, it seems appropriate to conclude that low-income targeting is not robustly associated with poverty. Moreover, it is unclear what mechanism could account for a positive association between low-income targeting and poverty in a model adjusted for transfer share (as KP mainly argued that low-income targeting’s positive association is due to the mechanism of transfer share).
Redistribution Preferences Analyses
Figure 3 displays the bivariate associations between the proportion supporting redistribution and the dimensions of welfare transfers. Despite a strong negative relationship with poverty, transfer share is not correlated with redistribution preferences in rich democracies (r = −.02). Countries with the highest transfer share (Sweden and Denmark) have similar support for redistribution as do those with the lowest transfer share (Japan and the United States). In the broader sample, there is only a weak negative association (r = −.19).
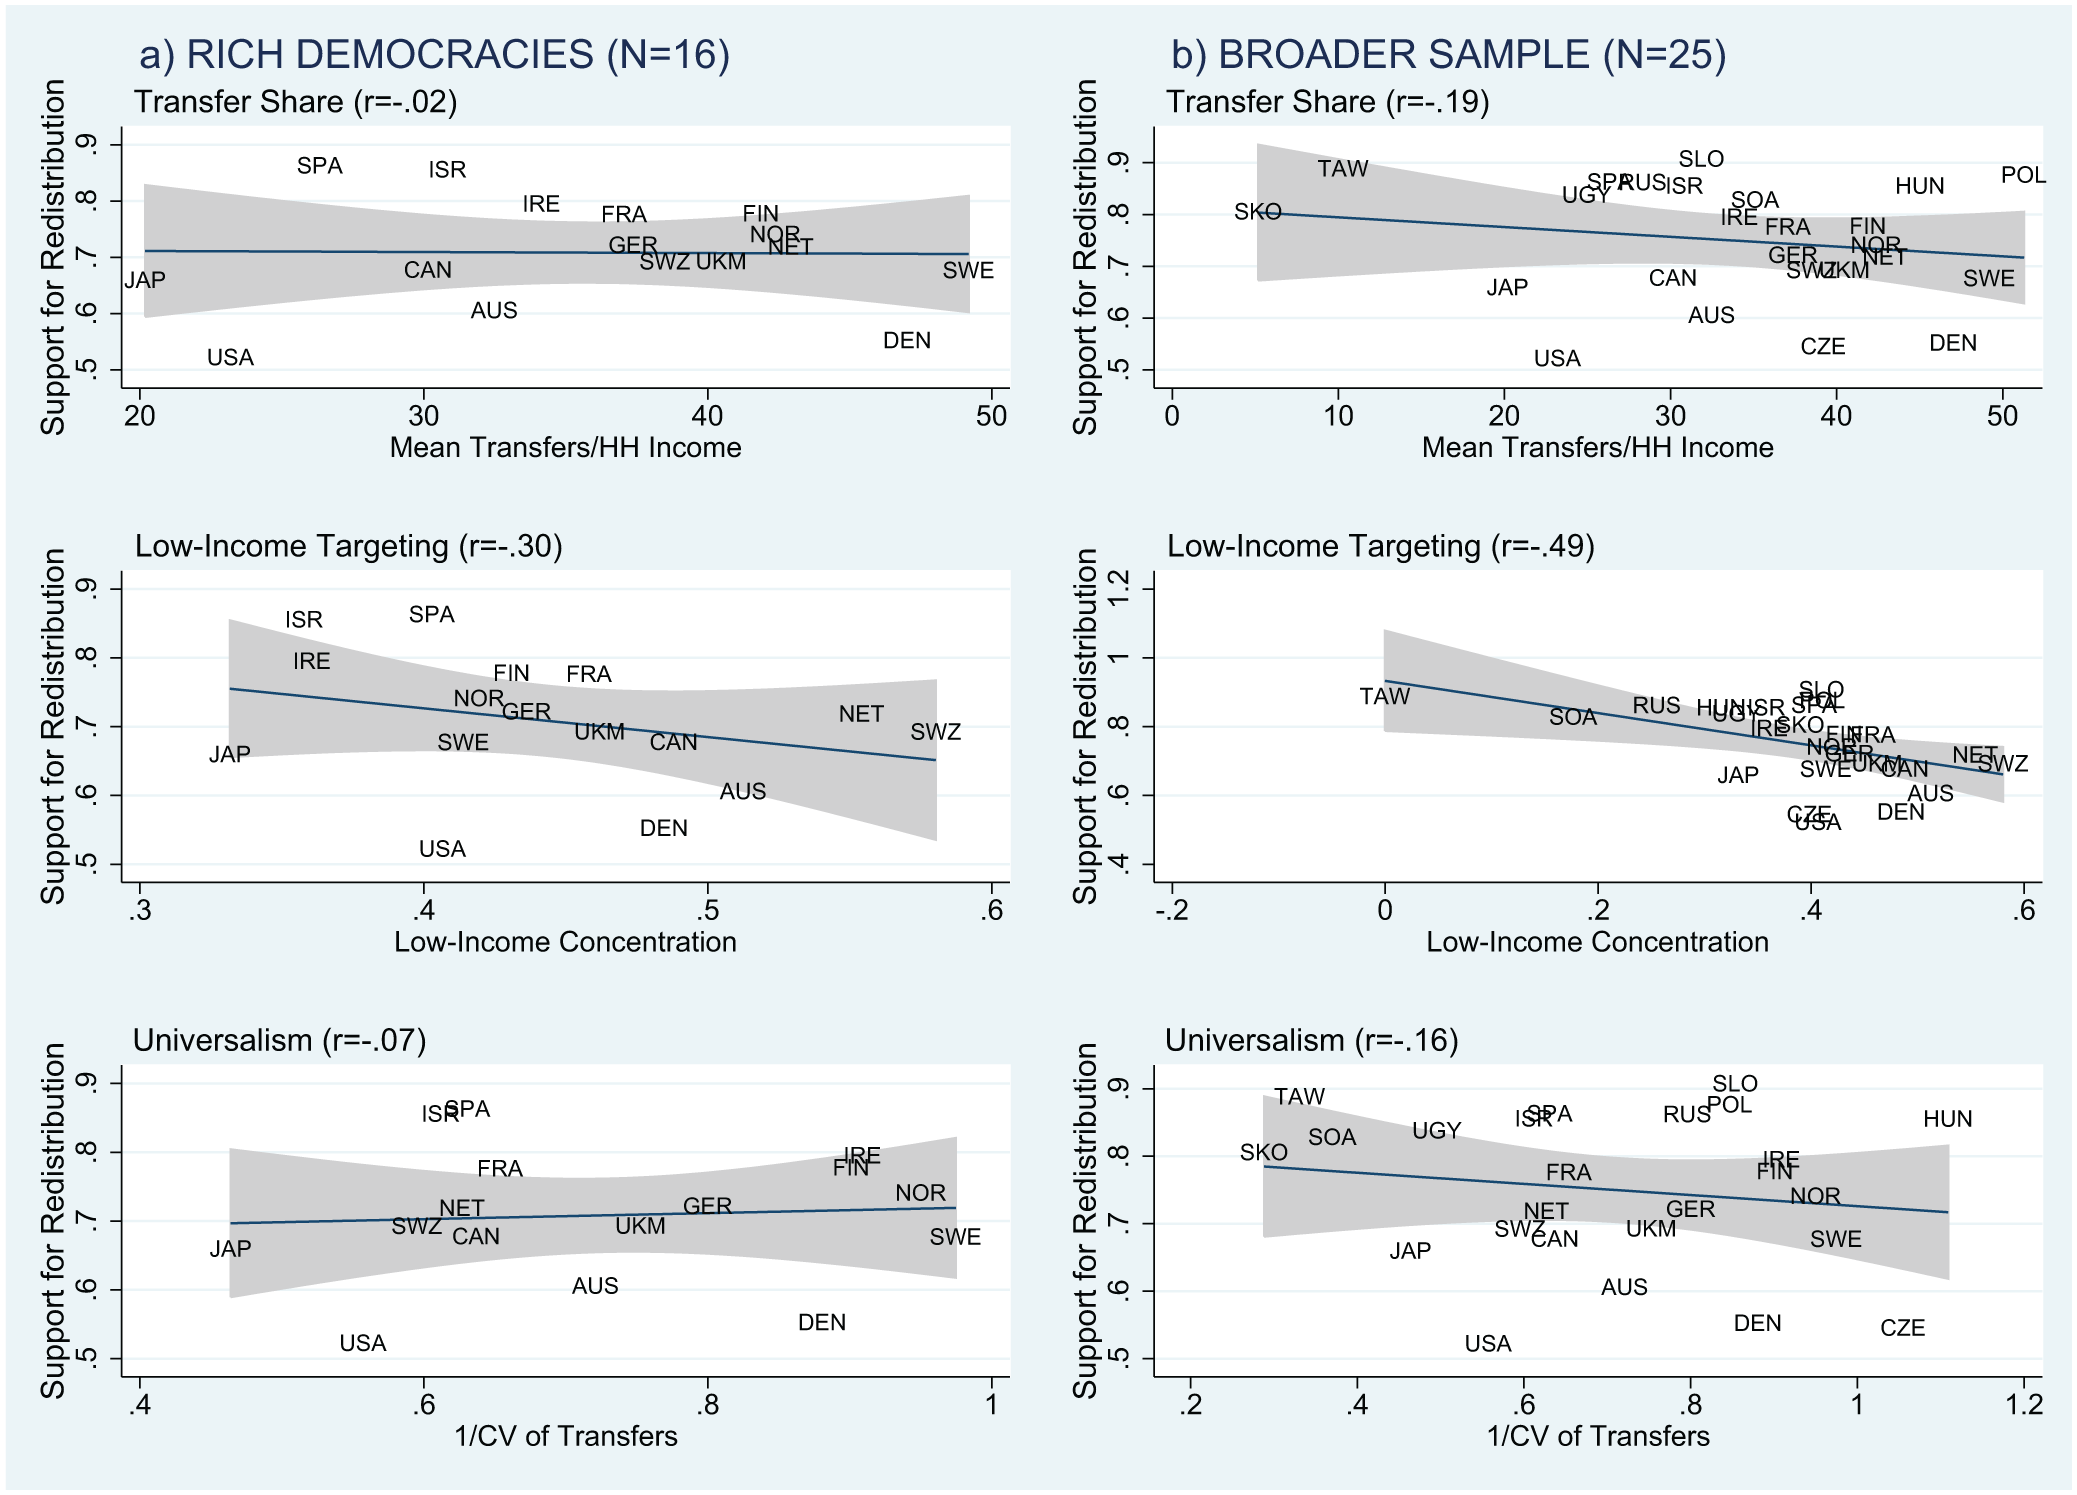
Macro-Level Bivariate Associations between Proportion Supporting Redistribution and Dimensions of Welfare Transfers Based on ISSP and LIS Data
Consistent with KP, low-income targeting is negatively correlated with support for redistribution (r = −.30 in rich democracies), especially in the broader sample (r = −.49). For example, Australia and Switzerland target low-income households and have less support for redistribution. By contrast, Taiwan and South Africa target toward high-income households and have high support.
Universalism, however, is not correlated with support for redistribution (r = −.07 in rich democracies and −.16 in the broader sample). Among countries with the greatest support for redistribution, there are more (Hungary) and less (Taiwan) universal countries. Among countries with the least support, we also find more (Czech Republic) and less (United States) universal countries.
Table 3 shows the models of redistribution preferences. Consistent with past research, females, the never married, rural and suburban residents, the less educated, part-time and public employees, the unemployed, and people identifying with other religions are significantly more likely to support redistribution. Respondents with higher education, higher incomes, the self-employed, and Protestants are significantly less likely to support redistribution. Again, we show separate models for each dimension of transfers and then combine them in one model.
Multilevel Logit Models of Individual Redistribution Preferences Based on ISSP Data: Standardized Odds Ratios for Welfare Dimensions and Odds Ratios for Individual-Level Variables
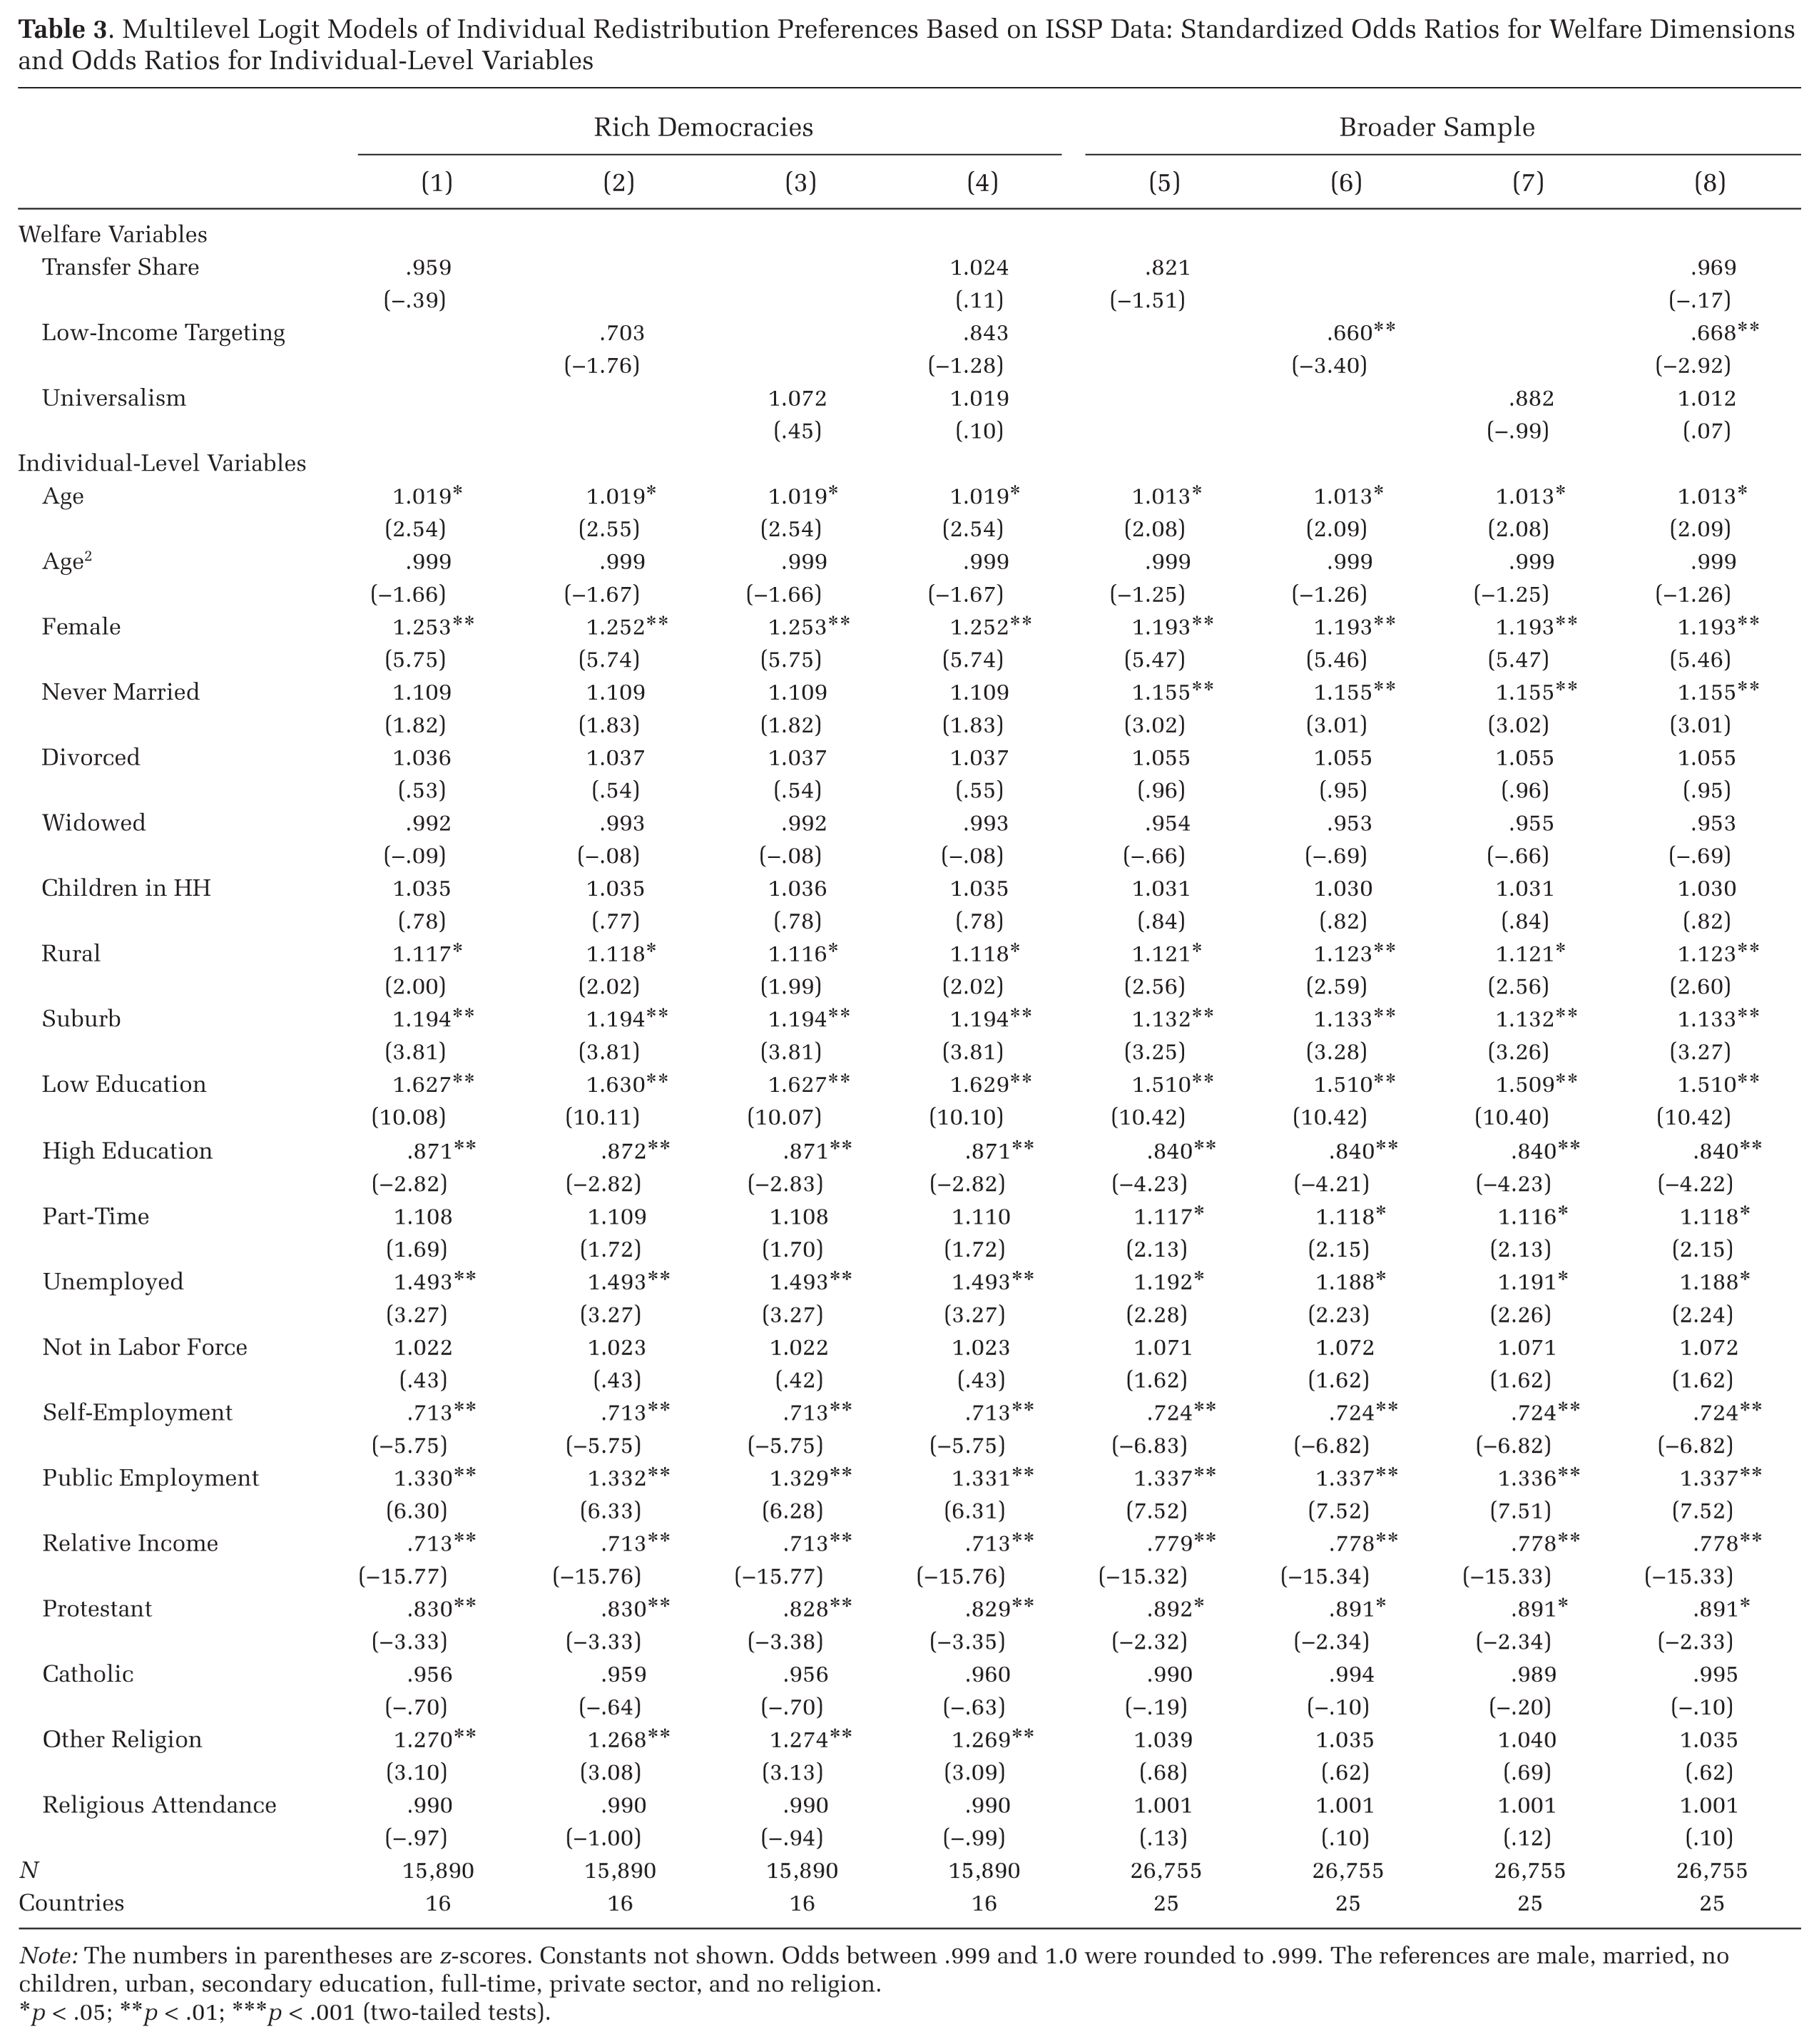
Note: The numbers in parentheses are z-scores. Constants not shown. Odds between .999 and 1.0 were rounded to .999. The references are male, married, no children, urban, secondary education, full-time, private sector, and no religion.
p < .05; **p < .01; ***p < .001 (two-tailed tests).
In rich democracies and the broader sample, transfer share and universalism are not significantly associated with redistribution preferences separately (Models 1, 3, 5, and 7) or in the combined Models 4 and 8. Transfer share and universalism also remain insignificant if we drop any country. As in Figure 3, these two dimensions that predict poverty are unrelated to redistribution preferences in either rich democracies or the broader sample. The lack of a significant positive effect for universalism is contrary to KP.
In rich democracies, low-income targeting is negatively signed but only near significant in Model 2 (z = −1.8) and is insignificant in Model 4. Model 4 should be interpreted with caution, as there are only 16 countries and the three dimensions are fairly highly correlated (see the next section and page 3 of the online supplement). Japan’s LIS data (2008) is observed two years after the ISSP, which could be a source of measurement error. If we omit Japan, low-income targeting is significant in Model 2 (z = −2.6) and Model 4 (z = −2.3). Also, if we omit the relatively outlying United States from Model 2, low-income targeting would be significantly negative (z = −2.20).
In the broader sample, low-income targeting is significantly negatively associated with redistribution preferences in Models 6 and 8. For a standard deviation increase in low-income targeting, redistribution preferences are expected to decline by a factor of about 1.5. This effect is comparable to the effect of having low education and larger than the effects of any other individual-level variable. This pattern is very robust, as low-income targeting remains significantly negative in Model 8 regardless of dropping any country (see page 3 in the online supplement). Thus, although results are not as robust for rich democracies, there is a negative relationship between low-income targeting and redistribution preferences in the broader sample.
Figure 4 shows the predicted probability of supporting redistribution for each country-level value of low-income targeting. In Taiwan, with its slight high-income targeting, the predicted probability of supporting redistribution is .92. In the most low-income targeted country, Switzerland, the predicted probability is .66. Thus, support for redistribution declines by almost a third across the range of low-income targeting.
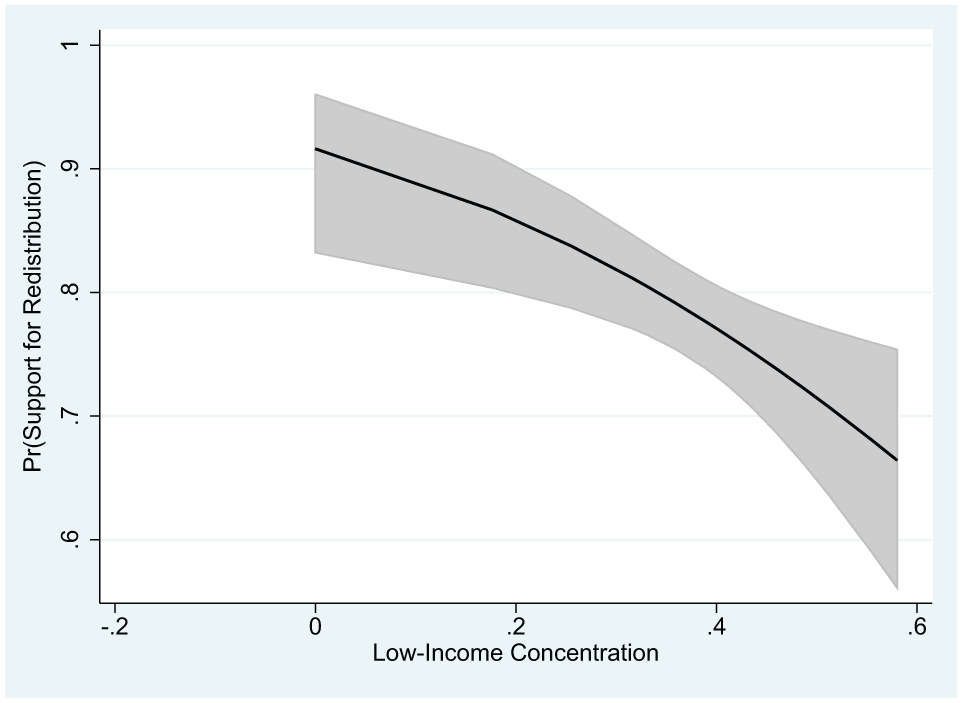
Predicted Redistribution Preferences from 2006 ISSP Data in 25 Countries and Model 8 of Table 3 across Levels of Low-Income Targeting (holding all other variables constant at their means)
Relationships between Dimensions
Central to the potential paradoxes are the relationships between the dimensions of transfers. Figure 5 shows the bivariate associations between the dimensions. KP claimed that universalism increases the transfer share, and indeed, these two are strongly positively correlated in both samples (r > .7). Recall that both are significantly negatively associated with poverty, but universalism becomes insignificant when included in the same model with transfer share. This is also consistent with KP’s claim that universalism’s relationship with poverty is mediated by transfer share.
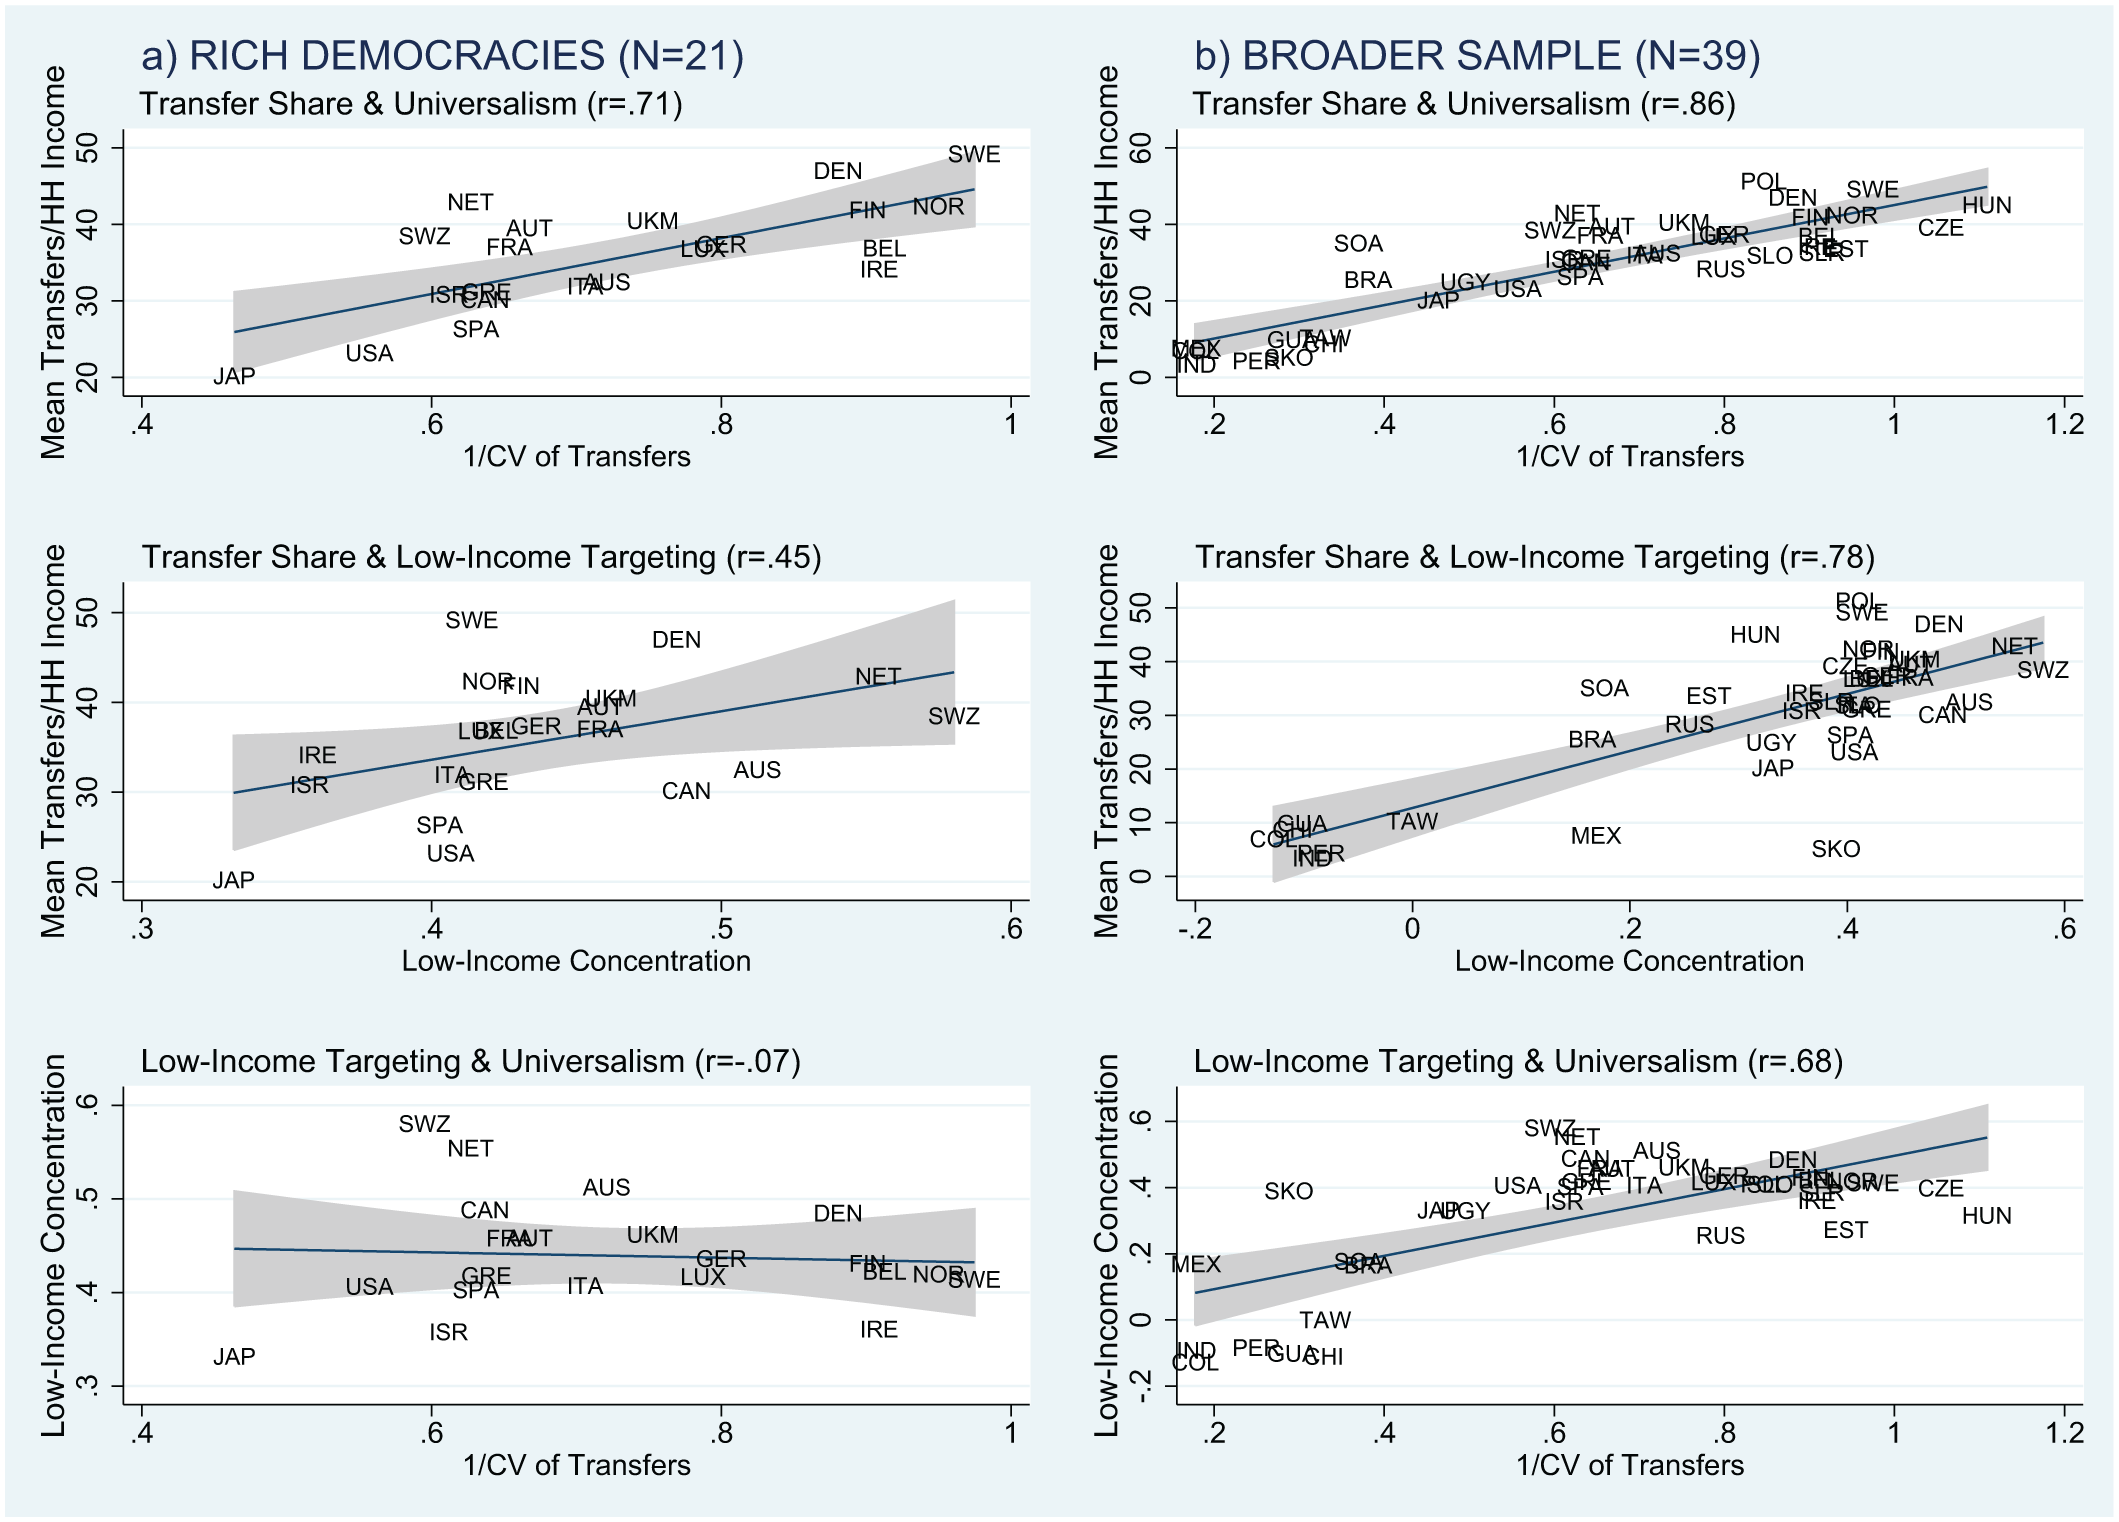
Macro-Level Bivariate Associations between Dimensions of Welfare Transfers Based on LIS Data
The heart of KP’s paradox is a tradeoff between low-income targeting and transfer share. KP (1998:672) write, “the greater the degree of low-income targeting, the smaller the redistributive budget [i.e., transfer share] . . . it is impossible to maximize both the degree of low-income targeting and budget size.” However, Figure 5 reveals the opposite pattern. Low-income targeting and transfer share are positively correlated (Marx et al. 2013). This is partly because high-income targeting countries have a very low transfer share. As countries incorporate the poor into social policy, transfers become less high-income targeted, and the transfer share tends to grow. Even among rich democracies—which all exhibit at least moderate low-income targeting—low-income targeting and transfer share are positively associated (r = .45). Therefore, we find no evidence of a tradeoff between low-income targeting and transfer share.
As discussed earlier, scholars often frame targeting and universalism as opposites. We view high-income targeting, not universalism, as the opposite of low-income targeting. Also, we define universalism as the homogeneity of transfers across the entire population, not just across the pre-transfer income distribution. Figure 5 reveals that low-income targeting and universalism are not negatively associated as if they were simply opposites. In fact, low-income targeting and universalism are not associated in rich democracies (r = −.07). Once countries have the level of universalism and low-income targeting present in rich democracies, there is no relationship between the two. Moreover, Figure 5 shows that universalism and low-income targeting are quite positively associated in the broader sample (r = .68).
How can countries be both low-income targeted and universal? Denmark, for example, simultaneously concentrates transfers on low-income households and covers all risk groups and all categories of residents. This combination is one source of Denmark’s high transfer share. However, the developing countries with low universalism and either high-income targeting or weak low-income targeting are really driving this association (Huber and Stephens 2012). For example, India and Colombia have very low universalism and target transfers to high-income households. By contrast, Uruguay, Brazil, and South Africa are more universal and somewhat low-income targeted. Therefore, universalist, high-transfer-share welfare states are much more low-income targeted than are the low-transfer-share and low universalism developing countries. As countries move away from high-income targeting by expanding the transfer share and universalism, this normally requires more low-income targeting. Once countries reach a modicum of low-income targeting, we find no association between universalism and low-income targeting. 17 However, until countries reach that level, rising universalism coincides with more low-income targeting.
Supplementary Analyses
The online supplement includes a series of supplementary analyses. First, KP are concerned with income inequality as well as relative poverty. Therefore, Figure S1 in the supplement displays the correlation between the dimensions of transfers and the Gini index of income inequality. These results are quite similar to the results for relative poverty (cf. Figure 1), which is not surprising as the Gini correlates strongly with poverty (r > .9). Transfer share, low-income targeting, and universalism are all negatively correlated with the Gini in both samples. 18
Second, although KP (1998:663) did not empirically analyze the matter, a central mechanism in the paradox of redistribution is the “political coalitions that different welfare state institutions generate.” According to KP (p. 663), universalism increases support for redistribution and targeting undermines support, because targeting “splits the working class and tends to generate coalitions between better-off workers and the middle class against the lower sections of the working class.” One test of these claims is if universalism enhances and low-income targeting undermines support for leftist parties. Table S2 in the online supplement shows analyses of the left-right party affiliation measure. These results show that none of the three dimensions are significantly related to left-right party affiliation in rich democracies or the broader sample. Thus, we find no evidence that the three dimensions contribute to an individual’s affiliation with partisan political coalitions.
Another test of this mechanism is whether these dimensions predict cross-class differences in redistribution preferences. One implication of KP is that the effect of income for redistribution preferences should vary depending on dimensions of transfers. In high-transfer-share and universalist welfare states, the income slope should be flatter, whereas in low-income targeted welfare states, the income slope should be steeper. Table S3 in the online supplement estimates multilevel logit models with random coefficients for individual-level income and with income interacted with dimensions of transfers. We are cautious with these results because we have a limited number of level-2 units for random-coefficients models (Stegmueller 2013). Consistent with KP, low-income targeting steepens the negative income slope in both rich democracies and the broader sample. When transfers are low-income targeted, higher-income individuals are even more opposed to redistribution. However, contrary to KP, the transfer share (Models 1 and 2) also significantly steepens the income slope. And universalism (Model 6) significantly negatively interacts with income in the broader sample. Thus, while the dimensions of transfers may influence political coalitions via cross-level interactions with income, some of these results are contrary to KP’s expectations.
Discussion
Revisiting KP’s classic “The Paradox of Redistribution and Strategies of Equality,” this article explores and informs a set of enduring questions about social policy, politics, and social equality. KP contend that universalism more effectively reduces poverty than targeting, because universalism encourages and targeting undermines support for a large welfare state. Furthermore, targeting and universalism affect poverty because of their effects on transfer share, which ultimately reduces poverty. We use LIS data to measure the transfer share, low-income targeting, and universalism of received welfare transfers. We slightly revise KP’s measures of transfer share and low-income targeting and construct a novel measure of universalism. We update and expand KP’s sample of rich democracies and analyze a broader sample of developed and developing countries. This assesses the generalizability of KP’s arguments for a much larger share of the world’s population and countries approximately two decades after KP’s data. Using multilevel models, we examine how these three dimensions of transfers are related to individual-level poverty and redistribution preferences. By incorporating redistribution preferences, we analyze the identities and interests theorized but unobserved by KP.
Several results confirm KP. Poverty is significantly negatively associated with transfer share and indirectly with universalism. Redistribution preferences are significantly negatively associated with low-income targeting. Low-income targeting also appears to increase income differences in redistribution preferences. Furthermore, universalism and transfer share are strongly positively correlated, and transfer share appears to mediate the relationship between universalism and poverty. Like KP, we find that certain dimensions of social policy are related to both social equality and politics. This illustrates that KP’s conclusions are robust and remain significant two decades later in rich democracies and in a broader sample of developed and developing countries.
We also find differences with KP. Universalism is not associated with redistribution preferences. Also, transfer share is not related to redistribution preferences; if anything, transfer share significantly positively interacts with income differences in redistribution preferences. Unlike KP, we fail to show that effective social policies are also politically popular. In addition, low-income targeting is surprisingly positively associated with transfer share, and even with universalism in the broader sample. This is partly because several developing countries exhibit high-income targeting and a very low transfer share or universalism. Low-income targeting has a negative bivariate association with poverty and is significantly negatively related to poverty in some models. Although low-income targeting is significantly positive in one poverty model, we fail to find robust evidence for KP’s expected positive effect.
What explains the differences between KP and our results? One reason is KP’s sample of 11 rich democracies is more selective than our 21 rich democracies. Compared to the 10 countries omitted, KP’s sample has slightly less poverty (means 9.43 versus 11.11, t = 1.03) and slightly more support for redistribution (means .75 versus .69, t = 1.03). KP’s sample also has a slightly higher transfer share (37.78 versus 33.48, t = 1.36) and significantly more low-income targeting (.47 versus .41, t = 2.73).
To scrutinize this issue, Figures S2, S3, and S4 in the online supplement compare KP’s sample across the mid-1980s, mid-1990s, and mid-2000s and against 17 rich democracies with available data in all three time points. Using KP’s sample in the mid-1980s, we confirm KP’s conclusions that low-income targeting was very negatively associated with transfer share (Figure S2), and transfer share was strongly negatively associated with poverty (Figure S3). However, Figure S2 reveals a clear flattening of the relationship between low-income targeting and transfer share as we move from the mid-1980s to the mid-1990s and mid-2000s (see also Kenworthy 2011; Marx et al. 2013). Furthermore, Figure S3 shows the relationship between transfer share and poverty becomes much more significantly negative over time (in both KP’s sample and the 17 rich democracies). Finally, in contrast to KP, Figure S4 shows no evidence of a positive association between poverty and low-income targeting—even in KP’s sample in the mid-1980s. Moreover, the relationship between poverty and low-income targeting becomes more significantly negative if we expand the sample of rich democracies or move from the mid-1980s to mid-1990s and mid-2000s.
Therefore, the differences with KP mostly result from a combination of KP’s sample being too narrow, and the relationships between key variables changing over time. Because there was a tradeoff between low-income targeting and transfer share in the 1980s, there is some evidence for the initial paradox of redistribution. However, the evidence for it has diminished over time. Unlike KP, we find that the most egalitarian welfare states combine universalism, a high transfer share, and low-income targeting. The least egalitarian lack all three.
Altogether, these results lead us to revise the paradox of redistribution into two new paradoxes: non-complementarity and undermining. We define paradoxes as mismatches between the sources of social policies’ effectiveness and the sources of social policies’ popularity, and contradictions between the three dimensions of welfare transfers.
First, the non-complementarity paradox emphasizes the mismatch between what matters to poverty and what matters to redistribution preferences. The transfer share is most robustly related with poverty and has a large effect relative to well-studied individual-level predictors of poverty, but it is simply not associated with redistribution preferences. Low-income targeting is negatively associated with redistribution preferences, but not as robustly related to poverty. Therefore, what is salient to poverty is not related to redistribution preferences, and what is salient to redistribution preferences is not robustly related to poverty. This is partly because some countries (e.g., Israel, Spain, and South Africa) exhibit both high poverty and high redistribution preferences, while countries with low poverty exhibit widely varying support for redistribution (cf. Denmark, Sweden, and Slovenia). Also, several countries with the greatest support for redistribution have low transfer shares (see, e.g., Spain and Taiwan in Figure 3). Perhaps high poverty (partly driven by a low transfer share) cultivates greater support for redistribution, whereas low poverty (partly driven by a high transfer share) attenuates redistribution preferences.
Second, the undermining paradox is based on our finding that the dimension (transfer share) that most reduces poverty is positively correlated with the one dimension (low-income targeting) that reduces support for redistribution. This could result in a counterproductive dynamic, as low-income targeting tends to increase in tandem with an increased transfer share. This increased low-income targeting then weakens redistribution preferences, and weakened redistribution preferences are likely to undermine the politics and coalitions supporting transfer share (Brooks and Manza 2007; Korpi and Palme 1998; Nelson 2007). Thus, a social policy effective at reducing poverty (i.e., resulting in a high transfer share) is also likely to be a social policy that undermines public support for redistribution (i.e., resulting in low-income targeting). These two dimensions of welfare transfers could be working at cross-purposes, with low-income targeting’s unpopularity undermining the transfer share’s effectiveness.
Beyond these paradoxes, this study contributes to several other literatures. Primarily, it contributes to the growing literature on the political/institutional sources of poverty and inequality (Brady 2009; Brady et al. 2013; Brady et al. 2009; Kelly 2005; Kristal 2010; Moller 2008; Moller et al. 2003; Scruggs 2008). The strong negative relationship between transfer share and poverty—rivaling the effects of well-established individual-level predictors of poverty—further demonstrates that the stratification of individual life chances should be contextualized within national-level policies (Brady et al. 2009).
Second, the negative relationship between low-income targeting and redistribution preferences illustrates feedback effects and demonstrates how welfare states influence welfare attitudes (Brooks and Manza 2007; Fernandez and Jaime-Castillo 2013; Sachweh and Olafsdottir 2010). On balance, transfer share and universalism are not significantly related to redistribution preferences, and the supplementary analyses show that implications for parties and rich-poor coalitions are often unanticipated and need further scrutiny. Still, these results show that at least one dimension of welfare transfers influences the subsequent politics of social policy (Nelson 2007; Pierson 2004; Skocpol 1992).
Third, this study demonstrates the promise of the emerging literature on social policy in developing countries. Mares and Carnes (2009) point out there is still a lack of basic descriptive and comparative information about social policies in developing countries. This study is one of the first to utilize all LIS countries. We show that developing countries have a lower transfer share and universalism and are more high-income targeted. Equally interesting, while the strength of associations varies, the relationships between the dimensions and the two dependent variables are quite similar across developed and developing countries. 19
Fourth, the dimensions of welfare transfers combined with this information on developing countries can enhance understanding of welfare typologies. Plausibly, welfare typologies can be constructed by examining the combinations of dimensions and related social policies. To that end, Figure S5 in the online supplement shows three-way scatterplots for these three dimensions. There appears to be a minimalist developing country type (e.g., India, Peru, Colombia, Guatemala, and China) featuring a low transfer share, low universalism, and high-income targeting. There also appears to be an incompletely developed type (e.g., Mexico, Brazil, South Africa, Uruguay, and perhaps even Japan and South Korea) that has an inconsistent mix of high, moderate, and low for the three dimensions. While rich democracies do not vary as much in low-income targeting, there is greater heterogeneity in transfer share and universalism. One set of rich democracies (e.g., the United States, Spain, and Israel) exhibits a lower transfer share and lower universalism. Another set of rich democracies (e.g., Denmark, Sweden, and Poland) exhibits a high transfer share and high universalism. The remaining rich democracies have a moderate transfer share and high universalism (e.g., Hungary and Czech Republic), or a high transfer share and moderate universalism (e.g., the Netherlands and Switzerland). Of course, further analyses are necessary to construct a new typology and to fully understand how countries combine the three dimensions and related social policies.
Finally, our study suggests welfare effort remains an essential measure of social policy. Many scholars have critiqued welfare effort for conflating generosity and need, even though KP found that transfer share plays the key role in reducing poverty. By contrast, recent LIS studies show welfare effort effectively predicts poverty and inequality (Brady 2009; Moller et al. 2003), and we confirm transfer share is the paramount dimension for poverty. Because the same critiques of welfare effort could be applied to transfer share, scholars may have abandoned welfare effort prematurely. We propose transfer share is salient because it tracks how much household income is socialized and comes from more equally distributed transfers rather than from less equally distributed market income. Furthermore, the definition of recognized need reflects political choices about which (and how many) groups are protected and which (and how many) risks are socialized.
Beyond these points, we recommend several directions for future research. First, although multilevel models arguably examine how exogenous national-level factors affect individual-level outcomes, the present study is cross-sectional. Future research could examine variation over time and control for stable unobserved differences between countries (Brady et al. 2013). Second, it would be valuable to expand the outcomes studied by linking the country-level measures of dimensions to other datasets. Besides redistribution preferences, there are likely other plausible mechanisms by which universalism could feed back into the politics of the welfare state (e.g., voting and coalition formation). Beyond poverty, scholars could analyze income across the distribution. An advantage of our approach is that while high-quality social policy measures remain scarce for developing countries, one can calculate our measures for any LIS country-year. To that end, page 4 in the online supplement provides the code for the dimensions of transfers. Third, we assess transfers without taxation, even though social insurance and other transfers may be taxable. Future research could index transfers to taxation based on tax rates for other income sources (Ferrarini and Nelson 2003). Fourth, although a widely used concept in the literature, scholars rarely define or measure universalism. We present one strategy and invite debate over the conceptual and operational definition of universalism.
This study revisits KP’s paradox of redistribution. We conclude that transfer share is most important to poverty, and low-income targeting is most important to redistribution preferences. By contrast, transfer share and universalism are not related to redistribution preferences and low-income targeting is not as robustly associated with poverty. We propose a revision for the paradox of redistribution into two new paradoxes: non-complementarity and undermining. The non-complementarity paradox emphasizes the mismatch between the dimensions that matter to poverty and the dimension that matters to redistribution preferences. The undermining paradox emphasizes that the dimension (transfer share) that most reduces poverty tends to increase with the one dimension (low-income targeting) that reduces support for redistribution. Like KP, these new paradoxes present a host of questions for scholars of politics, social policy, and inequality.
Footnotes
Appendix
Descriptive Statistics: Means and Standard Deviations in Parentheses
| LIS-Rich Democracies | LIS-Broader Sample | ISSP-Rich Democracies | ISSP-Broader Sample | |
|---|---|---|---|---|
| Poverty | .105(.306) | .145(.352) | ||
| Redistribution Preferences | .691(.462) | .755(.430) | ||
| Transfer Share | 35.254(9.508) | 24.688(16.609) | 35.312(8.120) | 32.020(11.916) |
| Low-Income Targeting | .441(.046) | .252(.239) | .445(.063) | .369(.137) |
| Universalism | .723(.148) | .537(.276) | .730(.147) | .675(.222) |
| Age | 45.817(14.715) | 45.081(14.900) | 48.462(16.425) | 47.056(16.859) |
| Age2 | 2315.711(1492.054) | 2254.297(1495.501) | 2618.295(1667.279) | 2498.537(1682.606) |
| Single Mother | .075(.263) | .063(.243) | ||
| Female Lead No Children | .101(.301) | .073(.260) | ||
| Male Lead No Children | .089(.285) | .057(.232) | ||
| Number of Children | 1.102(1.291) | 1.533(1.649) | ||
| Number Over Age 64 | .252(.586) | .277(.590) | ||
| Low Education | .242(.428) | .433(.495) | .380(.485) | .403(.491) |
| High Education | .318(.466) | .223(.416) | .202(.401) | .179(.383) |
| No Workers in HH | .151(.358) | .138(.345) | ||
| Multiple Workers in HH | .574(.494) | .527(.499) | ||
| Female | .514(.500) | .532(.499) | ||
| Never Married | .224(.417) | .239(.427) | ||
| Divorced | .096(.295) | .092(.288) | ||
| Widow | .061(.240) | .082(.275) | ||
| Children in HH | .353(.478) | .392(.488) | ||
| Rural | .287(.453) | .265(.441) | ||
| Suburb | .475(.499) | .414(.493) | ||
| Part-Time | .124(.330) | .110(.313) | ||
| Unemployed | .035(.183) | .064(.245) | ||
| Not in Labor Force | .347(.476) | .354(.478) | ||
| Self-Employment | .110(.313) | .124(.329) | ||
| Public Employment | .262(.440) | .266(.442) | ||
| Relative Income | .018(1.005) | .012(1.004) | ||
| Protestant | .369(.483) | .278(.448) | ||
| Catholic | .269(.443) | .262(.440) | ||
| Other Religion | .129(.335) | .240(.427) | ||
| Religious Attendance | 2.208(2.111) | 2.428(2.255) | ||
| N | 838,019 | 1,746,650 | 15,890 | 26,755 |
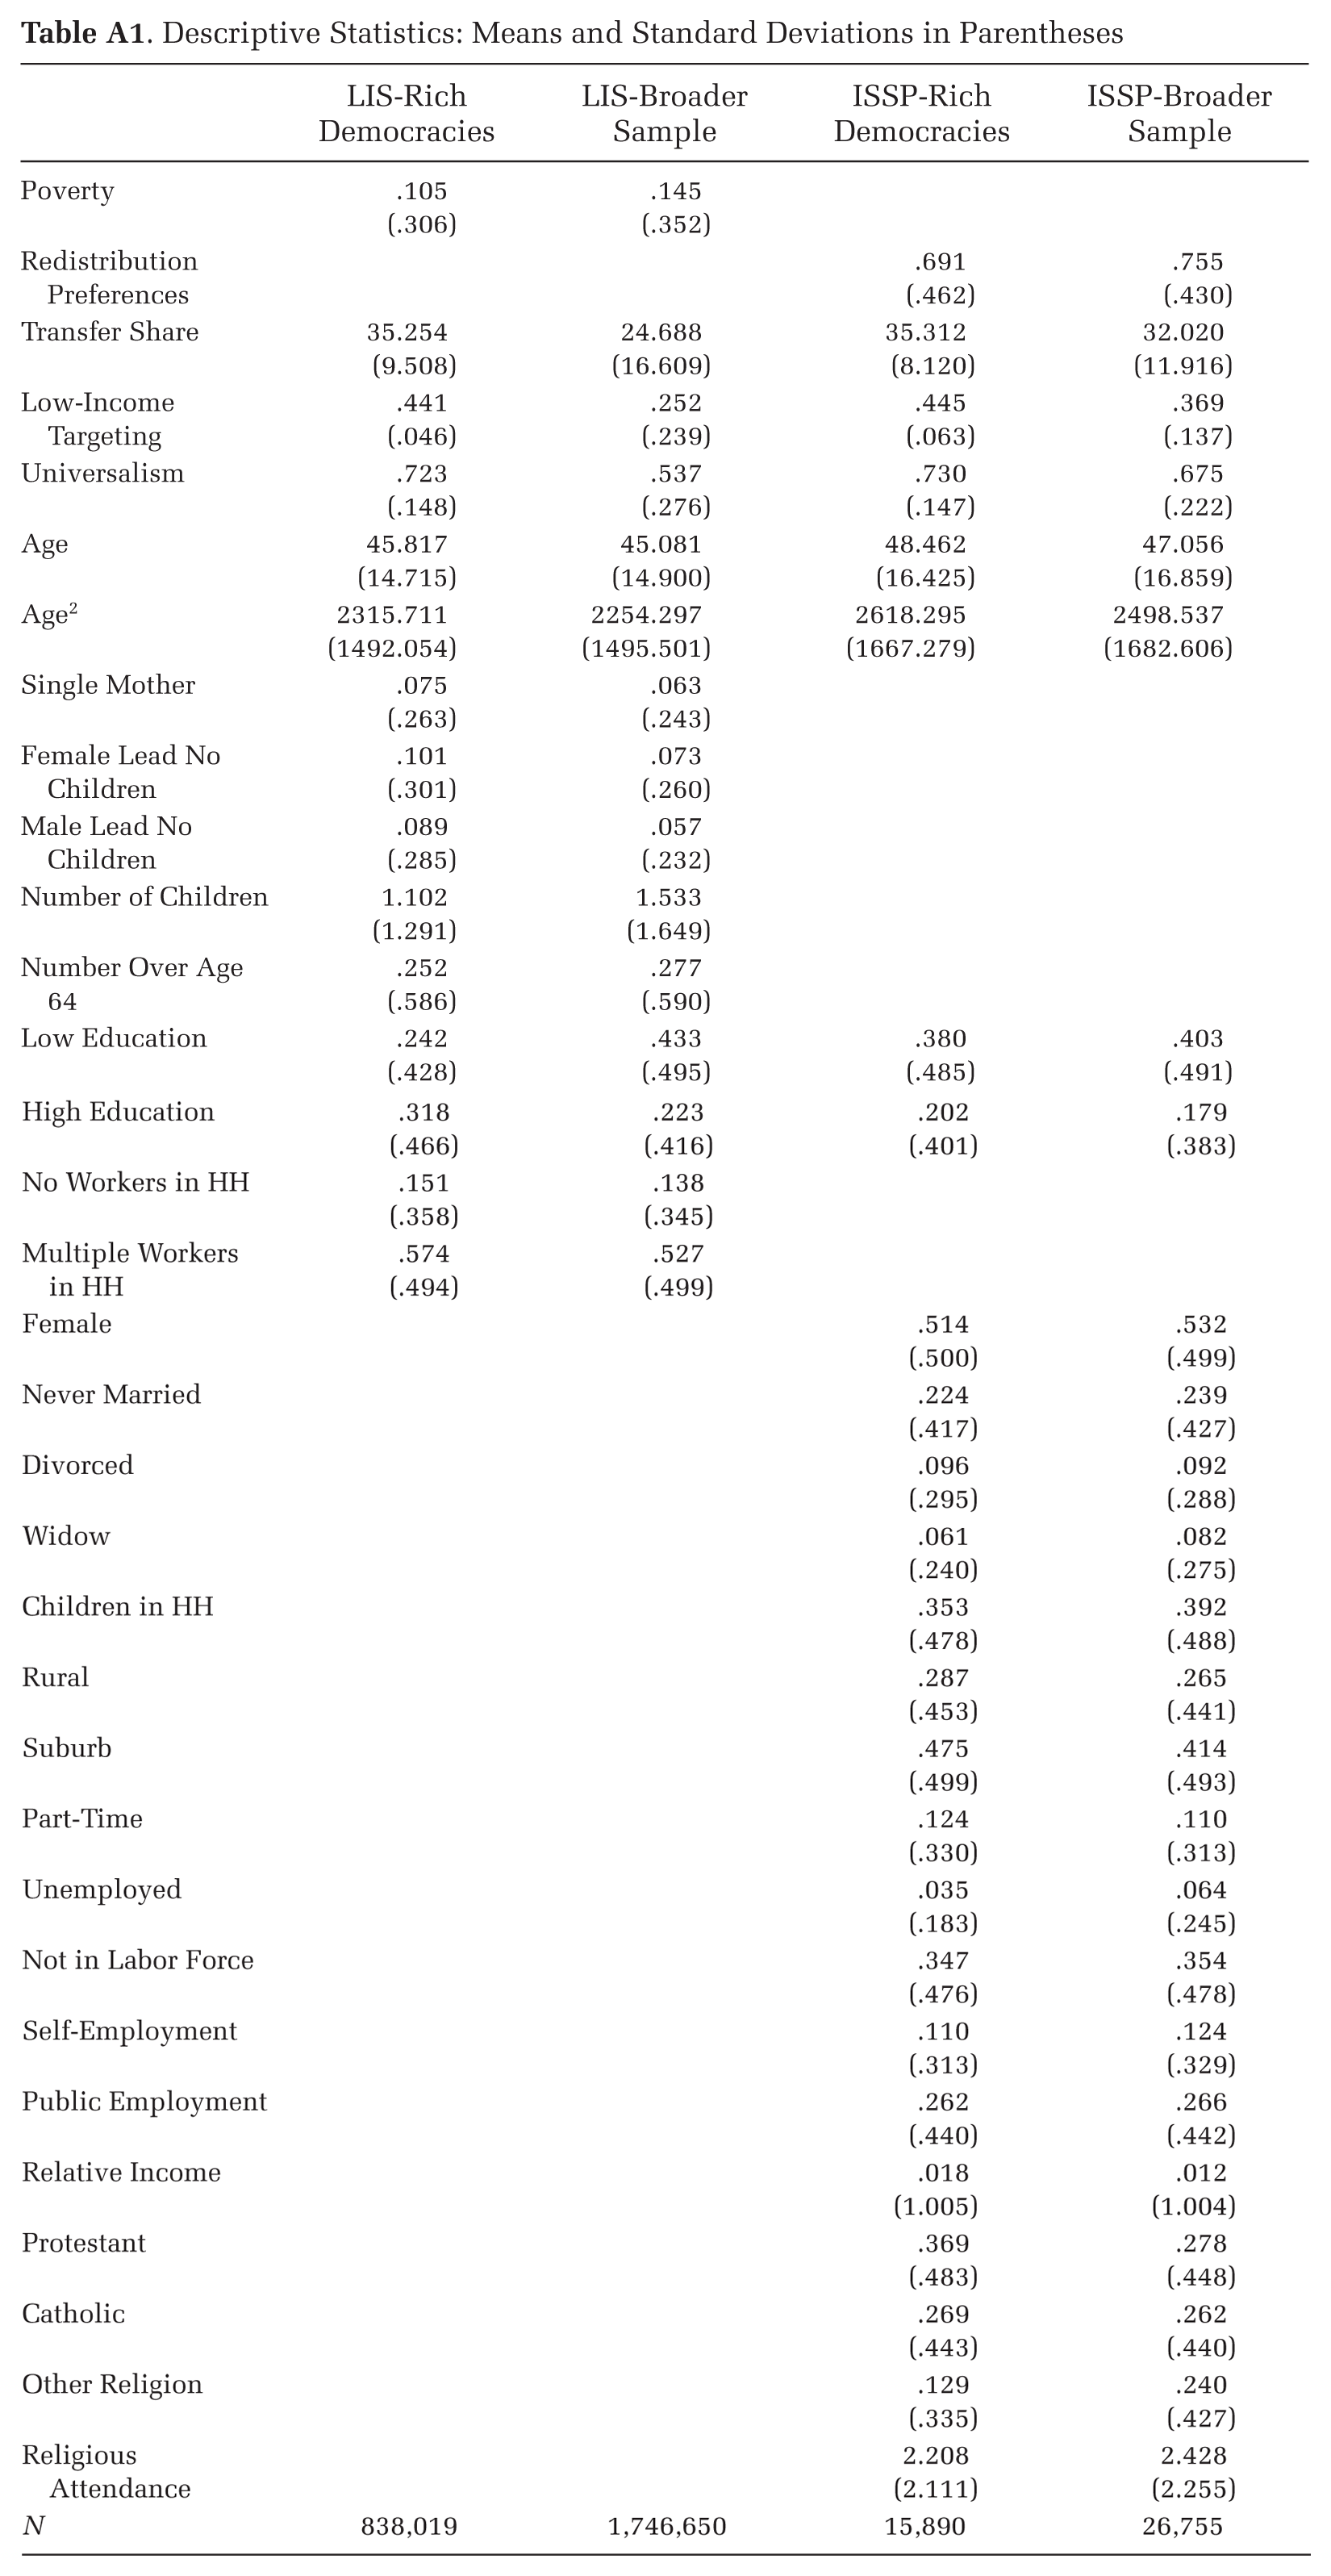
Acknowledgements
We thank Walter Korpi and Joakim Palme for being genuinely open to intellectual discussion. We also greatly appreciate the following for assistance and suggestions: the ASR editors and reviewers, Art Alderson, Andy Andrews, Regina Baker, Pablo Beramendi, Agnes Blome, Tom Cusack, Sandra Danziger, Bernhard Ebbinghaus, Robert Erikson, Juan Fernandez, Tommy Ferrarini, Ryan Finnigan, Kent Freeze, Andy Fullerton, Julian Garritzmann, Peter Hall, Evi Huber, Sabine Hübgen, Markus Jantti, Sandy Jencks, Joscha Legewie, Jianghong Li, Steffen Mau, Kenneth Nelson, Phil Rehm, John Stephens, Stefan Svallfors, Kathy Thelen, my WZB colleagues, the USP writing workshop, and audiences at University of Amsterdam, University of Bremen, Harvard University, University of Iceland, University of Mannheim, University of Michigan, Paris School of Economics, the Swedish Institute for Social Research (SOFI), the 2012 ESPANET meetings, and the 2013 APPAM meetings.
Funding
This research was partially supported by National Science Foundation grant 1059959/1061007 (principal investigators: David Brady, Evelyne Huber, and John D. Stephens).
1.
Transfers refer to cash or near cash benefits provided by the state to individuals and households. In the United States, for example, the largest transfers include old age pensions and unemployment compensation. As we will note, transfers do not include nonmonetary services.
2.
According to Google Scholar, KP has more than 1,350 citations. This appears to be the most cited article on the welfare state published since at least 1998. Many other classics in the welfare state literature (e.g., Esping-Andersen 1990; Huber and Stephens 2001; Korpi 1989; ![]() ) share several arguments with KP (e.g., universalism’s superiority over targeting, critiques of welfare effort, and feedback effects).
) share several arguments with KP (e.g., universalism’s superiority over targeting, critiques of welfare effort, and feedback effects).
3.
Australia, Canada, Finland, France, West Germany, the Netherlands, Norway, Sweden, Switzerland, the United Kingdom, and the United States.
4.
Despite Esping-Andersen’s criticisms of effort, there are many similarities between his decommodification and transfer share. Decommodification entails relief from having to commodify/sell one’s labor on the market. By definition, a greater transfer share means more of the typical household’s income does not come from selling labor on the market.
5.
6.
7.
While a random-intercept model estimates only the intercept variance, even one random slope estimates three parameters: the intercept variance, the slope variance, and (with an unstructured covariance matrix) the covariance between the intercept and slope. Thus, random coefficients quickly exhaust level-2 units. Moreover, cross-level interactions present challenges (as do any interactions) with a binary dependent variable.
8.
For example, the underlying India Human Development Survey has questions on public employee, old age, widow, and disability pensions; scholarships; the national maternity scheme; the Annapurna scheme; the value of land received from the government; assistance to build housing, latrines, and cookstoves; ration cards; and income from any government source (see p. 15 of ![]() ).
).
9.
An alternative is the ratio of the poor’s mean transfers over the non-poor’s mean transfers (Marx et al. 2013), and this ratio is positively associated with our index. However, such ratios are perhaps more useful when measuring targeting on a binary group (![]() ). Also, there is potential circularity as the level of transfers defines the size and composition of the poor (and thus affects both the definition of poverty and the level of transfers in each group).
). Also, there is potential circularity as the level of transfers defines the size and composition of the poor (and thus affects both the definition of poverty and the level of transfers in each group).
10.
For instance, one could construct a threshold appropriate for distinguishing poor from non-poor in the United States and then convert with purchasing power parity. However, such a threshold would be far too high for China, India, Latin America, and even Eastern Europe. Even a threshold constructed for the median country would not capture poverty in the richer and poorer countries.
11.
The references are collapsed due to the small number of single fathers in many countries.
12.
In addition to ample precedent in the literature, we dichotomize for three reasons (![]() ). First, “definitely” and “probably” are unlikely to have consistent meanings cross-culturally. Second, there is little meaningful variation between “probably should not be” or “definitely should not be.” Third, the ordinal versions fail the parallel regression test.
). First, “definitely” and “probably” are unlikely to have consistent meanings cross-culturally. Second, there is little meaningful variation between “probably should not be” or “definitely should not be.” Third, the ordinal versions fail the parallel regression test.
13.
In other analyses, measures of skill specificity (Cusack et al. 2005) or occupational unemployment (![]() ) were significantly positive. However, including these did not change the country-level variables, and occupation has substantial missingness in the ISSP. Therefore, we omit these from the main analyses.
) were significantly positive. However, including these did not change the country-level variables, and occupation has substantial missingness in the ISSP. Therefore, we omit these from the main analyses.
14.
In all figures, we display 95 percent confidence intervals with gray shading.
15.
Standardized odds multiply the coefficient by the standard deviation of the independent variable and then exponentiate. We interpret the magnitude of odds less than one in terms of inverse odds (−1/odds) or inverse standardized odds.
16.
Because comparing across logit models can be problematic, we also estimated multilevel linear probability models. These results were consistent (targeting and universalism were initially significant, but became insignificant when included with transfer share).
17.
The correlation is still positive if we omit countries with low-income targeting below zero (r = .32). The correlation becomes essentially zero if we omit countries with low-income targeting below .17. This would omit Brazil, China, Colombia, Guatemala, India, Mexico, Peru, and Taiwan, but retain many of the non-rich democracies (the Czech Republic, Estonia, Hungary, Poland, Russia, South Africa, South Korea, Slovenia, Slovak Republic, and Uruguay).
18.
Unlike KP, we do not examine redistribution. First, and most important, pre-tax income is not available for many LIS datasets. Therefore, despite claims to measure redistribution as the difference between pre-fisc and post-fisc income, analysts often measure pre-transfer post-tax “net” income. Second, individual-level pre-fisc income is likely endogenous to transfers. Third, individual-level redistribution is more difficult to interpret than is country-level redistribution. Fourth, measuring redistribution typically requires omitting retirees, but we investigate the entire population. Finally, redistribution measures have been critiqued for, among other things, conflating between- and within-person redistribution (Brady 2009; Kelly 2005; ![]() ).
).
19.
In analyses available upon request, we estimated the models for countries that are not rich democracies. Although there are only a limited number of level-2 units, these results were quite similar to those for the broader sample.
References
Supplementary Material
Please find the following supplemental material available below.
For Open Access articles published under a Creative Commons License, all supplemental material carries the same license as the article it is associated with.
For non-Open Access articles published, all supplemental material carries a non-exclusive license, and permission requests for re-use of supplemental material or any part of supplemental material shall be sent directly to the copyright owner as specified in the copyright notice associated with the article.