
Abstract
Recent sociological work shows that pro-market neoliberal policies across advanced capitalist countries are due to distributional struggle between classes in the 1970s and 1980s. The orthodox monetarist view, alternatively, sees neoliberal reform as a nonpolitical attempt to end the stagflation crisis of the 1970s. From this perspective, monetary and fiscal expansions brought high inflation, and central bank discipline and government austerity is the solution; but the recent trend of low inflation despite accelerating money growth and government spending contradicts this view. Analyses of time-series cross-section data for 23 OECD countries from 1960 to 2009 support the thesis that the rise and fall of inflation is more about distribution of power between labor and capital than about monetary and fiscal discipline. Inflation in the 1970s originated from a strong working class and hurt capital more than it did workers, while neoliberal repression of workers’ power has kept inflation low from the 1980s onward. Disempowerment of labor created rising inequality and economic imbalances that fueled a financial boom underlying the global financial crisis of 2008. Re-empowering labor is a remedy to such imbalances and the subsequent deflationary pressure.
Class Conflict or Stagflationary Origin of Neoliberalism?
Recent work in political sociology shows that neoliberalism—a dominant policy regime that prefers free markets to government intervention and is characterized by tax cuts, welfare state retrenchment, financial deregulation, monetary discipline, and government austerity—originated from distributional struggles involving political mobilization of the capitalist and middle classes against progressive taxation and the welfare state in advanced capitalist economies in the 1970s and 1980s (Krippner 2011; Martin 2008; Prasad 2006, 2012; cf. Harvey 2007). This work offers fresh insights into the social origins of neoliberalism, which facilitated the great financial expansion of the past three decades and precipitated 2008’s global financial crisis, the most devastating since the Great Depression. Its persuasiveness notwithstanding, this literature has not yet fully engaged the monetarist justification for neoliberalism, which has been influential among economists, policymakers, and the public. According to this account, neoliberal reform is a necessary and nonpolitical remedy to the stagflation crisis that combined high inflation and sluggish growth in the 1970s (see Jones 2012). In this article, we reassess the monetarist theory of inflation and find that it is, as a scientific justification of neoliberal policies, deficient. The fear of inflation and the fight against it are in fact tied closely to the distribution of power between classes.
According to Milton Friedman, the leading economist in formulating the monetarist theory, rising government deficit spending induces monetary expansion by the central bank, and excessive money growth brings only high inflation, with no economic benefit in the long run (Friedman 1970a, 1970b, 1981). Dismantling the Keynesian welfare state and tightening monetary policy are thus the cure for high inflation. Even though the stagflation crisis in the 1970s and its resolution under the conservative governments of Ronald Reagan and Margaret Thatcher in the 1980s appeared to vindicate the monetarist theory, recent empirical economic trends undermine it. In the aftermath of the Great Crash of 2008, the U.S. government resorted to aggressive fiscal stimuli to stem the free fall of the economy. The U.S. Federal Reserve started quantitative easing programs that vastly increased the money supply to rejuvenate the economy and finance the government’s soaring deficit. Likewise, the European Central Bank loosened monetary policy to fund the growing fiscal deficits of troubled European governments. Many economists and politicians fear these actions will unleash hyperinflation without generating economic recovery (see, e.g., Ferguson 2011; Weale 2013). In the six years after their inauguration, however, there have been no signs of rising inflation, even after the U.S. economy started to expand again in 2010. Some writers even contend that the gravest threat confronting the United States and Europe is deflation (CNBC 2014; Krugman 2010a). 1 This raises the question of whether monetarist orthodoxy is still valid, if it ever was.
The weak correlation between money supply growth and the inflation rate is not restricted to the aftermath of the Great Crash of 2008. Results from empirical studies on the dynamics of inflation, which rely primarily on data up to the 1990s, are in conflict with the monetarist theory too (e.g., Batini, Jackson, and Nickell 2000; Galí and Gertler 1999; Galí, Gertler, and Lopez-Salido 2001; Lawless and Whelan 2011; Rudd and Whelan 2005, 2007; Sbordone 2002). Loose monetary policy, fiscal deficits, and government indebtedness grew across the advanced capitalist world as early as the mid-1990s, yet inflation has remained low. This anomaly led to some, but not much, discussion (e.g., Bernanke 2004; Ferguson 2011; Galí and Gambetti 2009; Stock and Watson 2002). Therefore, a serious reassessment of the monetarist theory of inflation against updated empirical data is long overdue.
This article illustrates that continuous low inflation despite rising government spending and money supply growth over the past two decades, as well as the high inflation in the 1970s, can be better explained by a class power perspective. According to this perspective, workers’ power vis-à-vis capital is the most significant determinant of the inflation rate. The reason for this is that empowered labor forces capital to yield to demands for wage increases, bringing upward pressure on prices, while working-class disempowerment leads to wage stagnation and weaker inflation rates (Goldthorpe 1978; Hirsch and Goldthorpe 1978; cf. Desai 1973; Devine 1974; Rowthorn 1977; see also Wright 2000). This suggests that the rise and fall of inflation is not shaped by politically neutral economic forces and technical policies, as the monetarists argue, but is the result of distributional struggles between classes, given that the hike and repression of inflation always hurt some classes while benefiting others. We evaluate this class power view by estimating the association between different measurements of workers’ power and the inflation rate, and compare it with the association between money supply growth and the inflation rate. The evaluation is based on a time-series cross-section regression analysis of 23 advanced capitalist economies from 1960 through 2009.
Monetarist and Class Power Theories of Inflation
Milton Friedman (1970a:11, 1970b, 1971; Friedman and Schwartz 1971) declared that “inflation is always and everywhere a monetary phenomenon” and received a Nobel Prize in economics in 1976. Subsequently, the view that the inflation rate is driven solely by the growth rate of the money supply has become economic orthodoxy. In Friedman’s formula, MV = PY, M is the stock of money in circulation, V is the velocity with which the money circulates, P is the average price level, and Y is the national income in constant prices. If V and Y are held constant, the stock of money in circulation is associated with the average price of all goods, and hence a change in the money supply (money growth) is positively correlated with a change in price level (the inflation rate) (cf. Fisher 1911).
An increase in the money supply could originate from either monetary or fiscal expansion. A central bank sets an interest rate target and seeks to attain this target through different money supply management tools. The most frequently used tool is “open market operation,” in which a central bank creates or absorbs liquidity in the market. This is done mainly by buying or selling securities, predominantly government bonds in the case of the United States (Akhtar 1997; Monnet and Weber 2001). Expansion of government deficit spending could induce an increase in the money supply, as increasing government bond sales associated with fiscal deficits compel central banks to create more money to buy these bonds. This prevents bond yields and interest rates from moving too high above the given target rate (see Friedman 1981).
According to Friedman, market mechanisms can always bring supply and demand to equilibrium and the economy’s productive capacity to full utility. An increase in the money supply will push up demand and hence prices, inducing investment and economic growth. However, in the long term, the natural growth rate of the economy is determined only by productive capacity at the time. Any attempt to stimulate the economy by increasing the money supply in excess of the equilibrium growth rate will boost growth only in the short run. Market processes will steer the economy back to its equilibrium growth rate in the long run, and nothing other than higher prices will last beyond the short term.
The monetarist theory is an explicit critique of the Keynesian doctrine that prevailed in the postwar years. The latter advocated the virtue of government spending and the necessity of government intervention in the economy. As far back as 1951, Friedman criticized such government activism as a step toward collectivism and an encroachment on individual liberty. In this paper, Friedman (1951) outlined how a neoliberal agenda centered on shrinking government and freeing up the market could avoid such a collectivist dystopia. But it was not until the economic crises of the 1970s that monetarism shed its status as a marginal approach and replaced Keynesian economics as the new orthodoxy (Jones 2012; see also the next section).
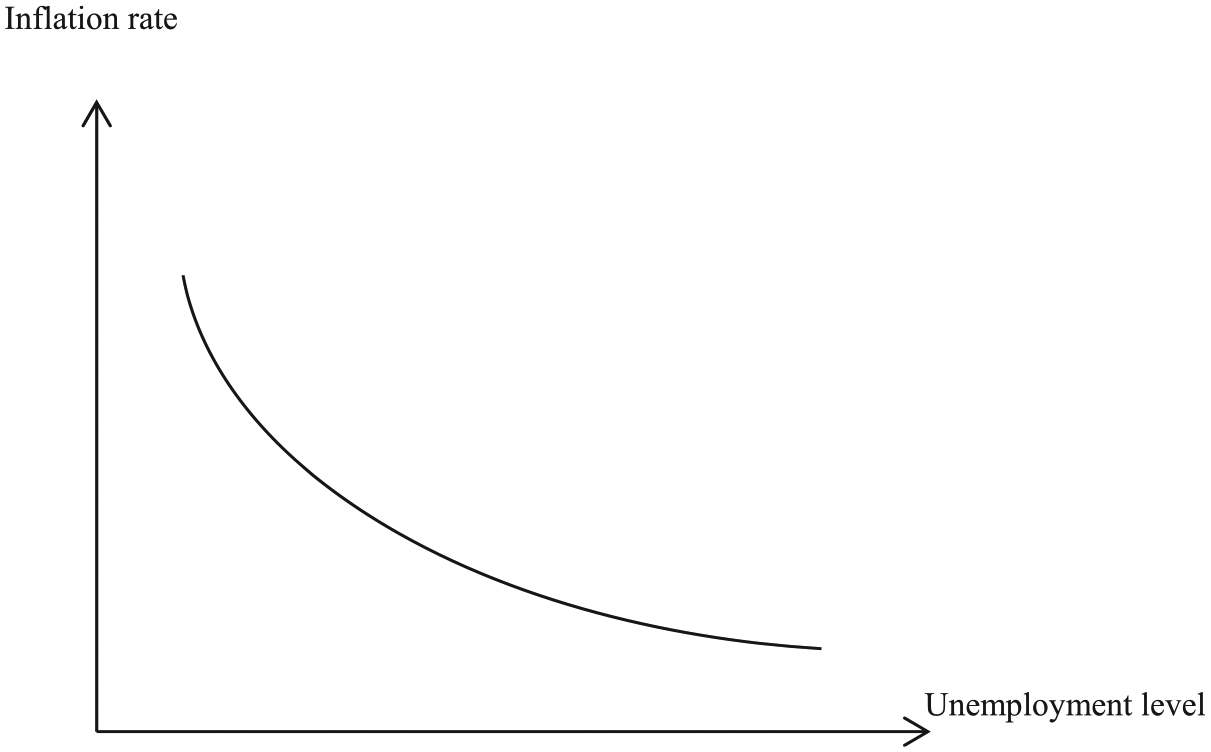
According to Keynesians, the inflation rate is determined by the wage level, which is inversely correlated with the unemployment rate. The inverse relationship between the unemployment level and the inflation rate is captured in the Phillips Curve (see Figure 1). Conceived amid the Great Depression, Keynesian economics sees market mechanisms as prone to failure and being incapable, on their own, of bringing supply and demand to equilibrium to generate full use of the economy’s productive capacity. On the contrary, unemployment can lead to insufficient aggregate demand, which in turn depresses profits and begets failures of enterprises, generating more unemployment. Keynesians argued that this downward spiral was the origin of the Great Depression and the market would never get out of it by itself. As a remedy, an active government should intervene via expenditure and job creation. When unemployment shrinks, Keynesians observed, a tightening labor market brings rising wages and hence rising demand. Expanding aggregate demand induces higher inflation, but higher prices stimulate investment and output, which brings down inflation in the long run. Inflation will eventually subside and a virtuous cycle of full employment and economic growth ensues. For the Keynesians, the government’s task is to manage aggregate demand and balance the trade-off between full employment and inflation (see, e.g., Okun, Fellner, and Wachter 1975).
The Phillips Curve
Along with the Keynesian and monetarist perspectives on inflation in the 1970s, a budding group of economists and sociologists used Marxian or Weberian concepts of class conflict to account for the sources of inflation (Desai 1973; Devine 1974; Goldthorpe 1978; Rowthorn 1977; Wright 2000). Like the Keynesians, they argued that high inflation was caused by rising wages. But they recognized that wage hikes could come not only from a tightening labor market, as the Keynesians claimed, but also from organized labor’s increasing mobilization capacity, which enabled it to pressure employers to raise wages or push governments to adopt policies to increase wages through collective action:
Over recent decades the generally rising rate of inflation reflects a situation in which conflict between social groups and strata has become more intense and also to some extent more equally matched. . . . Less advantaged groups and strata have tended to become more free of various constraints on their actions in pursuit of what they see as their interests; hence, they have become more likely to “punch their weight.” (Goldthorpe 1978:196)
For Wright (2000), tightening labor markets and organized labor’s rising mobilization capacity are two facets of increasing working-class power. A tightening labor market means greater structural power for workers. From this perspective, increasing workers’ bargaining power is attributable to greater employer demand for labor power. Workers’ capacity to mobilize reflects their associational power; this, in turn, comes from the strength of autonomous organizing institutions, such as unions. Viewed in this light, the Keynesian account explains inflation in terms of workers’ structural power, whereas the Marxian–Weberian class power perspective emphasizes workers’ associational power.
The class power explanation did not gain much traction before scholarly interest in inflation faded in the early 1980s, when advanced capitalist states successfully tamed inflation amid neoliberal reform, cementing monetarism’s rise to orthodoxy in economics. Figure 2 summarizes the contrasting explanations of inflation.

Competing Explanations of Inflation
Distributional Struggles and Paradigmatic Shifts of Twentieth-Century Capitalism
The relative prevalence of different paradigms explaining inflation is determined not only by their explanatory power, but also by the distributional politics of twentieth-century capitalism. At the turn of the twentieth century, increasing inter-capitalist competition following the industrialization of Germany and Japan, along with a lack of financial regulation and underconsumption brought by class polarization, drove down manufacturing profit rates and made the boom–bust business cycle more volatile. Economic instability culminated in the Great Depression of the 1930s and the subsequent rise of fascism and the Second World War. This precipitated rising skepticism of self-regulating markets and the ascent of Keynesian economics (Arrighi 1994; Polanyi [1944] 2001). Under the postwar Keynesian orthodoxy, expanding government expenditures on social welfare and infrastructure were generally believed to boost employment and aggregate demand, guaranteeing growth. This government activism was supported by the proclivity of central banks to finance government deficits through monetary expansion. Capitalist governments responded to the threat of socialism by accommodating the rising demands of organized labor through labor friendly wage and redistributive policies (Arrighi 1994; Brenner 2003; Kristal 2010; Silver 2003).
The capitalist boom under Keynesianism ended in the late 1960s, when Europe’s and Japan’s full recovery from World War II led to new inter-capitalist competitive pressures. This, along with the rising demands of militant organized labor, depressed manufacturing profits and economic growth (Arrighi 2007; Brenner 2003). Capital transferred a large part of the costs of rising wages to consumers through price hikes, unleashing an inflationary spiral (Arrighi 2007). The resulting stagflation in the 1970s is presumed to be an economic disaster that hit all sectors and classes equally hard. But, in reality, the crisis hit capital, particularly financial capital, harder than labor. Inflation ate up workers’ wage gains, but workers benefited from full employment policies, welfare benefits tied to price indexes, and devaluation of their debts in real terms. In contrast, the crisis hit capital by decreasing their real interest income and real asset value (Volscho forthcoming). Amid the stagflation crisis of the 1970s, income inequality declined rapidly in most advanced countries to its lowest level in the postwar era, as did the income share of the wealthiest (Alderson and Nielsen 2002; Piketty 2014).
Some empirical studies confirm that inflation has a progressive impact on income distribution (Blinder and Esaki 1978; Jantti 1994; Volscho 2004). But the stagflation crisis unified and energized capitalists to fight for tax cuts for the wealthy, business deregulation, and the dismantling of institutionalized labor power. This coincided with a middle-class tax revolt, creating a strong coalition aimed at bringing down the Keynesian welfare state and ending wage-driven inflation. This capitalist–populist mobilization eventually put Margaret Thatcher and Ronald Reagan in power in 1979 and 1980 (Akard 1992; Martin 2008; Prasad 2006; see also Krippner 2011; Panitch and Gindin 2013).
When the problem of inflation first emerged in the late 1960s, policymakers were openly in agreement with the class power thesis that inflation was caused by powerful organized labor, and that rolling back workers’ power was key to curbing inflation. For example, the OECD published a report, Inflation: The Present Problem, in 1970 asserting that excessive labor demands were the cause of inflation and advising that OECD governments should shift their fiscal and monetary policies away from prioritizing full employment; the report explicitly advocated destruction of jobs as a remedy for inflation (Korpi 2002; OECD 1970). Later in 1977, the U.S. Federal Reserve Open Market Committee openly attributed high inflation to labor strike activities (McCarthy 2015).
Conservative populists who came to power in the early 1980s adopted tax and welfare cuts. They supported aggressive tightening of the money supply by central banks to discipline government borrowing and spending, creating a new macroeconomic environment more favorable to capital and less friendly to labor. Even the French Socialist government of François Mitterrand shifted rightward to adopt conservative economics in 1983 (Korpi 2002). Right-wing leaders also attacked organized labor directly, as exemplified by Thatcher’s defeat of the coal miners’ strike in 1984 to 1985, and Reagan’s crushing of the air traffic controllers’ strike in 1981. They deregulated capital–labor relations to make employment less secure and wages less guaranteed (Akard 1992; McCartin 2011; Prechel 2000; Raffalovich, Leicht, and Wallace 1992). These assaults on labor, in tandem with structural changes, such as manufacturing outsourcing, computerization, and financialization, significantly weakened the working class’s bargaining power and income share, boosting income inequality (Bluestone and Harrison 1988; Harvey 1991; Kristal 2013; Lin and Tomaskovic-Devey 2013). This is consistent with the thesis that the crux of the neoliberal agenda goes beyond market deregulation, price stability, and small government. Rather, the main goal is the restoration of capital’s class power over labor that had been restrained under the Keynesian social compact (Harvey 2007; see also Arrighi 2007; Arrighi and Silver 1999).
The neoliberal agenda has been driven by the imperative of reinvigorating capital’s power vis-à-vis labor, and the rationale behind the agenda was initially framed in explicit class power terms. However, the rising monetarist orthodoxy depoliticized neoliberalism by providing “a stamp of scientific respectability to a whole range of conservative policies” (Pollin 1999:104; see also Palley 2005, 2007). As discussed earlier, the monetarist orthodoxy views excessive money supply as an unnatural distortion of the free market that unleashes inflation. It portrays the dismantling of the Keynesian welfare state and the concomitant monetary contraction as nothing more than a technical remedy to market distortion, and one that benefits all (Jones 2012; Krippner 2011).
From the mid-1980s on, inflation in the richer capitalist economies receded while corporate profitability was restored (Dumenil and Levy 2013). The stabilization of economic growth and its apparent association with monetarist prescriptions elevated monetarism to orthodoxy, one that justified neoliberal policies. However, as we have seen, restraining the money supply and government spending as a means to indirectly weaken workers’ power was only one component of neoliberal reform. An equally important component was the direct attack on organized labor. Whether and to what extent the disempowerment of the working class contributed to the containment of inflation, in comparison with the direct effect of tightening the money supply as predicated by the monetarists, has not been adequately explored.
In the aftermath of the Asian Financial Crisis of 1997, Alan Greenspan’s Federal Reserve attempted to prevent an economic downturn by loosening monetary policy. The loosening redoubled in response to the recession of 2001, which was worsened by the September 11 terrorist attacks. Concomitantly, George W. Bush’s administration deviated from the doctrine of small government and increased federal government spending substantially (Block 2008). The U.S. benchmark interest rate fell from above 6 percent in late 2000 to below 2 percent by 2008, and government spending’s share of GDP rose from 17.6 percent in 2000 to 23.4 percent in 2011. Thus, at the turn of the twenty-first century, the U.S. government abandoned the monetarist component of neoliberalism that emphasizes disciplined government spending and money supply. Europe did the same after the launch of the euro in 1999 (Dominguez 2006; Erixon 2013). 2 The other part of the neoliberal package, the direct repression of working-class power, continued with uninterrupted deregulation of the labor market and the hemorrhaging of manufacturing jobs under trade liberalization. The 1980s and 1990s can thus be seen as the first period of neoliberalism, when the government upheld fiscal, monetary, and labor discipline. The period beginning in the late 1990s, when the government loosened the money supply, increased spending, and continued to keep labor in check, can be regarded as the second period of neoliberalism. Table 1 illustrates the changing face of neoliberalism since the 1980s.
Trajectory from Keynesianism to Neoliberalism
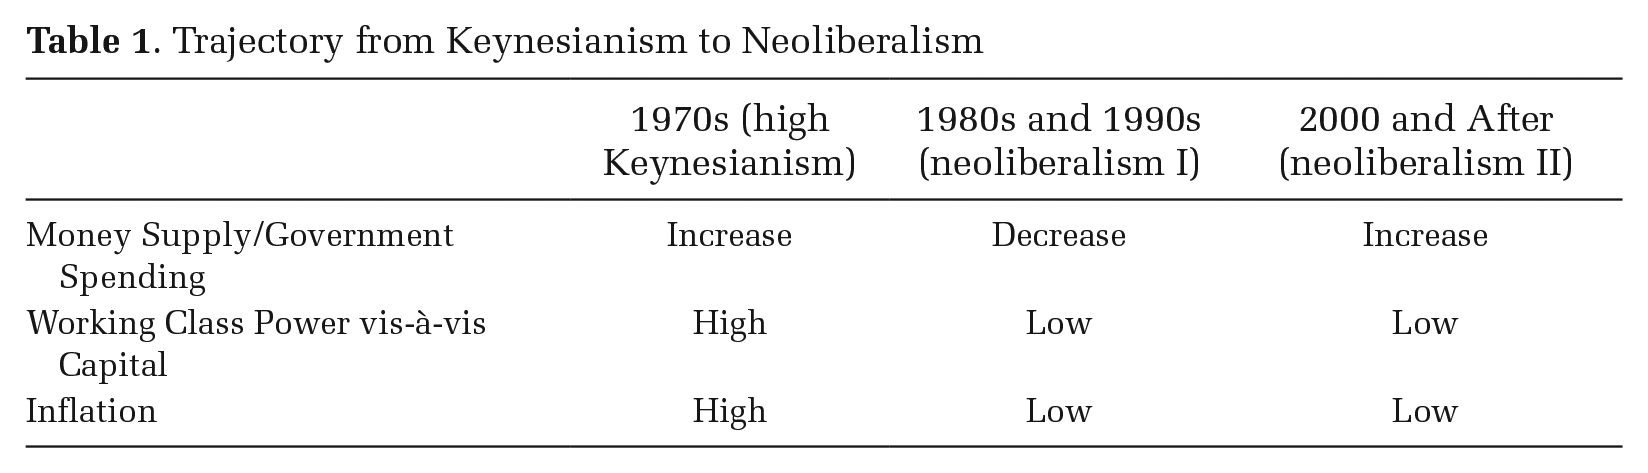
A comparison of the periodization of neoliberalism with the trajectory of inflation rates—high inflation in the 1970s and low inflation in the 1980s to 2000s—suggests the inflation rate is not shaped directly by money supply change, but by the changing power of workers vis-à-vis capital. More rigorous analysis is needed to substantiate this assessment.
Hypotheses, Data, and Method
In our analysis, we take the inflation rate as the dependent variable and estimate the significance and magnitude of the effects of a number of independent variables according to the hypotheses outlined below. Monetarist orthodoxy attributes the high inflation rate in the 1970s to rapid monetary expansion, and the containment of inflation after 1980 to a disciplined money supply. Earlier empirical studies show that the effect of money growth on the inflation rate usually involves a time lag of one to two years, as liquidity created in the central bank needs to move through the commercial banking system before actually influencing consumers’ spending. However, some later studies suggest that the time lag could be shorter (Batini and Nelson 2002; Bernanke et al. 1999; Friedman 1961, 1972). This leads to our first hypothesis:
Hypothesis 1: The inflation rate is positively correlated with the growth rate of the money supply, lagged for zero to two years.
Some empirical studies have validated this hypothesis (e.g., Dwyer and Hafer 1999), but most studies use data only up to the 1990s. Table 1 suggests this correlation might hold for the 1970s through the mid-1990s, but not afterward when inflation continued to be modest despite accelerating money growth. The inflation rate might be more closely related to the level of working-class power, as inflation was high in the 1970s when working-class power was high, and low from the 1980s through the present when organized labor was disempowered. This assessment supports the class power theory of inflation. Most studies illustrating that workers’ power influences inflation, as reviewed earlier, show that the impact of changes in working-class power on wages and prices is immediate, so we expect no lag in the effect of workers’ power on inflation:
Hypothesis 2: The rate of inflation is positively correlated with working-class power.
The monetarist and class power perspectives lead to divergent hypotheses, but a synthesis of the two perspectives is possible. For example, Ferguson (2011), despite his more recent prediction that the aggressive increase in the money supply after 2008 will foster double-digit inflation, argued in 2006, upon the passing of Milton Friedman, that the direct relationship between money supply growth and the inflation rate that the monetarists originally suggested no longer holds. He contended that because labor’s bargaining power had been decimated over the past two decades, a money supply increase will no longer translate into wage and price increases:
In our time, unlike in the 1970s, oil price pressures have been countered by the entry of low-cost Asian labour into the global workforce. Not only are the things Asians make cheap and getting cheaper, competition from Asia also means that Western labour has lost the bargaining power it had 30 years ago. Stuff is cheap. Wages are pretty flat. As a result, monetary expansion in our time does not translate into significantly higher prices in shopping malls. (Ferguson 2006)
We can thus hypothesize that the effect of money supply growth on the inflation rate is mediated by working-class power:
Hypothesis 3: Money growth affects the inflation rate indirectly by increasing the effect of working-class power on the inflation rate.
Our analysis also includes as controls a number of variables that influence the inflation rate, according to the existing literature. First, labor productivity growth should be negatively correlated with inflation, as an increase in wages and demand will exert less inflationary pressure if it is accompanied by increasing output from higher labor productivity. Also, some authors attribute recent low inflation to globalization, which results in cheap imports from low-wage countries (Auer and Fischer 2010; Qin and He 2012; White 2008). Furthermore, we expect that a change in the oil price will have a significant impact on the inflation rate (see Cunado and Gracia 2003). Finally, faster economic growth could stimulate demand and hence contribute to inflationary pressure.
We examine the effects of these variables on the inflation rate using time-series cross-section regression. Our country sample consists of 23 rich capitalist OECD members (since the 1970s) and covers the period 1960 to 2009. The dataset is incomplete due to missing data. Part A of the online supplement (http://asr.sagepub.com/supplemental) lists all countries included and country-years where data are missing.
In our analysis, the dependent variable inflation rate is defined as the percentage change of the general consumer price index from a year earlier. The values are transformed by natural log to attain a normal distribution. To avoid taking the natural log of negative values while excluding outlier cases of large deflation, we add 1 to the inflation rate values before taking the log. The independent variable money growth refers to the percentage change of the stock of M2 in the economy from a year earlier. M2 includes all cash and checking deposits as well as savings deposits, time deposits, and money market deposits that can be easily converted into cash and checking deposits. We apply a natural log transformation to obtain a normal distribution. We add .3 to all values before the log transformation to avoid taking the log of negative numbers. Wage share is a measurement of working-class power conceptualized as workers’ bargaining power relative to owners of capital. Wage share data are compiled by dividing total employee compensation in an economy by the economy’s GDP. Previous research verifies that the working-class’s falling structural and associational power is directly reflected in the falling wage share of GDP in most Western capitalist countries (Kristal 2010). 3 Although not yet confirmed, theory suggests that inflation influences wage share. This is because wages and capital income will adjust to increasing prices at different rates (Raffalovich et al. 1992; see also Hibbs 1987). This brings the possibility of reverse causality. To address this issue, we supplement the wage share measurement of working-class power with two alternative variables, union density and unemployment rate, which directly measure the associational and structural power of the working class, respectively. Union density is the ratio of the total number of trade union members to the total number of wage earners. The unemployment rate is the total number of unemployed persons divided by the total number of individuals in the labor force. Results obtained using these alternative measurements can be used to validate the results obtained using the wage share measurement of working-class power.
Besides these main variables, the control variable southern import penetration is the extent to which a country’s domestic market is open to manufactured imports from developing countries, as measured by the total value of imports of manufactured goods from developing countries as a percentage of GDP. 4 Labor productivity growth is the percentage change in the value that a unit labor hour could generate from a year earlier measured in constant prices. Economic growth is the percentage expansion of the size of the national economy from a year earlier, based on GDP measured in constant prices. Oil price change is the percentage change in the global average oil price from a year earlier measured in constant prices. For descriptive statistics, data sources, and a correlation matrix of all independent variables, see Part B of the online supplement.
In our analysis, we first construct graphs showing the pattern of changing inflation rates, wage shares, and money growth for each country, and we report the corresponding correlation between the inflation rate and each of the other two variables. Next, we conduct a dynamic regression for all countries and years, with country fixed effects to control for country-specific, time-invariant factors associated with inflation. One plausible source of cross-country variation, as captured by the country fixed effects, is the different extent of centralized wage bargaining, which helps restrain wage increases and lower the inflation rate, as described in the literature on “varieties of capitalism” (see, e.g., Franzese 2001; Iversen 1998). 5
In the regression models, we include a lagged dependent variable to detect any dynamic process. This is common in time-series economic data, as the inertia and memory of the value of the dependent variable at a specific point in time may partially determine its value at the next point in time. This is particularly likely with inflation rate as the dependent variable, because current inflation is often affected by expectations based on the previous year’s inflation. 6 Also, as discussed earlier, the effect of money growth on the inflation rate could involve a time lag of zero to two years. We therefore estimate the coefficients for money growth with no time lag, a one-year time lag, and a two-year time lag simultaneously. 7 We estimate panel-corrected standard errors (PCSE) in the regression to correct for groupwise heteroscedasticity (see Beck and Katz 1995). We use Prais-Winsten regression instead of OLS regression and allow for first-order autocorrelation.
The data used in this analysis, like most other time-series data, might be nonstationary, meaning statistical properties (e.g., mean, variance) of the data are not constant over time. 8 Such nonstationary variables might render the regression analysis spurious. We therefore repeated the analysis with Error Correction Models (ECM) to ensure the results obtained from the regression were not biased. A bivariate version of the ECM is represented in the following general form:

The advantage of the ECM is that it accommodates both stationary and nonstationary data, and it captures short-term immediate effects and long-term equilibrium effects of any changes in the independent variables on the dependent one (Bannerjee et al. 1993; Beck and Katz 2011; De Boef and Keele 2008; Engle and Granger 1987; Keele and De Boef 2004; Kelly and Witko 2012; Kristal 2010; Volscho and Kelly 2012). 9 Rearranging Equation 1 in error correction form, we have the following:

Here β1∆Xt shows the immediate effect of a change in the explanatory variable on the dependent variable, and α1(Yt−1 + β2/α1 Xt−1) illustrates the long-term effect of any change in the explanatory variable distributed over successive points in time.
Results
Figure S1 in the online supplement shows the changing inflation rates, wage shares, and money growth for the 23 countries included in our analysis. Because we treat West Germany before 1991 and unified Germany thereafter as two separate countries, we have 24 instead of 23 pairs of graphs. The graphs in Figure S1 illustrate that for most countries, the trajectory of the change in the inflation rate is closer to that of the change in the wage share than to the change in the money supply. Table 2 documents the bivariate correlation between inflation rate and wage share as well as money growth for each country. It shows that the correlation between inflation rate and wage share is larger than that between inflation rate and money growth for 16 out of 24 countries. Countries with different results are mostly those with limited data. This observation is confirmed by our time-series cross-section regression analysis with country fixed effects. Table 3 shows the results with standardized coefficients.
Bivariate Correlation between Inflation Rate and Wage Share/Money Growth, 1960 to 2009
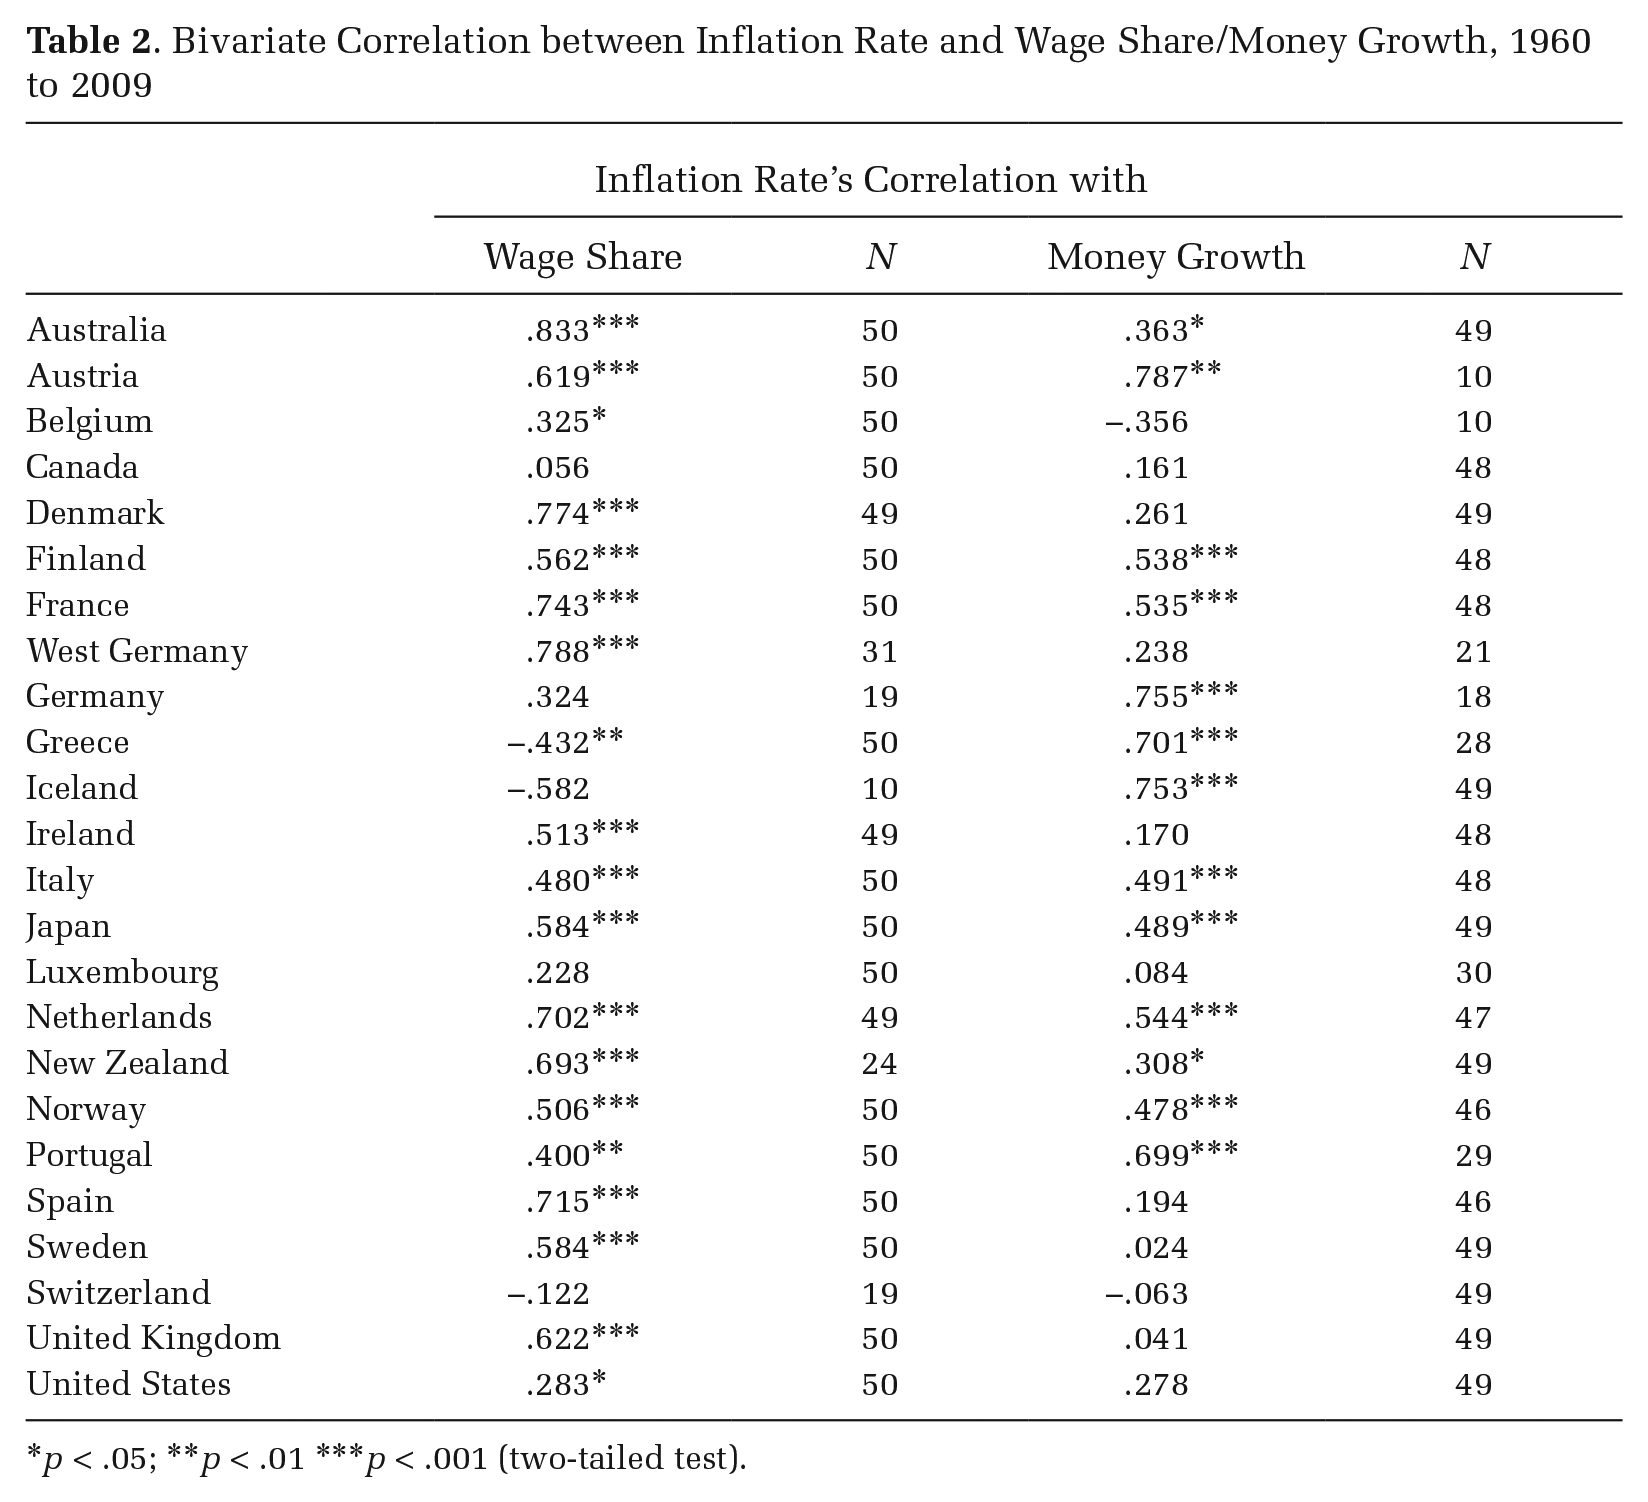
p < .05; **p < .01 ***p < .001 (two-tailed test).
Dynamic Prais-Winsten Regression Models with Panel-Corrected Standard Errors on Inflation Rate with Standardized Coefficients and Country Fixed Effects, 1960 to 2009
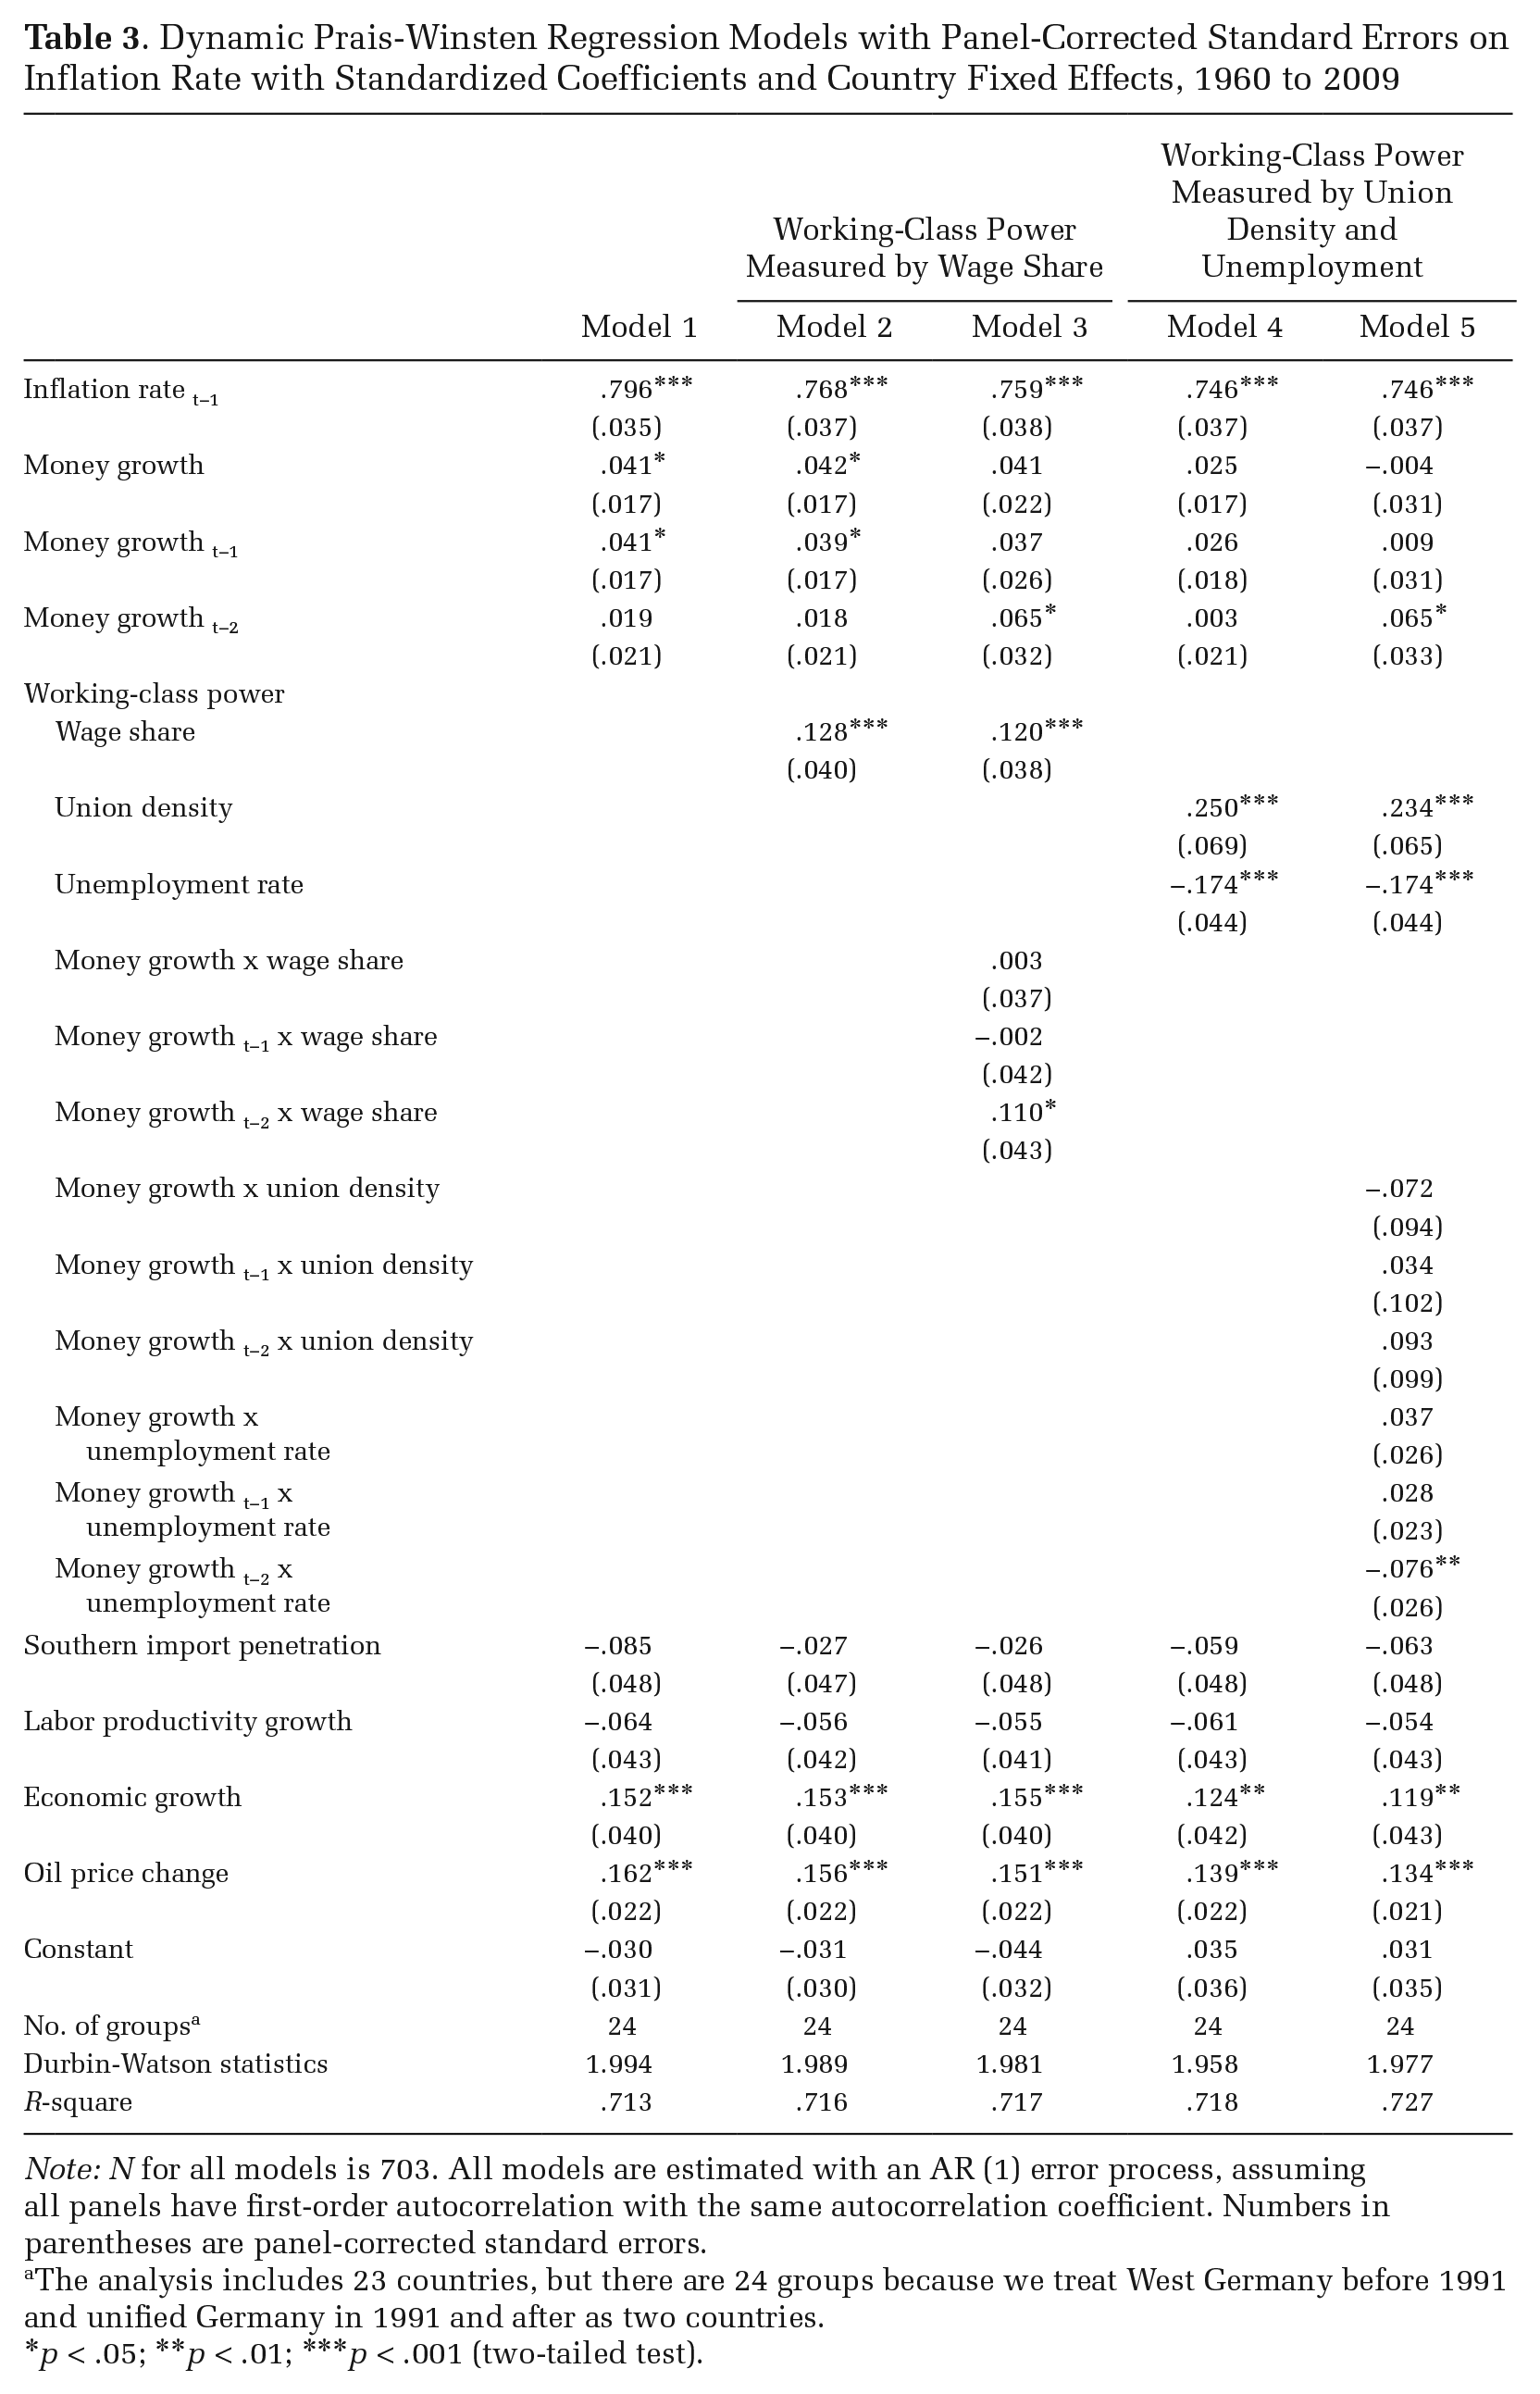
Note: N for all models is 703. All models are estimated with an AR (1) error process, assuming all panels have first-order autocorrelation with the same autocorrelation coefficient. Numbers in parentheses are panel-corrected standard errors.
The analysis includes 23 countries, but there are 24 groups because we treat West Germany before 1991 and unified Germany in 1991 and after as two countries.
p < .05; **p < .01; ***p < .001 (two-tailed test).
In Model 1 in Table 3, including money growth but none of the working-class power variables, money growth, both without a time lag and with a one-year lag, has a significant positive effect on the inflation rate. This result is consistent with the monetarist explanation of inflation. Model 1 is the baseline model for comparison with all other models, which include working-class power variables. The Durbin-Watson statistics are very close to 2 for all models, and we can rule out any bias in the results caused by autocorrelation.
Model 2 adds the wage share variable, which shows a significant, strong, and positive effect on the inflation rate. The magnitude of the effect is much stronger than that of money growth. The standardized coefficient for the wage share is .13, in contrast to .04 for money growth with both no time lag and a one-year time lag. 10 We cannot rule out an effect of money growth, but workers’ power matters more in determining the inflation rate.
Hypothesis 3 stated that money growth does not boost inflation directly, but does so indirectly by increasing the effect of working-class power. To assess this, Model 3 adds an interaction between wage share and money growth. Both wage share and money growth lagged for two years have a significant effect on inflation, with wage share exerting a much stronger effect. The effect of the interaction of wage share and money growth with a two-year lag is also statistically significant. This shows that, although money growth has a relatively weak direct effect on inflation, it enhances inflation indirectly by increasing the effect of the wage share. Only the interaction term where money growth is lagged for two years has a significant effect, hinting that more time is needed for money growth to affect prices through wages.
In Model 4, we use union density and the unemployment rate as alternative direct measurements of working-class power. The results are consistent with Model 2, which uses wage share as a unitary measurement of working-class power. Union density has a strong, positive, and significant effect on the inflation rate, and unemployment has a strong negative effect. The effect of money growth becomes insignificant. The contrast between the coefficients of the money growth and working-class power variables is even more pronounced than in Model 2.
In Model 5, we introduce two interaction terms that combine money growth and union density and unemployment, respectively. As in Model 3, the significance of the coefficients of the interaction term involving the unemployment rate and money growth in the expected direction verifies the indirect effect of money growth on the inflation rate through enhancing the effects of working-class power. The direct effect of money growth remains much smaller than the direct effects of the unemployment rate, union density, and the interaction terms. The signs of the coefficients of all control variables are as expected. Among all the independent variables, oil price has the largest impact on the inflation rate. However, oil shocks are external and are therefore less relevant to our discussion.
Because not all variables involved in the regression analysis are stationary, we estimate an ECM to correct for any nonstationary variables and differentiate the short- and long-term effects of the independent variables. The results, as shown in Table 4, are consistent with what we have found so far: working-class power—measured as wage share, union density, and the unemployment rate—is more important in determining inflation than is money growth. Money growth, wage share, and union density show only long-term effects on the inflation rate, but the unemployment rate shows long-term and immediate effects. We included interactions between the money growth and working-class variables for long-run terms only in Models 3 and 5, given that it presumably takes time for money growth to influence the effect of working-class power (if there is any effect), and money growth and most working-class power variables show no short-run impact on inflation in Models 2 and 4. All interaction terms are not statistically significant.
Error Correction Model with Panel-Corrected Standard Errors on Change in Inflation Rate with Standardized Coefficients and Country Fixed Effects, 1963 to 2009
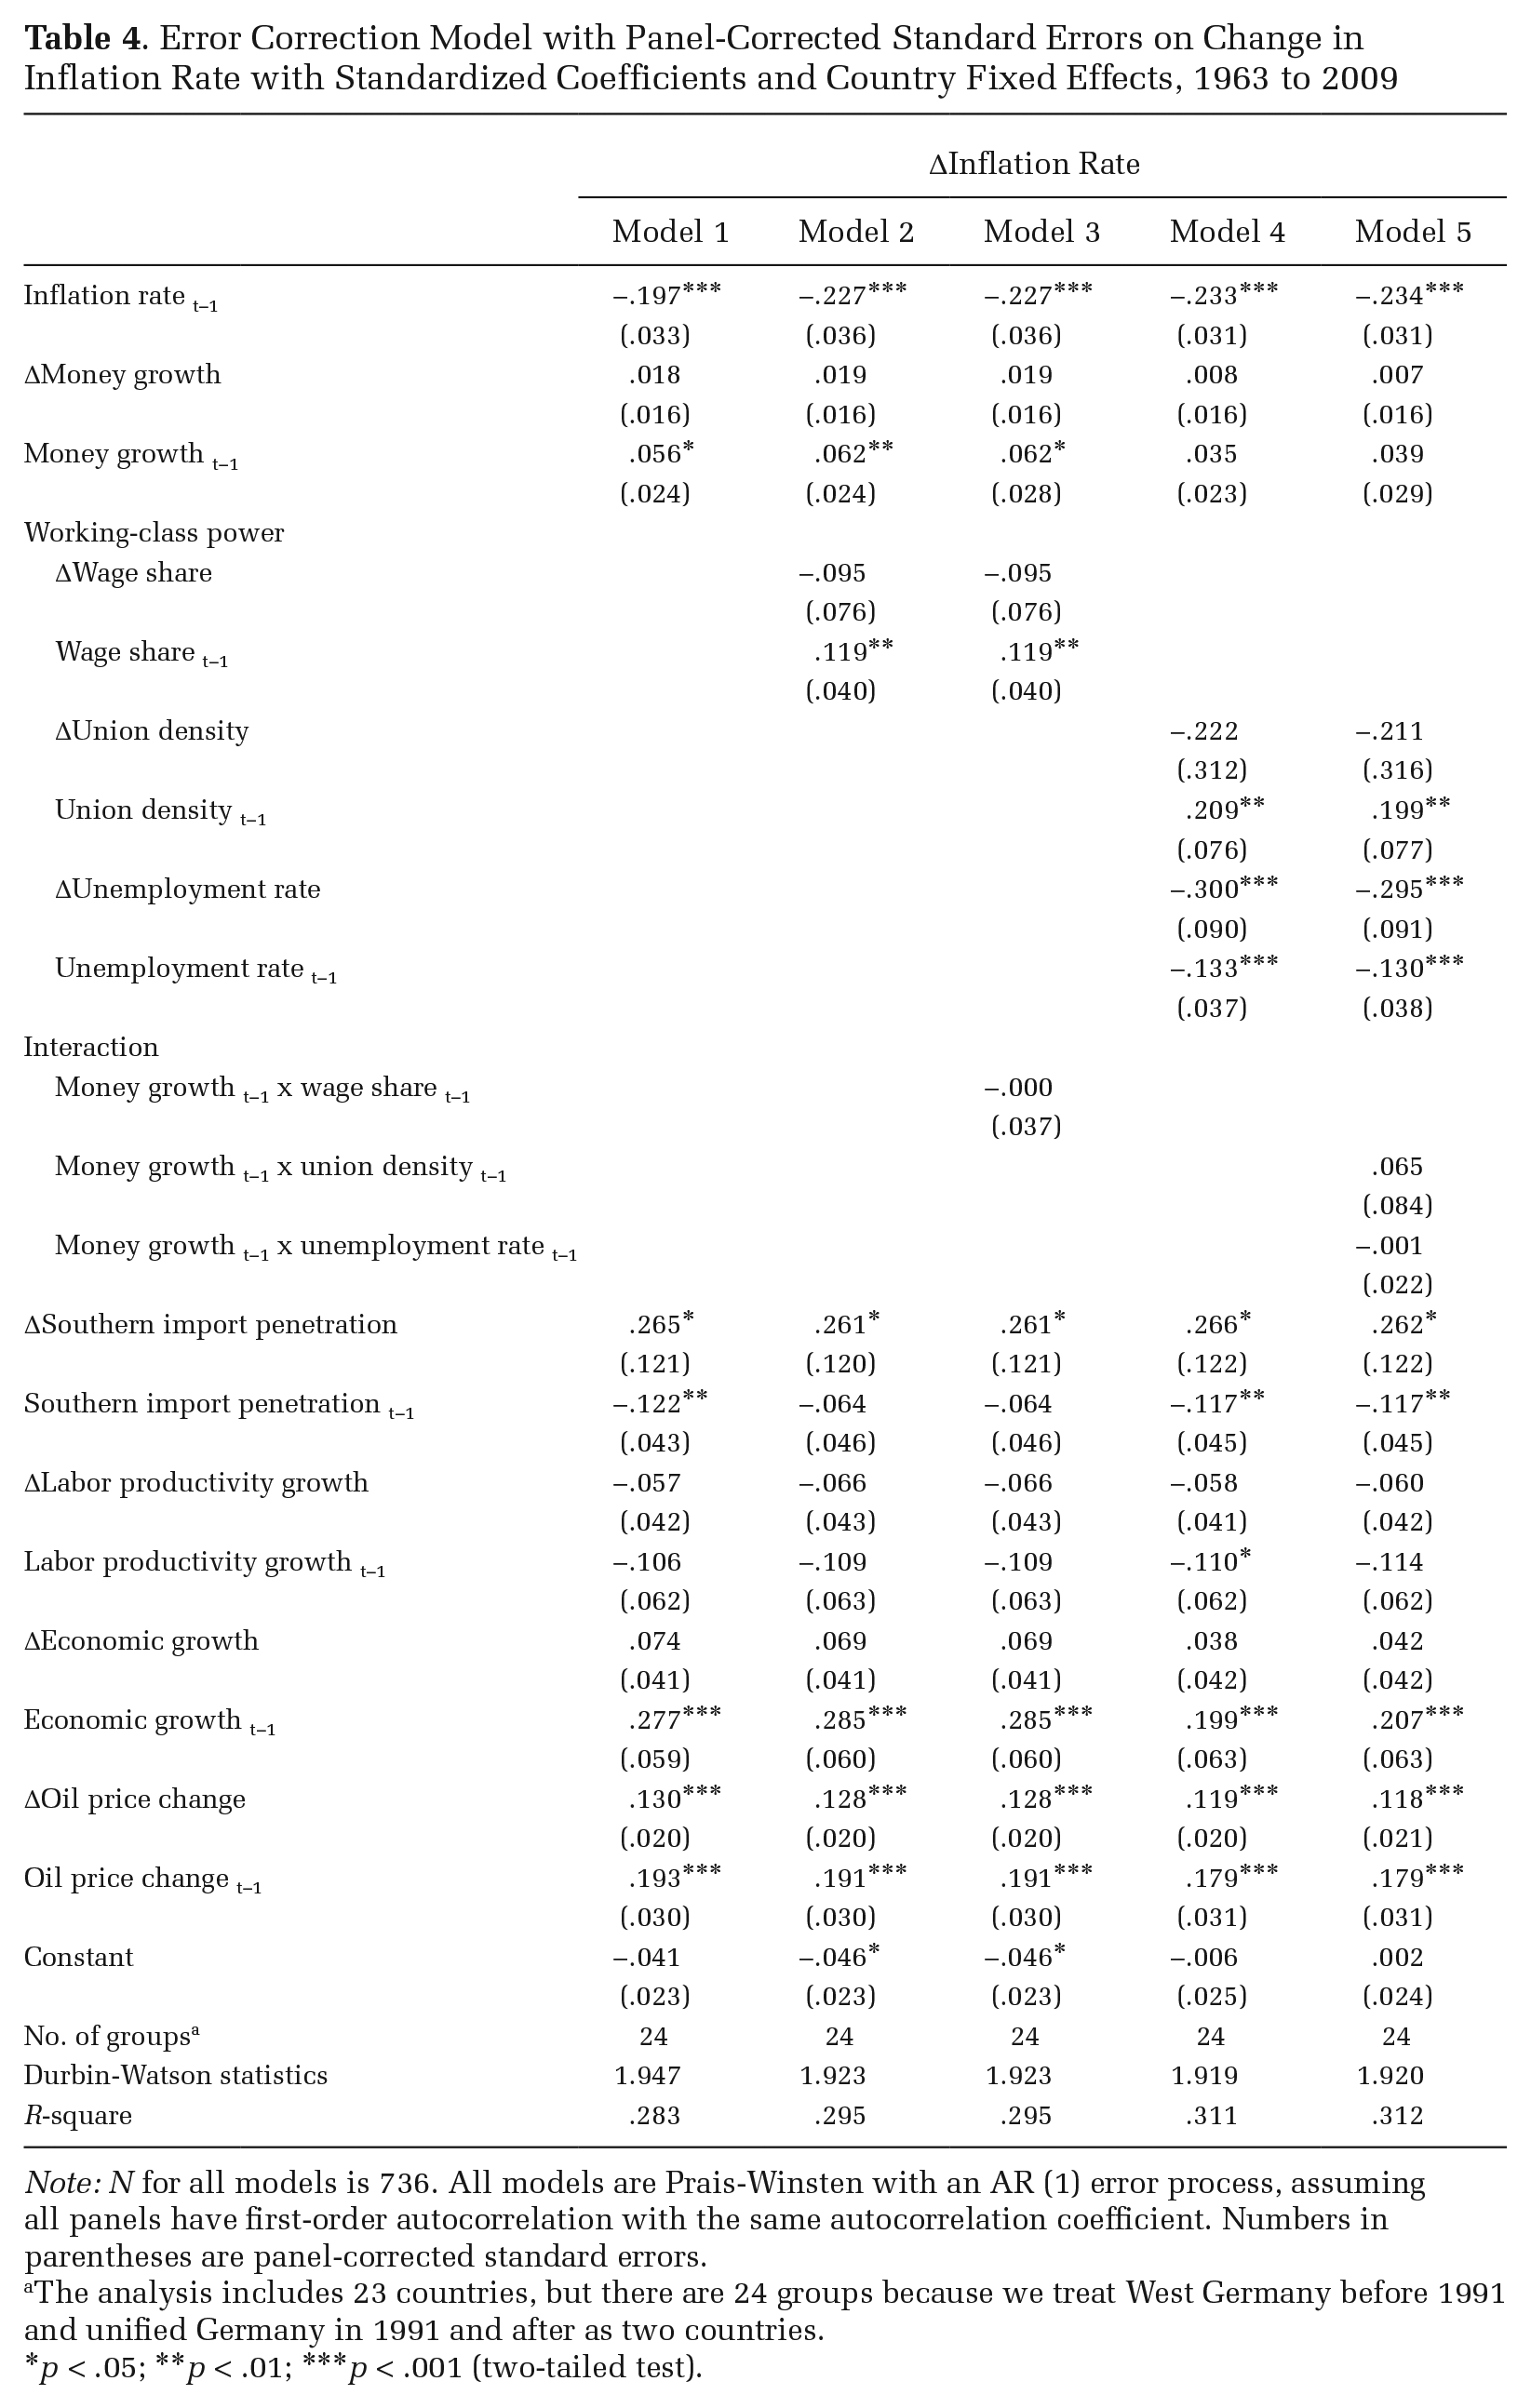
Note: N for all models is 736. All models are Prais-Winsten with an AR (1) error process, assuming all panels have first-order autocorrelation with the same autocorrelation coefficient. Numbers in parentheses are panel-corrected standard errors.
The analysis includes 23 countries, but there are 24 groups because we treat West Germany before 1991 and unified Germany in 1991 and after as two countries.
p < .05; **p < .01; ***p < .001 (two-tailed test).
Based on Model 3 (for wage share) and Model 5 (for union density and the unemployment rate), we can derive the time-distributed impact of each explanatory variable on the dependent variable, as shown in Equation 2. Figure 3 displays impact-response graphs for each major explanatory variable, showing how the dependent variable responds to a one standard deviation change in the independent variable over time. The graphs illustrate the fact that, over the long-term, the working-class power variables have a much larger impact on inflation in comparison to money growth. A one standard deviation change in wage share, union density, and unemployment rate will bring about a .5, .8, and –.8 standard deviation change in the new equilibrium inflation rate. A one standard deviation change in money supply growth, on the other hand, produces only about a .25 standard deviation change in inflation. This estimate is calculated from the specification using wage share as the measurement of working-class power. Change in money growth has a null effect on inflation in the models using union density and the unemployment rate as a measure of working-class power. In summary, all the analyses point to the same conclusion: working-class power is a much stronger determinant of the inflation rate than money growth.
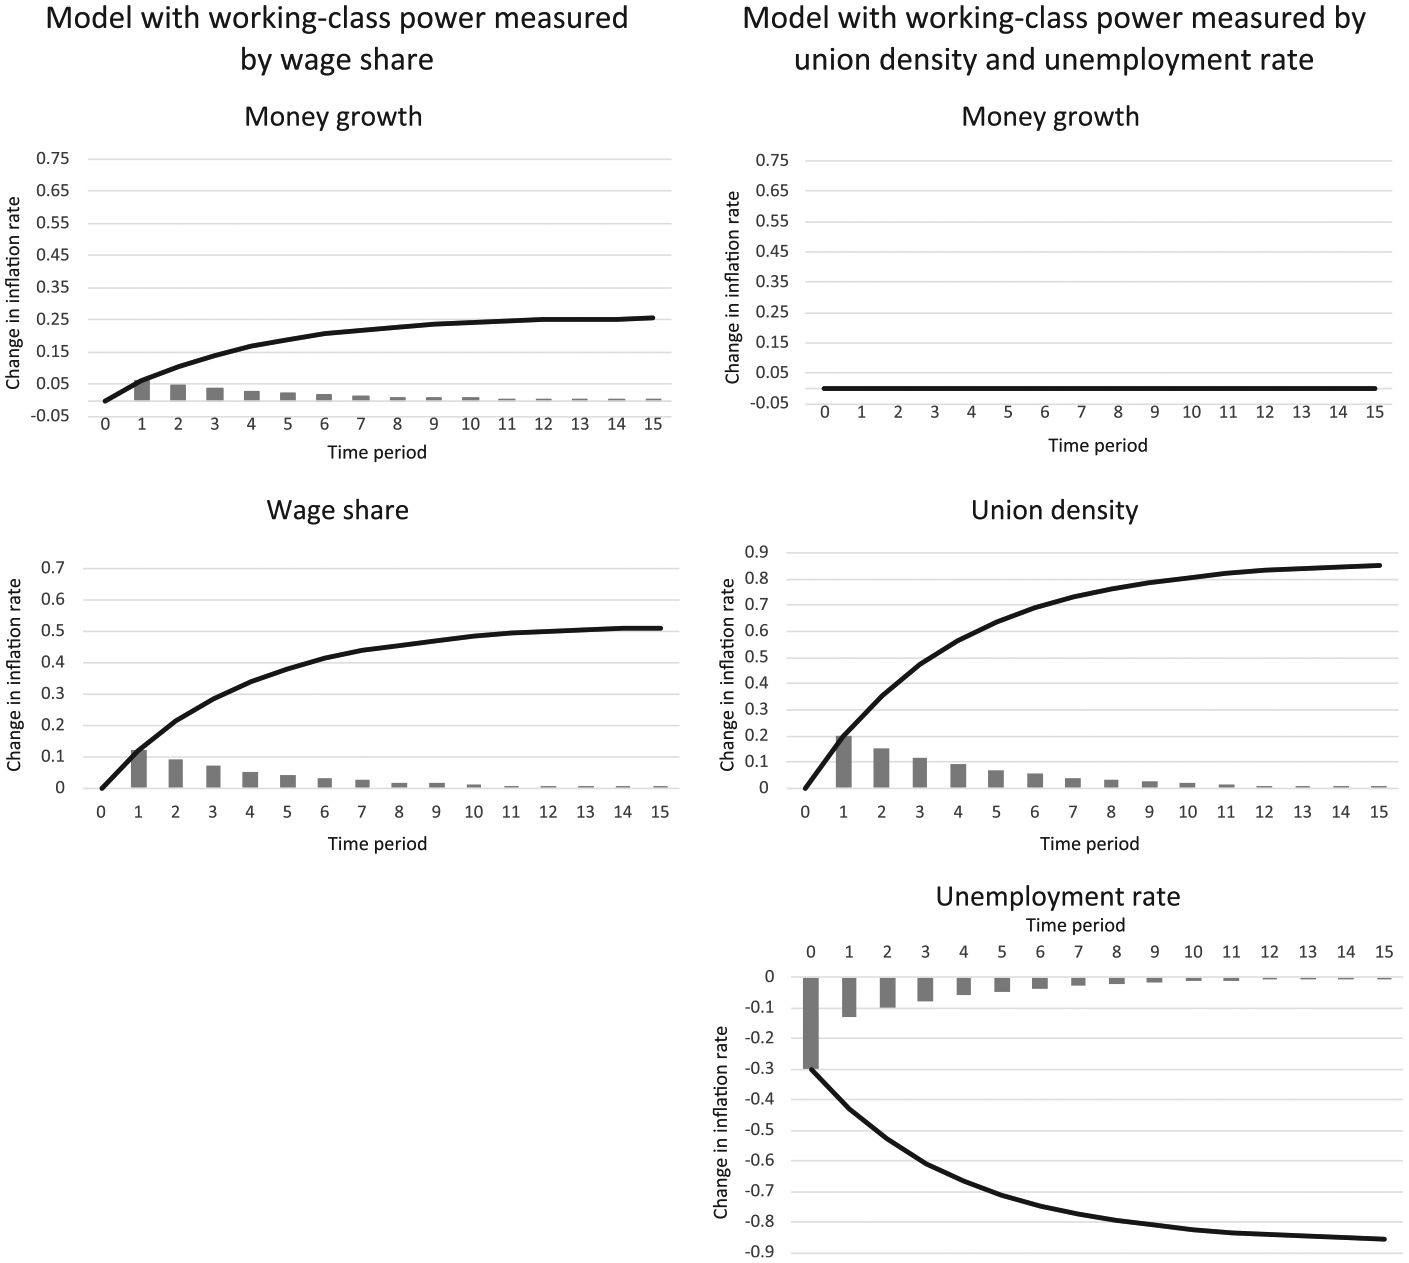
Lag Distribution of Effect of a One Standard Deviation Increase in Key Explanatory Variables on the Inflation Rate Measured in Change in Standard Deviation (solid curve representing cumulative effect)
Discussion
The results of our analysis using data for 23 OECD countries from 1960 to 2009 demonstrate that workers’ power has a larger effect on the inflation rate than money growth. This contradicts the claims of monetarist orthodoxy and validates the theory that the high inflation of the 1970s was precipitated mainly by an increasingly powerful working class under the Keynesian social compact. Likewise, the disempowerment of organized labor under neoliberalism has been the main source of low inflation from the 1980s onward. This disempowerment was caused by such measures as deregulation of the capital–labor relation and sustained attacks on organized labor. Another component of neoliberal policies, the tightening of the money supply via austerity and central bank discipline, made a much smaller contribution to taming inflation. The continuous low inflation during the second period of neoliberalism beginning in the late 1990s, when labor was still disempowered and growth in the money supply and fiscal deficits surged, is not so puzzling in light of the class power theory. 11
This is not to say that the great fiscal and monetary squeeze of the 1980s were irrelevant in ending inflation. Besides exerting a relatively weak direct effect on inflation, these contractions likely facilitated, albeit indirectly, the disciplining of labor in the long run because they pushed up unemployment. The harsh economic environment led many surviving enterprises to shift to a “flexible accumulation strategy” by streamlining their workforces, reducing wages and benefits, and moving to subcontracting (Harvey 1991). In the 1970s, both the OECD economists and U.S. Federal Reserve attributed high inflation to strong organized labor. They recommended monetary contraction as a means to clamp down on labor’s demands. To many heterodox economists, the great monetary tightening in the early 1980s was nothing but part of a war against workers waged by financial capital, which exercised covert power over apparently independent central banks (Epstein 1992; Epstein and Schor 1990; Wolfson 2014). Yet this view has long been marginalized by the monetarist orthodoxy, which portrays the causal relationship between monetary contraction and the end of inflation as a direct, strong, and nonpolitical one.
The political sociology of neoliberalism maintains that neoliberal policies like welfare state retrenchment, tax cuts, and financial deregulation originate from redistributive struggles that reinvigorate capital’s power over the working class. We show here that the neoliberal imperative of fighting inflation is about reviving capital’s power, too. Inflation in the 1970s, devastating as it was, took place in a context of rising wages and devaluation of debt. This macroeconomic environment brought down capital incomes and asset values in real terms. The inflationary crisis in the 1970s was a crisis of capital more than a crisis of labor. With strong working-class power no longer present, growth in wages in the United States and Europe lagged far behind economic expansion in the 1980s and 1990s, thus checking inflation. Monetary and fiscal expansion grew at an even faster pace after the 1990s under low inflation conditions, while the politically weakened working class could no longer translate the new liquidity into jobs and wage increases. Instead, much of the increased money flowed to the wealthy, who invested this new liquidity in the financial and real estate sectors, creating massive asset bubbles.
The neoliberal onslaught on labor in the 1980s ended high inflation but fomented a rapid increase in income inequality and concentration of wealth. Besides its social and political costs, the growing inequality dampened effective demand, fostering a structural imbalance of the economy. Capital accumulation and investment soared, but stagnant wage growth could not generate sufficient consumption to keep up with investment. Consequently, debt took the place of wage income as a main source of consumption capacity. This created a debt bubble that eventually imploded in 2008 (Duncan 2005; Krugman 2009; Pettis 2013; Rajan 2010). The capitalist crisis in the 1970s was driven by strong working-class power that fomented an inflationary spiral, but the capitalist crisis after 2008 can be traced to weak working-class power and underconsumption (see Silver 2013).
Because working-class power remains weak, the aggressive increase in the money supply across advanced capitalist countries in recent years is not likely to bring high inflation. In fact, some economists worry about insufficient inflation or even deflation more than anything else (e.g., Krugman 2010a). Deflation could forestall investment and lead to a downward spiral and depression. The growth in the money supply could create a new and bigger financial bubble, heading toward another meltdown. To redress the current crisis and fundamentally rebalance the economy, re-empowerment of the working class vis-à-vis capital is necessary. Elevating wages is an effective way to lift up income-driven consumption that brings investment and consumption back into balance. Because the capital–labor balance of power is tilted far toward capital, and inflation rates are persistently below the target rates optimal for economic growth and deflation prevention, there is much room for labor-empowerment and implementation of wage-boosting policies before excessive inflation becomes a concern.
If we do worry about inflationary pressure in the long run, we can look for a Goldilocks solution to the current capitalist crisis that forestalls both a wage-driven stagflationary crisis and an underconsumption-driven financial and debt crisis. One possibility is to supplement policies that empower the working class with increasing investment in research and development and education to boost labor productivity. Strong labor productivity growth could offset the inflationary pressure created by rising wages, just as it did in the 1950s and 1960s when advanced capitalist countries enjoyed a long boom characterized by high productivity growth, increasing wages, and low inflation (Brenner 2003). What specific policies are needed for reproducing this scenario is beyond the scope of this article.
Footnotes
Acknowledgements
We thank Brian Van Arkadie, Ryan Calder, Stephen Morgan, Beverly Silver, Raymond Wong, and the editors and anonymous reviewers of ASR for their comments on various versions of the article. They are not responsible for any mistakes herein.
Notes
References
Supplementary Material
Please find the following supplemental material available below.
For Open Access articles published under a Creative Commons License, all supplemental material carries the same license as the article it is associated with.
For non-Open Access articles published, all supplemental material carries a non-exclusive license, and permission requests for re-use of supplemental material or any part of supplemental material shall be sent directly to the copyright owner as specified in the copyright notice associated with the article.