
Abstract
Technological advances and the big-data revolution have facilitated fine-grained, high-frequency, low-cost measurement of individuals’ work. Yet we understand little about the influences of such quantification of work on workers’ behavior and performance. This article investigates how and when quantification of work affects worker productivity. We argue that quantification affects worker productivity via auto-gamification, or workers’ inadvertent transformation of work into an independent, individual-level game. We further argue that quantification is likely to raise productivity in a context of simple work, where auto-gamification is motivating because quantified metrics adequately measure the work being performed. When work is complex, by contrast, quantification reduces productivity because quantified metrics cannot adequately measure the multifaceted work being performed, causing auto-gamification to be demotivating. To substantiate our argument, we study implementation of an RFID measurement technology that quantifies individual workers’ output in real time at a garment factory in India. Qualitative evidence uncovers the auto-gamification mechanism and three conditions that enable it; a natural experiment tests the consequences of quantification of work for worker productivity. This article contributes to the study of quantification, work games, technology, and organizations, and we explore the policy implications of further quantification of work.
New technologies and the big-data revolution have enabled fine-grained measurement of individual work performance (see, e.g., Anteby and Chan 2018; Bernstein and Li 2017; Kellogg, Valentine, and Christin 2020). These technological developments facilitate high-frequency measurement of output that was previously hard to measure; they also reduce the cost of fine-grained measurement, prompting employers to measure all kinds of work (Bernstein 2017). Scholars of work have documented how jobs that once enjoyed considerable autonomy are increasingly shaped, and even defined, by intensive quantification. For instance, trucking companies now use GPS and onboard computers to track not only routes and ride-completion times but also driving speed and break patterns (Gray and Silbey 2014). Similarly, IT programmers’ code is now being measured via keystroke logging (Batt 2015). Such performance measurement can be accompanied by monitoring and surveillance (see, e.g., Patil and Bernstein 2018), but this article focuses purely on the phenomenon of measuring work using numbers and metrics, which we call quantification of work.
Modern societies have seen a proliferation of measurements, rankings, and benchmarks adopted to promote efficiency, transparency, and accountability (Berman and Hirschman 2018; Espeland and Stevens 1998). The burgeoning sociological literature on quantification, defined as the “production and communication of numbers” (Espeland and Stevens 2008:402), notes that numbers wield influence as sources of truth and rationality (Mazmanian and Beckman 2018). This literature has demonstrated that quantified metrics are transforming fields ranging from education (Chu 2019; Sauder and Espeland 2009; Sharkey and Bromley 2015) to nonprofits (Hwang and Powell 2009), the credit market (Fourcade and Healy 2017; Kiviat 2019a, 2019b), criminal justice (Brayne 2017), and everyday life (Lupton 2016).
Scholars of quantification point out that the measurement of human activity has the potential to alter the trajectories of individuals, organizations, and entire fields of endeavor (Espeland and Sauder 2016). Three primary mechanisms have been proposed to explain why individuals, in particular, may change their behavior in response to quantification. First, quantification might prompt people to strategically maximize measured aspects of performance at the expense of unmeasured aspects for financial or reputational gain (Sauder and Espeland 2009). Second, quantified data are amenable to knowledge creation via computational analysis, which organizations could use to direct employees’ behavior (Brayne 2017). Finally, quantification could give rise to new regimes of control that lead individuals to modify their behavior in response to disciplinary action or the threat of discipline (Levy 2015).
Whatever the mechanism, scholars argue that quantification tends to elicit similar reactive practices from individuals because it is essentially a vehicle of commensuration, or evaluation of different persons, processes, locations, and artifacts with a common metric (Espeland and Sauder 2007). By deliberately stripping away context and social relationships to render different events similar, new regimes of measurement provoke individual responses that converge across institutions that use the same metrics (Berman and Hirschman 2018; Espeland 1993; Kiviat 2019a). Thus, most sociological studies emphasize the connection between quantification and standardized reactions (for an exception, see Christin 2018).
This article studies a case of workplace quantification and investigates how it affects productivity within a homogenous group of workers. Although none of the three recognized mechanisms—incentives, knowledge creation, and discipline—is at play in this case, quantification raised some workers’ productivity and reduced that of others. This pattern poses a challenge to the literature, which is silent on whether mere quantification of work will produce a response, and, if so, what response, in the absence of the three aforementioned mechanisms, and which has further predicted convergence in individual responses. Motivated by this puzzle, our key research question is: how and when does quantification of work affect worker productivity? This question responds to calls noting that “investigations of measurement can be advanced by further specifying the mechanisms and effects of reactivity” (Espeland and Sauder 2007:34).
Building on the literature on work games (Burawoy 1979; Sallaz 2013), we argue that quantification can affect worker performance via “auto-gamification,” which we define as workers’ inadvertent transformation of work into an independent, individual-level game. 1 We argue that, when numbers introduced by quantification provide (1) a clear personal objective, (2) the means to compete with oneself, and (3) private real-time feedback, workers slip into an addictive, solitary game of “binge working.” We further build on scholarship on technology and organizations (Barley 1986; Orlikowski 1992) to argue that quantification raises productivity in contexts of simple work, where auto-gamification is motivating because quantified metrics adequately measure the work being performed, but reduces productivity when work is complex and thus inadequately measured by quantified metrics, causing auto-gamification to be demotivating.
To develop this argument, we study the pilot implementation of a radio-frequency identification (RFID) technology that transformed previously unquantified individual output into real-time quantified metrics at a large garment-manufacturing factory in India. Specifically, we investigate how quantification affected the productivity of a group of similar assembly-line workers quasi-randomly assigned to tasks of varying complexity. The RFID technology was implemented in late 2012 on three of twelve production lines; in each production line, workers performed a specific task or operation. The treated lines were chosen for a reason unrelated to productivity. Work-in-process garments were tagged with RFID tags; workers were instructed to scan a garment’s tag on the scanner newly installed at their workstations prior to working on it, thus enabling quantification of individual productivity in real time, visible to management and to the worker. As a pilot program, the quantification of work was not linked, nor perceived by workers to be linked, to rewards or punishments, nor were any analytics performed on the resulting data.
Our research process adheres to the full-cycle research model (Fine and Elsbach 2000), as does the organization of this article. First, we conducted one year of ethnographic fieldwork, which revealed evidence of the mechanism of auto-gamification and generated two hypotheses specifying how quantification affects productivity of simple and complex work, respectively. Next, to test the two hypotheses emerging from fieldwork, we collected six years of daily line-level productivity data before and after introduction of RFID measurement to jacket and pant lines, as well as daily operation-level productivity data for a sample of days before and after introduction of RFID measurement to pant lines. Access to such pre- and post-intervention data on treated and nontreated groups is an asset. We further exploited variation in the complexity of the pant and jacket lines—production of pants is less complex than that of jackets—and of different operations within pant lines (to address possible objections that pant and jacket lines could differ on dimensions other than complexity). A key advantage of our setting is the opportunity to exploit minute differences in work complexity, rather than comparing vastly different kinds of work.
Our study makes three contributions to the literature on quantification. First, we show that quantification in itself—independent of any of the mechanisms emphasized in the prior literature—can affect worker behavior and productivity. Second, we uncover a new mechanism, auto-gamification, through which quantification affects worker behavior, and for which we also identify three enabling conditions. And third, we show that quantification of work does not always elicit convergent reactions; it can produce divergent responses depending on work complexity. Our study also contributes to the literature on work games: we find that, in contrast to the social games described in the literature, quantification can give rise to spontaneous solitary games workers play independently of one another and of management. We further contribute to the literature on technology and organizations by showing that, beyond the organizational context, technologically mediated quantification interacts with workers’ task environments to affect motivation and productivity. We conclude by highlighting the implications of quantification for the organization of work and for workers’ experiences of labor control.
Quantification of Work: Mechanisms and Consequences
Sociologists have drawn attention to the rise of quantification and the significance of new regimes of measurement (Berman and Hirschman 2018; Espeland and Stevens 2008). They posit that once numbers are gathered, they tend to acquire an aura of objectivity and travel easily across time and space (Christin 2018). Quantification has been studied in many contexts. Audits, standardized tests, scorecards, and a wide array of ranking regimes are all cases of quantification designed to evaluate individuals and organizations and to make them more accountable (Sauder 2008; Sharkey and Bromley 2015). College rankings, in particular, have attracted significant academic attention (for a review, see Espeland and Sauder 2016).
The workplace domain, too, is experiencing a trend toward quantification, which is often initiated by people in positions of authority. 2 Management scholars have noted that tools for budgeting, forecasting, and strategic planning can function as rituals of quantification within organizations (Mazmanian and Beckman 2018; Miller and Power 2013). Less attention has been paid, however, to quantification of individual workers’ output or to how workers react to quantification of their work. (For a notable exception, see Christin’s [2018] investigation of quantification in the field of journalism, in the form of “clicks” on online articles.)
Historicizing the Quantification of Work
This article examines quantification of work in a garment factory. One might wonder: when has factory work not been quantified? Adam Smith famously quantified rising productivity at a pin factory; Marx argued that capitalism begets the quantification and commodification of goods; and Taylor’s “scientific management” called for quantification of industrial processes as a means of optimization. In practice, organizations have long measured worker output to implement piece-rate incentives (Zelizer 1996), monitor workers (Hubbard 2000), and provide performance feedback (Bernstein 2012). Today, however, technological advances and the big-data revolution are facilitating high-frequency, fine-grained measurement of individual workers’ performance (Bernstein 2017). This new intensified wave of quantification, far more extreme than factory workers have previously experienced, replaces aggregate, manual counts of work units with automated, real-time, individualized measurement of output. 3
Despite the increasing prevalence of digital quantification, existing scholarship has focused less on the pure influence of quantification or measurement of work, stripped away from the add-on treatments of monitoring or rewards. Because we still lack insight into “how such [quantification] processes operate in practice” (Mazmanian and Beckman 2018:377), recent work has called for further study of, for example, how “professional norms, work practices, and organizational dynamics shape the impact of digital technologies” (Christin 2018:1411). In response to these calls, this article asks: how and when does quantification of work affect workers’ productivity?
How Quantification Affects Worker Performance
Scholars of quantification have theorized that people change their behavior in response to being evaluated, observed, and measured, and they have explored why such “reactivity” occurs (Espeland and Sauder 2007). The literature on quantification has proposed three mechanisms by which quantification could influence individual behavior.
First, quantification might change incentives or create new incentives that elicit strategic behavior (Sauder and Espeland 2009). Such incentives could be financial, reputational, or even identity-based (Anteby 2008). For example, Espeland and Sauder (2007) document that, once quantified college rankings were created, some deans were explicitly tasked with achieving higher rankings. In an effort to improve their schools’ rankings, these deans made changes in how revenue was allocated, how scholarships were awarded, and how graduates found jobs (Espeland and Sauder 2007). Some even made cynical efforts to manipulate ranking data, such as by misrepresenting graduates’ employment rates (Sauder and Espeland 2009). 4
Quantification could also change behavior via knowledge created from newly available data (Pentland 2014). Various organizations have hired data scientists to perform computational analyses of digital datasets consisting of high-frequency quantitative observations (Pachidi et al. 2016). Big data is fast becoming a tool not just to analyze patterns but also to predict the likelihood of a given event (Brayne 2017; George, Haas, and Pentland 2014). This tool creates new knowledge enabling organizations to make real-time decisions about business operations (McAfee et al. 2012); workers could be expected to change their behavior in response to new patterns detected or predictions generated.
Finally, discipline could drive reactive practices in the wake of quantification (Christin 2018). Quantification has long been seen as a tool for control (Foucault 1977; Porter 1995); it expands the comparability of social phenomena in ways that promote strict discipline (Espeland and Stevens 2008). Studies have shown that performance measurement can be mobilized as a panoptic technology of surveillance: individuals may not know who is tracking their performance at a given moment, or why, but may try to perform well nonetheless (Anteby and Chan 2018; Levy 2015; Sewell 1998). Sometimes administrators monitor quantified performance and discipline poor performers, prompting such individuals to modify their behavior; explicit disciplinary pressures can also devolve into self-management (Covaleski et al. 1998).
All three mechanisms—incentives, knowledge creation, and discipline—help explain how quantification shapes individual behavior, but none operates in our setting. At the garment factory, quantification was not accompanied by any real or perceived financial or reputational incentives. Nor did management hire data scientists or task anyone with performing big-data analytics. Furthermore, front-line supervisors did not monitor the data or use it to discipline workers. Even so, mere quantification seems to have affected worker productivity. To understand this phenomenon, we turn to the sociological literature on work games.
Work games
Sociological research has long documented games played in the workplace. Early scholars documented shop-floor workers playing poker at work or stealing and hiding each other’s “bananas” (De Man 1928 [1985]; Roethlisberger and Dickson 1943; Roy 1952). Roy (1959:158) explains game playing as a means of relieving the “beast of monotony” that would otherwise make any worker “go nuts.” Burawoy (1979) documents more sophisticated shop-floor games, including a near-universal game in which workers compete to “make out” by surpassing production quotas. Burawoy (1979) argues that managers support and even encourage such games because they promote “consent” to the work itself. Work games also prevail beyond the factory floor, cropping up in groups as varied as hotel workers (Sherman 2007), lawyers (Pierce 1996), “girls” employed on the VIP party circuit (Mears 2015), truckers (Ouellet 1994), casino operators (Sallaz 2009), engineers (Sharone 2004), and job-seekers (Sharone 2007). 5
Across these contexts, work games have been characterized as social in nature; some scholars even use the terms work games and social games interchangeably (see Sharone 2013). For example, Sherman (2007:111–12) argues that “games take place in a collective context” and games depend on “relations with other workers.” Burawoy (1979:63) observes that, on the factory floor, “every social interaction not occasioned by the structure of work is dominated by and couched in the idiom of making out,” such that workplace culture revolves around the work game. Similarly, Sallaz (2002:410) describes how, for casino workers, “break-room conversations” and “after-work gripe sessions” both revolve around the game of “making tips.” Some games become so central to workplace culture that they pervade status hierarchies: workers who perform well at the game earn status (Sallaz 2013).
Three aspects of work games seem to render them social. First, workers typically agree collectively on the objectives and rules of the game, although management sometimes participates in its organization and in enforcement of its rules (Burawoy 1979; Sallaz 2009). Second, games engender competition between workers, and sometimes with oneself; workers are thus diverted from hierarchical conflict with management toward lateral conflict with each other through game play (Burawoy 1979; Sherman 2007). Third, social interactions with peers and managers offer workers intermittent feedback on how they are performing at the game (Sallaz 2013). Burawoy (1979:63) quoted a worker who reported that, when “someone comes over to talk, his first question is, ‘Are you making out?’ followed by ‘What’s the rate?’”
To date, however, the literature on work games has not explored games engendered by quantification of work. The nature of contemporary quantification suggests a different sort of work game could be at hand. Quantification has become so intensely individualized that we might expect less group-centric games to emerge. In fact, several unrelated studies speak to the relationship between technological objects, such as measurement systems, and individuals’ sensations of “flow” and solitary aesthetic experiences (Gregg 2016; Knorr Cetina 1997; Knorr Cetina and Bruegger 2000; Rennstam 2012; Schüll 2014; Siciliano 2016; Snyder 2016). For example, Gregg (2018) describes how productivity software in the era of big data can generate an immersive “aesthetics of activity.”
The “auto-gamification” that we observed during fieldwork affirms these ideas and is characterized by a solitary immersive experience in response to quantification. As we will show, using qualitative data, quantification of work can facilitate solitary “auto-games” by offering (1) a personal numerical objective, (2) an avenue for competing with oneself, and (3) private real-time feedback. Work games have previously been understood as social phenomena, often co-opted by management, but this case challenges that understanding. We posit that auto-gamification might help explain how quantification affects worker behavior in the absence of incentives, knowledge creation, or discipline.
Variation in the Consequences of Quantification
This article also investigates quantification’s effects on productivity. The literature tends to emphasize that quantification evokes uniform reactions from individuals because it inherently entails commensuration: that is, it transforms qualities into quantities that share a metric, erases alternative definitions of “what counts,” and imposes a universal definition of “high quality” that is salient to individuals (Espeland and Stevens 1998; Fourcade 2011). For example, Espeland (1993) describes how quantification of credit scores commensurates different lived experiences of debt and default, erasing distinctions between delinquencies that professionals consider legitimate and those they view as unacceptable. Through this “stripping away of context,” different professionals evaluating a set of credit reports arrive at very similar conclusions (Kiviat 2019a). The only circumstance in which quantification has been shown to produce divergent responses is in different national contexts, where interpretations of metrics differ (Christin 2018).
This article, however, presents a case of workers in a single cultural context reacting differently to the quantification of their work. To understand this phenomenon, we next turn to scholarship in organization studies on how workers respond to new technologies, as a key aspect of quantification in our setting is that it was mediated by technology.
Technology and organizations
A large body of research has investigated the implications—relational, structural, and institutional—of the introduction of new technologies into workplaces (see, e.g., Barley 1986; Orlikowski 1992; Zuboff 1988). This literature suggests technologies alter work through a complex interaction among informal social structure, bureaucratically defined roles, the actual design of the technology, and its “affordances” for desired actions (Leonardi 2011; Orlikowski 2007). Specifically, this research shows that workers often have varied responses to the imposition of new technologies: sometimes workers resist, and sometimes they embrace new technologies (Beane and Orlikowski 2015; Mazmanian, Orlikowski, and Yates 2013).
To explain diverse responses to new workplace technology, scholars point to the preponderant role of organizational context, whereby the meanings of technologies are “defined by the context of their use” (Barley 1986:105), thus influencing “humans in their interaction with technology” (Orlikowski 1992:410). Scholars have considered various aspects of organizational context, such as level of resources (Wynne 1988) and the state of labor relations (Anderson 1988). Barley (1986) found that, among radiologists and technicians at two different hospitals, initial organizational staffing decisions affected reactions to CT scanners and their use.
By contrast, we study workers within a single organization—that is, exposed to the same organizational context—reacting in varied ways to the quantification of their work. Our findings suggest that, to understand workers’ divergent responses to technology-mediated quantification, we need to zoom in further and explore intra-organizational processes. Indeed, early studies on technology and organizations, such as those conducted at London’s Tavistock Institute in the 1950s and early 1960s (e.g., Rice 1963), contained rich descriptions of work practices associated with different technologies, but similarly granular studies of intra-organizational dynamics have found less favor recently.
Our article addresses this gap. We pay attention to the task environment to understand workers’ responses to quantification of their work. In doing so, we find that a key question is whether technologically mediated metrics are a reasonable reflection of the tasks they measure. When metrics are accepted as valid and reasonable by those whose work they quantify, such measures can positively influence the activities being measured; otherwise, measures can render some aspects of life invisible or irrelevant. This article argues that, to understand the consequences of quantification of work, we need to pay attention to whether there is a close link between the metric and workers’ preexisting notions of performance.
In particular, we traced variation in workers’ responses to quantification to the relative complexity of work they performed. Complexity is an important characteristic of work (Hackman and Oldham 1976; Kohn and Schooler 1978), defined as the extent to which work is multifaceted and difficult to perform (Humphrey, Nahrgang, and Morgeson 2007). It is easier to devise acceptable quantified metrics for simple work than for complex work. Thus, we find that workers performing more and less complex jobs react differently to technologically mediated quantification of their work, experience differentially motivating “auto-games,” and their productivity changes differently as a result.
Setting: A Garment Manufacturing Factory in India
Our setting is a factory in India that manufactures men’s suits. The production process is a linear sequence of indivisible operations. The factory features 12 production lines, and 147 operations within those lines. During the study period, 2009 to 2014, the factory employed 1,647 line workers. Each line produces one type of product and consists of a set of operations: the 9 pant lines each consist of 51 pant operations; the 3 jacket lines each consist of 96 jacket operations. Two advantages of our setting are that the lines’ configurations did not change during the study period, and line and operational assignments were based on the factory’s operational needs rather than worker characteristics; thus, lines and operations are similar in terms of demographics and measures of skills. Workers perform only one operation, but the complexity of those operations varies widely.
In 2012, management introduced digital performance-measurement technology to a few lines on a trial basis, to measure workers’ production. The CEO had seen the technology in use at factories in China and was keen to implement it. Workers were told nothing in advance about the intervention; work-station RFID scanners were installed overnight, and the next day workers were taught to use them. Unfinished garments bore RFID tags, and workers were instructed to scan each garment’s tag before working on it; its progress could then be tracked along the production line. Scanners reported the number of units produced and calculated individual efficiency in real time as a percentage of a set target. Workers at this factory also had targets set for them prior to implementation of the RFID technology; neither these targets nor the efficiency calculations changed as a result of the RFID technology. Figure 1 shows an RFID terminal at the factory.
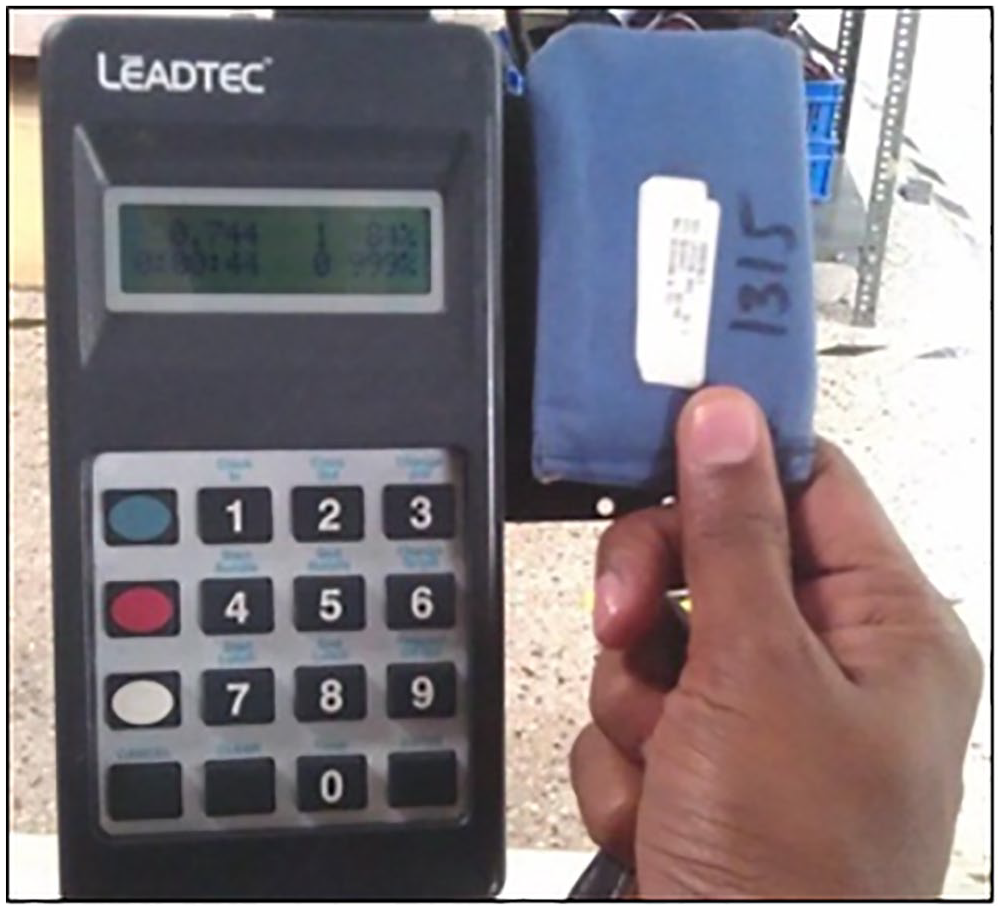
Technology-Enabled Quantification of Work: RFID Scanners Installed on Treated Lines
This intervention should thus be thought of as a quantification-of-work initiative that digitally measured individual workers’ productivity in real time in a way that was visible to both workers and management. Previously, line-level productivity could be measured at the end of a day by counting the number of pieces produced, but an individual’s performance was hard to measure. The intervention quantified a worker’s productivity at every moment of the day.
Interaction of RFID with Existing Workplace Systems
Despite the possibilities enabled by quantification, the quantified data were not used systematically. The intervention was a limited pilot rollout of the RFID technology; ultimately it was not expanded to the rest of the factory because of its cost.
Workers’ pay remained unchanged; they continued to be paid a fixed daily wage. 6 Interviews with workers suggest they did not perceive any performance incentives. The factory did not hire data scientists or task anyone with analyzing the data to identify patterns. Nor did immediate supervisors use the data to discipline workers. Supervisors were rotated across lines, and the new data were only available for treated lines. Supervisors also lacked ready access to the data; the RFID data were only accessible via a computer on a different floor. Inertia, too, discouraged abandoning or supplementing the traditional system of face-to-face supervision and discipline: supervisors had long exerted control by walking up and down the line (as they had a wide span of control), stopping randomly, shouting at workers if they encountered mistakes, and yelling orders like “do fast” to keep workers moving their pieces along. Post-treatment, this system of face-to-face supervision and discipline remained unchanged, as supervisors were set in their ways and accustomed to this style of management.
Post-treatment, workers’ pay raises, promotions, and terminations did not change. Workers at this factory did not undergo annual performance evaluations; pay increases were based largely on seniority. Managers and workers reported that promotions were rare because of the flat organizational structure typical of garment factories; terminations were rare because the labor market was competitive and the factory did not want to lose trained workers. Our data document only 10 promotions during the five-year study period, none involving the 1,647 line workers in our dataset. Lateral job changes were rare too. As for terminations, only once was a line worker explicitly terminated. The voluntary turnover rate, about 1 percent weekly, also remained unchanged after introduction of RFID. Neither before nor after quantification did we observe any supervisors informally threatening workers with termination to prompt them to quit. In summary, any influences that quantification of work wielded on productivity would have had to entail a mechanism other than incentives, knowledge creation, or discipline.
Full-Cycle Research Methods
To investigate how and under what circumstances quantification of work affects workers’ productivity, we adopted a full-cycle research design. This approach combines inductive and deductive methodologies, in a cyclical manner (Fine and Elsbach 2000; Ranganathan 2018). The logic is that initial qualitative data can richly describe real-world issues and can generate theory and hypotheses that grow directly out of informants’ immediate experiences; quantitative data can then identify generalizable relationships. Our ethnographic fieldwork and interviews at the garment factory generated our theorizing about the mechanism of auto-gamification and two hypotheses about how work complexity moderates the consequences of quantification. We then tested our two hypotheses using unique longitudinal productivity data.
Conditions Governing Access to the Field Site and Data
The first author approached the CEO via an industry association and met him at the corporate headquarters (not co-located with the factory) 7 to express interest in studying women’s employment in India’s growing garment-manufacturing industry; neither quantification nor the RFID technology was mentioned. She requested long-term access to the factory floor for fieldwork and access to personnel data. Once access was granted, she took several steps to ensure workers would not perceive the field team (consisting of herself and a research assistant) as management.
She requested that, like workers, the field team be issued badges that they would swipe every morning to enter the factory premises. The security personnel thus treated them like workers, and the workers saw them hurrying to the factory every morning before 9 a.m. On the days they did fieldwork, they adhered to the factory’s schedule, entering by 9 a.m. and leaving at 5:30 p.m. They ate their meals and took tea breaks alongside workers. At first they were unfamiliar faces, but they soon became familiar.
The field team spent most of their time with the workers on the non-air-conditioned factory floor. The workers viewed them as students working on a “class project”; they were routinely asked how their final report was coming along. The workers knew they were socio-demographically different, given their ability to converse in English as well as the local languages, but to the best of our knowledge, workers did not view the field team as aligned with management. Workers invited members of the team to their homes, which they would never have done if they thought the team was affiliated with management.
In general, we believe workers were forthright with us; our observations of the shop-floor culture corroborated workers’ assessments. They were eager for their stories to be told, and they seemed to open up to us because we inquired about their work and documented their successes as well as their frustrations. The fact that we had an all-female field team also helped us build rapport and trust with the predominantly female workforce. Management at the factory had offices in a separate air-conditioned building. 8 The interviews with management were conducted in private, either at the corporate headquarters or in the detached air-conditioned building, and were not apparent to workers.
Qualitative Methods
The first author and a research assistant performed ethnographic fieldwork from June 2014 until June 2015; they also conducted 41 interviews between January and June 2015, resulting in more than 200 single-spaced pages of fieldnotes and interview transcripts. Fieldwork consisted of documenting daily activities in the pants and jackets sections, and observing how workers were supervised on treated and nontreated lines. Each day of observation consisted of choosing a particular line, and a subsection of it, to focus on. This approach enabled the field team to home in on a small group—approximately 10 workers—for an entire day; they became thoroughly familiar with those workers’ operations and daily routines, their interactions with their supervisor, the pressures of meeting the day’s work demands, and their means of coping with those pressures. When observing workers on treated lines, the field team documented how these workers interacted with the RFID technology, and noted which aspects of the technology the workers appreciated and which they were frustrated by. The field team always carried conspicuous notebooks and let workers see them jotting notes.
The field team structured their time to be in the field approximately three days per week; 9 they spent the rest of the time typing fieldnotes, writing memos, and interpreting the emerging findings. Spending time away from the shop floor enabled them to pinpoint puzzling observations that would then guide their focus in the following week’s fieldwork. By the end of the fieldwork, they had observed all 12 lines and all workers engaged in tailoring operations.
The field team also conducted 40 semi-structured interviews: 26 with workers (W1 to W26), four with front-line supervisors (S1 to S4), four with industrial engineers 10 (IE1 to IE4), and six with factory executives (H1 to H6). See Appendix Table A1 for more detail about the interview sample. This sample captured diverse perspectives and enabled us to triangulate across varied viewpoints. The aim of the interviews was to understand how various stakeholders described, understood, and responded to the RFID performance-measurement technology. The interviews were conducted in Kannada, Tamil, or English and lasted, on average, one hour; each was digitally recorded. We analyzed this qualitative data inductively to develop our hypotheses (Glaser and Strauss 1967; Strauss and Corbin 1990). Analysis consisted of multiple readings of field and interview notes, composition of analytic memos, and tracking of patterned activities and issues over time.
Note that fieldwork and interviews were conducted after the quantification technology was installed on the treatment lines. It would have been ideal to observe implementation of the intervention, but collecting qualitative data 1.5 years later allowed us to capture workers’ “equilibrium” response to quantification of their work rather than immediate and possibly fleeting short-term reactions. Entry into the field 1.5 years post-treatment also avoided the disruptive effects that qualitative data collection itself may have on the outcomes we set out to study (Oh et al. 2019). Appendix Table A2 shows our quantitative results are robust to dropping data after June 2014, when we began fieldwork, further providing support that our fieldwork had minimal disruptive effects. Additional mitigating factors include the fact that we did not compensate workers and that our research team was small.
Qualitative Data and Hypothesis Development: Auto-Gamification and Work Complexity
RFID Measurement Technology: A Case of Quantification of Work
“Why implement RFID?” the head of the factory (H5) asked rhetorically, repeating the question we had posed to him. “It is important to understand how many pieces each worker is producing in the 480 minutes of each day. . . . Each minute lost is in turn equal to a piece not produced.” Our interviews with senior management suggested the tracking system had been introduced to quantify the output of individual workers. RFID “gives you worker-specific information and helps in tracking pieces,” added the head of HR (H1). Managers expressed faith in the power of numbers, and specifically in the RFID system, to enable “quantitative data collection” (H2). Executives asserted that quantified data “helped in approaching matters in a more systematic way” (H3) and allowed for “accurate numbers” (H2) [emphasis added].
Despite introducing an RFID system that enabled the collection of precise quantitative data, senior management chose not to link the system to financial incentives. According to the head of production, “Our setup here is a fixed-salary environment, where there is no piece-rate system” (H4). Senior management did, however, expect front-line supervisors to monitor the data on workers’ productivity and to discipline workers who performed poorly. The production head for pants explained: “Ideally, how the RFID should be used is the worker-productivity data should be monitored, analyzed, [and] problem workers should be identified and reprimanded” (H4). In reality, the RFID system was not associated with supervisory discipline. In response to our question, “Do supervisors look at the RFID data?” an industrial engineer said: “They should be using the data, but they don’t” (IE1). Remarkably, when we attempted to collect individual productivity data, we found it had never been downloaded to the server. 11 Because the RFID program was a pilot effort, senior executives were unmotivated to reprimand the supervisors, or to hire data scientists to perform big-data analytics on the newly available quantitative performance data.
Workers were aware the RFID system was not associated with incentives, analytics, or discipline. Interviews revealed they had no illusions the data were being monitored systematically or that it would be used to punish or reward them. “Unless someone actually monitors and acts on my data, I don’t have an incentive to be faster,” one worker said. “Currently, nobody seems to be actually doing this” (W19). Another worker said, “I do not remember supervisors ever coming, checking the machine and reacting to it” (W2). An HR manager corroborated these observations: “If there were incentives linked to [the RFID], and workers knew about that, maybe it [RFID] would be seen as a positive thing because their payment would be attached to it. But workers know there are no incentives” (H1).
It is striking that, despite its known lack of association with incentives, analytics, or discipline, RFID-enabled quantification affected workers’ productivity. “The system seemed to be giving production improvements on its own” (H2), the head of pants production observed. The head of production elaborated: “An ECG, by itself, will not cure a disease, but merely acts as a tool that helps in diagnosis; similarly, however good a car may be, a good driver is critical to use it. . . . I thought the RFID would be like an ECG or a car, but the RFID seems to be different. Even without the technical team using it, simply installing the RFID machines seemed to improve production” (H4). This puzzling observation set the stage for our analysis.
Auto-Gamification of the RFID Measurement Technology
We found that the very process of quantifying workers’ output lent itself to gamification. Workers could see their live production numbers and “current efficiency” on their RFID devices. This availability of RFID data seemed to inadvertently promote treating work as a game played individually and independently of management, a phenomenon we call auto-gamification. Workers described “slipping into a game without even realizing it” (W1), then getting “hooked to it” (W2) and “smashing [their] way” (W12) through tasks; we noticed they often talked about their production numbers with “delight on their faces” (fieldnotes). By gamifying work, they made time fly and “work became fun” (W2).
Our fieldwork identified three features of the RFID system that prompted workers to auto-gamify their work: (1) a clear personal objective, (2) competition with oneself, and (3) private real-time feedback. First, workers seemed to define, for themselves, a clear personal objective that signified a win. Many workers defined the objective of their game as “getting to 100 percent” (W10) in daily efficiency. Workers independently leaned toward 100 as the goal, perhaps because in India exams are scored on a scale of 100 and thus 100 struck them as a natural “winning score” (fieldnotes). One worker said, “I am waiting for a day when my current efficiency becomes 100 percent!” (W13). At the time, this worker’s efficiency was about 60 percent, in line with the factory average. Workers had previously been aware that high efficiency numbers were preferable but had not known where they stood; 100 had not been an objective to actively strive toward. Ironically, 100 percent efficiency was an unachievable target. “While we set a target of 100 percent, our expectation is only 80 percent” (IE1), an industrial engineer told us. The result was a game that was quite hard to win. 12
Second, workers competed with themselves. The RFID devices seemed to breed comparisons between a worker’s current and past performance. They also generated goals for future performance. “Today if I do 80 percent, then tomorrow I try for 81 percent,” one worker said. “In this way, each day is a competition!” (W8). According to our fieldnotes, one worker told us that “she usually manages to get her production numbers to around 230.” Later the same day, we observed that “her machine was displaying only 179 [and that] she worked with utmost focus trying to get her numbers up until the factory bell rang indicating that it was 5:30 p.m.” Another worker told us “that the last hour was [her] time to push the maximum number of pieces” and “outdo [her]self,” and that she “relished seeing the RFID machine at this time” (W10). Competing with others was less feasible: productivity numbers were not made public, and workers did not discuss their numbers with one another. 13
Third, workers received private real-time feedback from their RFID devices. Scanning a new RFID tag when turning from one piece to the next changed the numbers on their screens. (The numbers displayed on a particular worker’s screen were difficult to see from a distance.) One worker said that looking at “the RFID data real-time is like following cricket scores live.” He added that the “machine gives every possible detail about a worker . . . like their jathakam [horoscope]” (W22). Another worker reported that she glanced at her efficiency number each time she scanned a tag and she knew “that [she had] to start working faster when the efficiency number dropped” (W8). The real-time nature of the feedback created a sense of urgency, enhancing the game. The absence of external pressure, given the privacy of the feedback, meant the entire process was internally driven. The factory manager speculated that “most of the workers were not really educated, and so they found the interactive devices especially fascinating” (H5).
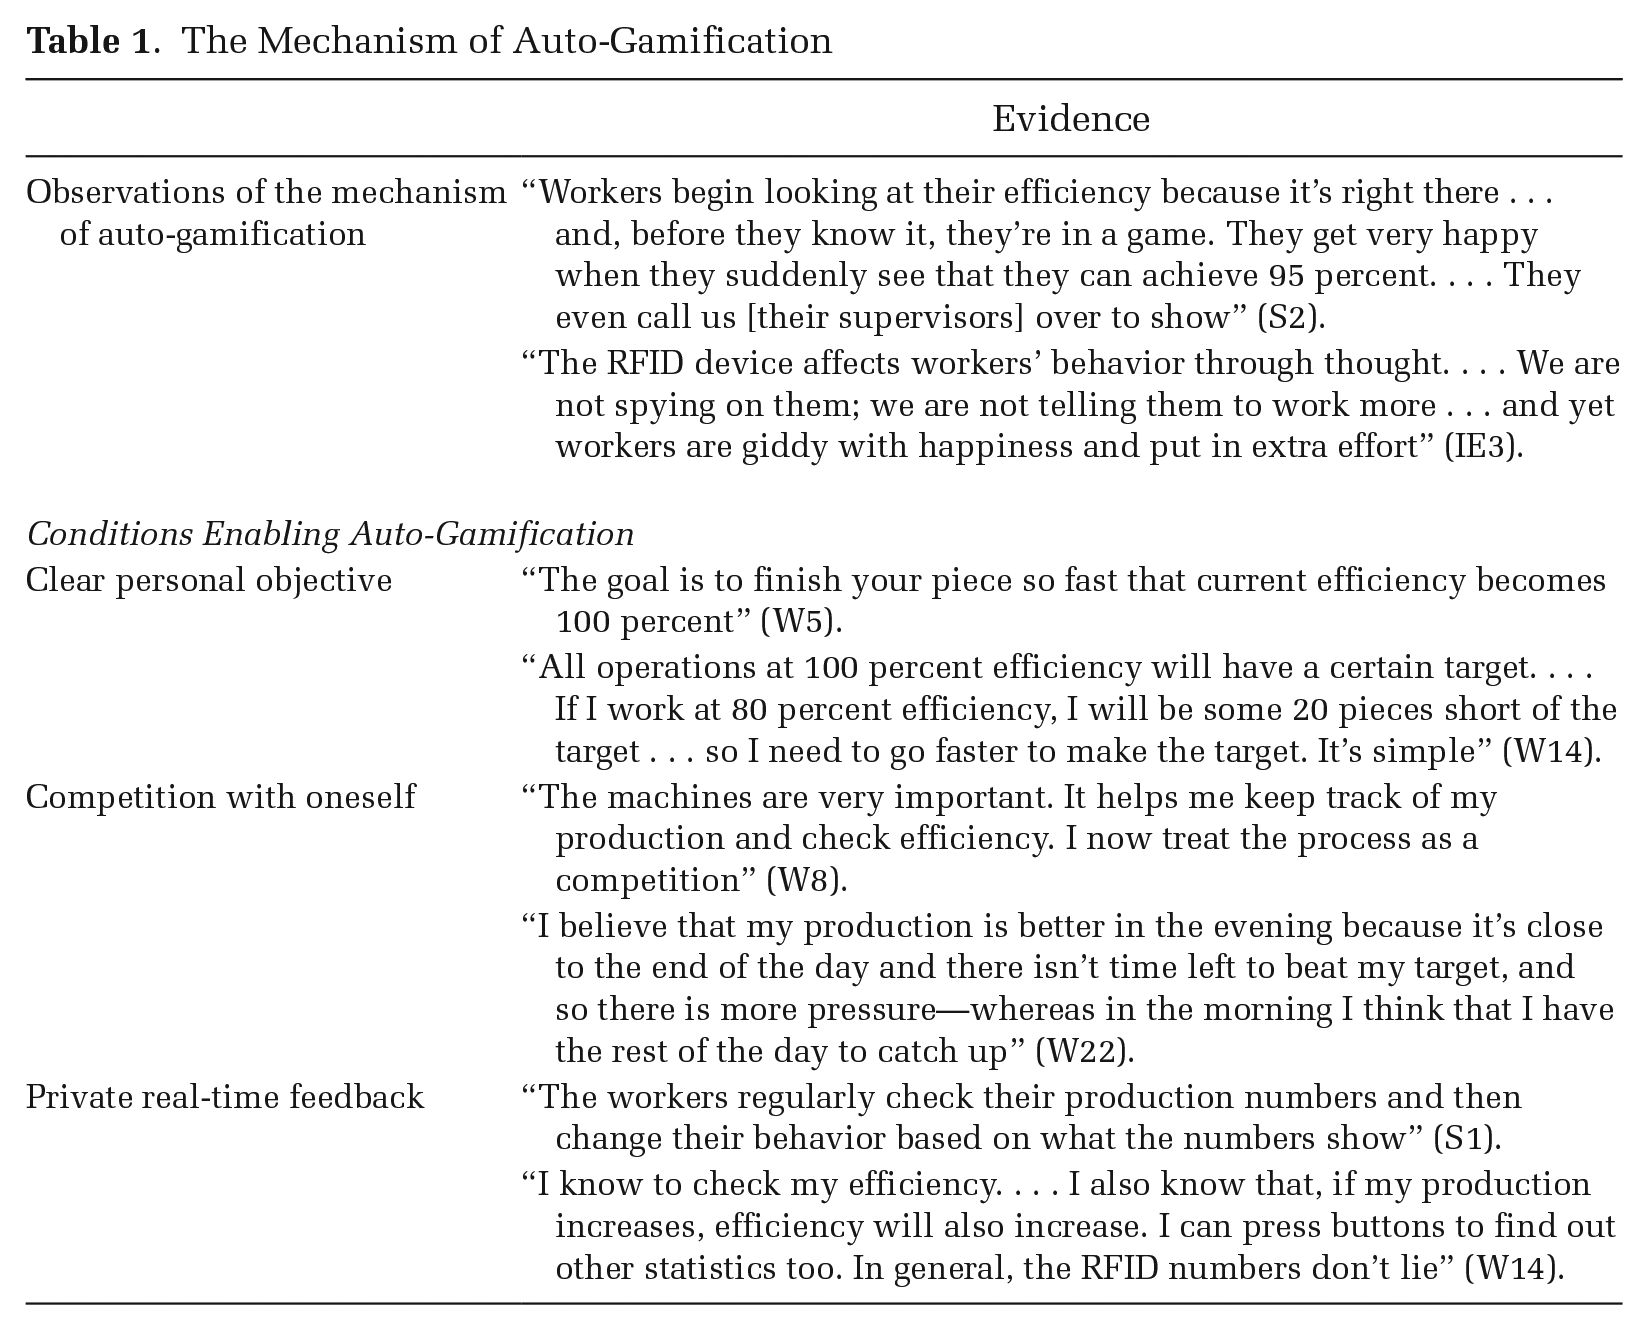
We posit that quantification affected workers’ productivity via the mechanism of auto-gamification. The RFID technology offered a clear personal objective, competition with oneself, and private real-time feedback, prompting workers to gamify their work voluntarily, without encouragement from management. 14 Table 1 offers further evidence of auto-gamification.
The Mechanism of Auto-Gamification
Heterogeneity by Work Complexity in the Consequences of Quantification
Our interviews also revealed that work complexity is an important component of how workers understand their work and it guided their interpretations of and reactions to the digital-measurement technology. Observation revealed significant heterogeneity in the complexity of garment-production work. Complexity was understood as the time required to perform work: simple work takes less time to execute than complex work, which is more multifaceted and difficult.
Simple work
Workers who performed simple work understood their work as “routine” (W1); their objective was to finish it fast. One said, “I do a straight stitch along the seam. . . . There’s no thinking. I just need to keep the production going” (W13). Another said, “All I have to do is use my arms to align my pieces. The machine does the rest. . . . I could do this in my sleep; it’s that easy” (W5). Workers who performed various simple operations called their jobs “boring” (W13), “repetitive” (W8), and “monotonous” (W7).
Because such work was simple, the quantity metric captured by the RFID devices on the treatment lines—the number of pieces produced—was seen as an appropriate and useful measure of performance. “Pants are produced in huge quantities. . . . Higher the quantity, better the pants production,” one supervisor said. “So with a technology like this, one could see a payback” (S3). The head of production concurred: “Number of pieces produced is the right indicator of performance in the case of products where there is mass production, like pants” (H4). A worker who performed a simple coin-pocket operation said, “With RFID, I am now able to see how I am working; I am able to see my quantity and percentage efficiency. I have a target of 35 pieces per hour for my current operation, and I know that right now I am able to deliver 25 to 30 pieces” (W8). Because such workers saw quantity as a meaningful measure of performance, they viewed auto-gamification as motivating. The head of production (H4) explained: Earlier, workers doing simple tasks felt like they were traveling on a long, straight tollroad with no distance markers, no sense of how far they’ve come. Now those who have RFID have distance markers, and they look forward to seeing the distance they’ve covered. They know how far they need to go. And they, without realizing, try to cover the distance faster than the previous time they travelled on this road.
A worker articulated the sentiment that the technology had enabled a game that made simple work fun: “I have been in the factory for many years and have been doing the same operation from Day 1. I do not like the operation very much, but I like the RFID machine and I like to do the scanning. . . . It’s like a calculator, and my goal is to make sure that efficiency does not go down in a day . . . because once efficiency goes down, I’ve lost—game over. And it is very difficult to bring it up” (W5).
Observation further suggested that the productivity of workers who performed simple work had been positively affected by the RFID measurement technology. The worker who described the machine as a calculator said, “I think that this has helped me work faster and deliver more production” (W5). A worker (W4) engaged in basic assembly loading noted, “The machine has helped me realize my potential. . . . I am delivering better production numbers than I ever thought I could do!” A senior worker commented: “The production definitely improved. . . . It has now become part of the workers’ work” (W15). A supervisor on the treated pant line noted that “after RFID, the line is running very strong, with workers displaying higher degree of self-interest” (S3). Based on our qualitative data, we hypothesize the following:
Hypothesis 1: In a context of simple work, the influence of quantification of work on worker productivity will be positive.
By contrast, observation indicated that workers engaged in complex work responded very differently to quantification.
Complex work
Workers who performed complex work tended to view their work as “craft” (W22) and to focus on getting it “done right” (W26), not just quickly. Such workers described their jobs as “fulfilling” (W24) and “challenging” (W14). One asserted that “jackets are premium products and almost every piece feels customized” (W15). Another elaborated: “A jacket is seen as a product that would add esteem to a person wearing it . . . and whether or not that happens is in my hands” (W14). A worker who performed a sleeve/headroll-attach operation said, “I stitch pieces of fabric varying in size onto a curved piece of felt material, which supports the sleeve across the shoulder—it’s an accomplishment every single time!” (W24).
When RFID was implemented on the complex lines, workers viewed the quantity metric it captured as a partial and thus imperfect measure of performance. The head of production explained that “in jackets, the drive is towards ‘premiumness’ and quality, and not so much numbers produced” (H4). The head of jacket production concurred: “Though there is some drive toward production, the drive for quality is stronger” (H3). A worker elaborated: “Side seam is a complex operation. I think it is complex because it is very difficult to do. If I make even the smallest error, a wrinkle will form and the piece will come back for alterations. So number of pieces is not the only thing [that matters]; whether there are wrinkles or not is just as important” (W22).
In this context, quantification of work output induced auto-gamification that sapped motivation. One worker explained: “Before the machine was introduced, I was able to allocate my time on my own, but now the countdown has added additional work pressure . . . and made it not fun” (W20). Asked to elaborate on the countdown, she said, “It is hard not to get sucked into the RFID countdown game. But you know how some games are fun and others aren’t? This one isn’t, for me” (W20). Workers reported feeling demotivated and devalued because RFID had the effect of “reducing them to a number” (W22). 15 They took pride in their craft and wanted to be appreciated for delivering high-quality products. One worker who sewed intricate internal pockets said, “Workers like me deliver because of our deep familiarity and interest in our operation . . . not because of games you put on my desk” (W25). Workers engaged in complex operations inadvertently turned their work into an individual-level game, but they found it neither enjoyable nor motivating.
This reaction to quantification among workers doing complex work seemed to result in lower productivity. A worker who performed an under-collar zigzag stitch said, “I do not like having the watchman machine. . . . I used to really like my operation. Now I’m not so sure. . . . [I] think that it has not positively impacted my production levels” (W27). A worker who performed a complex lapel-seam operation said, “My work is critical and difficult to do. . . . [Being] observ[ed] while work is being done would make even a normally fast worker slow down” (W23). A worker who performed a sleeve-lining operation said that, though “the target for the operation is 70, I am able to deliver only about 55 to 60 pieces now, after the RFID” (W20). Another worker told us that “in general, she does not seem to like having the machine. She thinks the scanning has actually brought down her numbers” (fieldnotes). Thus, we hypothesize the following:
Hypothesis 2: In a context of complex work, the influence of quantification of work on worker productivity will be negative.
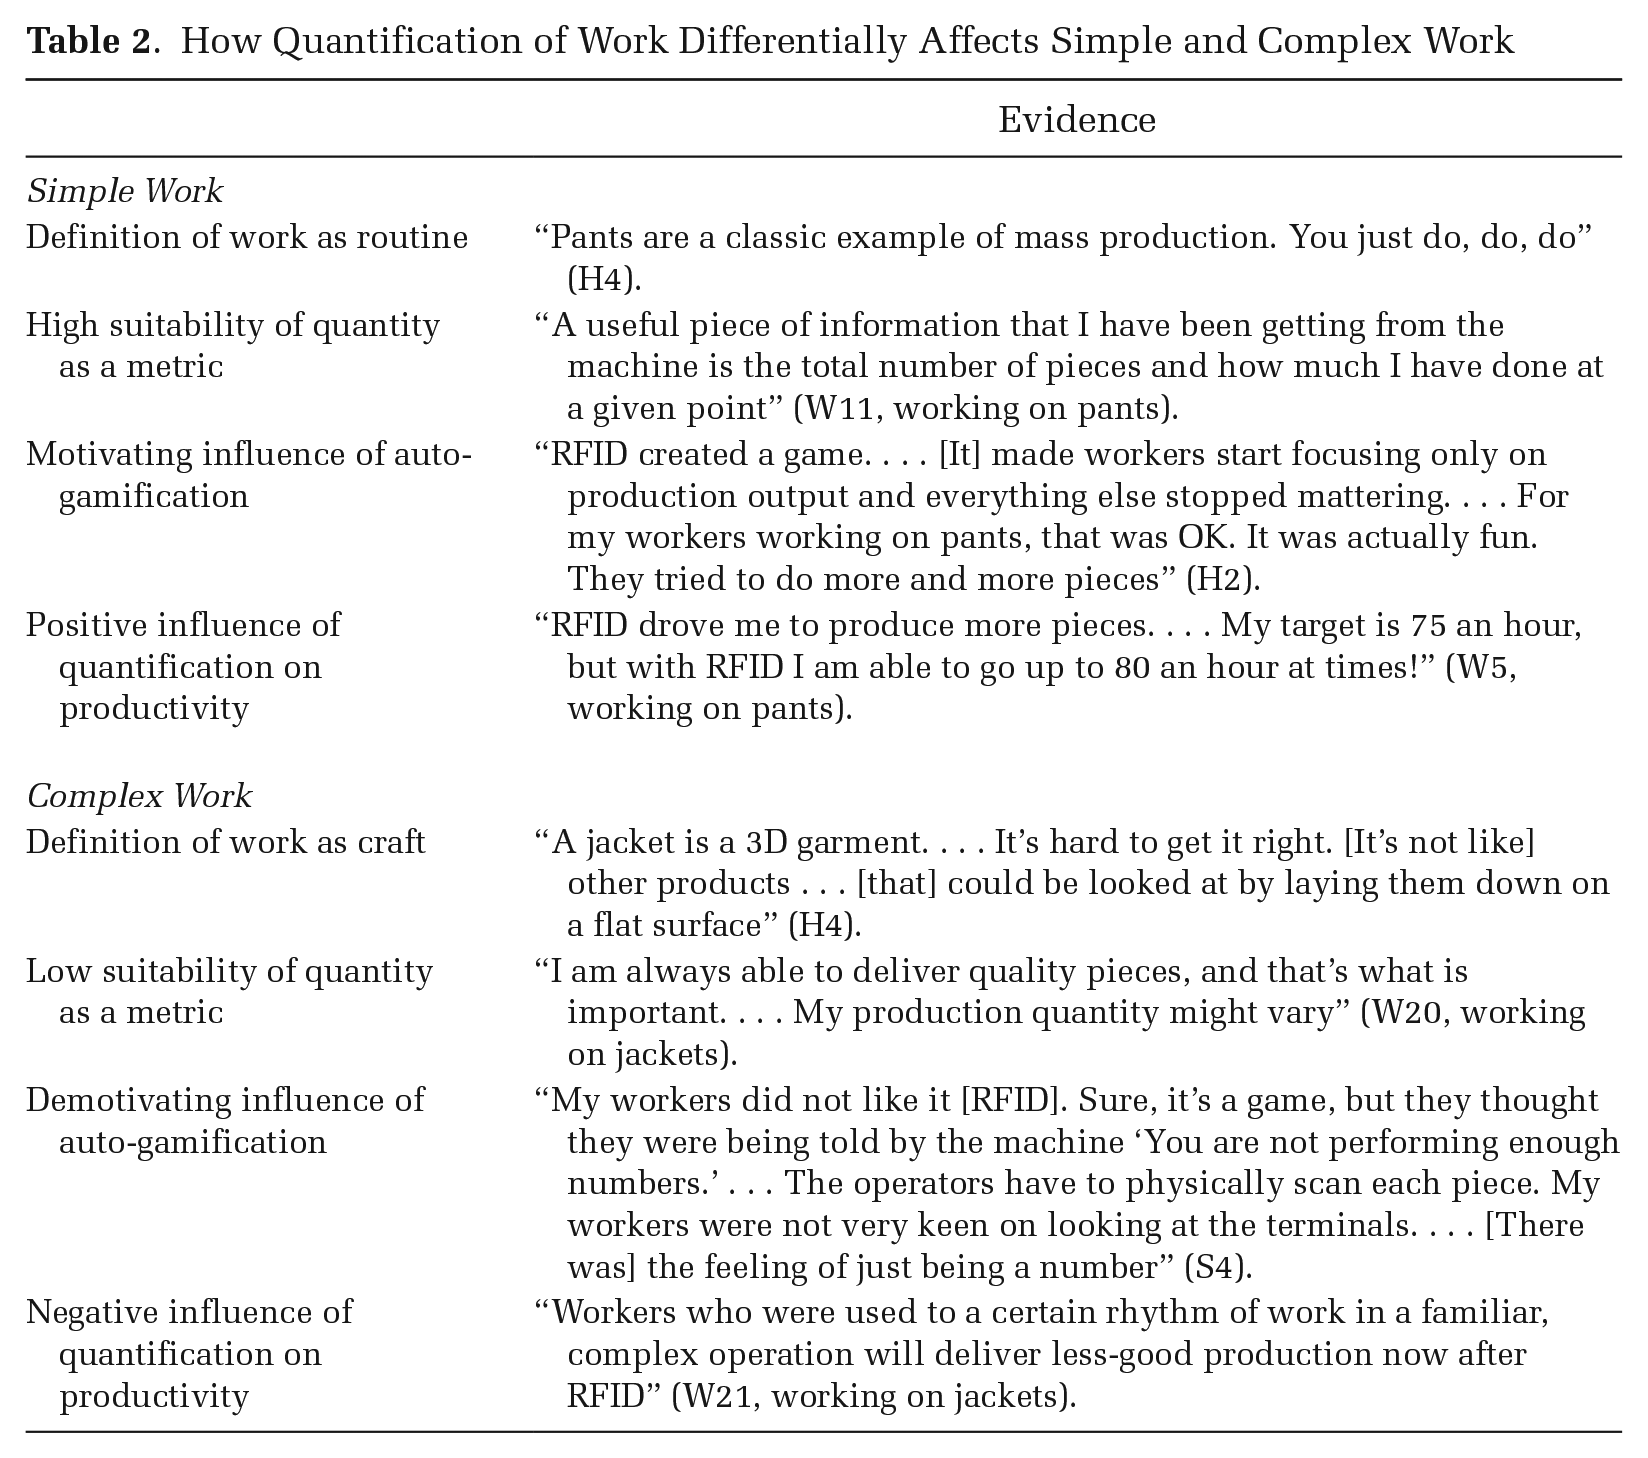
Table 2 presents additional evidence that quantification differentially affects workers pursuing simple and complex work. Note that the workers who performed simple and complex work were quite homogenous: most lived in villages surrounding the factory, were economically disadvantaged (prompting them to seek this job), and had not previously been formally employed. Furthermore, there appeared to be no systematic assignment of workers with certain characteristics to certain jobs. On the contrary, jobs were assigned quasi-randomly, based on vacancies. We observed that a handful of workers “walk in” to the factory daily seeking jobs as sewing operators. The factory did not screen applicants; most people who walked in were hired and assigned to an open job within minutes. The only criteria for rejection were color-blindness and inability to read numbers. Management believed any worker could pick up the necessary sewing skills.
How Quantification of Work Differentially Affects Simple and Complex Work
In summary, our qualitative data enable us to identify a novel mechanism—auto-gamification—that explains how quantification of work affects worker productivity. We cannot test this mechanism quantitatively, but our qualitative data generate two testable hypotheses about the conditions under which quantification will raise or lower productivity. We posit that quantification is more likely to raise productivity in the context of simple work, where gamification is motivating because quantified metrics adequately measure the work being performed. When work is complex, quantification is likely to reduce productivity because it cannot adequately measure the multidimensional work being performed, rendering gamification demotivating.
Quantitative Methods, Data, and Measures
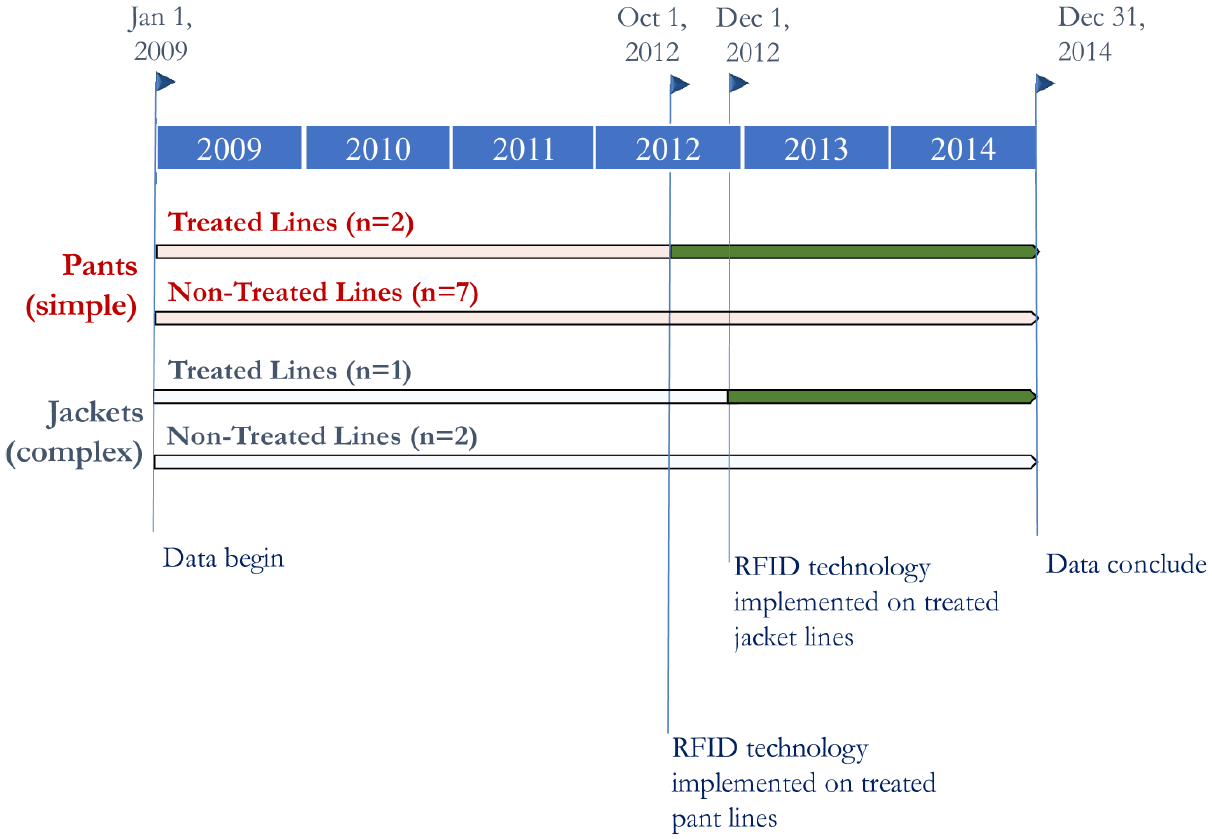
We tested our hypotheses by exploiting a natural experiment. On October 1, 2012, factory management installed RFID measurement technology on two of the nine pant lines; two months later, on December 1, 2012, the same technology was installed on one of the three jacket lines. When the technology was installed on a line, all operations within that line became quantified. We collected data on daily line-level productivity from January 1, 2009, to December 31, 2014 (i.e., both before and after quantification). For the nine pant lines, we also have daily operation-level productivity data for a few months before and after the intervention. This array of data enables us to investigate the influence of quantification of work on productivity in the treated lines and operations; the nontreated lines and operations serve as a comparison group to control for time-varying trends in productivity. We can further explore heterogeneity in the effects by work complexity. Our empirical strategy first exploited variation in complexity across pant and jacket lines. Figure 2 depicts this empirical strategy. We then further exploited variation in complexity across operations within pant lines to address possible objections that pant and jacket lines could differ on dimensions other than complexity.
Study Design
Complexity across Product Lines
In garment manufacturing, complexity varies by product. Managers and workers both told us that jackets are more complex than pants. A shop-floor supervisor said, “Jackets are more complex overall; the individual operations being performed by workers are also more complex” (S2). As is common in the industry, the factory rates complexity using standard minute values, or SMVs. A given SMV represents the total number of minutes allocated for workers performing at a standard level to complete a given product from start to finish; higher values correspond to more complex products. We collected data on the SMVs of different styles of pants and jackets being produced. The mean SMV of pants was 28.99, with a standard deviation of 3.65; that of jackets was 88.44, with a standard deviation of 9.76. Thus, on average, producing a jacket takes almost three times longer than producing a pant. A t-test reveals this difference in mean SMVs is statistically significant at the .01 level. 16
We initially exploit this variation in complexity by comparing how quantification affects productivity in complex jacket lines and simpler pant lines. Our dependent variable here is daily line-level productivity. Line-level productivity is measured at the factory by percent efficiency, a measure of productivity that accounts for the complexity of the product. For example, if the manufacturer assigns a product an SMV of 30, it expects a line to complete one unit in 30 minutes. If the line averages 50 minutes to do so, its percent efficiency is 60 percent (30/50). We collected daily line-level percent-efficiency data for each of the 12 lines (nine pant lines and three jacket lines) between 2009 and 2014. These data were collected manually, pre- and post-treatment, by comparing the number of fully finished garments produced by a line to its daily target.
Complexity across Operations within Pant Lines
To address worry that pant and jacket lines differ on dimensions other than complexity, we also exploit variation in the complexity of operations within pant lines, where operations are carefully constructed to be incapable of being broken down further. Just as the complexity of garments is rated using SMVs, so is the complexity of specific operations. Here, an SMV represents the number of minutes allocated to a qualified worker performing at a standard level to complete a given operation; higher values correspond to more complex operations. Operations assigned higher SMVs typically entail more dimensions, greater dexterity, and greater cognitive demands.
An industrial engineer explained: “Each worker is assigned to an operation, which should be thought of as a task that cannot be broken down any further. . . . And so, even in the relatively easy pant production, some tasks naturally take longer to do, have greater SMV, and are considered to be more complex” (IE1). For example, attaching a waistband is a complex operation with an SMV of .95; that is, an operator must execute an operation every 57 seconds (including rework and rest) to achieve 100 percent efficiency. In contrast, attaching wash-care labels is a simple operation with an SMV of .19, which corresponds to performing it in 11.4 seconds. Although there are few complex operations within pant lines, we exploit variation in complexity across pant-line operations to investigate the influence of quantification of work on different operations. To conduct this analysis, we obtained daily operation-level productivity data within pant lines for a subset of dates, pre- and post-treatment, in 2012. We excluded jacket lines from the operation-level analysis because we lacked pre-treatment productivity data for jackets.
Our dependent variable for this analysis is daily operation-level productivity. Like line-level productivity, operation-level productivity is measured by percent efficiency, a measure that depends on the speed of the operator and the complexity of the operation. For example, if the manufacturer assigns an operation an SMV of .75, it expects a skilled operator to complete it in .75 minutes. If a worker takes an average of .50 minutes to complete that operation over the course of a shift, that worker’s percent efficiency is 150 percent (.75/.50). At the end of the production line, inspectors check products and return any with a flaw to the responsible worker. Such rework reduces a worker’s measured efficiency; rework takes time but does not increase the number of items produced.
Manual records provided pre- and post-treatment operation-level productivity data for the pant lines, to exclude the possibility that our estimated treatment effect is biased by changes in the data-collection regime. During the pre-treatment period, data collection at the individual level was done at random, infrequent intervals as spot checks: a data-entry clerk (with no formal authority) counted how many items workers performing specific operations had produced. Because the intervention was a pilot, these manual spot checks continued post-treatment.
Empirical Strategy: Difference-in-Differences
The data allow us to test for the influence of quantification of work using a difference-in-differences framework. The analysis consists of three parts: (1) the unconditional analysis, which examines overall changes in productivity at treated lines post-treatment; (2) an analysis that conditions on the complexity of the product line; and (3) an analysis that conditions on the complexity of operations within the pant lines.
First, we estimate the influence of the quantification intervention on productivity:

In Equation 1, Yit is the productivity (percent efficiency) of line i on day t; treated i is an indicator that takes a value of 1 if line i is ever a treated line; and post it is an indicator for whether line i was in the post-treatment period on day t, regardless of whether that line was actually treated. Because of the technology’s staggered introduction, the latter variable takes a value of 1 for lines that produced pants after October 1, 2012, or jackets after December 1, 2012. Then, posttreated it is an indicator that takes a value of 1 if treated line i is in the treatment period at time t, which is functionally equivalent to the interaction between the post and treated indicators. We run our regressions with and without line fixed effects, denoted by φi, and, similarly, with and without month and day-of-week fixed effects, denoted by τt. We cluster standard errors by line to allow for errors to be correlated within lines.
As in a standard experimental difference-in-differences framework, the identification emerges from the difference between treated and nontreated lines before and after treatment. This yields estimates for the treatment effect, whatever the ex-ante differences between the lines, as long as the treatment is not correlated with other factors that also affect productivity. Although the treated lines in this case were not explicitly chosen at random, management chose those nearest to the offices of the engineers responsible for maintaining the technology. Thus the choice of treatment lines was quasi-random, in that it was made for a reason unrelated to expected trends in productivity. We conducted a standard set of tests to ensure that the parallel-trends assumption was met: treated lines exhibited the same trend in productivity as nontreated lines in the absence of the treatment. 17
Complexity across product lines
Next we examine how the influence of quantification varies by product-level complexity by rerunning Equation 1 separately for jacket and pant lines:
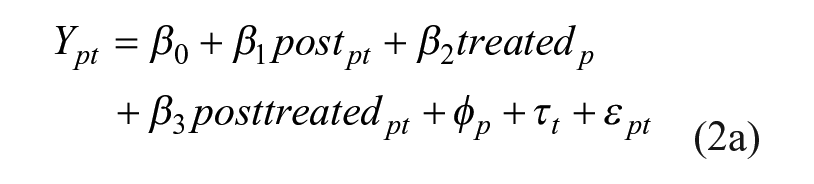
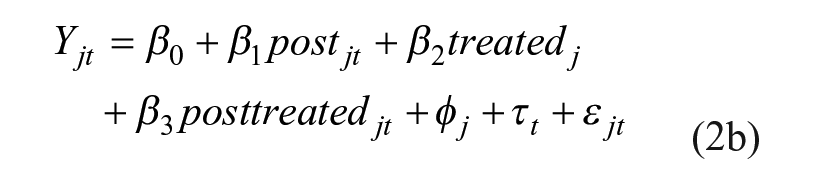
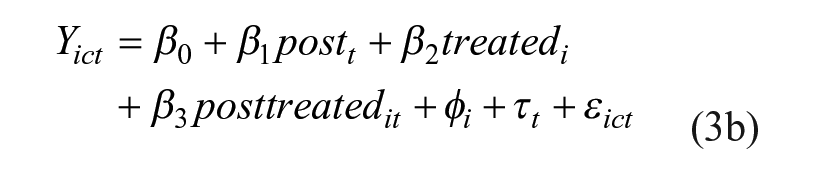
where p denotes the nine pant lines, j denotes the three jacket lines, and all other variables remain unchanged. Hypothesis 1 concerns the direction of the coefficient on β3 in Equation 2a; Hypothesis 2 concerns the direction of the coefficient on β3 in Equation 2b.
Equations 2a and 2b are convenient for comparing the productivity growth of treated and nontreated lines, separately for simple and complex product lines. We may also test whether the influence of the measurement technology differs in simple and complex product lines. To do so, we fully interact Equation 1 with an indicator that the line produces complex jackets:
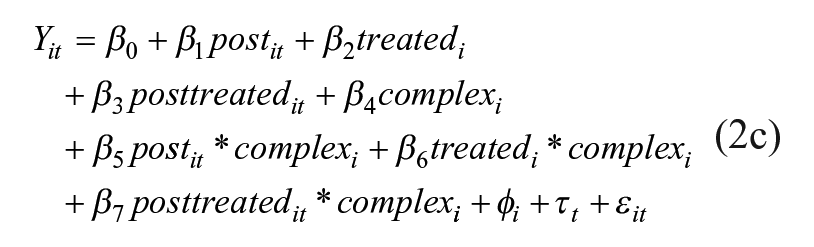
where complex i denotes that line i produces the more complex product (jackets), and all other variables remain as before. As a three-way interaction, remember that β0 through β3 are estimated with the simple (pant) lines. Then posttreated it × complex i is our coefficient of interest, estimating the difference between simple and complex product lines in the influence of quantification on productivity. As before, we run these three regressions with and without line, month, and day-of-week fixed effects. We cluster standard errors by line. This line-level analysis allows us to examine how quantification affected productivity depending on product-level complexity.
Complexity across operations within pant lines
Finally, we exploit variation in complexity across operations within pant lines. This operation-level analysis has two distinct advantages over the line-level analysis. First, pant and jacket lines could be correlated with some factor other than average complexity that yields productivity gains or losses from quantification; switching to the operation-level analysis allows us to evaluate complexity more directly. Second, because our measure of complexity is a continuous variable, the operation-level analysis allows us to estimate the influence of quantification at discrete intervals of complexity as well.
Our empirical strategy for evaluating operation-level complexity mirrors the strategy we use for line complexity. We begin by distinguishing between simple and complex operations, depending on whether they are below or above the 75th percentile SMV. We run the regression using the 75th-percentile cutoff (corresponding to an SMV of .75) because pants operations are relatively simple; we thus designate complex pant operations as the most complex. 18 The regressions take the form
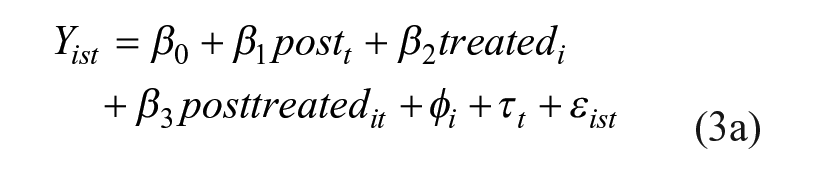
where Yist and Yict represent the efficiency of line i’s simple operation s or complex operation c at day t, and all other variables are as before. We run these regressions with and without line, month, and day-of-week fixed effects, and standard errors are clustered by operation.
Likewise, we perform a fully interacted regression
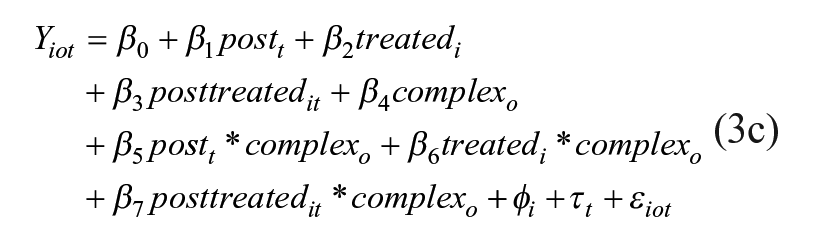
where Yiot is the percent efficiency of line i’s operation o at month t. We show results where complex o is treated as a discrete variable indicating whether the SMV rating of the operation is above the 75th percentile SMV for pant jobs, and where complex o is a continuous variable representing the SMV rating of the operation.
Results
Table 3 shows that treated lines were not systematically different than nontreated lines with regard to observable worker characteristics prior to installation of the measurement technology. We next investigate differences in worker characteristics between simple and complex lines, and between simple and complex operations. Because workers are assigned to lines and operations based on operational need, we expect their capabilities to be uncorrelated with job characteristics. Table 4 confirms that assignments are uncorrelated with workers’ skills, education, and experience.
Descriptive Statistics of Workers in Treated and Nontreated Lines
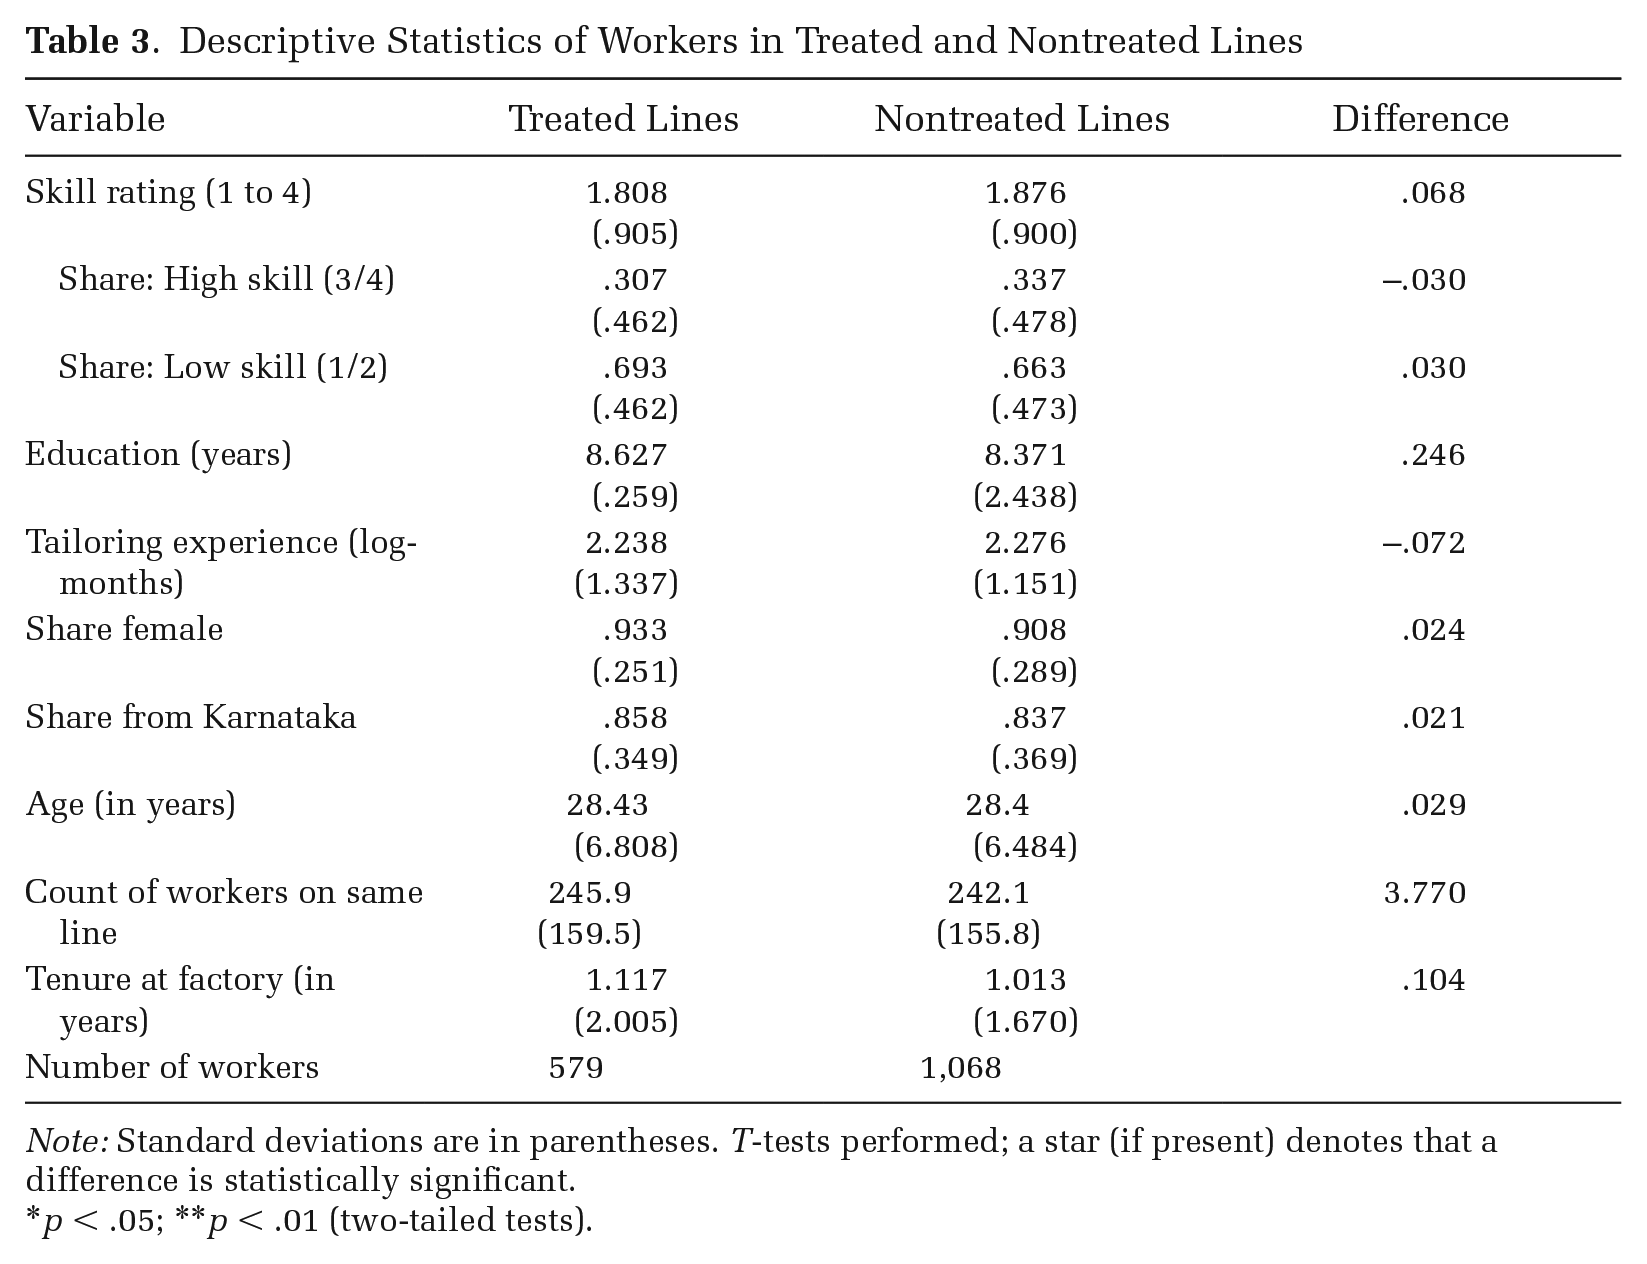
Note: Standard deviations are in parentheses. T-tests performed; a star (if present) denotes that a difference is statistically significant.
p < .05; **p < .01 (two-tailed tests).
Descriptive Statistics of Workers Performing Simple and Complex Work
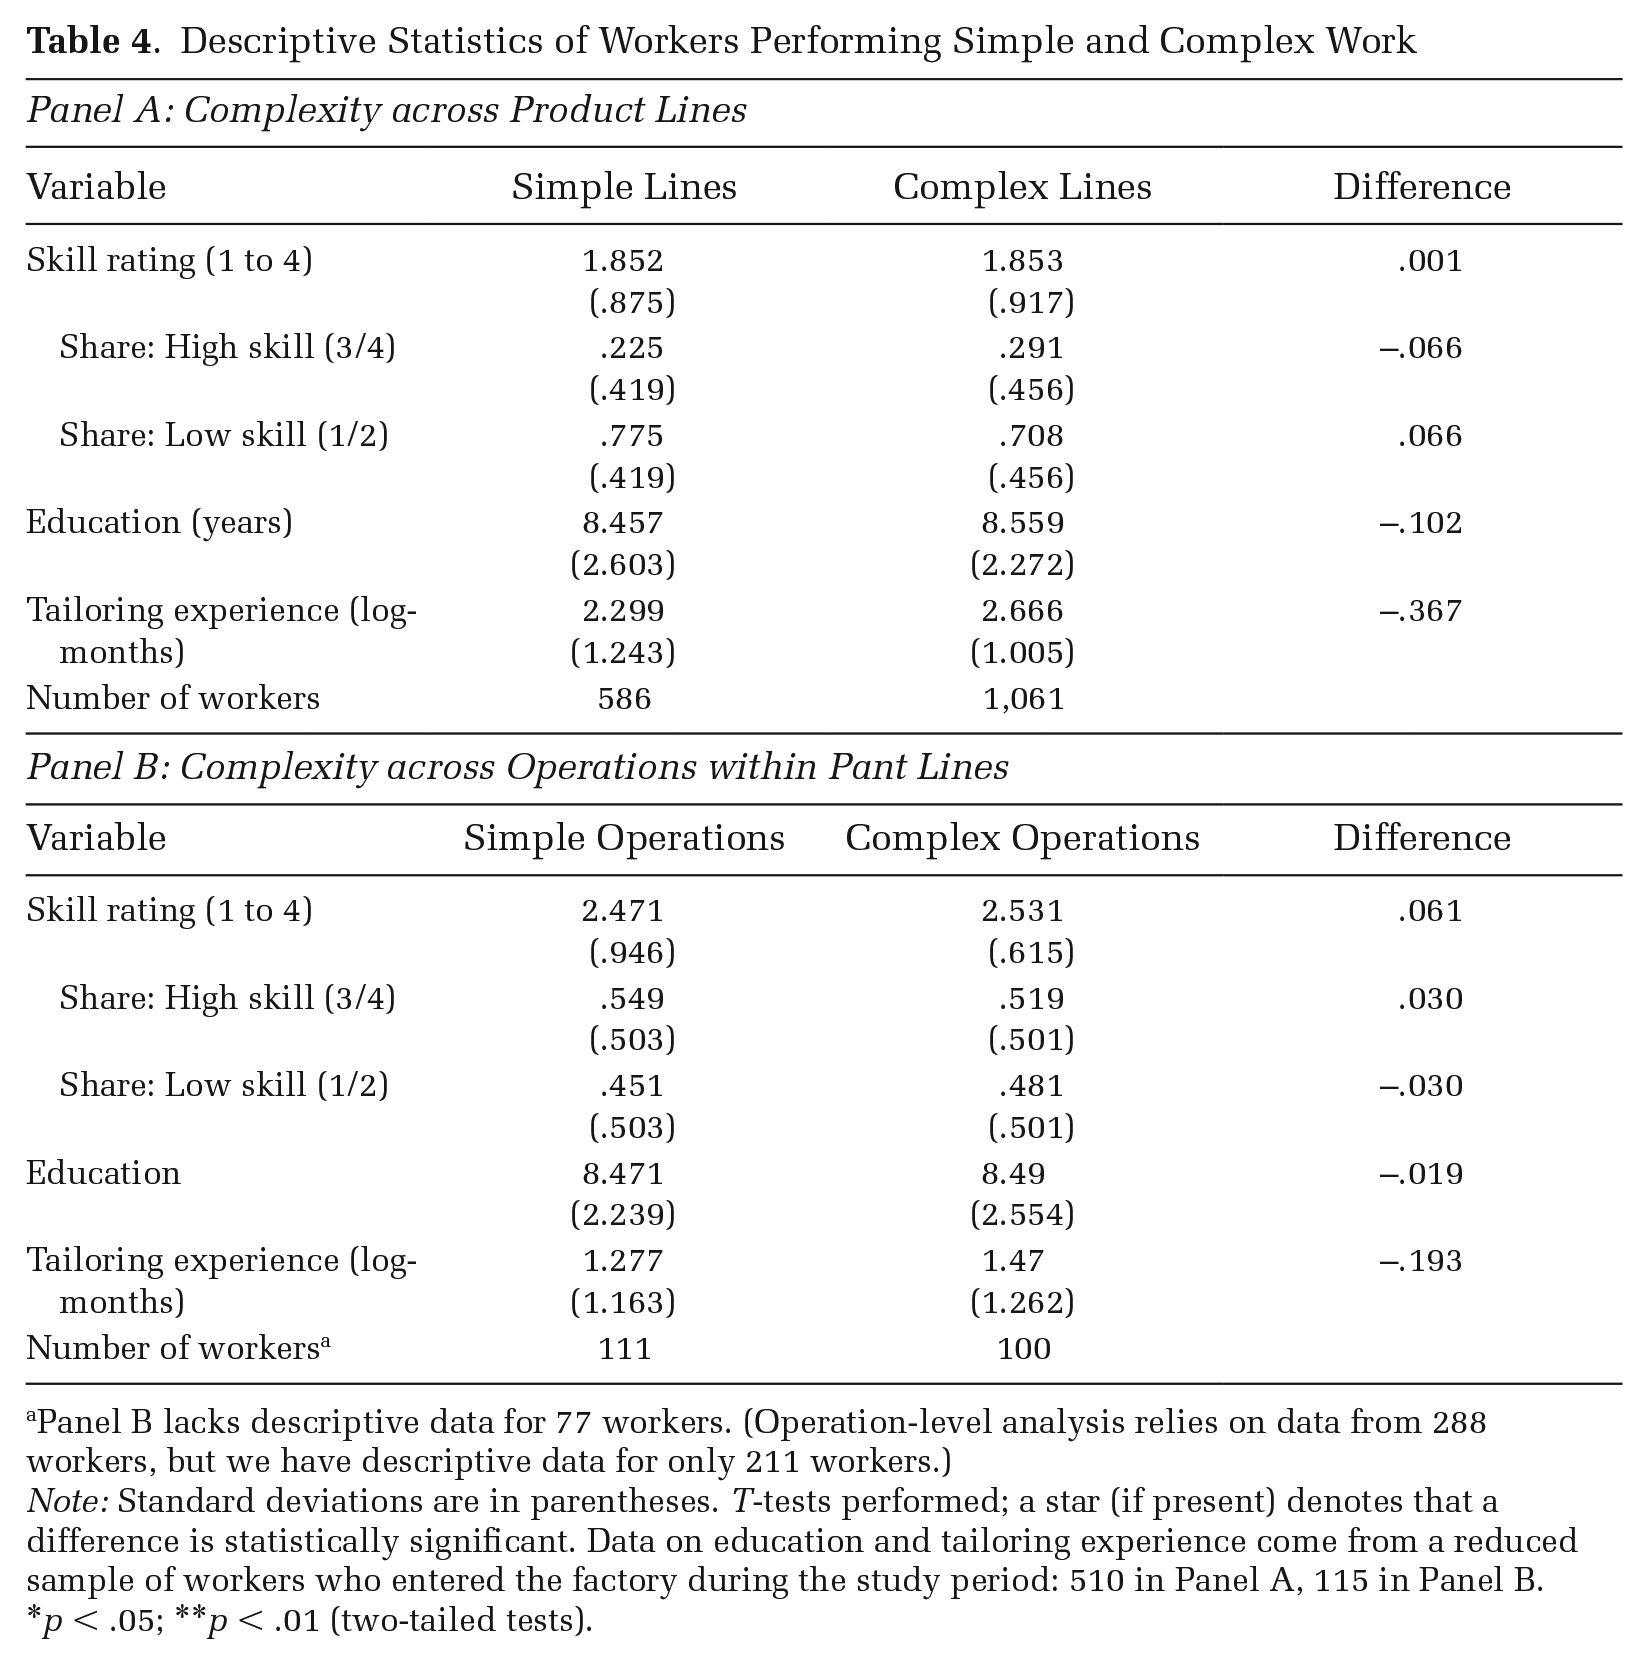
Panel B lacks descriptive data for 77 workers. (Operation-level analysis relies on data from 288 workers, but we have descriptive data for only 211 workers.)
Note: Standard deviations are in parentheses. T-tests performed; a star (if present) denotes that a difference is statistically significant. Data on education and tailoring experience come from a reduced sample of workers who entered the factory during the study period: 510 in Panel A, 115 in Panel B.
p < .05; **p < .01 (two-tailed tests).
Table 5 reports summary statistics on the mean and standard error of percent efficiency (our measure of productivity) at treated and nontreated lines before and after the measurement technology was implemented, for all lines, by product line, and by operational complexity within pant lines. We also present estimates for the first-differences and difference-in-differences. Panel 1 shows that overall productivity improved on both treated and nontreated lines; improvement was slightly greater on treated lines. Panel 2a shows changes in productivity on simple product lines (two treated and seven nontreated pant lines). Productivity remained relatively flat on the nontreated lines and rose substantially on the two treated lines after introduction of the measurement technology. Panel 2b shows changes in productivity on complex product lines (one treated and two nontreated jacket lines). In contrast to the pant lines, productivity on the treated jacket lines declined even as productivity on the nontreated lines improved. These summary statistics offer preliminary support for our hypotheses by demonstrating that, when comparing the productivity of treated and nontreated lines before and after the intervention, the influence of quantification was positive on simple lines and negative on complex lines.
Summary Statistics: Influence of Quantification on Productivity
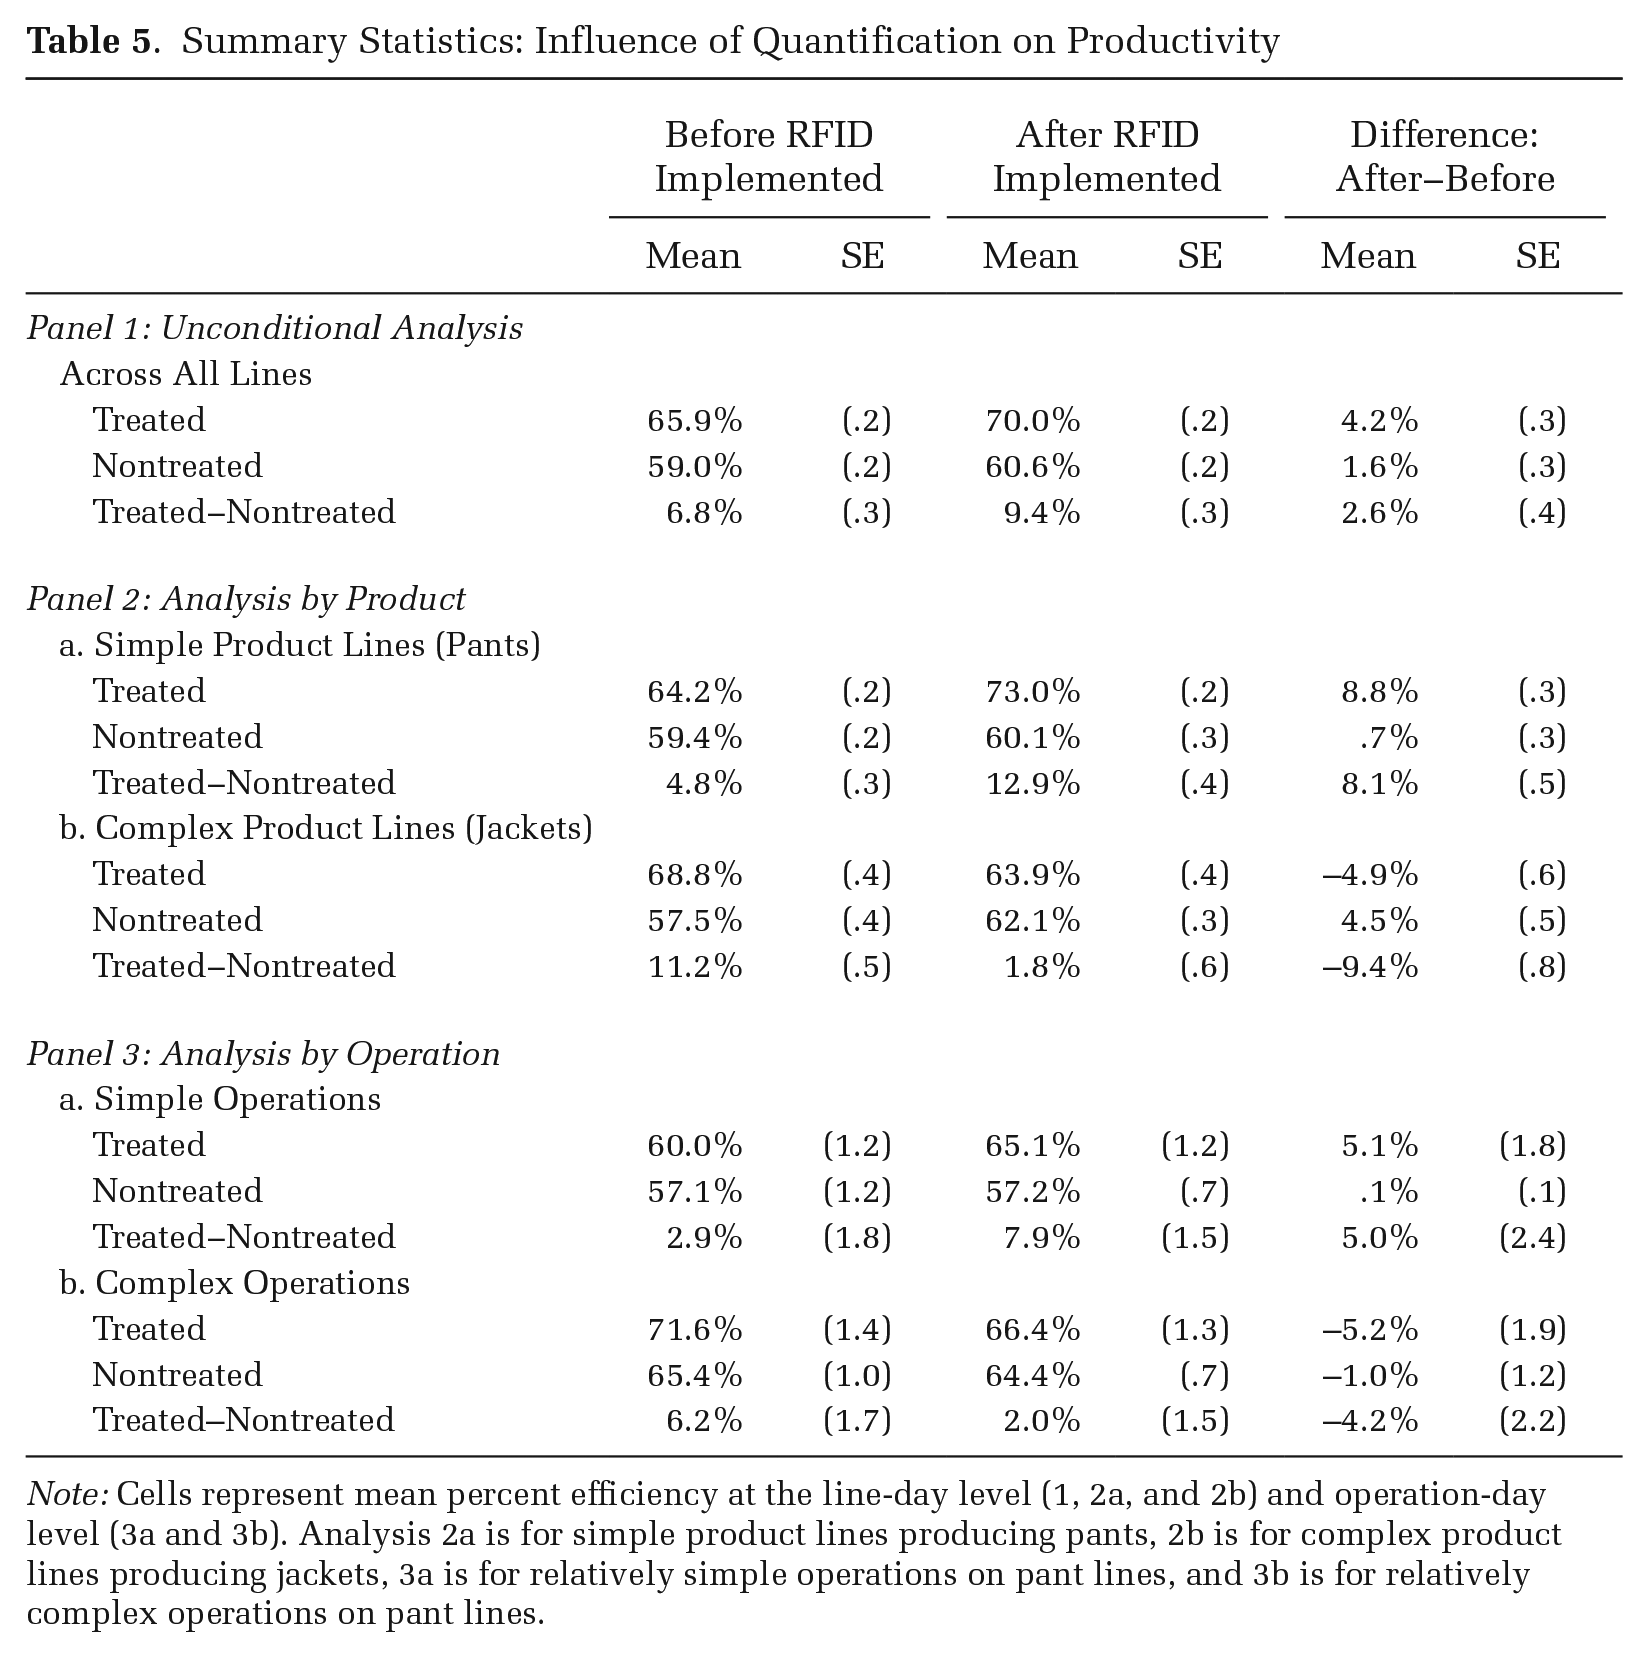
Note: Cells represent mean percent efficiency at the line-day level (1, 2a, and 2b) and operation-day level (3a and 3b). Analysis 2a is for simple product lines producing pants, 2b is for complex product lines producing jackets, 3a is for relatively simple operations on pant lines, and 3b is for relatively complex operations on pant lines.
Table 5, panel 3, shows changes in productivity within the pant operations. The efficiency of simple operations (in 3a) remained approximately constant on the nontreated lines but rose by 5.1 percentage points post-treatment on treated lines. For complex operations (in 3b), efficiency declined slightly on nontreated lines and by a larger amount on treated lines. These summary statistics offer support for our hypotheses by demonstrating that, as in the line-level results, the influence of quantification was positive on simple operations and negative on complex operations.
We turn next to our regression results, where we add controls and cluster standard errors. First, we look at the influence of quantification on productivity across all lines. These regressions correspond to Equation 1. Table 6 presents the results.
Difference-in-Differences Regression for the Influence of Quantification on Productivity across All Lines
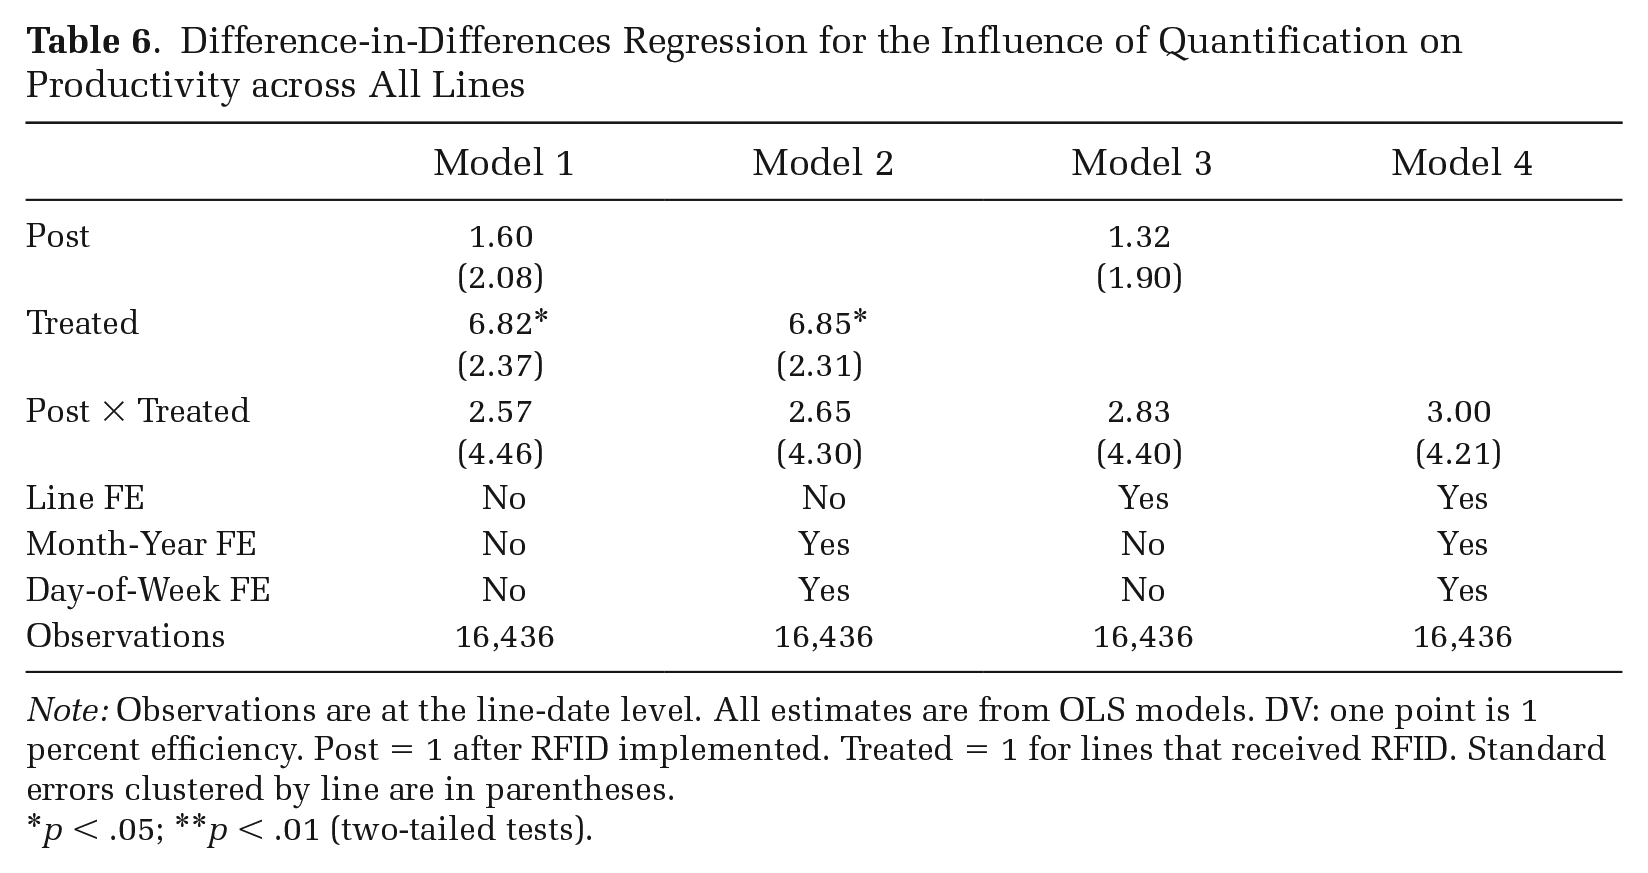
Note: Observations are at the line-date level. All estimates are from OLS models. DV: one point is 1 percent efficiency. Post = 1 after RFID implemented. Treated = 1 for lines that received RFID. Standard errors clustered by line are in parentheses.
p < .05; **p < .01 (two-tailed tests).
Table 6, column 1, shows the classic difference-in-differences without any controls. Treated lines exhibited slightly higher productivity prior to implementation of the measurement technology, but no statistically significant growth afterward. Column 2 introduces month and day-of-week fixed effects (note that the post term cannot be estimated here); Column 3 introduces line fixed effects (the treated term cannot be estimated here). Column 4 includes line, month, and day-of-week fixed effects (the post and treated terms are absorbed by the fixed effects). Given that we have a balanced sample and the treatment is largely uncorrelated with the controls, it is unsurprising that the main coefficient of interest, the difference-in-differences estimate, changes little as we introduce finer controls. This estimate is small and not statistically different from zero. If we were to stop here, we might conclude that the measurement technology had no influence on productivity. However, the following sections will examine the heterogeneity of the treatment effect by product and operational complexity.
Complexity across Product Lines
We next examine the influence of quantification on simple (pants) and more complex (jackets) products, which correspond to Equations 2a to 2c. Table 7 presents the results. Columns 1 and 2 correspond to Equation 2a and show the results of the difference-in-differences analysis of pant lines. Efficiency on treated pant lines rose an estimated 8.1 percentage points relative to nontreated lines. Given that these lines operated at 64.2 percent efficiency before treatment, relative productivity improved by about 12.5 percent. The improvement is statistically significant. The results are substantively similar after including line, month, and day-of-week fixed effects.
Difference-in-Differences Regression for the Influence of Quantification on Productivity by Product Complexity
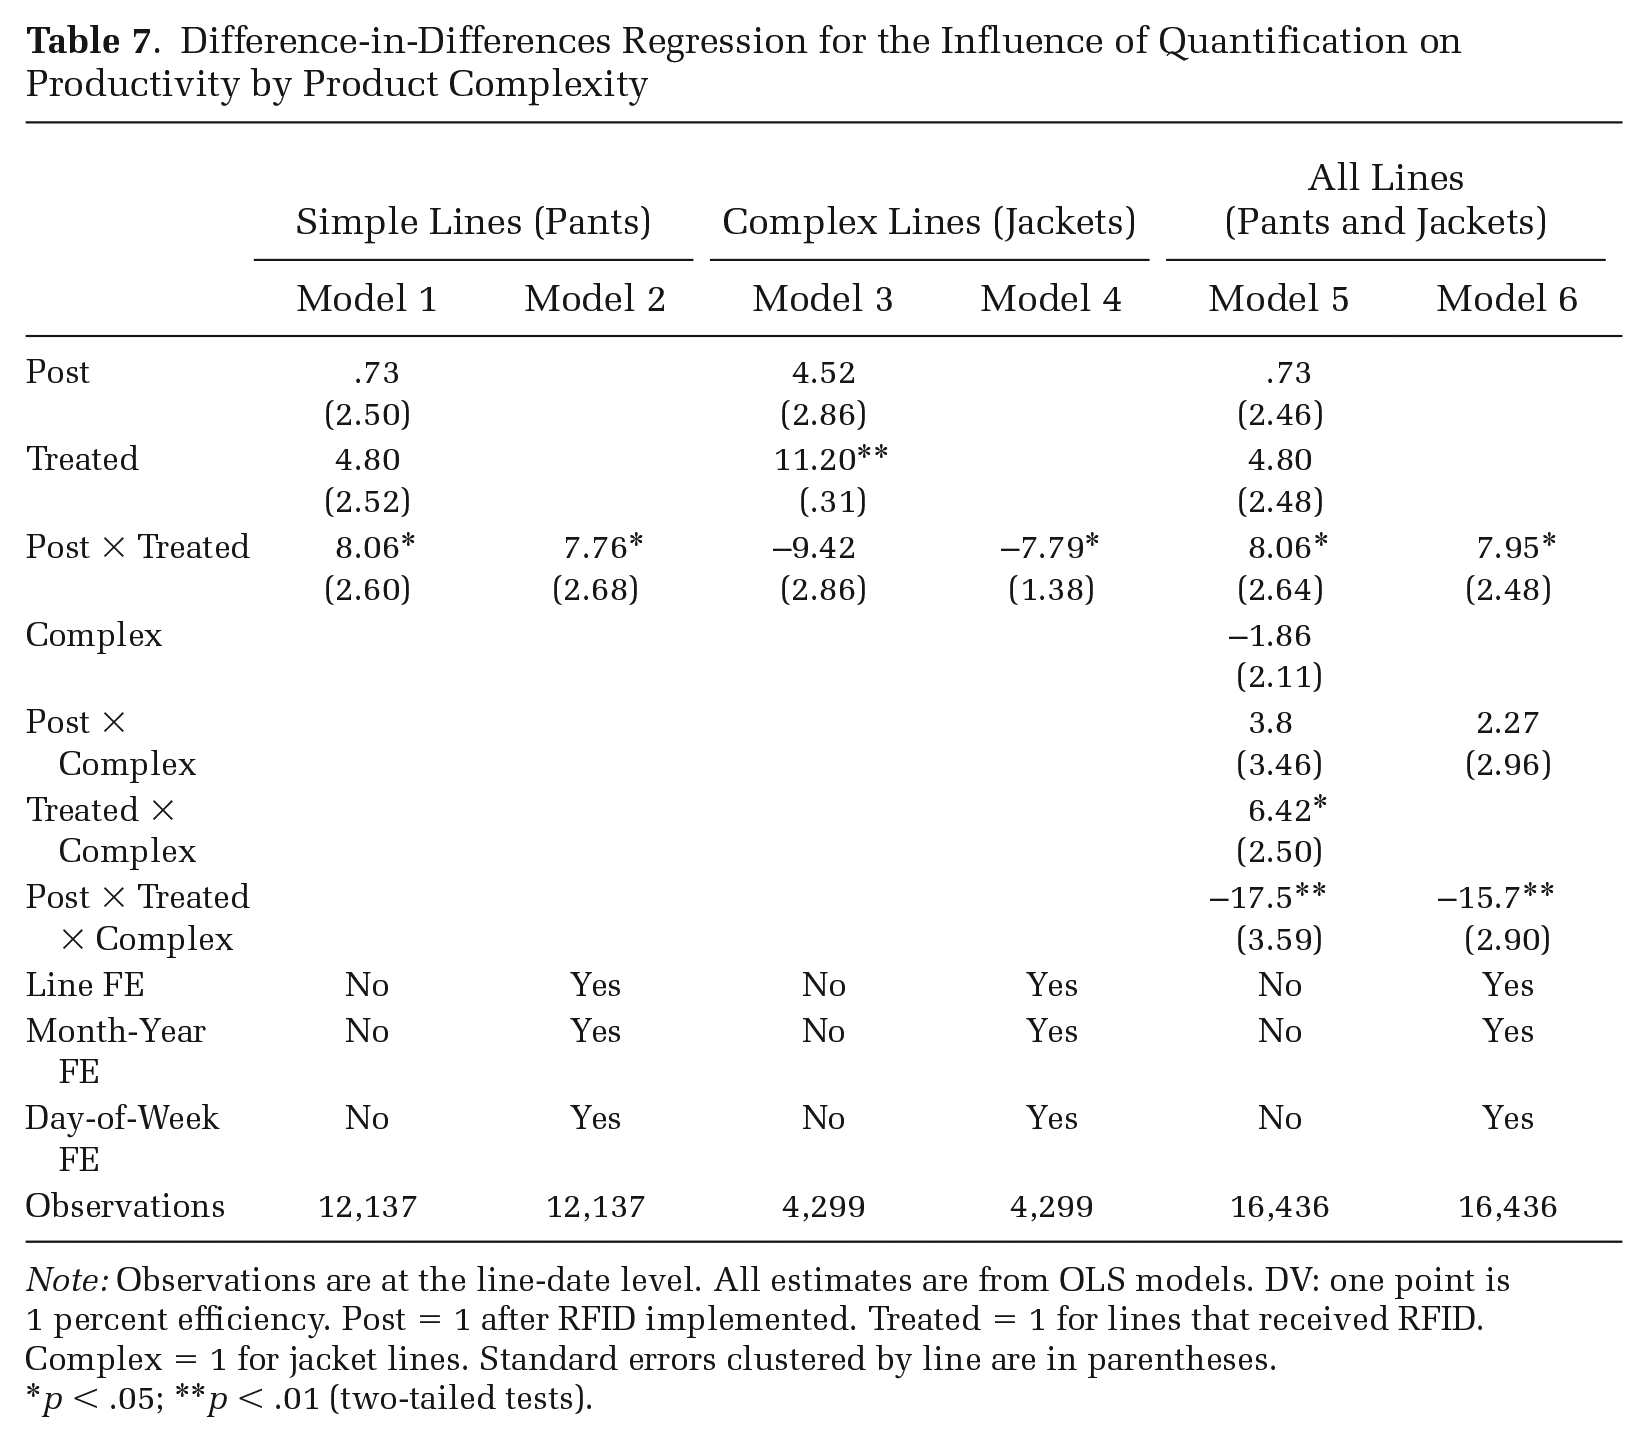
Note: Observations are at the line-date level. All estimates are from OLS models. DV: one point is 1 percent efficiency. Post = 1 after RFID implemented. Treated = 1 for lines that received RFID. Complex = 1 for jacket lines. Standard errors clustered by line are in parentheses.
p < .05; **p < .01 (two-tailed tests).
Columns 3 and 4 in Table 7 correspond to Equation 2b and show results restricting analysis to the jacket lines. Note that we now have one-third of the full sample observations, because only one-third of the lines produce jackets. Compared to nontreated jacket lines, productivity on the treated jacket line dropped by 9.4 percentage points. Again, results are similar if we include line, month, and day-of-week effects. Jointly, columns 1 through 4 suggest the influence of the quantification treatment was positive for the simple lines but negative for the complex lines.
Columns 5 and 6 in Table 7 correspond to Equation 2c and use triple differences to test whether the treatment effect was significantly different depending on whether a line produced pants or jackets. A few characteristics deserve note. First, we can estimate post × treated and post × complex in the final column because of the staggered treatment. Second, in even-numbered columns, the treated and post terms are absorbed by the line and month fixed effects, respectively. In column 6, the complex and treated × complex terms are absorbed by the line fixed effects. Turning to the coefficient of interest, the triple-differences model estimates that the difference in the influence of quantification between simple and complex lines is 17.5 percentage points in the reduced model and 15.7 percentage points after including the fixed effects. Both are statistically different from zero. Importantly, this reveals that the effects of quantification on simple and complex work are significantly different. Table 7 thus offers support for our hypotheses using our first measure of complexity at the product level.
Complexity across Operations within Pant Lines
Next, we examine how the influence of the measurement technology varies by operational complexity using operation-level data from the pant lines. These analyses correspond to Equations 3a to 3c. Table 8 presents results in a setup very similar to Table 7. Columns 1 and 2 of Table 8 restrict analysis to simple pant operations (SMV ≤ .75). Once again, the post and treatment terms drop out in column 2 because they are absorbed by line, month, and day-of-week fixed effects. Compared to nontreated pant operations, efficiency rose post-treatment in treated operations. The coefficients in columns 1 and 2 are 4.97 (p-value: .08) and 5.36 (p-value: .09), which signify substantively large gains of approximately 8.2 and 8.9 percent over prior efficiency of simple operations.
Difference-in-Differences Regression for the Influence of Quantification on Productivity, by Operational Complexity in Pant Lines in 2012
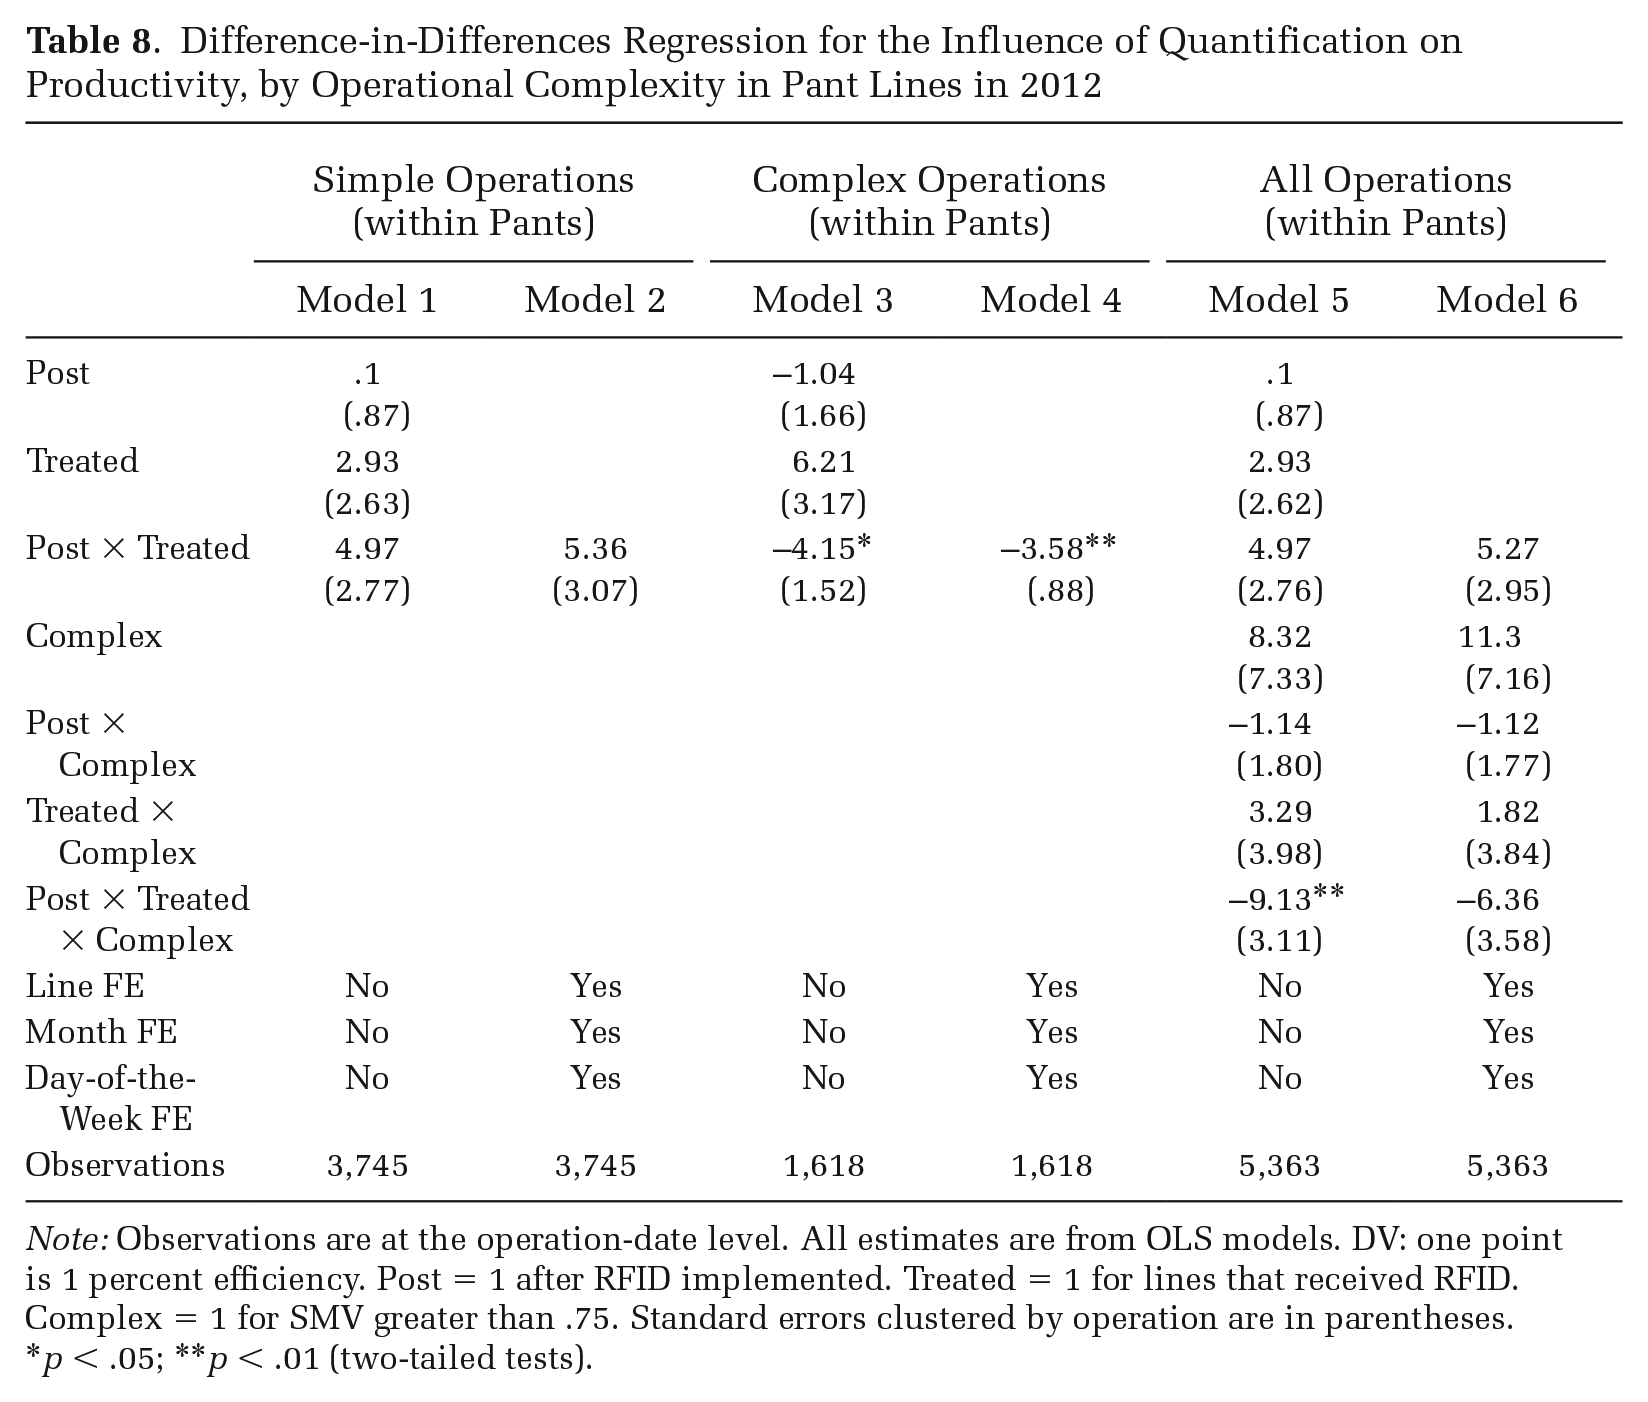
Note: Observations are at the operation-date level. All estimates are from OLS models. DV: one point is 1 percent efficiency. Post = 1 after RFID implemented. Treated = 1 for lines that received RFID. Complex = 1 for SMV greater than .75. Standard errors clustered by operation are in parentheses.
p < .05; **p < .01 (two-tailed tests).
Columns 3 and 4 in Table 8 restrict analysis to complex pant operations (SMV > .75). Compared to nontreated pant operations, efficiency declined by 4.15 and 3.58 percentage points in the treated operations, before and after including fixed effects. These differences are significant, with p < .05 and p < .01, respectively; they are also substantive, representing declines in efficiency of 6.2 and 5.4 percent relative to the prior efficiency of complex operations.
Columns 5 and 6 of Table 8 include all operations and test whether the influence of quantification on simple and complex operations differs. The resulting coefficients of −9.13 (p-value: .005) and −6.36 (p-value: .08) are substantial (representing differences of over 15 and 10 percent of mean productivity on pant lines) and statistically significant in the reduced model at the .01 level.
The product-level analysis features only two products, but the operation-level analysis entails numerous pant operations with varying SMV ratings, allowing us to further estimate the influence of the measurement technology at different intervals of complexity. We estimate the post-treatment difference in percent efficiency of treated operations at eight discrete SMV values, rounding the value of each operation to the nearest tenth. Functionally, this is equivalent to running the regression in Table 8, column 6, but with interaction terms for each discrete bin of complexity at .1 SMV interval. Figure 3 presents coefficient estimates and standard errors.
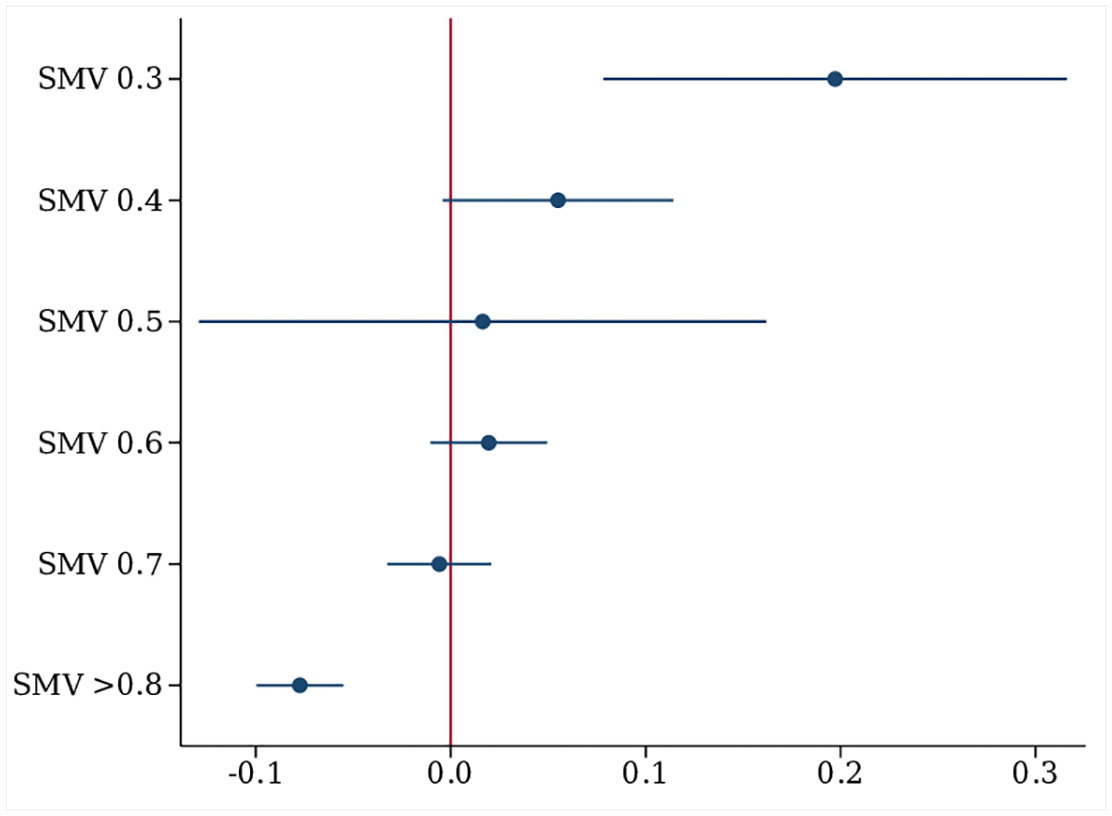
Difference-in-Differences Estimates of the Influence of Quantification on Productivity in Pant Lines by Operation Complexity Bins
As Figure 3 shows, the error bars are relatively large within any single category of SMV values. Nonetheless, the results suggest a negative relationship between complexity and the impact of the measurement technology on productivity. Consistent with the earlier regression results, this finding is driven by gains in productivity in the simplest operations and losses in productivity in the most complex operations.
In summary, these results show that the influence of the quantification treatment was positive for the simple operations but negative for the complex operations, and this difference in the effect of quantification was statistically significant. We further show that the results are robust to estimating the influence of quantification at discrete intervals of complexity. This set of results supplements our analysis using product-level variation in complexity and offers further support for our hypotheses, using our second measure of complexity at the operation level.
Alternative Explanations
Thus far, we have estimated the differential influence of quantification of work on workers’ productivity by work complexity, using product-level and operation-level measures of complexity. We recognize that the product-level measure of complexity raises the possibility that pant and jacket production could be correlated with some factor other than complexity that yields productivity gains or losses from quantification. However, the subsequent operation-level analysis compares the influence of quantification of work on relatively simple and complex operations within pant lines and finds very similar results, ameliorating that concern. Furthermore, Figure 3 goes beyond a binary categorization of simple and complex operations within pant lines to show the influence of quantification at small intervals of complexity. This significantly narrows the range of alternative explanations, because any alternative explanation simply rooted in differences between pant and jacket production would be insufficient to explain our findings.
A few alternative explanations remain; we test for four such possibilities. First, we test for different compositions of workers across simple and complex lines and operations, with respect to capabilities and personalities that could drive differences in productivity in response to quantification. Second, we test for differences in motivation between workers assigned to simple and complex lines and operations, arising from career structures or status differences that could explain our results. Third, we test for differences in task interdependence in the organization of simple and complex work. Finally, we test whether mean reversion—the tendency, if a variable is extreme on its first measurement, to be closer to the mean or average on its second measurement—could account for our findings. Appendix Tables A3 to A6 correspond to the four alternative explanations and present evidence ruling out each one. These alternatives are unlikely to explain the results we presented, but we recognize they could operate in other settings.
Discussion
This article seeks to determine how and when quantification of work affects worker productivity. We used a full-cycle research design, conducting ethnographic fieldwork and interviews to develop theory and to generate hypotheses, and then testing our hypotheses using administrative data from the factory. Our qualitative data revealed that quantification can affect workers’ productivity via auto-gamification, which we define as workers’ inadvertent transformation of work into an independent, individual-level game. The data identified three conditions enabling this mechanism: (1) a clear personal objective, (2) competition with oneself, and (3) private, real-time feedback. The qualitative data also generated hypotheses about differential consequences of quantification of work depending on the complexity of the work performed: auto-gamification is motivating for simple work because quantified metrics adequately measure such work, but demotivating for complex work that quantified metrics cannot adequately represent in full. Consistent with our hypotheses, our quantitative data revealed that productivity increased on lines and operations performing simple work and declined on lines performing complex work.
Contributions to the Quantification Literature
Our article makes three important contributions to the study of quantification. First, we show how quantification of work, in itself, can affect worker behavior and performance. Sociologists have noted the spread of quantification in a variety of domains, including education (Espeland and Sauder 2016) and the credit market (Kiviat 2019a), but have devoted less attention to quantification of the work of individual employees. In particular, research on quantification in the workplace, such as among journalists (Christin 2018), police officers (Brayne 2017), and Uber drivers (Rosenblat and Stark 2016), cannot disentangle the process of quantification from the purpose of quantification sufficiently to study the pure effects of measurement. In many settings, quantification is a means to an end, but our case allows us to investigate what happens when no purpose is attached to quantification. We find that quantification still has an effect.
Second, we introduce the novel mechanism of auto-gamification, through which quantification affects workers’ behavior and performance. We show that the simple act of quantification can inadvertently change the behavior it purports to measure, even in the absence of formal changes in incentives, knowledge creation, and new regimes of control that the existing literature has theorized about (Levy 2015; McAfee et al. 2012; Sauder and Espeland 2009). Numbers are the building blocks of many games; thus, simply affixing a number to a social phenomenon can lead workers to turn work into an individual game, resulting in performance changes. Outside of work, too, we expect to observe auto-gamification in response to quantification. For example, Fitbit users’ reactions to data quantifying their real-time physical activity could be guided by auto-gamification.
Third, we demonstrate that quantification of work can elicit divergent responses from workers depending on the complexity of the work being performed. The quantification literature tends to assert that quantification promotes standard reactive practices because it is essentially a vehicle of commensuration, transforming complex qualities into simple, comparable quantities that share a metric (Espeland and Sauder 2007). We argue, however, that some numbers better represent the phenomena they claim to capture. In the case of simple work, workers are likely to accept the validity of the quantified metrics, motivating gamification and productivity improvements. In the case of complex work, workers are less likely to see unidimensional quantified metrics as reasonable and representative of their work, producing demotivating games and negatively affecting the work performance being measured. Thus, quantification of work does not always elicit convergent reactions; sometimes it produces divergent responses. Future research should examine features other than complexity that could moderate the effect of quantification on workers’ performance, so that work unsuited to quantification is not subject to the “tyranny of metrics” (Muller 2018).
Contributions to the Literature on Work Games
Our article also offers two contributions to the sociological literature on work games. First, this literature has theorized about work games that are social in nature, co-opted by management, and permeate shop-floor culture (Burawoy 1979; Sallaz 2009; Sherman 2007). We theorize instead about workers’ individual-level transformation of work into a game, independent of one another and of management. We argue that, when workers can identify an objective to “win” at the game, compare current performance to past performance, and access information on where they stand, they are likely to auto-gamify their work. This form of auto-gamification is particularly important for scholars of work to consider as more work becomes mediated by technology. Algorithmic systems have been shown to promote interactivity (Christin 2020; Kellogg et al. 2020). However, our research suggests that even in the absence of nudges and notifications that Uber and other digital platforms might send workers to encourage them to work faster, simply sharing quantitative performance data might lead workers to create individual auto-games that affect productivity and produce consent to work.
We also consider how auto-gamification affects workers’ behavior. The literature suggests work games are almost always motivating in that they lead individuals to “lose themselves” (Burawoy 1979; Sallaz 2013). We do not find that to be the case in our setting: when work is simple and quantified metrics “make sense” to workers, the game is fun; when work is complex and quantified metrics devalue workers, the game is discouraging.
Contributions to the Literature on Technology and Organizations
Finally, we contribute to the literature on technology and organizations (Orlikowski 2007; Zuboff 1988). We demonstrate that, just as organizational context moderates technology’s influence on work (Barley 1986; Orlikowski 1992), the task environment can also moderate how technologically mediated quantification affects workers’ motivation and productivity. The theory presented here can be viewed as one “inner layer” of the totality of human and technological interaction within a given organizational context. Thus, the theory co-exists usefully with the “soft determinism” of social-construction perspectives that view technology as both an objective and an emergent phenomenon (Barley 1986; Orlikowski and Scott 2008).
Limited attention has been paid to how task characteristics like complexity interact with technological initiatives to affect worker outcomes. Given that level of complexity is a core feature of work (Hackman and Oldham 1976), it seems reasonable to expect the influences of a particular technology will depend in part on its interaction with task complexity. Our measure of complexity implies that simple tasks take less time, and workers who perform them therefore complete more of them each day. Deeper inquiry is needed into which attribute of simple work—shorter tasks or more frequent completion—contributes to the positive influences of quantification on productivity, and, more broadly, the interplay between work complexity and new technologies in the workplace.
Generalizability
The factory we studied had a predominantly female workforce. Some scholars attribute the interpersonal competition and social “work games” that Burawoy (1979) observed to norms of masculinity (see, e.g., Davies 1990). However, we doubt that the auto-gamification we observed is a gendered phenomenon. Indeed, there are anecdotal accounts of auto-games in more gender-neutral occupations, such as driving for Uber (Cameron 2019). Similarly, although we study one garment factory in India, we expect our theory to be applicable outside of the Indian context.
We studied a context devoid of incentives, big-data analytics, or disciplinary measures, which offered us theoretical cleanliness. In many organizational settings, however, including among stockers at Amazon’s warehouses (Rosenblat, Kneese, and boyd 2014) and truck drivers (Levy 2015), quantification goes hand-in-hand with explicit surveillance. We expect our findings to generalize to these settings, but future work should systematically investigate how workers respond to these bundled interventions.
We consider the implications of quantification of work by investigating differences in work complexity. In an absolute sense, however, the difference in complexity at the garment factory is small: the complex garment operations are probably less complex than typical jobs in other settings. For example, the work performed by doctors is significantly more complex than the complex operations we study. We view the small differences in complexity we study as an asset of our research design: if even these minute differences in complexity produce dramatic differences in how quantification affects productivity, we expect the moderating effect of work complexity to be even more salient in other contexts. Similarly, we expect workers to have even greater opportunities to engage in auto-gamification when they enjoy more autonomy at work. Thus, the estimates from our study can be thought of as conservative.
Implications of Auto-Gamification for Simple Work: Hyper-Individualization and Rise of Self-Control?
A large class of occupations, ranging from truck drivers to restaurant workers, perform “simple work” (Hubbard 2000). Our study predicts that, in these occupations, quantification will raise productivity via auto-gamification. What are the broader implications of auto-gamification for the organization of such work?
One unintended consequence of quantification might be a hyper-individualization of work, more extreme than what Burawoy (1979) observed. Burawoy (1979) argued that work games engage workers as individuals—competing with one another, engrossed in their personal productivity—rather than as members of a class. Auto-gamification offers even more room for individual initiative and imposes less need for coordination. In social games, co-workers interact to determine who is “winning,” to complain about impediments to winning, and sometimes to collaborate (Sallaz 2002; Sherman 2007). Auto-games dispense with even these basic interactions: as pure interactions between a worker and a technological object, such games reinforce individualism as the mechanism whereby work fits into the political economy.
Furthermore, the process of obscuring and securing the generation of surplus value at the point of production might be reinforced when quantification gives rise to auto-gamification. Edwards (1979) described the evolution of three types of control: (1) simple control, in which supervisors bark orders and workers wage petty battles to keep pace; (2) technical control, in which the pacing of the machine is a less conspicuous but demanding form of control; and (3) bureaucratic control, in which rules govern workers’ evaluations, pay, and promotion prospects. Over time, an overall trend toward “camouflage control” has contained conflict (Chai and Scully 2019). In line with this trend, we posit, quantification facilitates what Simpson (1985:419) called “self-control,” in which “individuals control their own work.” Simpson (1985) anticipated that self-control would proliferate among professionals and self-employed proprietors, but quantification enables self-control even in classic manufacturing settings via auto-gamification. Workers absorbed in spontaneous individual games may control themselves without realizing it.
Self-control as a byproduct of quantification in simple work contexts might diminish the need for managerial surveillance altogether. Resistance to surveillance might weaken: when quantification promotes individualism and reduces social interaction via “auto-games,” workers might fail to organize to detect and then subvert surveillance. Unions have historically relied on solidarity—a sense of collective spirit and membership in the working class—to organize workers and make demands of employers; their role amid rising quantification remains to be seen.
Quantification is a powerful tool for organizations, and this tool needs to be used with care. Organizations that perceive a benefit from auto-games will likely let these games proliferate unchecked. Professional associations and other worker-controlled institutions can potentially reclaim from corporate management the power to redefine “good work” in a manner that allows for useful economic production while preserving workers’ well-being. In summary, as quantification becomes more prevalent in the world of work, it is imperative that we enrich our theoretical understanding of how workers respond in order to inform how quantification is implemented. Our study takes an important first step in this direction.
Footnotes
Appendix
Mean Productivity of Treated and Nontreated Complex Product Lines in the Pre-treatment Period
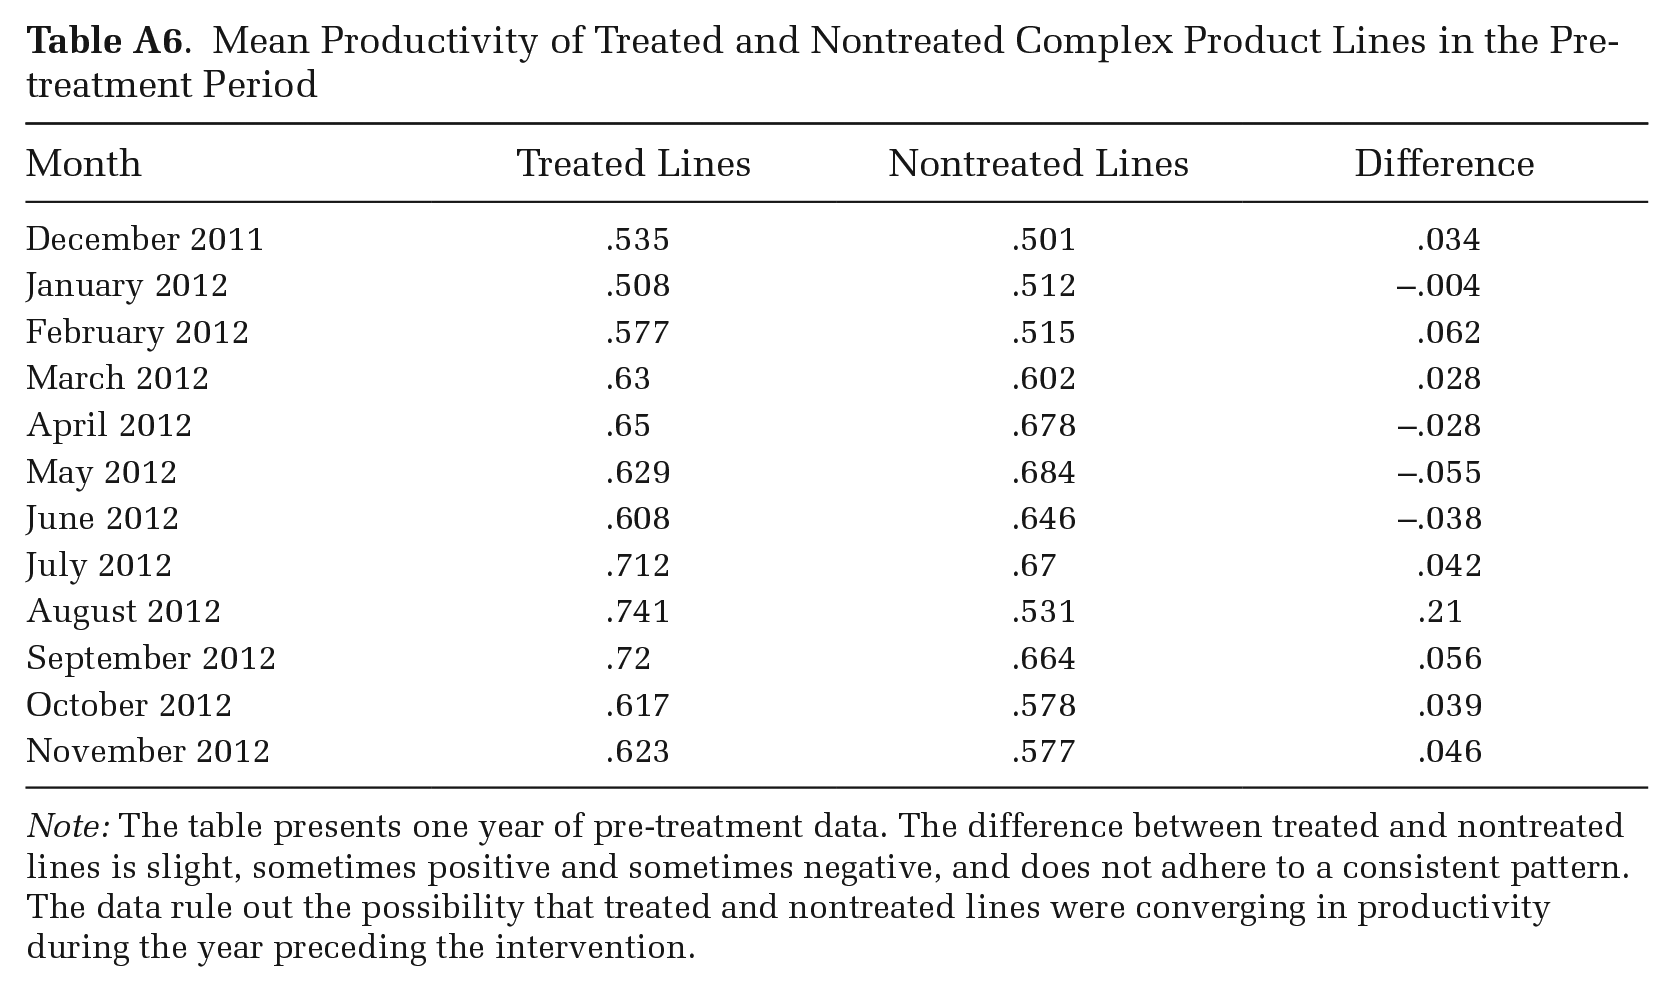
| Month | Treated Lines | Nontreated Lines | Difference |
|---|---|---|---|
| December 2011 | .535 | .501 | .034 |
| January 2012 | .508 | .512 | −.004 |
| February 2012 | .577 | .515 | .062 |
| March 2012 | .63 | .602 | .028 |
| April 2012 | .65 | .678 | −.028 |
| May 2012 | .629 | .684 | −.055 |
| June 2012 | .608 | .646 | −.038 |
| July 2012 | .712 | .67 | .042 |
| August 2012 | .741 | .531 | .21 |
| September 2012 | .72 | .664 | .056 |
| October 2012 | .617 | .578 | .039 |
| November 2012 | .623 | .577 | .046 |
Note: The table presents one year of pre-treatment data. The difference between treated and nontreated lines is slight, sometimes positive and sometimes negative, and does not adhere to a consistent pattern. The data rule out the possibility that treated and nontreated lines were converging in productivity during the year preceding the intervention.
Acknowledgments and Funding
For helpful comments, we thank Ethan Bernstein, Angele Christin, Hengchen Dai, JP Ferguson, Amir Goldberg, Arvind Karunakaran, Kate Kellogg, Barbara Kiviat, Tom Kochan, Adam Seth Litwin, Carrie Oelberger, Wanda Orlikowski, Erin Reid, Ching Ren, Amanda Sharkey, Jesper Sorensen, and Ezra Zuckerman, as well as attendees at the Wharton People & Organizations Conference, Wharton People Analytics Conference, Organization Science Winter Conference, Organizational Ecology Conference, University of Michigan Mitsui Symposium, American Sociological Association meetings, Academy of Management meetings, and seminar participants at McGill University, George Washington University, Massachusetts Institute of Technology, Northwestern University, University of Southern California, London Business School, Washington University in St. Louis, Stanford University, and University of Minnesota. We are grateful for the financial support from Massachusetts Institute of Technology’s Tata Center for Technology and Design. We thank Ishwarya Thyagarajan for assistance with fieldwork. The views expressed here are exclusively those of the authors.