



Abstract
We study the events alleged in recent Norwegian salmon industry antitrust cases to explore the relationship between vertical integration, public price indexes, and collusion. The salmon market provides an intriguing opportunity to study these issues, as there was a vertical merger followed by a reformulation of the methodology by which prices were reported for a new price index. We explore whether the confluence of the merger and the creation of the Nasdaq price index is associated with evidence consistent with collusion.
I. Introduction
On February 19, 2019, the European Commission (EC) carried out raids on several Norwegian companies comprising some of the world’s largest suppliers of farm-raised Atlantic salmon. In a statement confirming its investigation, the EC cited “concerns that the inspected companies may have violated EU antitrust rules that prohibit cartels and restrictive business practices.” 1 Several months later, the U.S. Department of Justice (DOJ) Antitrust Division launched its own investigation. 2 Subsequently, direct U.S. seafood purchasers filed a class action suit against five Norwegian suppliers—Mowi (Marine Harvest), Leroy Seafood, Grieg Seafood, SalMar, and Cermaq Group. 3 In May 2022, these firms agreed to a US$85 million settlement with direct seafood purchasers in the United States. 4
In this article, we study the events alleged in these antitrust cases to explore the relationship between vertical integration and collusion. In particular, we are interested in whether vertical integration can facilitate the strategic use of price indices as a collusive device. The salmon market provides an intriguing opportunity to study these issues because there were both increasing vertical integration and a redesign of the industry-produced public price index during the period when collusion is alleged. By early 2012, major Norwegian farmers and the Oslo exchange for fish products were discussing a new methodology for reporting the spot price of salmon products. This method—formalized in April 2013 when an existing, industry-produced price index was abandoned in favor of the new (Nasdaq) index—provided vertically integrated salmon farmers the opportunity to report purchase prices directly to the index for the first time. While we are not able, based on the publicly available evidence, to comment on the existence of explicit collusion or the intent of these actions, the economics suggests that the vertical and horizontal combinations observed in this industry made it vulnerable to the anticompetitive use of industry-produced price indices. Several of the other studies of “protein markets” in this symposium note the role of price indices in collusive efforts; similar claims have been made in markets as varied as financial services and airlines, suggesting that attention to their role in facilitating collusion is warranted, especially in industries with similar consolidated structure.
Section II of the paper examines changes in the economic structure and performance of the salmon industry in the decades leading up to these charges. Section III briefly reviews the strategic use of price indices both theoretically and in other industries. Section IV outlines the key facts relevant to the alleged collusion, including the redesign of the price index, and measures the impact on prices. Section V concludes with potential implications for antitrust policy.
II. Salmon Industry
Over the period 1999–2019, the price and profitability of Norwegian farm-raised salmon showed an increasing trend (Figures 1 and 2). To better understand the performance of this market, we need to first put contours around the market under consideration. There are two types of salmon: Atlantic salmon and Pacific salmon. Atlantic salmon is mostly “farm-raised” in the sense that the salmon is harvested under controlled conditions for commercial purposes, excluding wild-caught salmon. 5 Pacific salmon is mostly wild-caught from locations bordering the Pacific, including Canada, Washington state (the United States), and Chile (Table 1). 6 Farm-raised salmon accounts for the majority of worldwide salmon production and consumption. 7 We focus our analysis on Norwegian supplied farm-raised Atlantic salmon, as over half of the farm-raised Atlantic salmon is Norwegian. 8
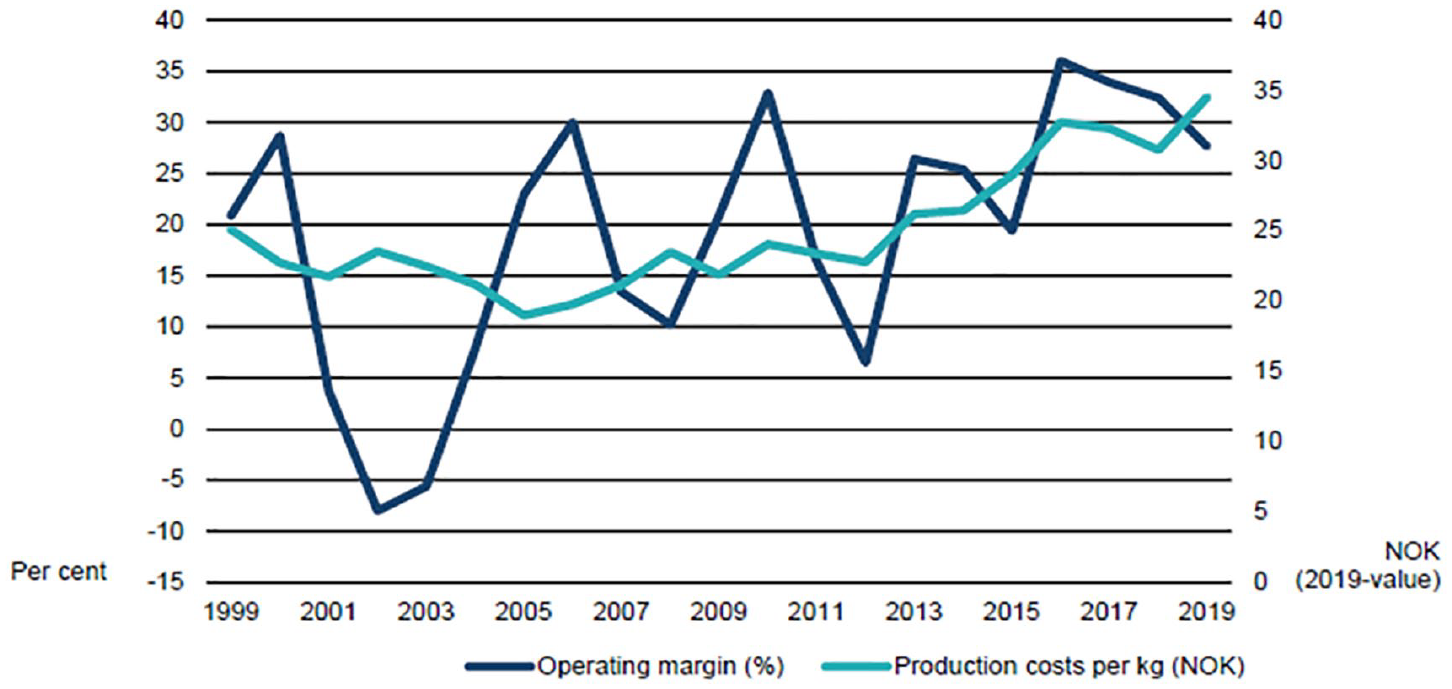
Operating margins and production costs of Norwegian salmon farmers.

Norwegian farm-raised salmon prices (NOK), 2000–2020.
Salmon Production in 2018: Top Five Global Production by Country.

Source. Atlantic salmon (Salmo salar), Compassion in World Farming (September 28, 2021) (https://www.compassioninfoodbusiness.com/media/7447055/atlantic-salmon-in-numbers.pdf).
We distinguish several stages in the production and distribution of farm-raised Atlantic salmon (Figure 3). The primary end products of salmon are either whole fillets or smoked salmon. “Farming” is the first step in the production process. Farming includes breeding, growing, and harvesting the salmon. In all salmon-producing regions, farming Atlantic salmon requires licenses. These licenses are typically given by an auction mechanism. In Norway, licenses are granted through the Norwegian Industry of Trade Fisheries.
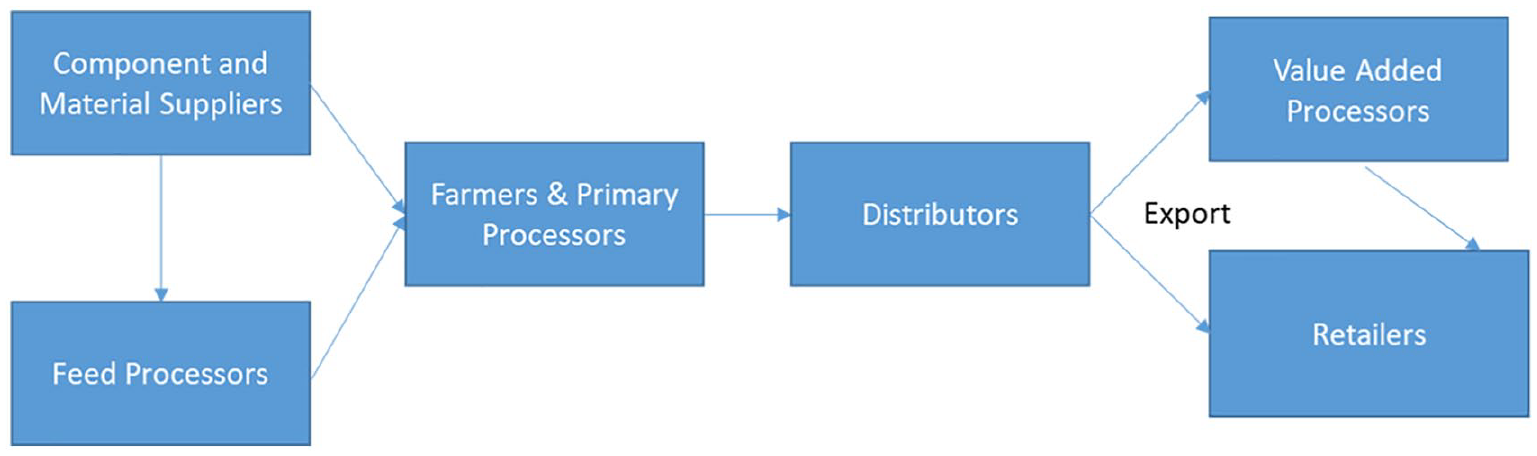
Stylized supply chain of farmed Atlantic salmon.
Primary processing includes the stages that slaughter, gut, chill, and (sometimes) fillet the salmon. 9 These steps are typically performed directly on salmon farms, using slaughtering facilities and other equipment. Many of the largest farming entities own slaughtering facilities including the well boats for fish transport and the primary processing. Given the location specificity of primary processing, all major farmers are vertically integrated into primary processing (hence, farming and primary processing are a single entity in Figure 3). 10
Primary processed salmon (either head-on-gutted [HOG] or head-off-gutted) is also graded by quality. For simplicity, we limit attention to “superior” quality salmon. 11 As of 2018, about 80 percent of Norwegian superior quality, HOG salmon was exported outside the country. The rest was sold to Norwegian buyers. We call any entity who sells superior quality, HOG salmon a “farmer.”
Farmers sell to three types of buyers: value-added processors, distributors, and retailers. For example, in 2012, Mowi Norway sold 57 percent of its salmon to value-added processors, 29 percent to distributors, and 13 percent to retailers. 12
Value-added processing prepares the fish for consumption as fillets, portions, smoked salmon, or other final products. It performs these steps through filleting, fillet trimming portioning, smoking, marinating, and breading. It is more labor-intensive than primary processing and often occurs in lower wage markets. 13
Retailers purchase gutted salmon from distributors and processed salmon from value-added processors. They sell the end product to restaurants and food establishments or direct consumers. Value-added processors may purchase salmon directly from farmers or they may rely on distributors. Distributors often handle the export of salmon, supplying both value-added processors and retailers in countries around the world. Some retailers also possess secondary processing ability. 14
A. Industry Structure
The five alleged cartel participants—Mowi, Grieg, SalMar, Leroy, and Cermaq—comprised the five largest firms between 2011 and 2020. 15 Since 2011, the top five (top ten) Norwegian salmon farmers have produced 52–58 percent (65%–70%) of farm-raised Atlantic Norwegian salmon. 16 There appears to have been significant horizontal consolidation in the industry since the early 2000s, with the alleged cartel members acquiring many other farmers (Table 2 and Figure 4). 17 The five largest producers, Mowi, Grieg, SalMar, Leroy, and Cermaq, are all vertically integrated into distribution (Table 3 and Figure 5).
Number of Acquisitions in Salmon Farming Industry of Norway.

Source. Salmon Industry Handbook series by Mowi, 2011–2021. The total number of acquisitions includes partial acquisitions, as reported in the Salmon Industry Handbook by Mowi. Those “involving cartel members” includes any acquisitions, including partial acquisitions, involving any of the five firms named in the civil suit: Marine Harvest (Mowi), Leroy Seafood, Grieg Seafood, SalMar, and Cermaq Group.
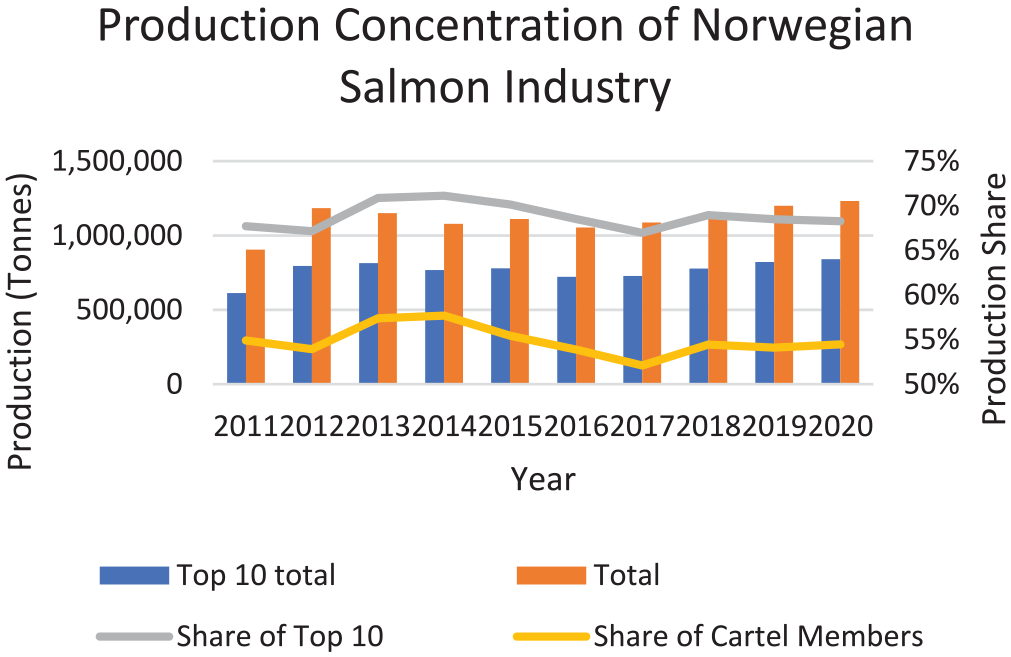
Production concentration of Norwegian salmon farmers, 2011–2020.
Five Largest Producers’ Position in the Supply Chain.

Source. Annual reports of the five companies: Mowi Annual Report 2020 (https://corpsite.azureedge.net/corpsite/wp-content/uploads/2021/03/Mowi_Integrated_Annual_Report_2020.pdf).
Grieg Seafood Annual Report 2021 (https://cdn.sanity.io/files/1gakia31/production/8699f764225f2b441044453452ada7923cca1994.pdf).
Leroy Annual Report 2021 (https://www.leroyseafood.com/globalassets/02--documents/arsrapport-2021/leroy-annual-report-eng-2021.pdf).
Salmar Annual Report 2021 (https://ml-eu.globenewswire.com/Resource/Download/3781f230-d728-4a34-9ba3-53d59a8db537).
Cermaq Annual Report 2013 (https://www.cermaq.com/assets/Global/PDFs-sustainability/Cermaq_Annual_Report_2013_web.pdf).

Norwegian farmed salmon structure for major producers.
In late 2012, the parent companies of Mowi and Morpol agreed that Mowi would purchase 48.5 percent of Morpol’s shares. As a result of this acquisition, Mowi became the largest shareholder of Morpol. 18 During 2013, Leroy acquired approximately 48 percent of Villa Organic, and SalMar acquired approximately 50 percent of Villa Organic. 19 Villa Organic is a fully integrated salmon processor. Thus, during this period, at least three of the five largest farmers were integrated forward into both distribution and value-added processing, and two of those firms jointly owned the downstream firm (Table 3). Figure 6 illustrates the vertical integration achieved by these mergers and the associated changes in industry structure.

Norwegian farmed salmon structure post-2013.
In 2012, Mowi SA was the world’s largest salmon farmer, conducting farming and primary processing in Norway, Chile, Scotland, Canada, Ireland, and the Faroe Islands. 20 Its annual production of farm-raised Atlantic salmon was around 37,000 metric tons. 21 Mowi also conducted secondary processing in Norway, Chile, as well as other locations. Morpol, the second largest salmon primary processor, was also integrated backward into salmon farming. It carried out farming in Norway and Scotland. It had annual production of about 27,000 metric tons. 22 On September 30, 2013, the EC approved the full acquisition of Morpol by Mowi subject to Morpol divesting the majority of its salmon farming and primary processing in Scotland. This required divestiture resulted from the EC’s concerns that the full acquisition would have “significantly impeded effective competition in the market . . . .” 23
B. Spot Markets, Forward Markets, and the 2013 Price Index Redesign
Traditionally, Norwegian farm-raised Atlantic salmon has been bought and sold in bilateral agreements between farmers, distributors, value-added processors, and retailers (Figure 3). Most physical transactions between salmon farmers and their direct customers occur through long-term contracts and the rest through spot markets. According to the direct purchasers, “Approximately 1-2.5% of Norway’s salmon production is sold on the spot market.” 24 Beginning around May 2006, market participants and Norwegian regulators created a market to trade salmon forward contracts. 25 This marketplace—called the Oslo Fish Pool—allows buyers and sellers to contract on a price and volume of salmon to be closed in a future month. The futures contract is closed based on the spot price realized in that month.
Since at least 2007, the Oslo Fish Pool has allowed trading in forward contracts (futures) for salmon. This is a regulated securities exchange used by industry participants and financial investors. The Oslo Fish Pool produces a weekly spot price index of HOG salmon. This spot price index is the weighted average of sales prices across each weight class (from 1 to over 9 kg), reported in Norwegian kroner. 26 The spot price index is constructed from reports of independent distributors of the price they paid to primary processors (the transactions at the very center of Figure 3). The Oslo Fish Pool spot price index is widely observed by market participants. The index is used to settle forward contracts at each month of maturity. The reported transactions between individual parties are not observable to the wider market through any other type of information transmission mechanism.
The 2012 and 2013 mergers described above altered the supply chain from that of Figure 3 to that of Figure 5 for key players in the salmon industry. Because the pre-2013 NOS Index only included market transaction prices from independent distributors, it would have excluded a large proportion of the salmon market. The Pool changed its methodology for calculating this index in 2013. “Since spring 2012, NOS and Fish Pool have worked closely together with key players in the salmon industry to establish a new and improved salmon spot price.” 27 The new Nasdaq Index was constructed from reports of distributors (including those who were vertically integrated) of the price at which they transferred salmon to value-added processors or retailers (the transactions at the right side of Figure 3). 28 The Nasdaq Index was launched in April 2013; the NOS Index was discontinued shortly thereafter. Given the vertical integration that had occurred in the industry, the new Nasdaq Index was more comprehensive than the NOS in its coverage.
The Nasdaq Index constitutes 95 percent of the “Fish Pool Index” (FPI). FPI is the Monthly Settlement Price used for financial settlement of all futures contracts at Fish Pool ASA. The other 5 percent comes from an index, known as the SSB, produced by Statistics Norway based on transaction records from Norwegian Customs’ system. 29 Despite the efforts of the Fish Pool, the futures market remains fairly thin. 30 It is not known whether the NOS, the Nasdaq, or the FPI is used to determine settlement prices for the delivery of salmon sold through forward contracts. Mowi reports that forward contracts comprise between 20 and 50 percent of its sold volume. SalMar’s 2018 annual report states that 39 percent of its production volume was sold under contract. 31 If forward contracts are contingent on spot market prices, the index would thus have an impact on a larger share of sales in the industry.
III. Economic Underpinnings: Vertical Integration and Price Indices
Competition agencies recognize that vertical integration between upstream and downstream firms can facilitate a collusive outcome in the upstream market. 32 The framework that policy makers draw on includes theoretical work articulating collusive equilibria in which vertically integrated firms exclude firms that refuse to collude or that deviate from a collusive agreement and the ability of vertically integrated firms to monitor the activities of other firms at different points in the supply chain. 33 The 2020 U.S. Justice Department Vertical Merger Guidelines specify at least two mechanisms through which vertical integration can facilitate collusion. One is to eliminate a “maverick” that might limit coordination in the relevant market, which appears not to be relevant in this case. 34
The 2020 Vertical Merger Guidelines also consider the possibility that vertical integration may facilitate collusion by making it easier to monitor price and detect cheating. For example, several of Mowi’s farmer competitors are not integrated. If an unintegrated competitor deviates from a collusive agreement, the Morpol processing entity might be in a position to observe this and make Mowi aware of this cheating. This would reduce the competitor’s incentive to deviate. More generally, Nocke and White find that vertical integration reduces the incentive of a non-integrated competitor to deviate and does so more than it reduces potential punishments. 35
The economics literature has also addressed the possibility of collusion associated with forward trading in oligopolistic markets. 36 There are multiple general, not mutually exclusive, ways that markets with spot and forward prices are vulnerable to collusion and strategic manipulation. In these markets, some trades are made in spot markets, and there is a mechanism by which the prices in (some of) those spot market trades are turned into a public price index. That public price index is then the basis for determining state-contingent prices in (some) long-term forward contracts. Mechanisms that increase the spot market price index will have a magnified effect on producer profits because they increase realized contract prices. The mechanisms that increase the spot price can vary, depending on industry structure and institutions. For example, the spot market price could be used as a coordination device for firms to collude without direct communication. Alternatively, firms may strategically manipulate spot market sales with the goal of affecting the public index. In other cases, they engage in strategic reporting (or misreporting) of prices that are used in calculation of the index. Finally, firms may design the index to facilitate its manipulation by colluding firms. 37
The classic Socony-Vacuum case included spot market manipulation, in the form of organized purchases of “hot oil” that was depressing prices:
The basic idea was to match the majors with small independent refiners. Whenever the small refiner had hot oil that it was prepared to dump on the market, its dancing partner would buy up the oil and squirrel it away.” (p. 7) . . . The defendants were the majors that participated in the dancing partner program, their executives, and three Midwestern trade journals that published the spot market prices of gasoline. Generally, the indictment claimed that the defendants “combined and conspired together for the purpose of artificially raising and fixing the tank car prices of gasoline in the aforementioned spot markets, and [intentionally] . . . have maintained said prices at artificially high and non-competitive levels.” (p. 13) . . . Since the dancing partner program was clearly designed to affect the spot market price of gasoline, which in turn was the index for the major’s supply contracts with independent retailers, the program amounted to “price fixing.” (p. 24)
38
The mechanism for alleged collusion in the salmon industry appears to be tied to changes in the design of the price index. 39 No firm could unilaterally redesign the index, but working collaboratively, the largest firms did make this change. There are several ways that the redesign of this index may have served the interests of these firms. It is possible that vertically integrated firms in the salmon industry found it easier to coordinate firm behavior around a higher profit focal point through the redesigned index than was possible with the older index, especially given the latter’s reliance on reports from independent distributors. These vertical mergers may also have led the older index to become less representative of transactions at the nexus of primary processors and distributors because only a small share of such transactions was arm’s length. In contrast, many of the “transactions” reported for calculating the Nasdaq Index may not have been not arm’s length, but instead internal firm transfers. The price index may be relevant for the determination of prices for long-term forward, or futures contracts, providing the large, vertically integrated producers with an incentive to increase reported spot prices to increase contract prices. Given the role of the Nasdaq salmon price index in the construction of the FPI, it is also possible that there are profits to be earned by the impact of the redesign on the realization of prices in the futures market. If industry participants believe that the FPI is an efficient price, “an unbiased predictor of the spot price,” 40 increases in the FPI could lead to increases in buyers’ willingness to pay.
In certain other protein markets, there seems to be manipulation of public price indices. In this symposium issue, Li and Weisman as well as Alderman study alleged cartels in poultry and meat packing, respectively. The former case includes allegations of a price index susceptible to manipulation and the latter includes mechanisms to influence prices for spot and contract markets.
IV. Analysis and Discussion
We are not able to determine, based on publicly available evidence, whether there was strategic manipulation of the salmon price index. Here, we examine whether the available evidence is consistent with an increase in the price of salmon, whether measured by the industry-produced salmon index (NOS and then Nasdaq) or the statistical agency-produced price index (SSB), following the redesign of the private index in 2013.
Industry reports of annual price and quantity data from 2012 to 2013 report an average price increase from around 25 NOK to more than 40 NOK 41 (see also Figure 2). The total production of Norwegian salmon dropped slightly from 2012 to 2013, while the production of cartel members increased. 42 Price and quantity remained fairly constant from 2013 to 2015. We observe similarly that from 2015 to 2016, the Nasdaq Index dramatically increased. Both the total production and the production of cartel members dropped during this period. The 2016 price increase was likely to be caused by a biological shock to supply, but we have not been able to identify, from industry sources, any other shocks to supply or demand that would explain the observed price and quantity fluctuations. 43
One possibility is that focusing on salmon prices in Norwegian kroner is misleading, given the importance of global markets. Figure 7 presents salmon prices in U.S. dollars. The overall pattern, particularly the apparent increase in prices around the time of the mergers and the redesign of the industry price index, remains. We also compared the price of salmon to other proteins: Figure 8 shows the price of salmon, as reported by the International Monetary Fund (IMF), compared to the prices of beef, chicken, and pork between 2000 and 2019. While there is considerable variation in each series, and both beef and salmon seemed to have increased relative to chicken and especially relative to pork, there is no obvious relationship between the fluctuations in salmon and those of other proteins that would suggest a common underlying driver.
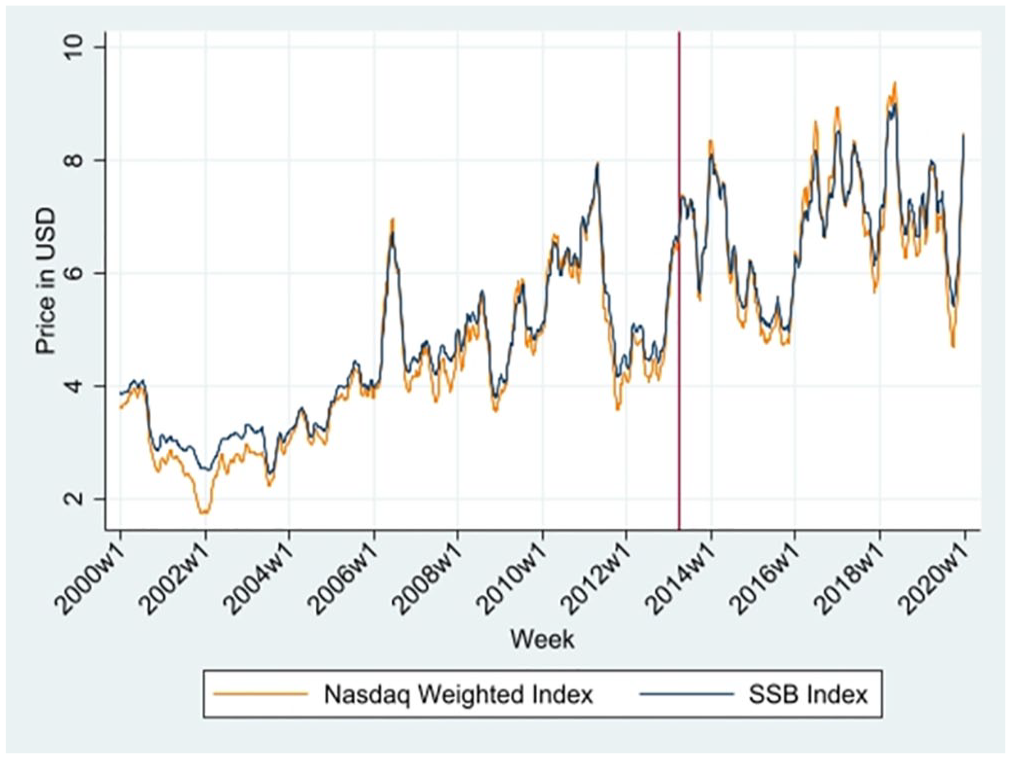
Salmon price in U.S. dollars, 2000–2019.
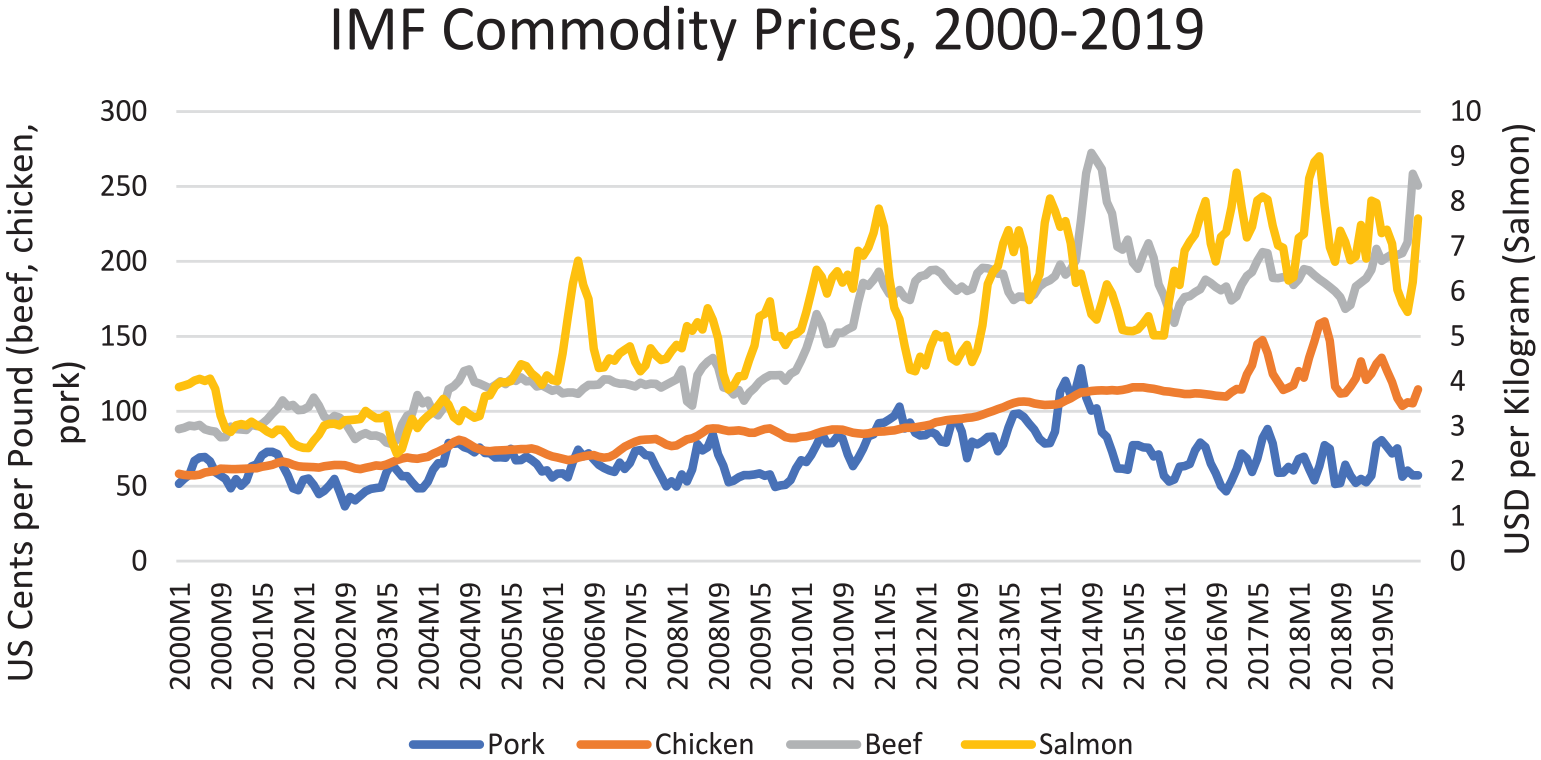
Prices of salmon compared to related proteins.
We also examine the important inputs to the production of farm-raised salmon: electricity, fish meal, and labor. Figure 9 presents electricity prices; Figure 10, fish meal prices; and Figure 11, average earnings (all Norwegian and all shown in Norwegian kroner). We also considered changes in productivity. While we do not have productivity data for the entire period in question, other research suggests that productivity increased during the 1990s and early 2000s (possibly at least partly as a result of the consolidation described above), suggesting that, if anything, we should see declines in price in the subsequent period (Figure 12).
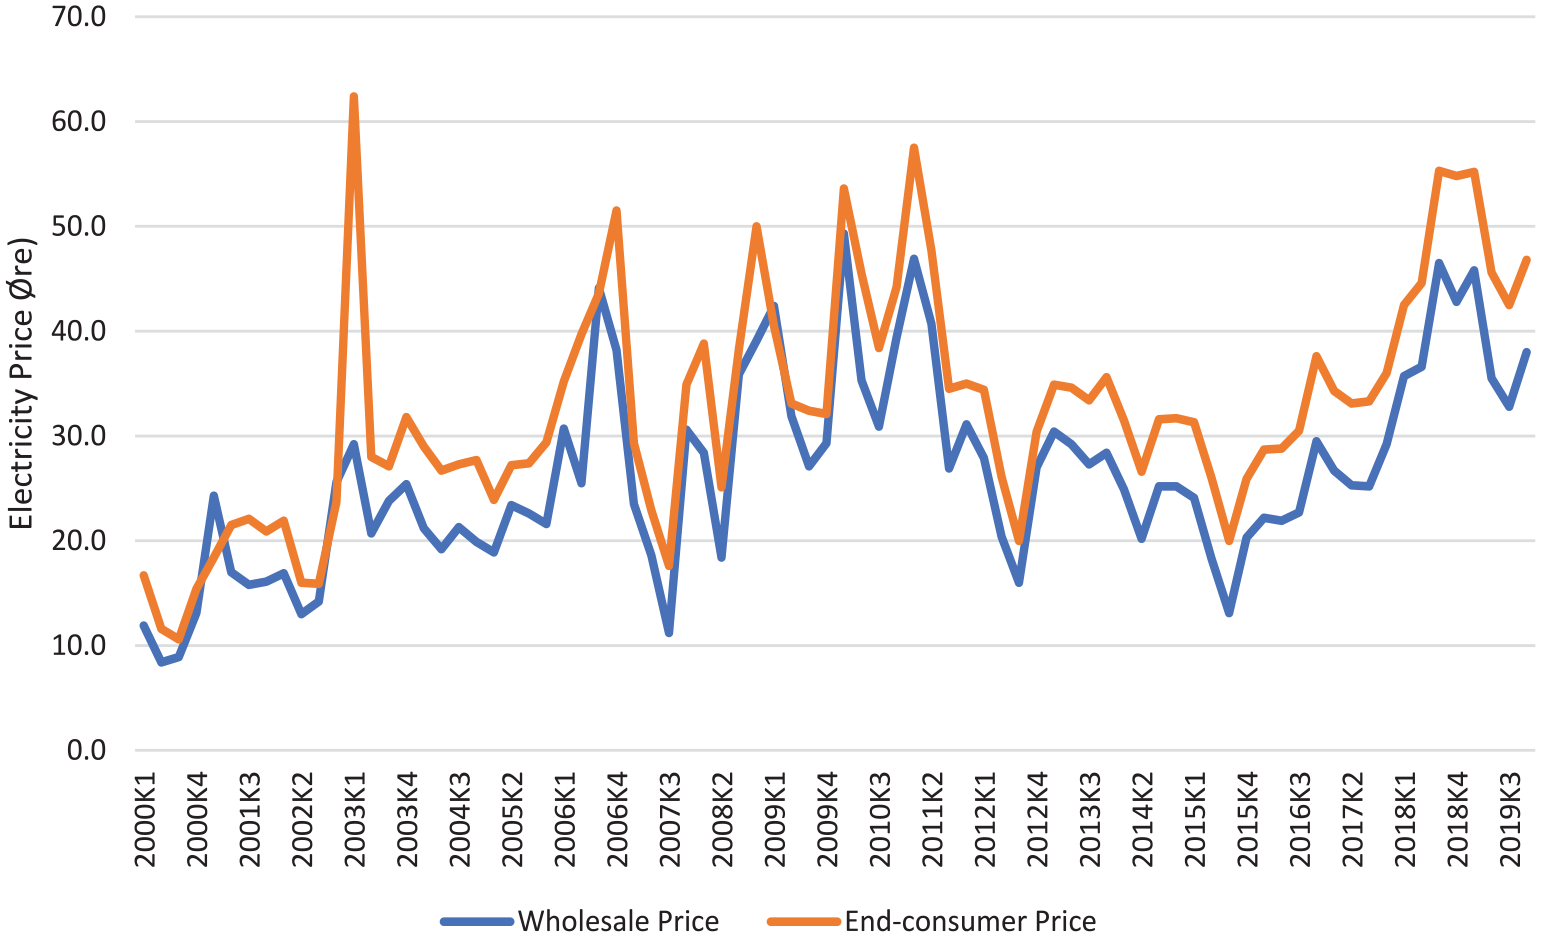
Electricity prices in Norway.

Fish meal prices, 2000–2019.
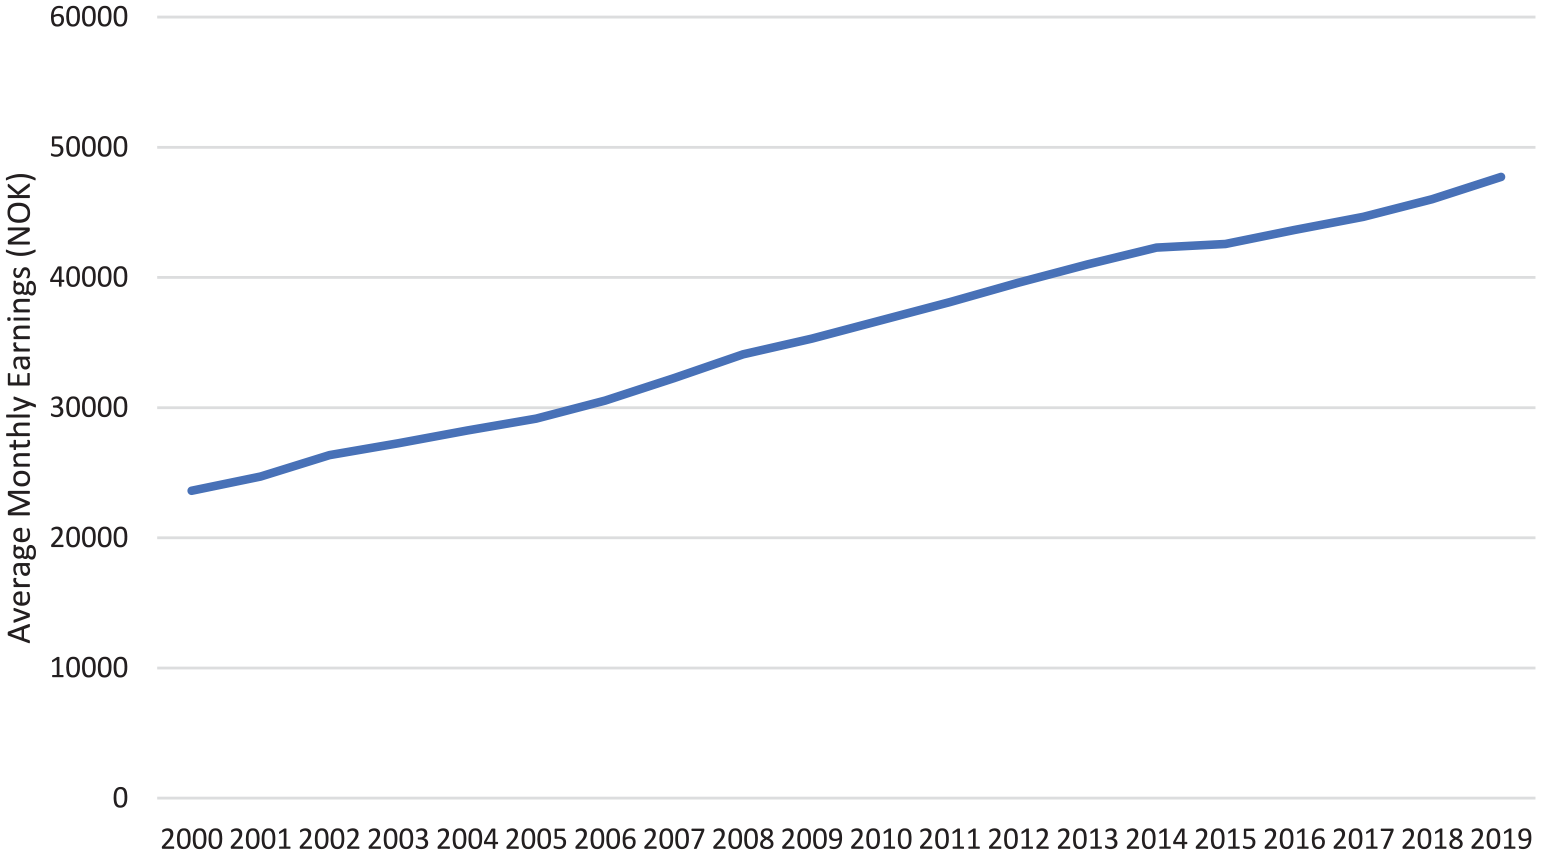
Labor earnings, 2000–2019.
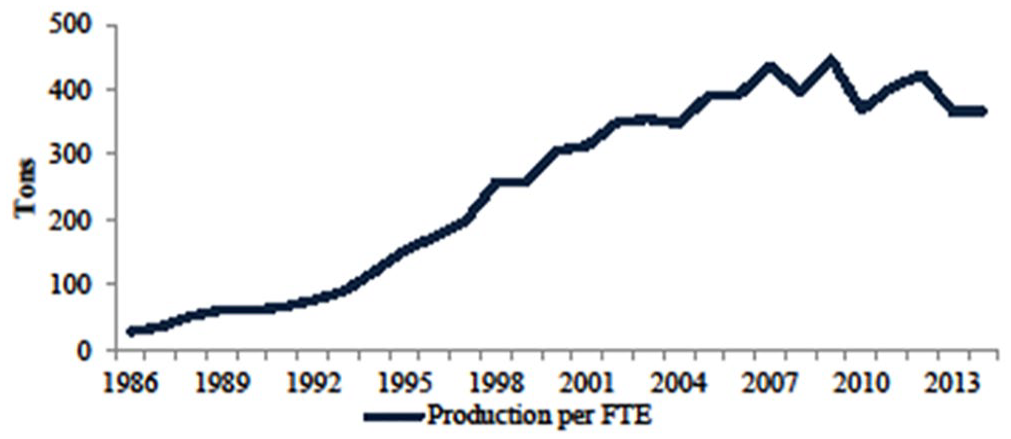
Norwegian salmon productivity, 1986–2013.
To further investigate the consistency of the empirical evidence with the allegations of strategic behavior, we compare the change in the industry price index (NOS and then Nasdaq) after 2013 to the change in the statistical agency index (SSB) after 2013. If there were strategic behavior, and if that behavior was successful, we would expect it to increase both price indexes. The industry-produced index would increase because the reports to the “salmon pool” would be of higher prices, and the statistical agency index would increase because the successful strategic behavior would have raised prices that were passed along to export prices. The measurement and estimation challenge here is that the industry price index itself changed at the time of the alleged change in behavior. In what follows, we use all available information to try to disentangle price changes from changes in the construction of the index. We do this by comparing the two price series (industry and statistical agency) while controlling for other potential demand and supply shifters. We estimate:

where
Summary Statistics.

Note. NK = Norwegian krone; SSB = Norway Statistics Bureau.
To disentangle an increase in the price of salmon from changes in the reporting process, we use data from all three price series (NOS, Nasdaq, and SSB). We use a two-way fixed effects regression to control for any change in the industry (NOS and Nasdaq) index relative to the statistical agency (SSB) index. The first fixed effect,
Estimating results are reported in Table 5. We present the results with and without control variables and using two different observation windows. In columns 1 and 2, we use an observation window of two years: from week 13 of 2012 to week 13 of 2014. In columns 3 and 4, we use a four-year observation window: from week 13 of 2011 to week 13 of 2015.
Estimation Results.

Note. t statistics in parentheses.
p < .05. **p < .01. ***p < .001.
For all regressions,
Note that
Estimated Average Price Levels (NOK): Two-Year Window.

Note. SSB = Norway Statistics Bureau.
V. Concluding Remarks
Our discussion and analysis cannot determine whether the firms in the Norwegian salmon industry engaged in collusion. Such an analysis would require more information than is presently available to us. Rather, our analysis suggests that prices did increase following the redesign of the price index. That redesign was led by the largest firms in the industry that had undergone considerable growth, both horizontal and vertical, to the extent that the sales and internal transactions of these large firms had a sizable impact on the industry price level. The ability of large integrated firms to influence the information that is available to all industry participants suggests another mechanism by which industry consolidation, both horizontal and vertical, may facilitate collusion. In this case, examination of forward contracts might help to determine whether changes in the spot price index could have a direct impact on contract sales.
Our aim is to raise awareness of this potential mechanism, both among antitrust economists and policy makers. Competition authorities should be attuned to this possibility when reviewing vertical mergers or complaints that vertical relationships are undermining competition. This concern may be relevant in commodities, agricultural, or aquacultural markets if public price indices are used to settle financial contracts in addition to serving as a benchmark for physical price negotiations. We also think that this industry, as well as several other studies in this symposium, suggests that economists modeling collusion should pay more attention to the role of public indices in inter-firm communication and price setting. This is true whether these indices facilitate tacit collusion or whether they are being directly manipulated to influence sales in related markets. While the implications for antitrust enforcement differ between these two scenarios, they both have the potential to adversely affect consumers and competition.
Footnotes
Acknowledgements
We are very grateful for comments from Roger Blair, Alex Raskovich, and participants in the November 2022 Southern Economic Association sessions on Collusion in Protein Markets.
Declaration of Conflicting Interests
The author(s) declared no potential conflicts of interest with respect to the research, authorship, and/or publication of this article.
Funding
The author(s) received no financial support for the research, authorship, and/or publication of this article.
1.
2.
3.
Farm-Raised Salmon and Salmon Products Antitrust Litigation, U.S. District Court, Southern District of Florida, No. 1: 19-cv-21551-CMA, hereinafter referred to as Salmon Antitrust Litigation. For simplicity, we refer to these five firms as the “cartel members” recognizing that there has been no legal determination that there was a cartel or that these firms engaged in anti-competitive behavior.
4.
5.
6.
7.
8.
9.
Case No COMP/M.7184—Marine Harvest/Morpol, Comm’n Decision, footnote 4 (July 23, 2014).
10.
The annual reports of all five cartel members indicate that they are vertically integrated into farming and primary processing at least since 2010s (Grieg Annual Report 2021, Leroy Annual Report 2021, Salmar Annual Report 2021, Mowi Annual Report 2021, Cermaq Sustainability Report 2019). This is presumably a reflection of the geographic and time specificity in processing fish immediately after harvesting.
11.
There are three grades of Norwegian farmed salmon—superior, ordinary, and production. It is the superior and ordinary quality that are being exported (and superior quality account for the majority). See Gine Johansson et al., Process Analysis and Data Driven Optimization in the Salmon Industry,  ).
).
13.
About 20% of superior quality salmon is processed further in Norway; the other 80% is processed after export to other countries. See Gudrun Olafsdottir et al., Governance of the Farmed Salmon Value Chain from Norway to the EU, 44
14.
Overview of the Farmed Salmon Value Chain, 44
15.
Calculated from data available in Mowi Industry Handbook series, 2011–2020.
16.
Id.
17.
See, for example, Frank Asche et al., Salmon Aquaculture: Larger Companies and Increased Production, 17
18.
In a subsequent investigation into “gun jumping” in the Mowi-Morpol merger, the EC found that this purchase effectively allowed Mowi to exert control over Morpol, which it was able to exercise at shareholders’ meetings, given the distribution of remaining shares. For this reason, the EC later fined Mowi 20 million Euro, as it “implemented the acquisition eight months before the formal notification to the Commission took place, and over nine months before the Commission authorized it.” Mergers: Commission, Fines Marine Harvest € 20 million for taking control of Morpol without prior EU merger clearance, .
19.
Mowi Industry Handbook, 2014, at 72.
20.
Marine Harvest/Morpol Comm’n Decision, supra note 9, para. 1.
21.
Tom Seaman, Marine Harvest, Morpol: UK Likely to be Competition Focus on “Deal Made in Heaven,”
22.
Id.
23.
Supra note 9, para. 5.
24.
Supra note 3, para 130.
25.
Atle Oglend, Recent Trends in Salmon Price Volatility, 17
27.
NASDAQ Salmon Index Launched, Fish Information & Services,
28.
Supra note 3, para. 131.
30.
“Total trading volume on the Fish Pool futures market is thin . . .” Bendik Andersen & Petter de Lange, Efficiency in the Atlantic Salmon Futures Market, 41
31.
Supra note 3, para. 139.
32.
Vertical Merger Guidelines, .
33.
Margaret C. Levenstein & Valerie Y. Suslow, Vertical Mergers and Coordinated Effects: Implications for Merger Policy, .
34.
We considered the possibility that Mowi acquired Morpol in order to prevent Morpol from disrupting the upstream market through backward integration. We found no reported evidence of such maverick behavior on Morpol’s part.
35.
Volker Nocke & Lucy White, Do Vertical Mergers Facilitate Upstream Collusion? 97 AM. ECON. REV. 1321–39 (2007). See also Volker Nocke & Lucy White, Vertical Merger, Collusion, and Disruptive Buyers, 28 INTL. J. OF IND. ORG. 350 (2010) and John Asker & Volker Nocke, Collusion, Mergers, and Related Antitrust Issues, in
36.
See, e.g., Matti Liski & Juan-Pablo Montero, Forward Trading and Collusion in Oligopoly, 131 J. ECON. THEORY 212 (2006). See also Nathan H. Miller & Joseph U. Podwol, Forward Contracts, Market Structure, and the Welfare Effects of Mergers, 68 J. INDUS. ECON. (2020).
37.
Allegations such as these have been made in other markets. For example, Rosa Abrantes-Metz et al., Tracking the Libor Rate, 10 APPLIED ECON. LETTERS 893 (2011); and Rosa Abrantes-Metz et al., Libor Manipulation? 36 J. OF BANKING AND FIN. 136 (2012) investigate the manipulation of LIBOR to affect the profitability of contractual agreements that were tied to the LIBOR. In the air cargo fuel surcharge case, firms used a fuel price index to coordinate ticket surcharges. See, for example, Dustin Appel, Air Cargo Fuel Surcharges and Tacit Collusion Under the Sherman Act: What Good Is Catching a Few Bad Guys If Consumers Still Get Robbed, 73
38.
Daniel Crane, The Story of U.S. v. Socony-Vacuum: Hot Oil and Antitrust in the Two New Deals in Antitrust Stories, eds. Daniel Crane and Eleanor Fox, Foundation Press 2007.
39.
Supra note 3, para. 131–32.
40.
Frank Asche et al., The Spot-Forward Relationship in the Atlantic Salmon Market, 20
41.
Compiled from Nasdaq as well as the Salmon Farming Industry Handbook, annual: 2012-2021.
42.
Id.
43.
44.
The NOS and Nasdaq salmon index data were requested from Nasdaq at https://salmonprice.nasdaqomxtrader.com/public/report;jsessionid=3306414557C064E7A96979913C5AFB89?0. The SSB Index is from Norway Statistics Bureau, Export of salmon, fresh or chilled, fish-farm bred, .
45.
IMF Primary Commodity Prices Database. Beef: Australian and New Zealand 85% lean fores, CIF US import price, US cents per pound. Salmon: farm bred Norwegian salmon, export price, USD per Kilogram. Lamb: frozen carcass Smithfield London, US cents per pound. Chicken: whole bird spot price, ready-to-cook, whole, iced, Georgia docks, US cents per pound. Pork: 51–52% lean hogs, US price. US cents per pound. See .