
Abstract
Background
Measurement of vitamin A (retinol) and E (alpha-tocopherol) in UK clinical laboratories is currently performed exclusively by high-performance liquid chromatography with ultraviolet detection. We investigated whether retinol and alpha-tocopherol could be measured simultaneously by liquid chromatography tandem mass spectrometry.
Methods
Serum samples (100 μL) were extracted using Isolute + Supported Liquid Extraction plates. Chromatography was performed on a Phenomenex Kinetex Biphenyl 2.6 μm, 50 × 2.1 mm column, and liquid chromatography tandem mass spectrometry on a Waters Acquity TQD. Injection-to-injection time was 4.3 min. The assay was validated according to published guidelines. Patient samples were used to compare liquid chromatography tandem mass spectrometry and high-performance liquid chromatography with ultraviolet detection methods.
Results
For retinol and alpha-tocopherol, respectively, the assay was linear up to 6.0 and 80.0 μmol/L, and lower limit of quantification was 0.07 and 0.26 μmol/L. Intra and interassay imprecision were within desirable analytical specifications. Analysis of quality control material aligned to NIST SRM 968e, and relative spiked recovery from human serum, both yielded results within 15% of target values. Method comparison with high-performance liquid chromatography with ultraviolet detection methodology demonstrated a negative bias for retinol and alpha-tocopherol by the liquid chromatography tandem mass spectrometry method. Analysis of United Kingdom National External Quality Assurance Scheme samples yielded mean bias from the target value of +3.0% for retinol and −11.2% for alpha-tocopherol.
Conclusions
We have developed a novel, high-throughput method for extraction of retinol and alpha-tocopherol from human serum followed by simultaneous quantitation by liquid chromatography tandem mass spectrometry. The method offers a rapid, sensitive, specific and cost-effective alternative to high-performance liquid chromatography with ultraviolet detection methodology, and is suitable for routine clinical monitoring of patients predisposed to fat-soluble vitamin malabsorption.
Introduction
The term vitamin A encompasses pro-vitamin A carotenoids abundant in certain plant sources, and so-called ‘pre-formed’ vitamin A which includes retinol, retinal, retinoic acid and retinyl esters. Although the liver is the storage site for the bulk of total body vitamin A and its precursors, vitamin A deficiency and resultant clinical signs and symptoms tend to be reflected in reduced serum retinol concentrations. Consequently, retinol is the form of vitamin A most commonly measured in clinical laboratories. 1 There are eight naturally occurring forms of vitamin E, comprising alpha, beta, gamma and delta tocopherols and tocotrienols. Alpha-tocopherol is considered the primary bioactive form of vitamin E, and is the only form used to define recommended dietary allowance. Furthermore, the principal plasma vitamin E carrier protein, alpha-tocopherol transfer protein, demonstrates preferential binding for alpha-tocopherol. 2
The fat-soluble vitamins A and E are routinely measured clinically in patients with conditions which predispose to fat malabsorption including cystic fibrosis (CF), pancreatic insufficiency and the short bowel syndrome. Pertinent to patients with short bowel and intestinal failure, guidelines recommend that patients on long-term parenteral nutrition support should have fat-soluble vitamin concentrations monitored six monthly.3,4 Studies have demonstrated vitamin A and E deficiency in up to 40% of patients on prolonged total parenteral nutrition, despite regular supplementation. 5 Early clinical manifestations of vitamin A deficiency include night blindness and impaired lacrimal gland secretion. Untreated, resulting corneal ulceration and scarring may lead to permanent blindness. Vitamin E deficiency may result in serious neurological dysfunction manifesting as ataxia, hyporeflexia and spinocerebellar neuropathy.
A number of liquid chromatography tandem mass spectrometry (LC-MS/MS) assays for analysis of either retinoids, or tocopherols, have been documented in recent years. However, detailed published methods for simultaneous LC-MS/MS analysis of specifically retinol and alpha-tocopherol within the same analytical run are sparse.6–8 Current data (March 2015) from the United Kingdom National External Quality Assurance Scheme (UKNEQAS) demonstrate that analysis of vitamins A and E in clinical laboratories in the UK is performed exclusively by high-performance liquid chromatography with ultraviolet detection (HPLC-UV). Failure to incorporate LC-MS/MS methodology into clinical laboratories may be due to lengthy published chromatographic run times which vary from 6 to 27 min.6–8 Sample volume requirements are extensive requiring up to 1 mL of serum, 7 which is not ideal for paediatric CF patients who comprise a large proportion of patients in whom vitamin A and E levels require regular monitoring. Furthermore, a simple high-throughput extraction method from serum is currently lacking, which would facilitate routine LC-MS/MS analysis.
Herein we have developed a novel high-throughput method for the extraction of retinol and alpha-tocopherol from human serum followed by simultaneous quantitation by LC-MS/MS. The assay was validated according to published acceptance criteria, and compared to an HPLC-UV assay in routine clinical use.
Materials and methods
Calibration standards and quality control material
Primary stock solutions of retinol and alpha-tocopherol (Sigma, Poole, UK) were prepared separately by solubilizing 10 mg retinol powder (≥95% purity) and 25 μL alpha-tocopherol (0.95 g/mL, ≥95.5% purity) in 1 mL absolute alcohol (Hayman, Essex, UK). Accurate molar concentrations of stock solutions were determined spectrophotometrically using published molar extinction coefficients; ɛ = 52480 mol/L/cm at 325 nm for retinol and ɛ = 3260 mol/L/cm at 292 nm for alpha-tocopherol. 9 Separate retinol and alpha-tocopherol primary stock solutions were assigned to subsequently prepare either calibration standard or quality control (QC) material. Use of separate stock solutions to prepare calibrants and QCs ensured confidence in the final assigned metrological values as these separately prepared materials had concentrations within 5% of expected values. From the respective primary stock solutions, intermediate calibrant and QC stock solutions were prepared containing 1.2 mmol/L retinol and 16.0 mmol/L alpha-tocopherol in absolute alcohol. These intermediate stock solutions were used to spike into charcoal-stripped human serum (SeraCare Life Sciences, Massachusetts, USA), which contained undetectable retinol or alpha-tocopherol. Final retinol calibrant concentrations were 0, 0.3, 0.9, 1.8, 3.0 and 6.0 μmol/L, and QC concentrations 0.75, 1.5 and 3.0 μmol/L. Final alpha-tocopherol calibrant concentrations were 0, 4.0, 12.0, 24.0, 40.0 and 80.0 μmol/L, and QC concentrations 10.0, 20.0 and 40.0 μmol/L. Use of six calibrators (including the zero calibrant) to generate standard curves is in line with recommended practice. 10
Internal standards
Superstock solutions of deuterated d5-retinol (Alsachim, Illkirch Graffenstaden, France) and d6-alpha tocopherol (Isosciences, Pennsylvania, USA) were prepared to concentrations of 1 mg/mL and 2 mg/mL, respectively, in LC-MS grade methanol (Fisher Scientific, Loughborough, UK). Absolute internal standard concentrations were not determined by UV spectrophotometry, as the same volume of working internal standard was added to all calibrators and samples. From these superstocks, a solution of mixed working internal standard in methanol was prepared containing 20 μg/mL d5-retinol and 80 μg/mL d6-alpha-tocopherol.
Sample extraction
To 100 μL of patient serum, standards or QCs, 100 μL of 35:65 (v/v) propan-2-ol:water (Fisher Scientific, Loughborough, UK) containing 0.25 mol/L sodium hydroxide (Sigma, Poole, UK) were added, followed by 20 μL of working mixed internal standard. Samples were then vortexed for 1 min, transferred to individual wells of a 400 μL Isolute Supported Liquid Extraction (SLE) 96-well plate (Biotage, Uppsala, Sweden), and allowed to adsorb to the plate for 5 min under gravity flow. Elution was achieved by addition to each well of 750 μL 90:10 (v/v) hexane:propan-2-ol (Fisher Scientific, Loughborough, UK), with collection into a 2 mL 96-deep-well polypropylene plate (Sarstedt, Numbrecht, Germany). Elution was allowed to proceed under gravity flow for 5 min. This elution step was repeated; then a vacuum applied to the plate for 2 min to elute any remaining solvent. Eluate was evaporated to dryness using an SPE-Dry 96 (Biotage, Uppsala, Sweden) and wells re-constituted in 200 μL of 80:20 (v/v) methanol:water containing 2 mmol/L ammonium acetate (Sigma, Poole, UK) and 0.1% (v/v) formic acid (Sigma, Poole, UK). Finally, the plate was sealed with heat sealing foil, vortexed for 2 min and centrifuged for 5 min at 8000 g. All sample extraction steps were performed under artificial lighting conditions. Elution of solvent into plastic collection plates could cause leaching of plasticizers into sample extracts, with the potential to cause analytical interference. Although not observed during the method development and validation herein, use of glass well inserts within the collection plates could minimize this occurrence.
Chromatography
Chromatography was performed on a Waters® Acquity™ UPLC system. Extracted sample (7.5 μL) was injected directly from the 96-deep-well plate onto a SecurityGuard ULTRA UHPLC Biphenyl filter (Phenomenex, Macclesfield, UK), coupled to a Kinetex Biphenyl 2.6 μm, 50 × 2.1 mm analytical column (Phenomenex, Macclesfield, UK). Mobile phase A contained 2 mmol/L ammonium acetate and 0.1% (v/v) formic acid in laboratory grade de-ionized water. Mobile phase B contained 2 mmol/L ammonium acetate and 0.1% (v/v) formic acid in LC-MS grade methanol. Initial conditions were 30:70 (v/v) mobile phase A:B. Following sample injection, elution was performed by means of a gradient from 70% to 100% mobile phase B over 1.5 min, then holding at 100% mobile phase B for a further 1 min. Following this, the columns were re-equilibrated back to initial conditions and held for 1.5 min prior to the next sample injection. The mobile phase flow rate was maintained at 0.4 mL/min, and the column maintained at 35℃.
Mass spectrometry
Mass spectrometer detector settings for quantifier, qualifier and internal standard MRM transitions.
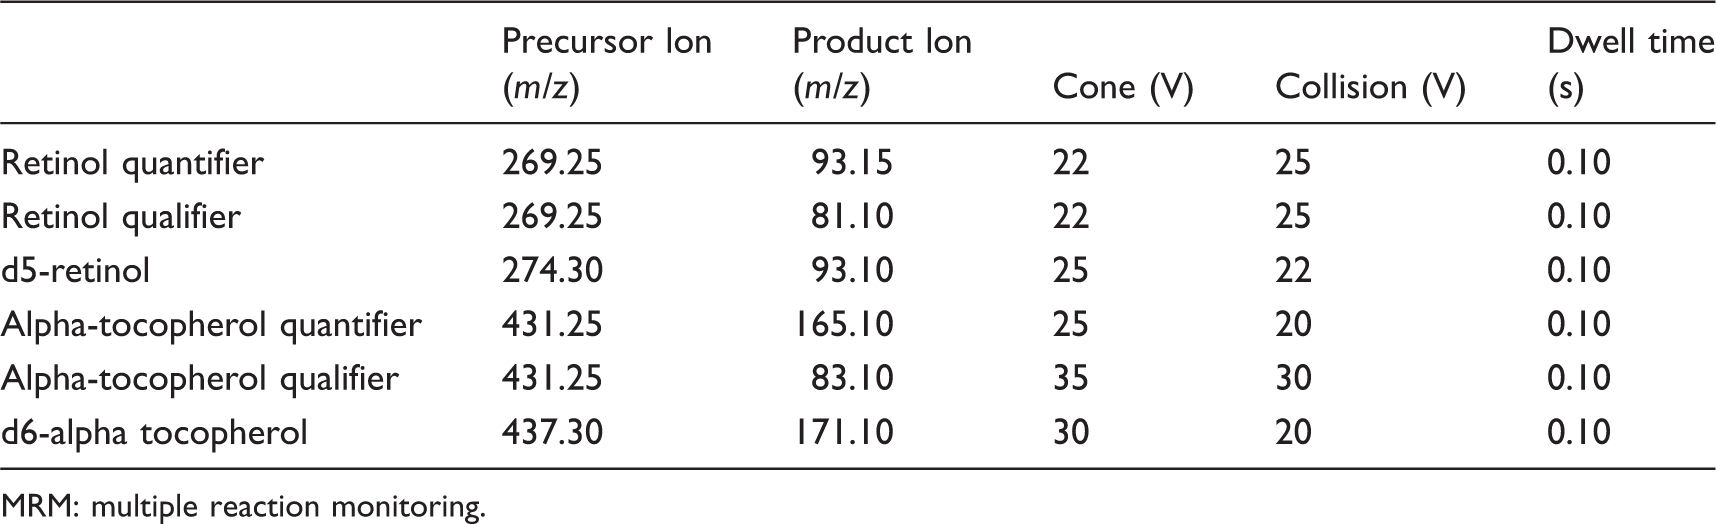
MRM: multiple reaction monitoring.
Validation
The LC-MS/MS method was validated for precision, accuracy, recovery, linearity, sensitivity, specificity and sample stability according to published acceptance criteria.10,12
Ion suppression and enhancement
Qualitative ion suppression or enhancement was assessed by constant infusion into the mass spectrometer of solutions of d5-retinol and d6-alpha-tocopherol internal standards prepared in methanol. 10 Internal standards were prepared to concentrations of 7 and 90 μmol/L of d5-retinol and d6-alpha tocopherol, respectively, concentrations which yielded a constant background signal. Extracted serum samples (n = 10), extracted phosphate buffered saline, and 20:80 (v/v) mobile phase A:B were injected via the autosampler, and MRM transitions for each internal standard assessed over the course of the gradient.
Quantitative ion suppression or enhancement was assessed according to published methods. 13 To quantify the extent of ion suppression or enhancement, 10 patient serum samples were each spiked with mixed retinol/alpha-tocopherol stock solution prepared in absolute alcohol, to achieve final concentrations of 1.5 and 20.0 μmol/L respectively (pre-extraction spiked samples). The spike volume was 5% (v/v) of the total serum volume, thus minimizing alteration of the base serum matrix. Additionally, aliquots of the same 10 serum samples were spiked with an equivalent volume of absolute alcohol containing no added retinol or alpha-tocopherol (post-extraction spiked samples). All samples were then processed in duplicate through the entire extraction procedure, without addition of internal standard. Post-extraction spiked samples were subsequently spiked with retinol/alpha-tocopherol stock solution, to achieve the same spike concentration to the pre-extraction spiked samples. Percentage recovery was calculated based on peak areas of analytes (without internal standardization correction), using the formula: % recovery = (pre-extraction spike peak area/post-extraction spike peak area) × 100. 13
To confirm the utility of charcoal-stripped human serum for preparation of standards and QCs, the method of standard additions was used to determine retinol and alpha-tocopherol concentrations in patient serum samples (n = 5). Samples were spiked with retinol and alpha-tocopherol stock solutions to achieve concentration ranges of 0.5 to 3.0 μmol/L, and 5.0 to 30.0 μmol/L, respectively. The charcoal-stripped human serum-based calibrators were deemed acceptable for use if the calculated concentrations of the patient serum samples were within 5% of the values calculated by standard additions.
Imprecision
Assay imprecision was assessed using QC material prepared with charcoal stripped human serum matrix (also used to prepare calibrants). Serum was spiked to a final concentration of 0.6, 1.5 and 3.0 μmol/L retinol and 8.0, 20.0, 40.0 μmol/L alpha-tocopherol. Samples were analysed repeatedly (n = 10) within a single analytical run to determine within-batch imprecision, and analysed in separate batches (n = 10) over a period of eight weeks to determine between-batch imprecision. Imprecision was assessed as a function of the variation (%CV).
To evaluate imprecision in unadulterated human serum, which may better reflect assay performance compared to charcoal-stripped human serum, three QC samples were prepared from human serum pools. Each pool comprised 10 different patient serum samples, covering the clinically low, normal and high concentration range. Within and between-batch imprecision was assessed as described above for the charcoal-stripped serum QCs.
Two sets of commercially available QC materials (Chromsystems, Munich, Germany; RECIPE, Munich, Germany) were additionally used to assess assay imprecision. These matrix-matched QC materials available in HPLC-UV kits are traceable to National Institute for Science and Technology (NIST) Standard Reference Material (SRM) 968e for fat-soluble vitamins. 14 Within and between-batch imprecision was assessed as described above.
According to validation guidelines, imprecision is deemed acceptable, if %CV values do not exceed 15%. 12
Accuracy and recovery
To assess recovery, retinol and alpha-tocopherol stock solutions were used to spike six different patient serum samples. These samples had endogenous retinol concentrations ranging from 0.3 to 2.8 μmol/L, and alpha-tocopherol concentrations ranging from 3.9 to 30.0 μmol/L. Concentrations of retinol spiked into aliquots of each sample were 0.6, 1.5 and 3.0 μmol/L. Spiked concentrations of alpha-tocopherol were 8.0, 20.0 and 40.0 μmol/L. Each sample was assayed in duplicate, and % recovery calculated from the measured compared to the expected concentrations.
Accuracy was assessed using two sets of commercial QC materials, which have mean values ±2 standard deviation (SD) target ranges traceable to NIST SRM 968e. For these samples, accuracy was assessed as a function of % deviation from the target mean value, using both within and between-batch data. Additionally to assess accuracy, external quality assurance (EQA) samples provided by the United Kingdom National External Quality Assurance Scheme (UKNEQAS) for vitamins were analysed by the LC-MS/MS assay (n = 11). Results obtained from the LC-MS/MS assay during real-time participation in this EQA scheme were compared to the all lab trimmed mean (ALTM) and corresponding ± 2SD range compiled from all users within this EQA scheme. Accuracy was assessed as a function of % deviation of the LC-MS/MS result from the ALTM target value.
According to validation guidelines, accuracy is deemed acceptable if the mean value is within 15% of the true value. 12
Linearity
Linearity of the assay was assessed by analysis of six different calibration curves analysed in separate batches. Concentrations ranged from 0 to 6.0 μmol/L for retinol and 0 to 80.0 μmol/L for alpha-tocopherol. Linearity of the assay was confirmed by weighted linear regression if the correlation coefficient r2 value was ≥0.990.
Furthermore, patient serum samples (n = 5) were assayed neat, then diluted with charcoal-stripped human serum and assayed over a range of dilutions (n = 4). In addition, a low and a high concentration serum pool was prepared, each comprising 10 different serum samples. The high concentration serum pool was diluted over a range of dilutions (n = 4) using the low concentration serum pool. For both experiments, measured retinol and alpha-tocopherol concentrations were compared to expected concentrations.
Limit of quantitation and detection
The lower limit of detection (LLOD) was determined as the smallest detectable peak in extracted serum above baseline noise (signal:noise ratio > 3:1, peak to peak). The lower limit of quantification (LLOQ) was determined using aliquots of serum spiked with decreasing concentrations of retinol and alpha-tocopherol. Concentrations in each sample were measured 10 times in a single analytical batch and the %CV and deviation from the theoretical target value determined. The LLOQ was assigned to the lowest concentration with both a %CV, and mean value from the theoretical target of <20%, which is within published guidelines. 12
Specificity
Solutions of a variety of vitamin A precursors and tocopherols were prepared in absolute alcohol and injected directly into the mass spectrometer. Compounds were injected at excess concentration to allow easy identification of interfering peaks, as evidenced by signal at the retention times of retinol and alpha-tocopherol. Vitamin A precursors injected at a final concentration of 10 μmol/L were all-trans-retinal, retinoic acid and retinyl palmitate. Delta-tocopherol and gamma-tocopherol were injected at a final concentration of 100 μmol/L.
Stability
Stability of retinol and alpha-tocopherol in serum samples was investigated using 10 anonymized patient serum samples, which had been processed within the laboratory within 1 h of sample collection. Aliquots of these samples were stored at room temperature under artificial laboratory lighting conditions in transparent tubes and at 4℃ in the dark. Samples were removed from their storage locations at various time intervals and aliquots stored at −80℃ for subsequent batch analysis, along with aliquots of the basal sample. From the results, the mean percentage change from basal concentration was calculated. A percentage reduction of ≥10% indicates significant deterioration. 10
Method comparison
Anonymized patient serum samples were analysed for retinol (n = 118) and alpha-tocopherol (n = 121) by both the LC-MS/MS method and a commercial HPLC-UV assay (Chromsystems, Munich, Germany). Patients included in the study were on long-term parenteral nutrition support managed from a specialist Intestinal Failure unit. The HPLC-UV assay involves a sample preparation stage requiring addition of a single proprietary internal standard to 200 μL serum. Samples undergo two separate precipitation steps, followed by centrifugation. The assay utilizes proprietary kit supplied mobile phase and reverse phase chromatography on a C18 column featuring 12 min chromatographic run time, and is calibrated with a single point calibrator traceable to NIST SRM 968e. 15 The assay utilized in this method comparison is in routine clinical use, demonstrating acceptable performance to peers according to UKNEQAS data. Concentrations determined by each method were compared by Passing–Bablok and Bland–Altman analysis using the statistical analysis software Analyse-It™ (Analyse-It Software Ltd, Leeds, UK).
Results
Both retinol and d5-retinol had retention times of 1.48 min, while alpha-tocopherol and d6-alpha-tocopherol both had retention times of 1.99 min (Figure 1). Total chromatographic run time was 4.0 min and total injection-to-injection cycle time 4.3 min.
Typical chromatograms for a patient serum sample containing 2.2 μmol/L retinol and 28.6 μmol/L alpha-tocopherol. Chromatograms demonstrate negligible interference in the immediate regions of elution of the retinol and alpha-tocopherol peaks. Both retinol and d5-retinol have similar retention times of 1.48 min, and alpha-tocopherol and d6-alpha-tocopherol 1.99 min.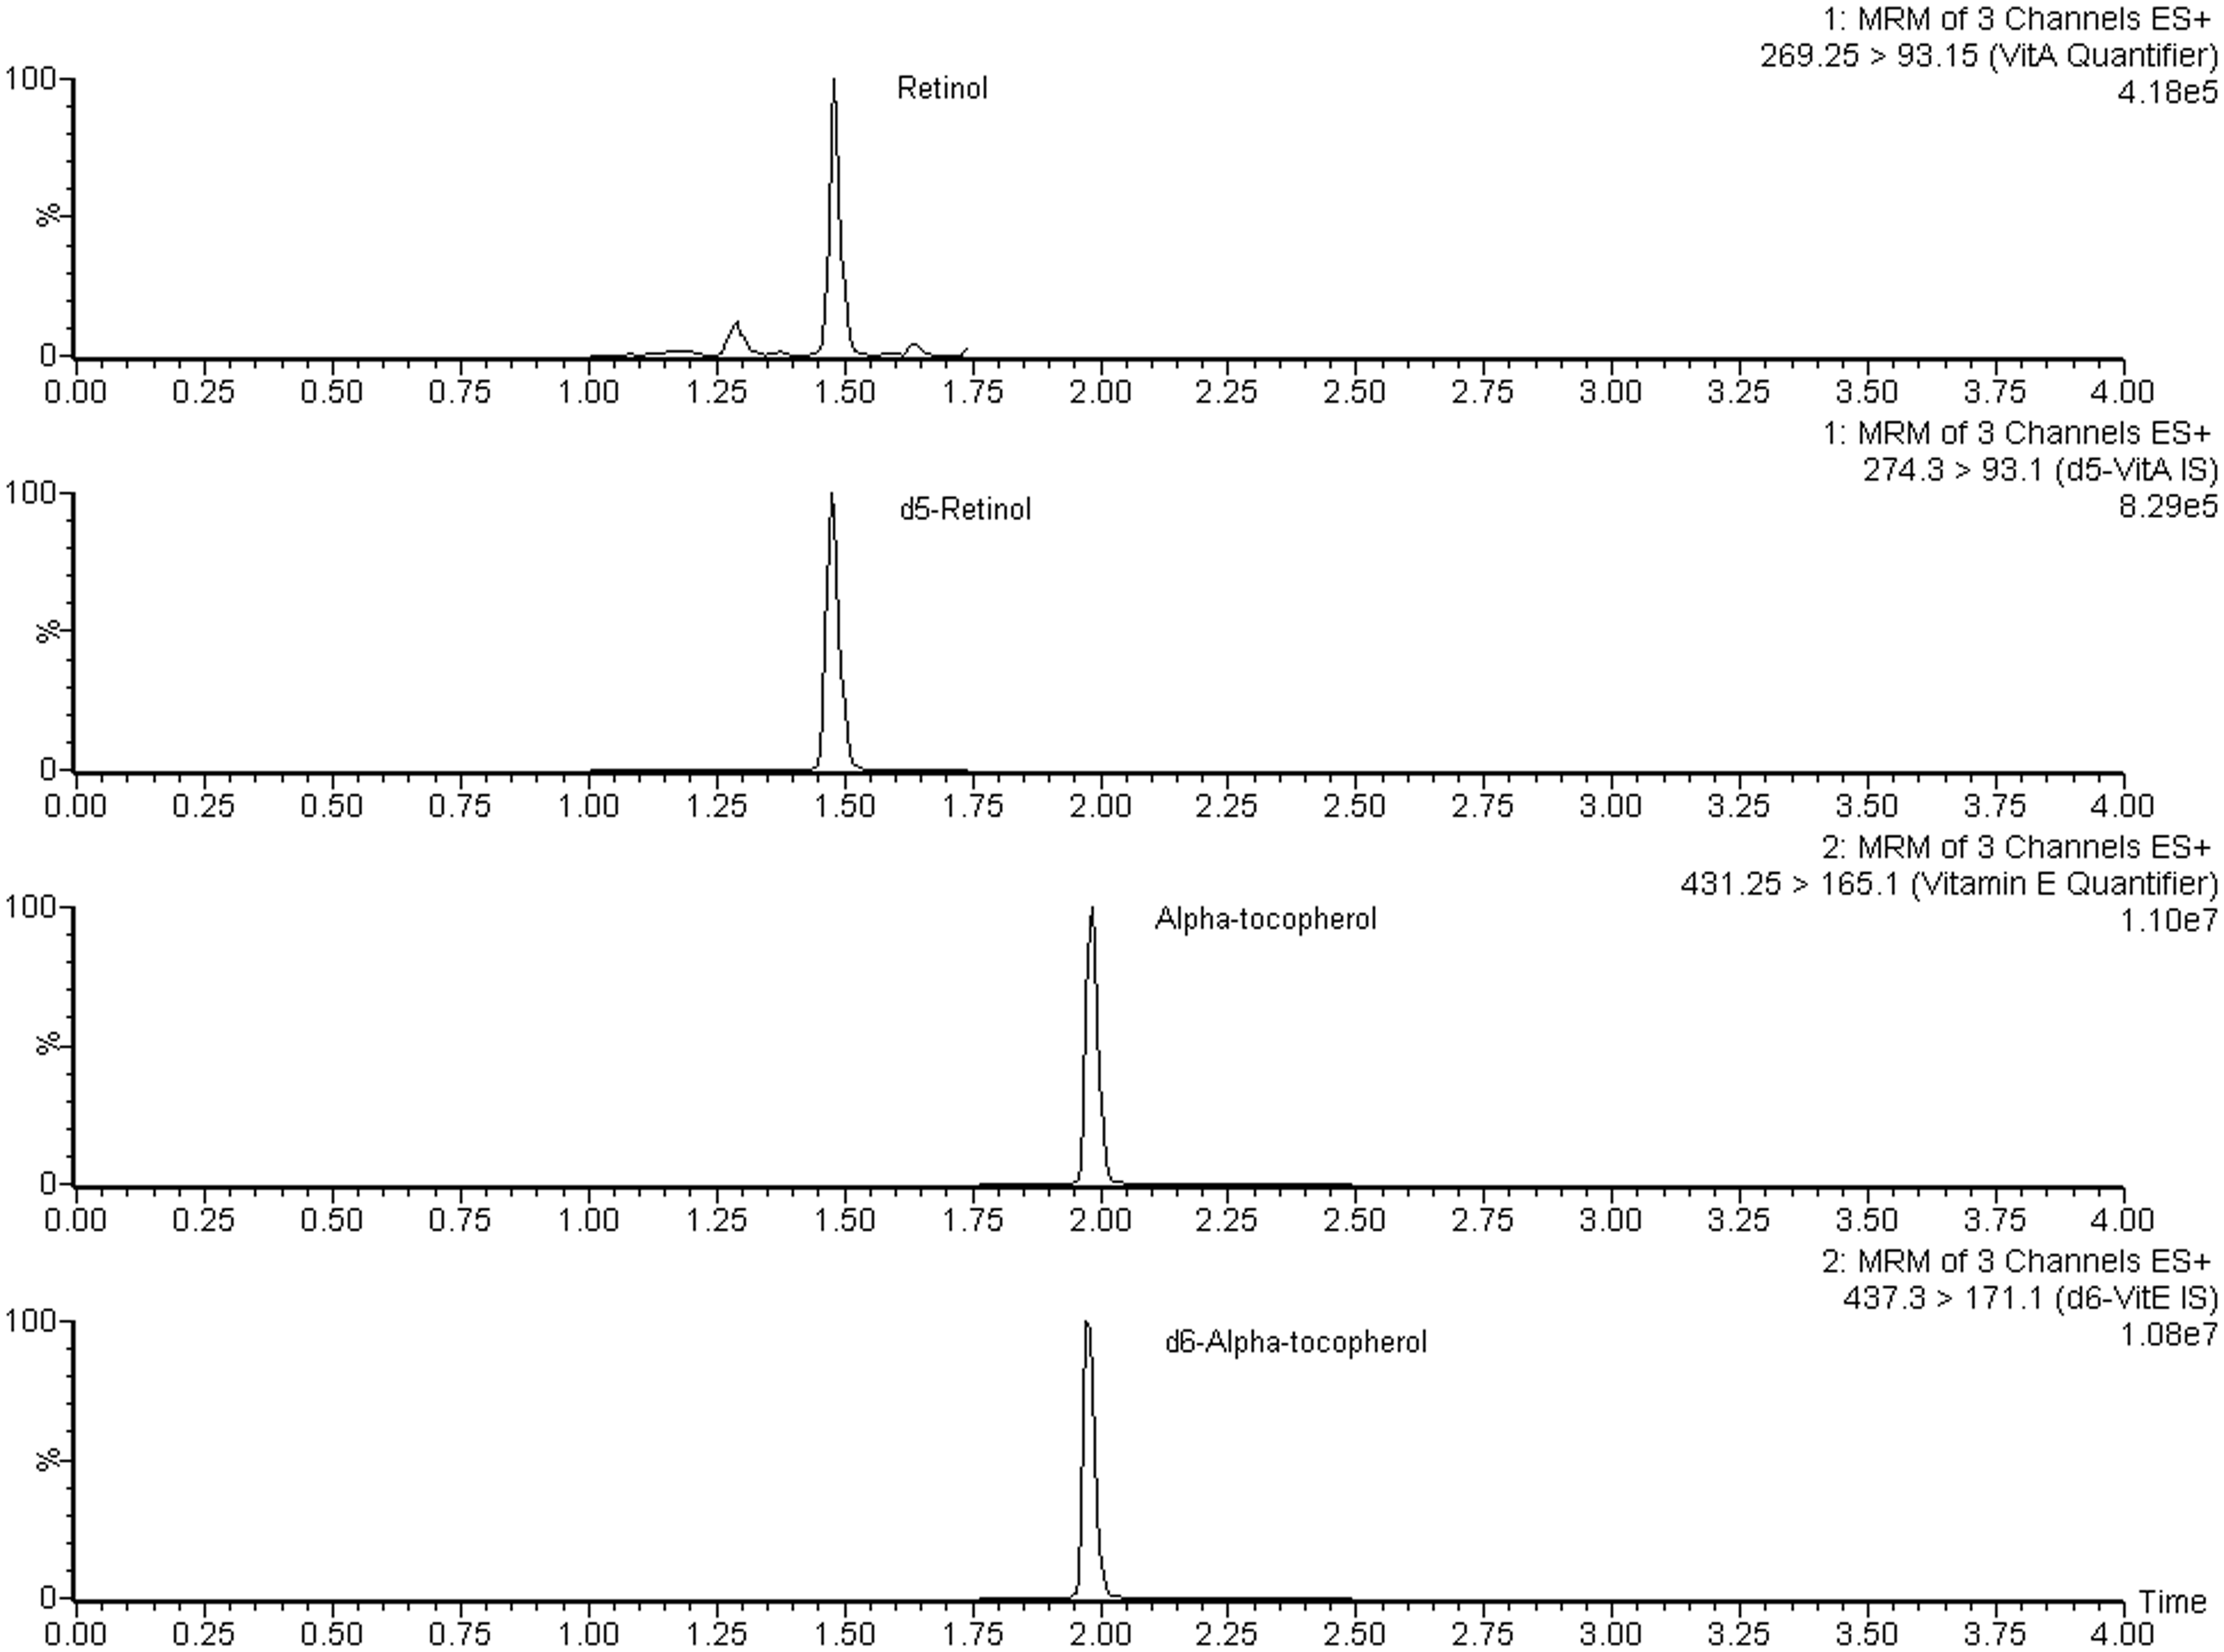
Qualitative ion suppression profiles demonstrated no significant suppression or enhancement of signal in the region of the chromatograms where retinol or alpha-tocopherol elutes. Additionally, quantitative ion suppression experiments, assessed by comparison of pre and post-extraction spiked serum samples, yielded mean relative recovery values of 86.7% (CV 5.2%) for retinol, and 89.5% (CV 3.7%) for alpha-tocopherol. The method of standard additions demonstrated that the charcoal-stripped human serum matrix-based calibrants yielded retinol and alpha-tocopherol concentrations within 5% of those calculated by standard additions.
Intra and interassay imprecision in all quality control materials tested, yielded %CV values < 10%. Taking into account biological variation, desirable analytical imprecision specification for vitamin A is 6.8%, and 6.9% for vitamin E. 16 Averaged %CV values for each QC material were within these limits, within and between batch.
Intrabatch (n = 10) and interbatch (n = 10) imprecision of the LC-MS/MS assay using a variety of matrices including spiked charcoal stripped human serum, pooled human serum and commercial QC material aligned to NIST SRM 968e.
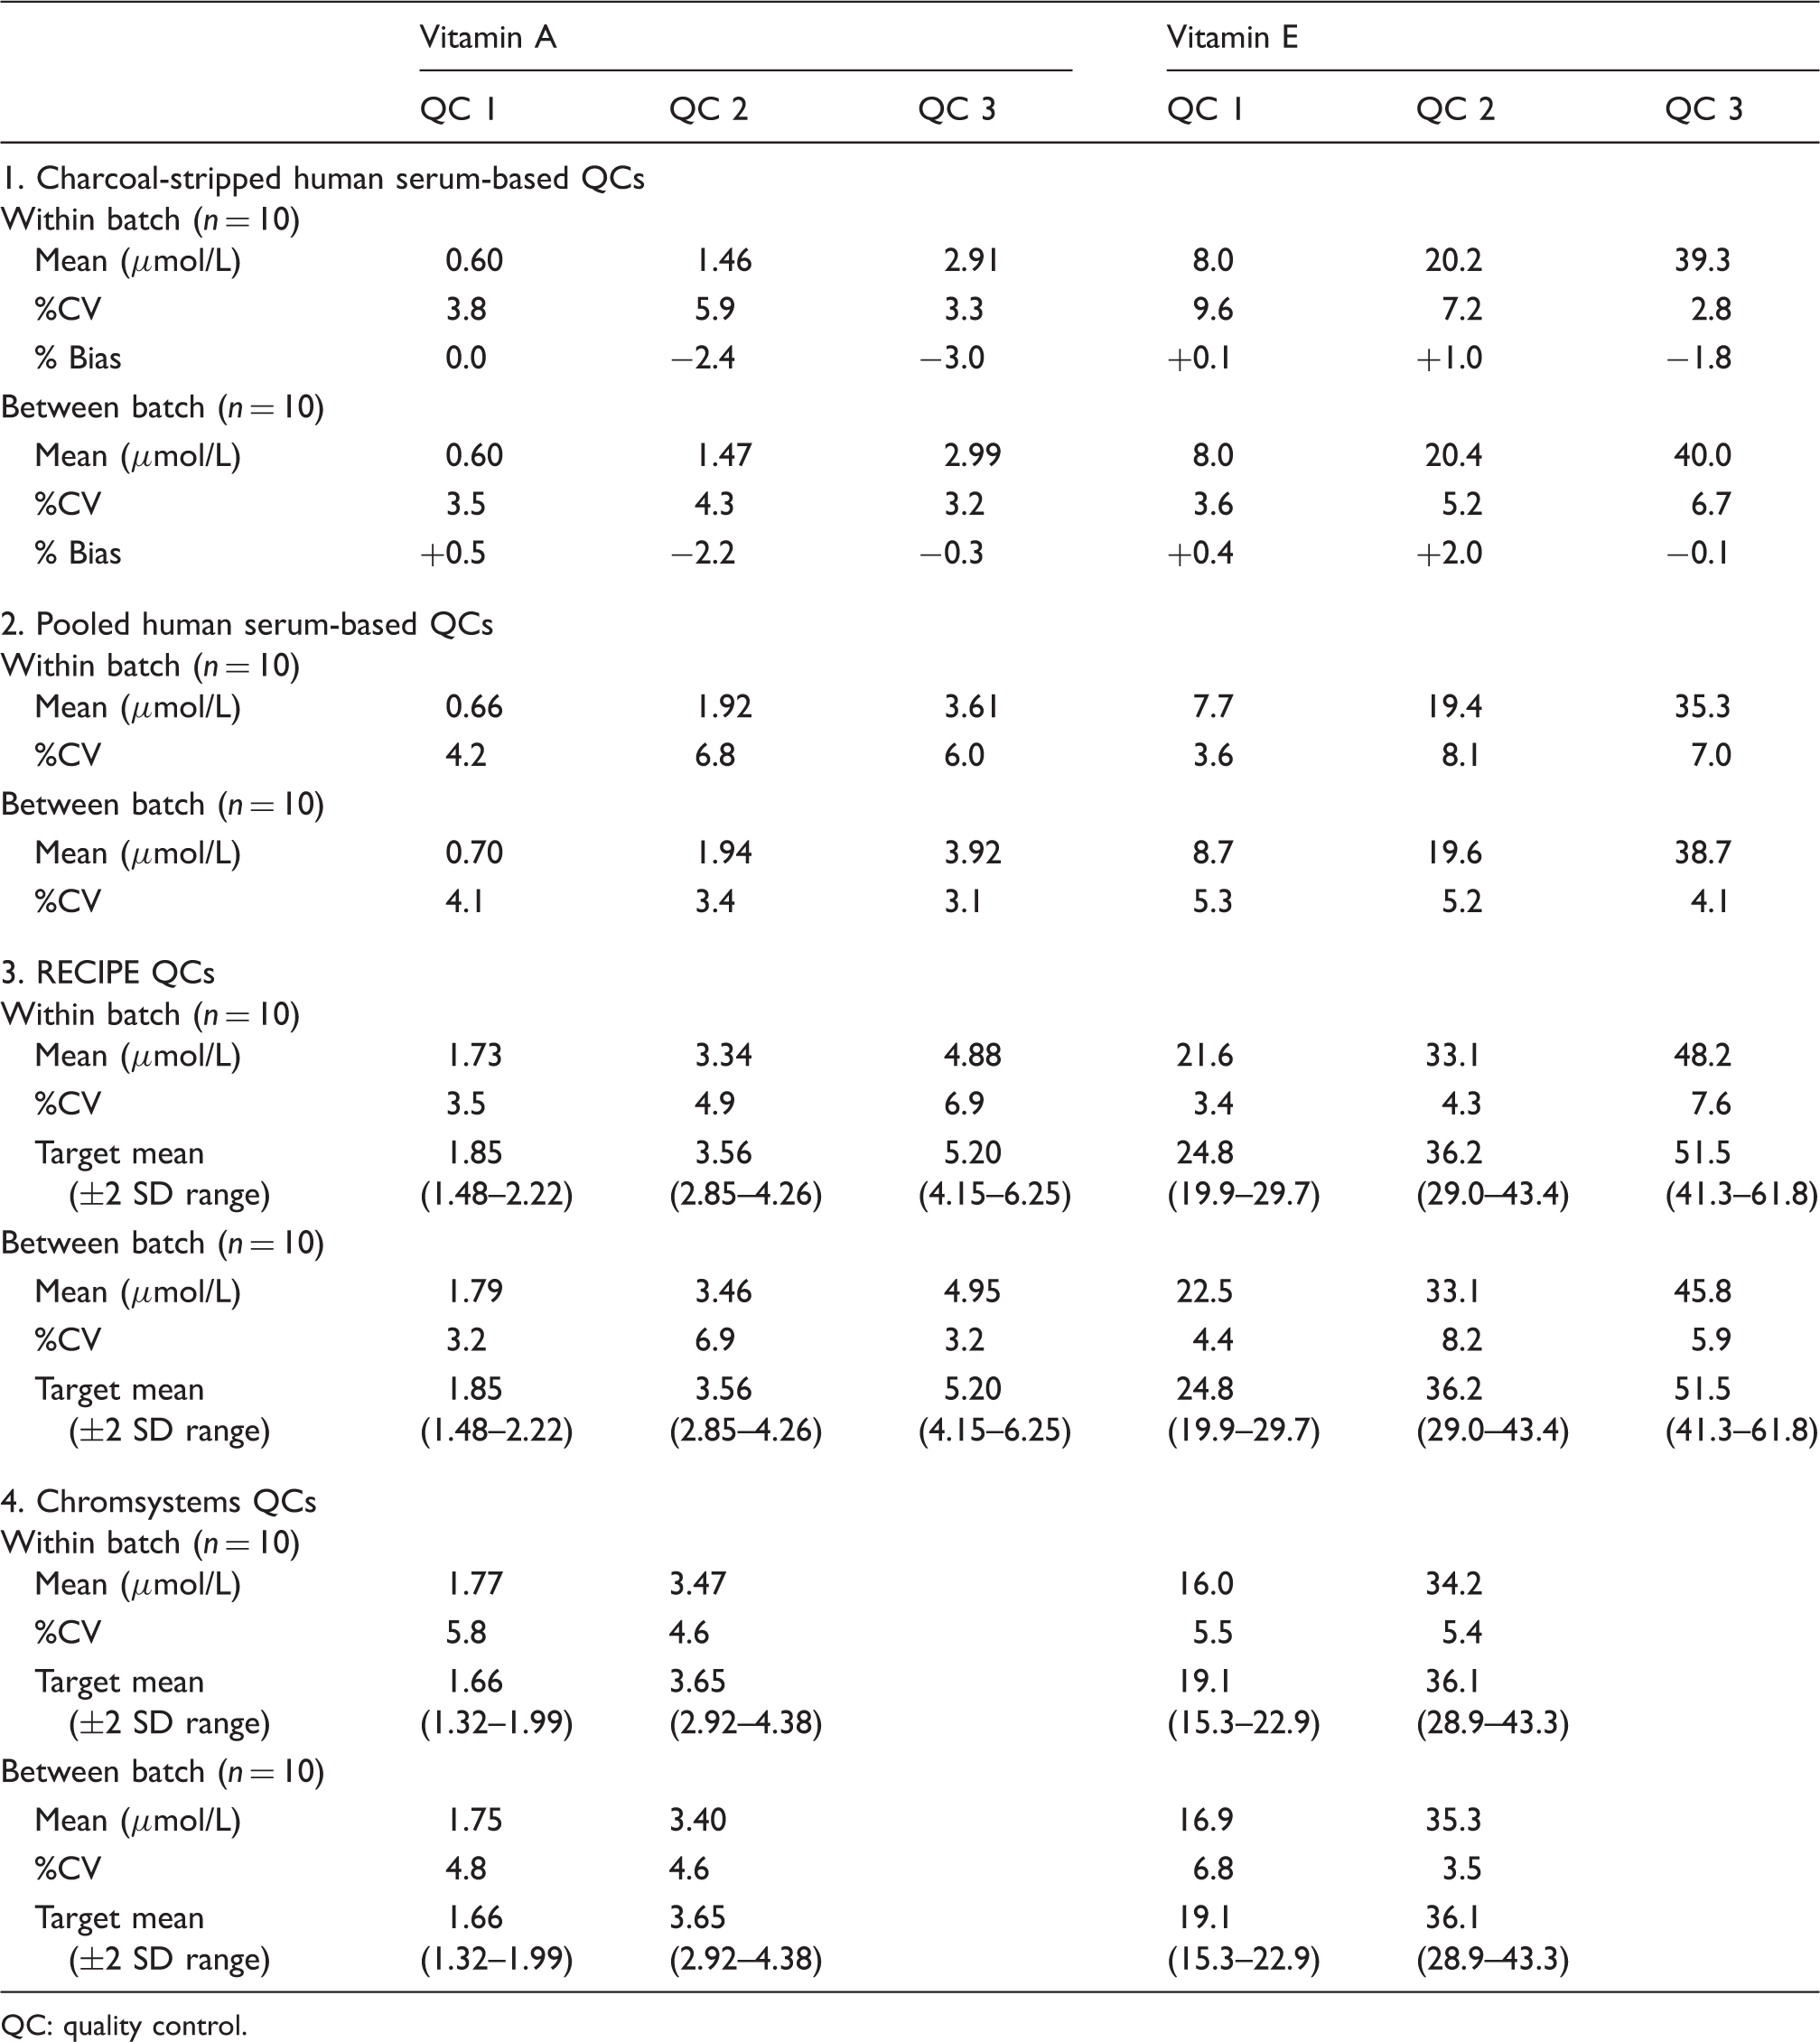
QC: quality control.
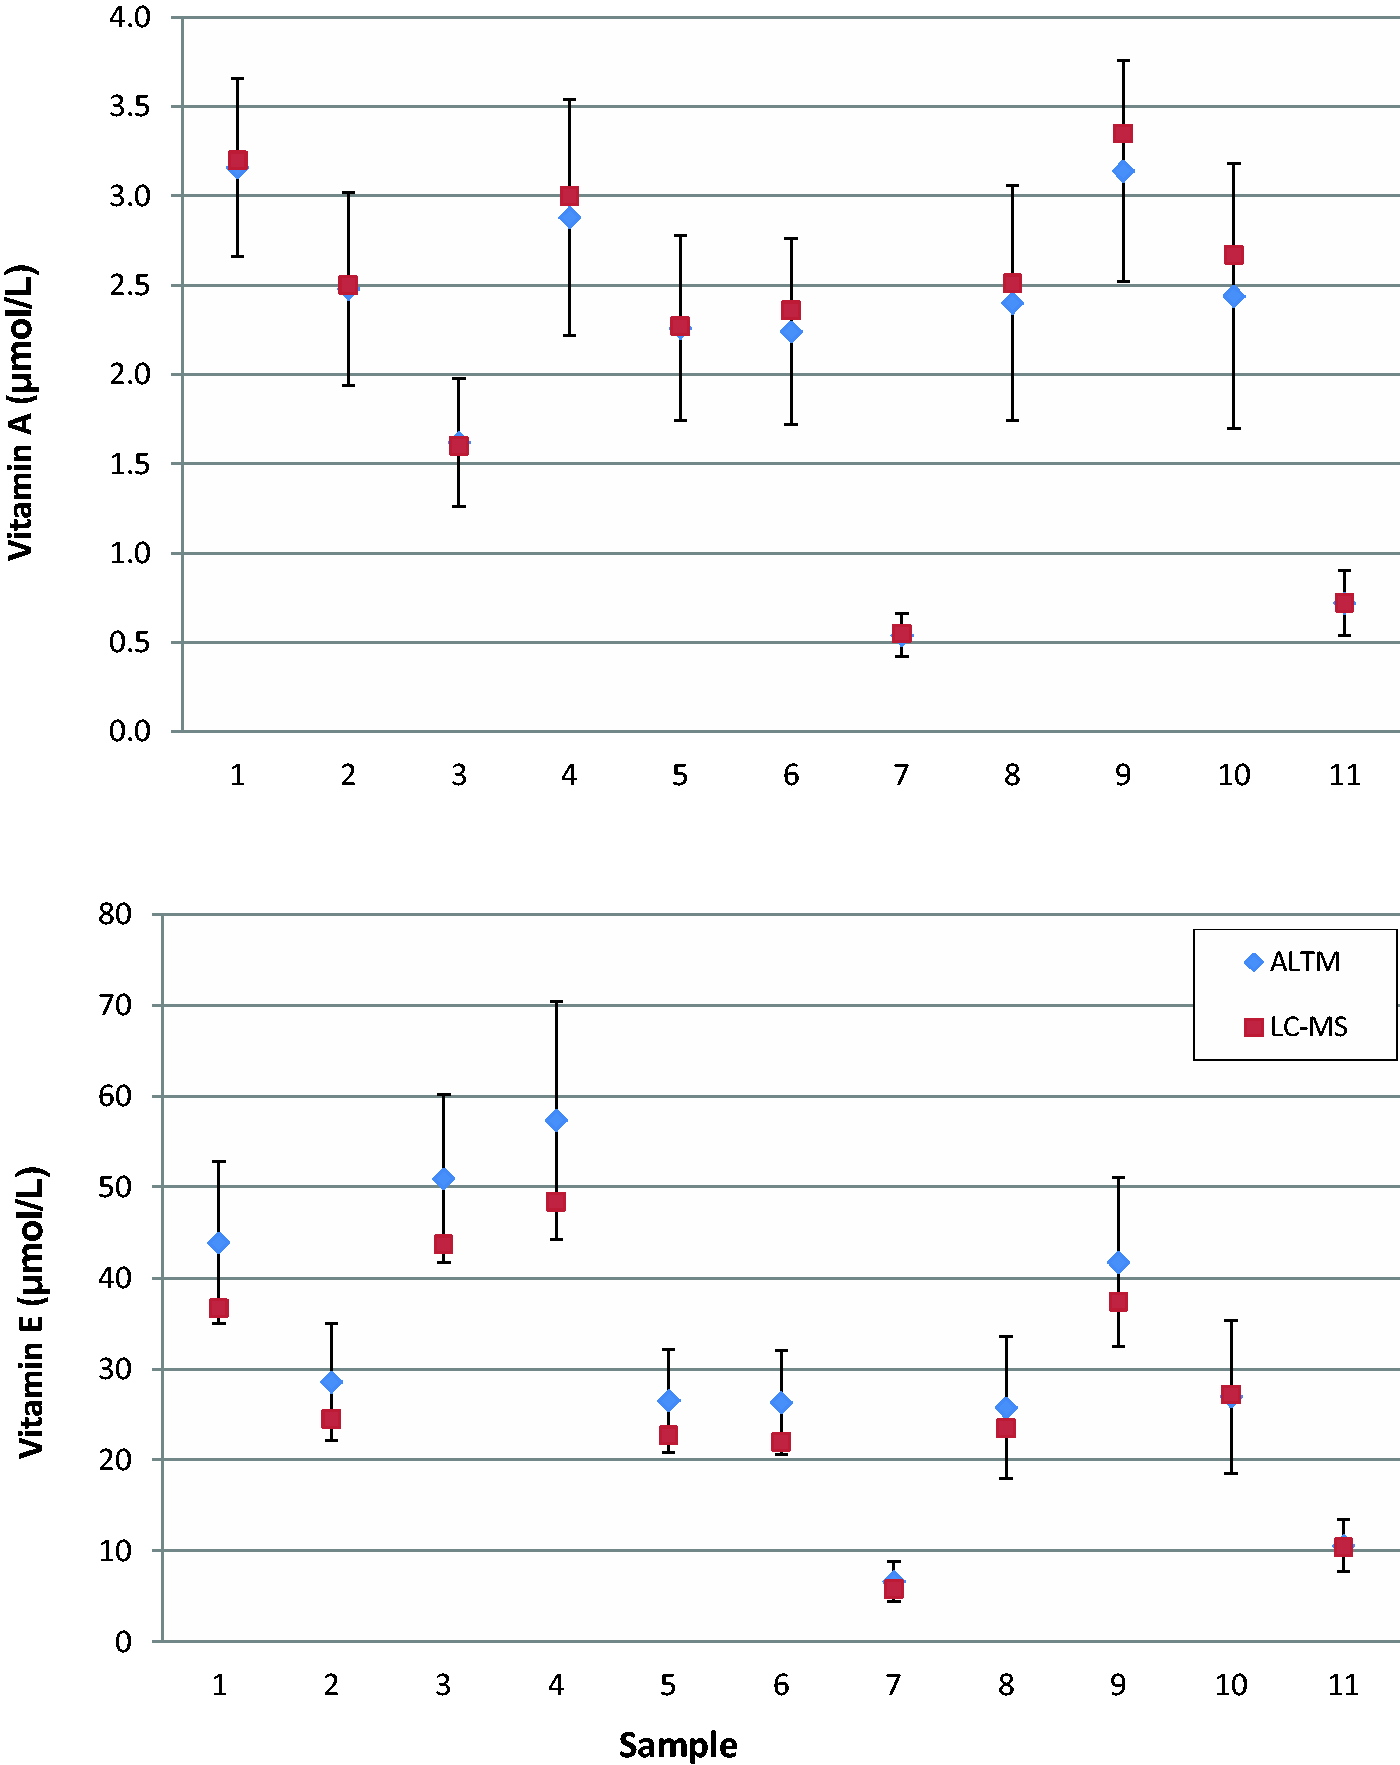
Results of consecutive samples analysed during real time participation in the UKNEQAS vitamins scheme. Diamonds indicate the all laboratory trimmed mean (ALTM), bars indicate the ±2 standard deviation range from the ALTM encompassing all scheme participants; squares indicate the LC-MS/MS result.
Data averaged from six individual calibration curves demonstrated that the assay was linear up to at least 6.0 μmol/L for retinol (r 2 = >0.999) and 80.0 μmol/L for alpha-tocopherol (r 2 = >0.999). Additionally, dilution of patient serum samples with charcoal-stripped human serum matrix, and dilution of a high concentration serum pool with a low concentration serum pool demonstrated linearity over the range assayed for both retinol (r 2 = >0.999) and alpha-tocopherol (r 2 = >0.997). For retinol and alpha-tocopherol respectively, the assay LLOD was 0.05 and 0.18 μmol/L, and the LLOQ was 0.07 and 0.26 μmol/L.
Infusion of high concentrations of all-trans-retinal, retinoic acid and retinyl palmitate demonstrated no significant interfering peaks at the retention times of retinol or alpha-tocopherol. Infusion of 100 μmol/L solutions of gamma- and delta-tocopherol demonstrated a small peak at the retention time of alpha-tocopherol. This interfering peak was approximately half the peak area of the lowest concentration alpha-tocopherol standard (4 μmol/L).
Stability studies of serum stored at room temperature under laboratory artificial lighting demonstrated stability up to six days for retinol (Figure 3(a)) and three days for alpha-tocopherol (Figure 3(b)). One sample demonstrated significant alpha-tocopherol deterioration (>10% from basal levels) after six days storage under these conditions. The same samples stored at 4℃ demonstrated stability up to seven days for both retinol (Figure 3(c)) and alpha-tocopherol (Figure 3(d)).
Stability data for vitamins A and E studied in ten human serum samples. (a) Retinol and (b) alpha-tocopherol; samples stored at room temperature under artificial laboratory lighting conditions. (c) Retinol and (d) alpha-tocopherol; samples stored at 4 ° in the dark.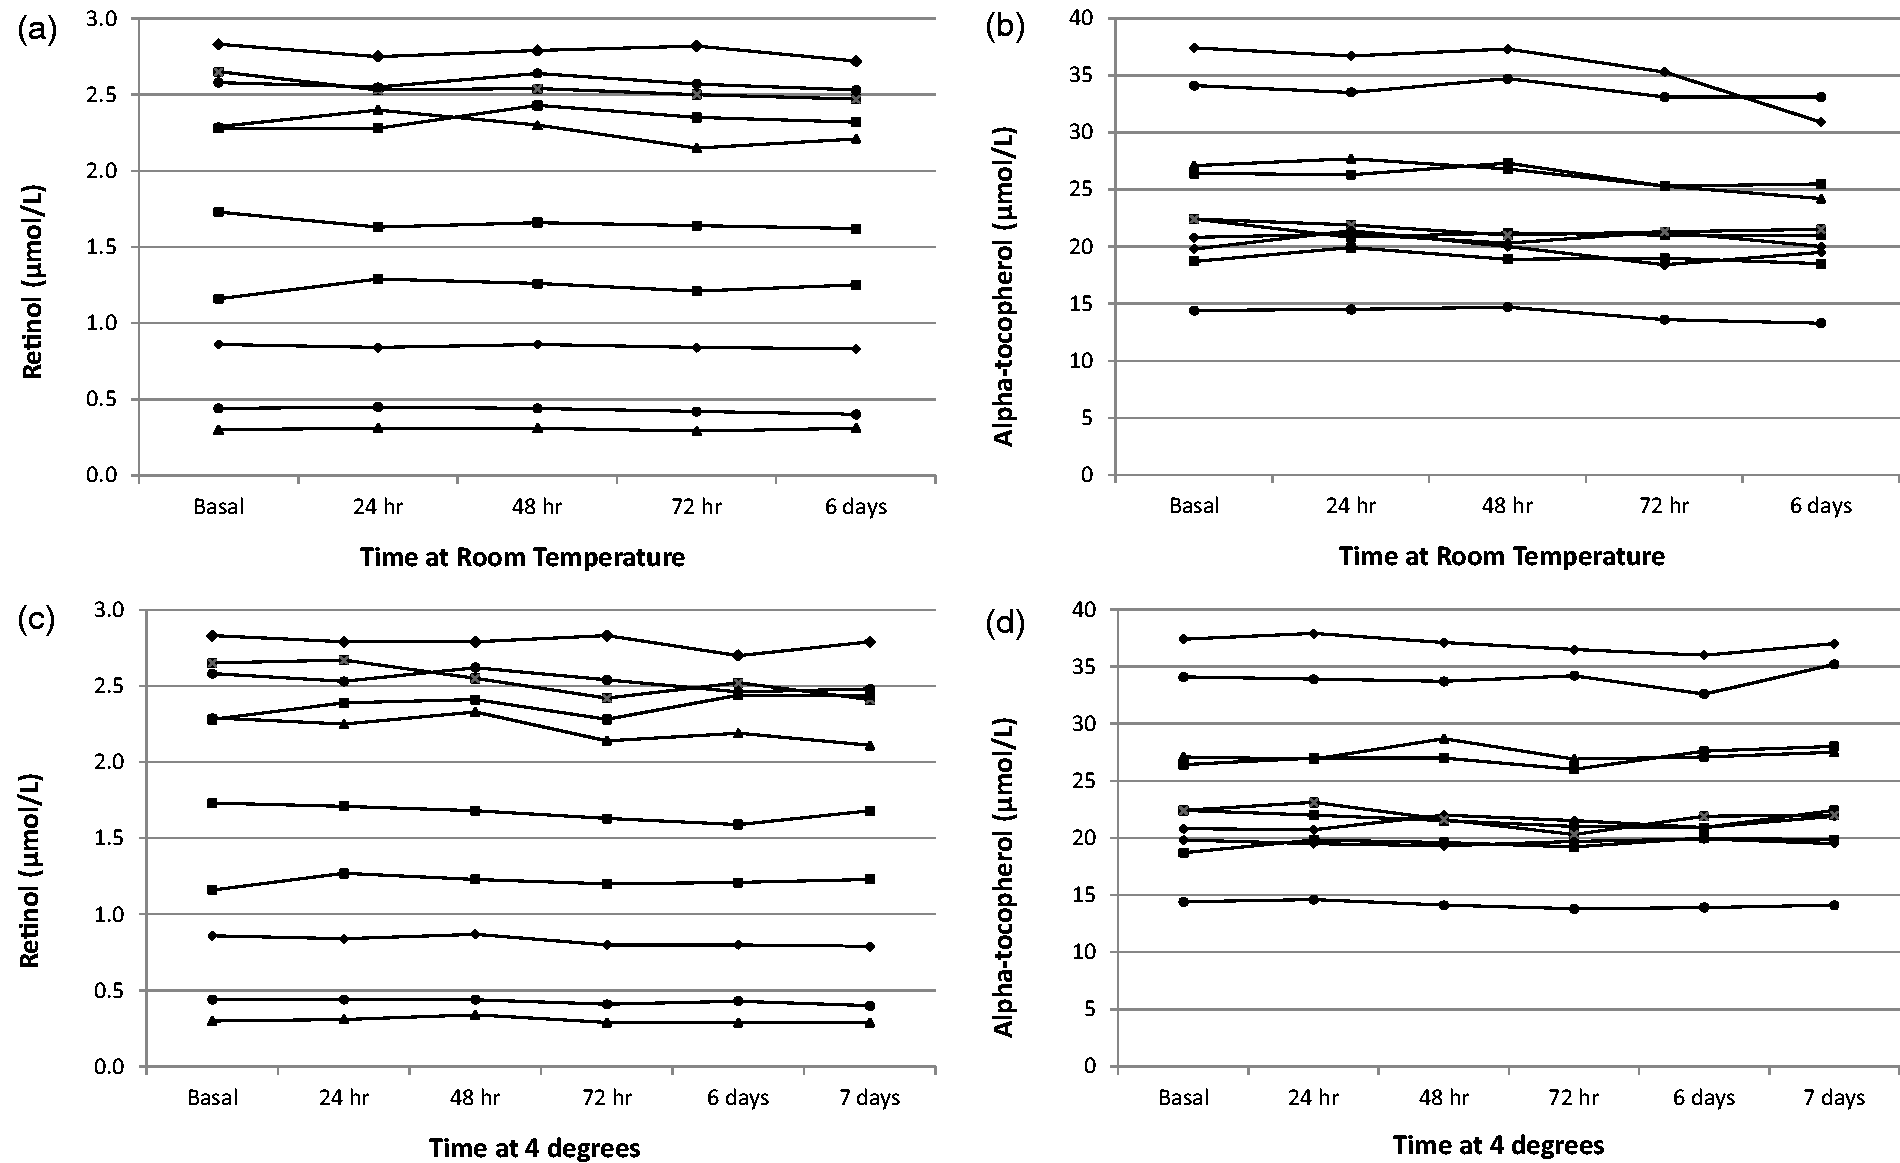
Patient serum samples were analysed by both the LC-MS/MS method and by a HPLC-UV method in routine clinical use. Samples for vitamin A (n = 118) comprised 48 males and 70 females, median age was 56, interquartile range (IQR) 24.0 (41.0–65.0). Samples for vitamin E (n = 121) comprised 49 males and 72 females, median age was 56, IQR 23.3 (41.7– 65.0). For comparison of retinol, Passing and Bablok analysis yielded the equation LC-MS/MS = 0.96 (HPLC-UV) + 0.04 μmol/L (Figure 4(a)), and Bland–Altman analysis demonstrated a mean negative bias of −0.03 μmol/L (95% CI −0.29 to 0.22) for the LC-MS/MS method (Figure 4(b)). For comparison of alpha-tocopherol, Passing and Bablok analysis yielded the equation LC-MS/MS = 0.81(HPLC-UV) + 0.04 μmol/L (Figure 4(c)), and Bland–Altman analysis demonstrated a mean negative bias of −5.6 μmol/L (95% CI −12.3 to 1.12) for the LC-MS/MS method (Figure 4(d)).
Method comparison data between the LC-MS/MS and a HPLC-UV assay in routine clinical use for vitamin A (n = 118) and vitamin E (n = 121): (a) Passing–Bablock analysis for vitamin A, (b) Bland–Altman analysis for vitamin A, (c) Passing–Bablock analysis for vitamin E, (d) Bland–Altman analysis for vitamin E. Dashed lines on Passing–Bablock and Bland–Altman plots indicate 95% confidence intervals, solid line on Bland–Altman plots indicates mean bias.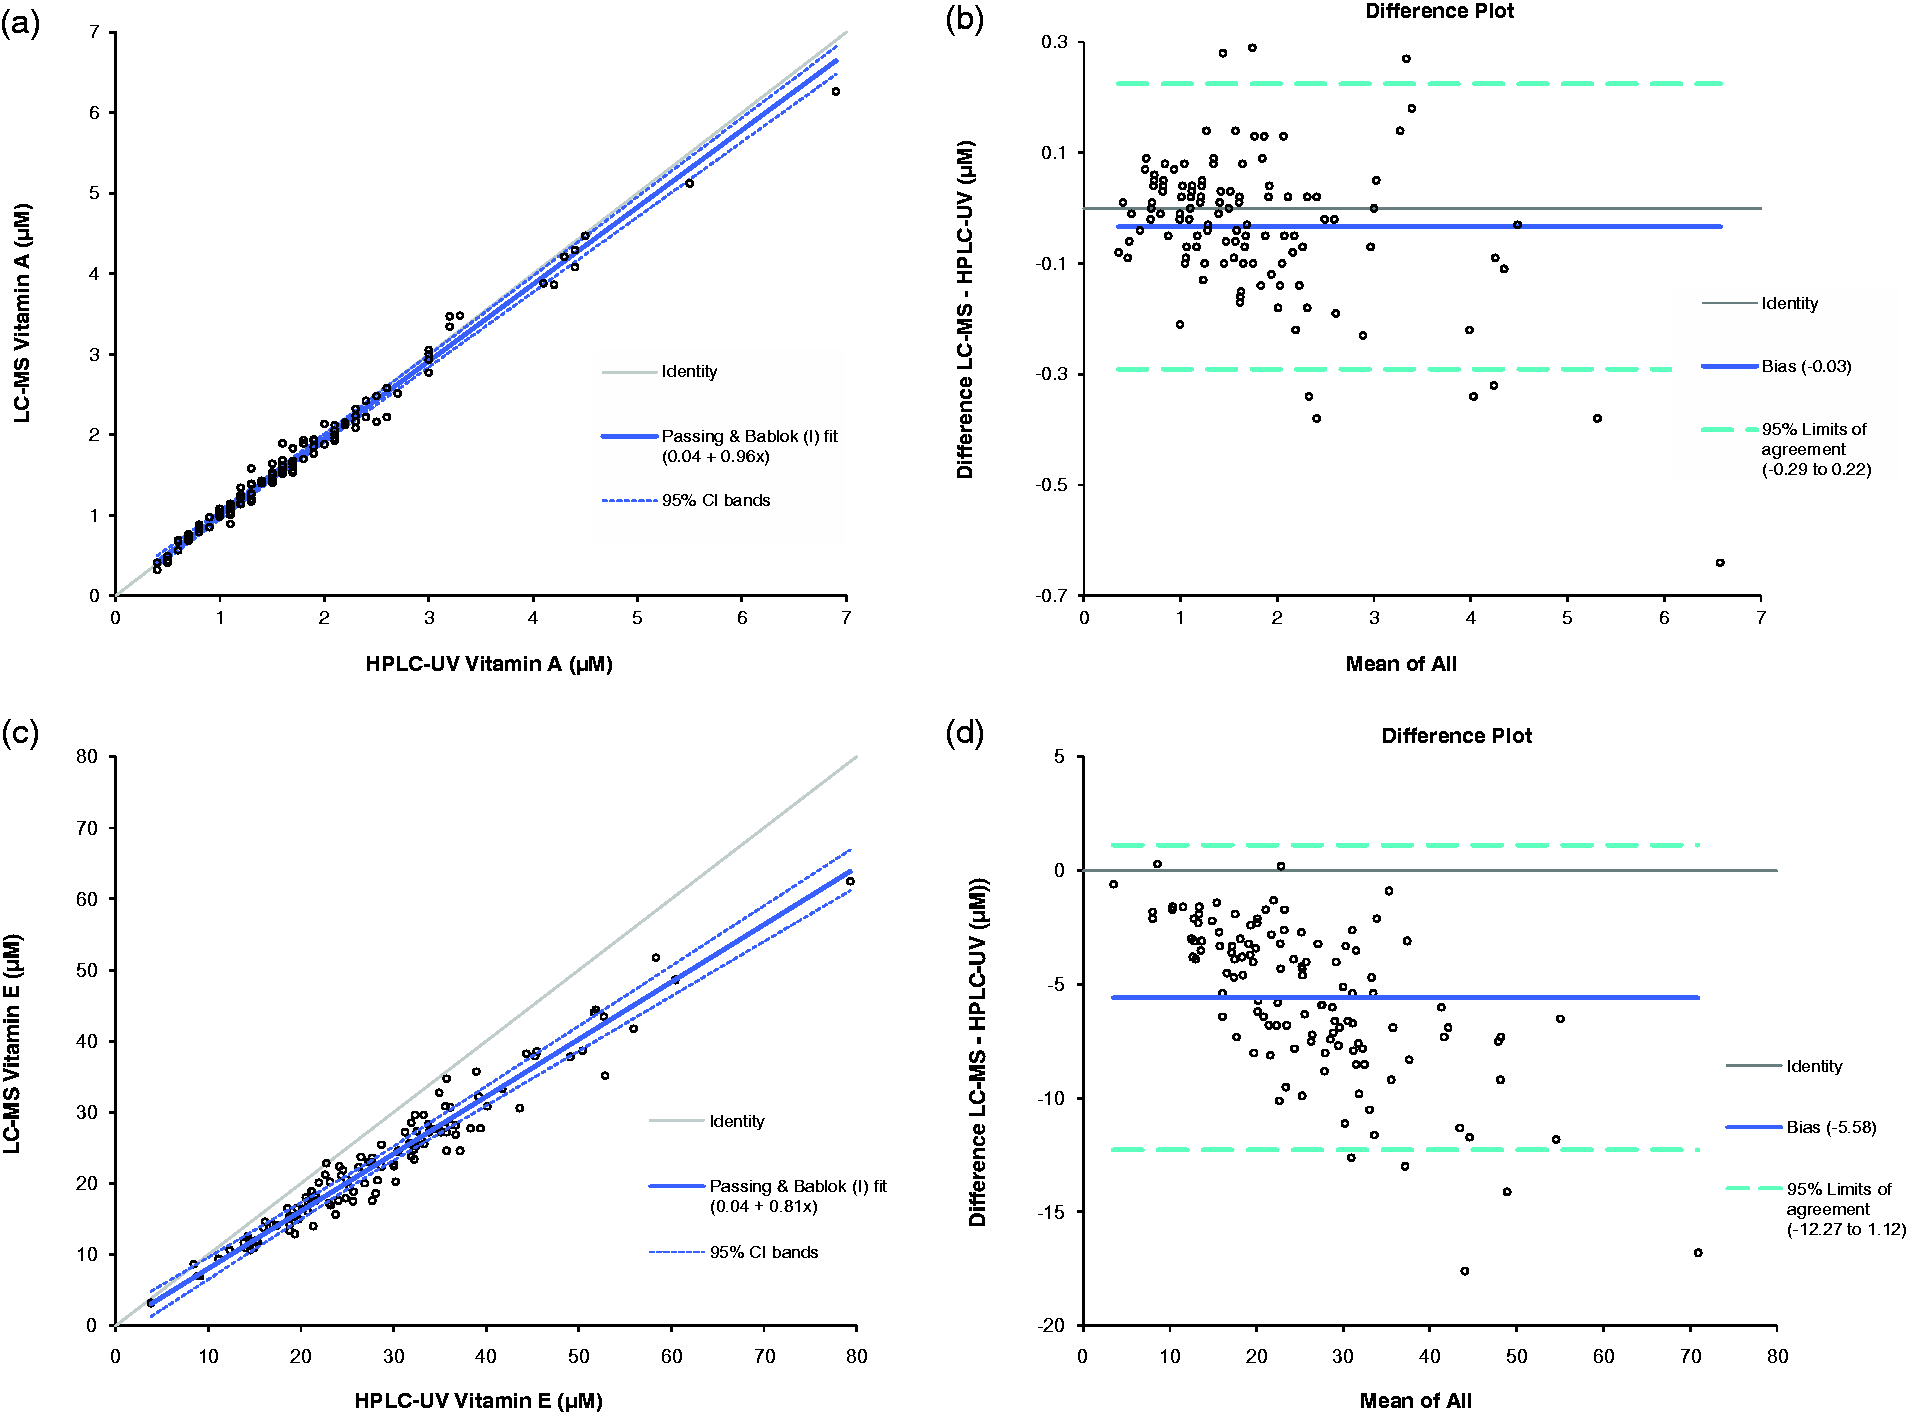
Discussion
A variety of solid phase extraction matrices including C18 and phenyl, and a variety of SLE matrices were trialled for extraction from human serum. Of these, the Isolute SLE + 96-well extraction plate gave the best combination of simplified procedure, high-throughput and ion suppression profiles. On average, the entire extraction procedure for a batch of 96 samples utilizing a single extraction plate takes 60 min, ready for LC-MS/MS analysis. This novel extraction technique can be considered a high-throughput method and facilitates routine clinical LC-MS/MS analysis of these fat-soluble vitamins.
The biphenyl phase column selected for the method yielded highly resolved peaks, short chromatographic run times and in combination with the SLE procedure, minimal and reproducible ion suppression or enhancement. The double aromatic ring functional group on the biphenyl chromatography media most likely binds retinol and alpha-tocopherol by π-π bonding between the respective aromatic groups. In contrast, a trial of a variety of C18 columns demonstrated this media to be too retentive, resulting in long chromatography run times, while C8 columns required longer organic phase wash times to minimize injection-to-injection carry-over. Total injection-to-injection cycle time was 4.3 min, which compares favourably to the 12 min chromatographic run time in the HPLC-UV assay used for the method comparison, 15 and published LC-MS/MS methods for simultaneous analysis of retinol and alpha-tocopherol.6–8 Total run time for a full 96-well plate is approximately 7 hours by the LC-MS/MS method.
The validated LC-MS/MS method demonstrated acceptable performance according to published acceptance criteria.10,12
Imprecision of the assay was assessed using three different multilevel QC materials; (1) spiked charcoal-stripped human serum matrix, (2) unadulterated pooled human serum matrix, (3) two sets of commercially available QC material available in HPLC-UV kits. Within and between-batch imprecision values assessed using these materials were all <10%. Additionally, taking into account biological variation, mean %CV values for all QC materials were within desirable analytical specifications. 16 Between-batch precision data for some QC materials tended to yield lower %CV values than the respective within batch precision data. This may be accounted for by a marginally poorer performing analytical batch the day the within batch precision data was collected.
Spiking retinol and alpha-tocopherol into a range of serum samples yielded mean % recovery values in the range 100% ± 15%. Accuracy of the assay, assessed by analysis of two sets of commercial NIST SRM 968e traceable QC material yielded values within 15% of target values. Additionally, real-time participation in the UKNEQAS vitamins scheme demonstrated all retinol and alpha-tocopherol results within the ALTM ±2SD, with mean bias from the ALTM of +3.0% for retinol and −11.2% for alpha-tocopherol. The LC-MS/MS assay documented, herein, was the only LC-MS/MS assay running within this EQA scheme at the time this work was performed, all other methods being HPLC-UV assays.
Linearity of the assay was demonstrated up to 6.0 and 80.0 μmol/L retinol and alpha-tocopherol respectively. The upper limit of the alpha-tocopherol standard curve was chosen as this concentration yielded a response close to the upper linear range of the detector. The linear range of the LC-MS/MS assay is in excess of that of the HPLC-UV assay used within the method comparison which utilizes a single point calibrator with retinol and alpha-tocopherol concentrations of 2.53 and 27.9 μmol/L, respectively. 15 The linear range chosen for the LC-MS/MS assay is also in excess of the accepted clinical reference ranges for these vitamins, and concentrations we routinely observe in our cohort of intestinal failure patients on parenteral nutrition support. Dilutional linearity experiments demonstrated that samples with concentrations above these ranges can be diluted to obtain an accurate quantitative value. The LLOQ of the LC-MS/MS assay was 0.07 and 0.26 μmol/L for retinol and alpha-tocopherol respectively. This compares favourably to the HPLC-UV assay LLOQ of 0.07 and 1.16 μmol/L for retinol and alpha-tocopherol, respectively. 15 Linearity and LLOQ specifications are in accordance with recommended values stated in recently published guidelines. 16
Specificity of the assay was determined by direct injection of a number of vitamin A-related compounds and alternative forms of tocopherol. Unfortunately due to lack of availability and cost limitations, we were unable to test all the different tocopherols and tocotrienols. However, as the molecular weights of these compounds are significantly different to the precursor m/z used for alpha-tocopherol in this method, it seems unlikely that these would cause interference. A small interfering peak was present at the retention time of alpha-tocopherol when we injected supraphysiological concentrations of gamma- and delta-tocopherols; however, even at such high concentrations the observed peak area was less than half that of the lowest concentration alpha-tocopherol standard used in the assay. Additionally, the solutions of gamma- and delta-tocopherols used in these experiments were not analytical standards, possessing a quoted purity of ≥90%. It seems likely that this small interfering peak could be a trace impurity of alpha-tocopherol in these preparations.
Stability studies demonstrated stability for retinol for up to six days storage at room temperature under artificial lighting, and seven days storage at 4℃ in the dark. Alpha-tocopherol was stable for up to three days storage at room temperature and seven days storage at 4℃ (Figure 3). These data are in agreement with recently published data, albeit which studied stability in lithium heparin plasma as opposed to serum. 17
The LC-MS/MS method was compared to a HPLC-UV assay in routine clinical use, utilizing samples taken from patients on long-term parenteral nutrition support managed within an intestinal failure unit. Comparison of the two methods demonstrated a small constant negative bias by the LC-MS/MS method for retinol, and a more pronounced negative bias by the LC-MS/MS method for alpha-tocopherol (Figure 4). Explanations for differences in results obtained between LC-MS/MS and HPLC-UV include fundamental methodological differences in calibration/traceability, internal standardization and specificity.
The HPLC-UV assay used in this method comparison is calibrated using a commercially available single-level calibrator (Chromsystems, Munich, Germany). Although this calibrator is traceable to NIST SRM 968e, the assigned values of this SRM were based upon the agreement of the means of two liquid chromatographic methods used at NIST (both of which utilize UV-vis detection systems), and from the median of results from 31 laboratories participating in the NIST interlaboratory micronutrients EQA scheme. 14 Hence, this material does not appear to conform to the standard definition of a certified reference material (CRM), i.e. one which has values traceable to a definitive method. In contrast, the LC-MS/MS method is calibrated using multilevel calibrants prepared using pure retinol and alpha-tocopherol stock solutions, albeit prepared utilizing the equivalent extinction coefficients as for the NIST SRM 968e material. 14 Repeat analysis of QC material traceable to NIST SRM 968e yielded values within target ranges, and real-time participation in the UKNEQAS vitamins scheme demonstrated LC-MS/MS values within the ALTM ±15%. Nevertheless, it seems likely that differences in traceability and standardization of the two methods may contribute to observed differences. Such deviation in alpha-tocopherol concentrations based on the use of different calibration material has been described previously. 18 Future research within this field should address the lack of a suitable higher order reference method and CRM aligned to this method. This would improve harmonization of vitamin A and E analysis between laboratories, which currently demonstrate wide interlaboratory variation in results, and consequent lack of harmonized reference ranges. 16
The HPLC-UV assay utilizes a single internal standard for both retinol and alpha-tocopherol, which elutes at a significantly different retention time to either analyte. The LC-MS/MS method utilizes deuterated internal standards for both retinol and alpha-tocopherol, eluting at the same retention time as the non-deuterated analytes (Figure 1). Previous studies have demonstrated the importance of internal standard choice in chromatographic method validation, and the significant differences that alternative internal standards may have on quantitative results within the same assay. 19
Utilizing the specific precursor and product ion transitions of alpha-tocopherol, the LC-MS/MS assay has been shown to be a highly specific method for quantitation of alpha-tocopherol. In contrast, due to the similar structures of the tocopherols and tocotrienols, chromatographic resolution of any HPLC-UV assay will need to be very high to be able to efficiently separate the varying forms of vitamin E. Specificity for alpha-tocopherol may convey advantages in the assessment of serum vitamin E status, as alpha-tocopherol is the only form of vitamin E currently used to define recommended dietary allowance. 2
To conclude, we have developed a novel high-throughput method for extraction of retinol and alpha-tocopherol from human serum, followed by simultaneous quantitation by LC-MS/MS. The method offers a rapid, sensitive, specific and cost effective alternative to HPLC-UV methodology, featuring additional benefits of deuterated internal standardization, multipoint calibration and extended linear ranges. The method also has several advantages to previously published LC-MS/MS assays including faster chromatographic run times, smaller sample volume requirements, and the high-throughput sample extraction technique described herein. In our laboratory, the method is being used routinely to monitor vitamin A and E concentrations in patients with short bowel syndrome on long-term parenteral nutrition support. Additionally, the assay has applications for monitoring other patient groups including patients with cystic fibrosis and other causes of pancreatic insufficiency, where malabsorption of fat-soluble vitamins is a common complication.
Footnotes
Acknowledgements
The authors would like to thank Phil Lockett, Catherine Treslove and David Schofield for their assistance in providing HPLC-UV data.
Declaration of conflicting interests
None declared.
Funding
This research received no specific grant from any funding agency in the public, commercial, or not-for-profit sectors.
Ethical approval
Not applicable.
Guarantor
EH.
Contributorship
EH conceived the study, performed all experimental work and data analysis, and wrote the first draft of the manuscript. JR advised on chromatography selection and optimization. PR provided ongoing support during the experimental workup. All authors reviewed, edited and approved the final draft of the manuscript.