



Abstract
Background
It is well established that high bilirubin concentrations can lead to erroneous creatinine results when measured by a Jaffe-based method. However, the effects of bilirubin on enzymatic methods appear less well-defined. The Roche Cobas 8000 enzymatic creatinine (CREP2) has an unconjugated bilirubin icterus limit of 20 mg/dL, equivalent to a bilirubin concentration of 342 µmol/L. Many hepatology patients have bilirubin levels much higher than this limit, and laboratories are unable to release creatinine results on these complex patients. This is particularly challenging for patient management, as creatinine is a key test and is a prerequisite for many procedures, imaging studies and treatments.
Methods
Two spiking studies were carried out, the first to define the interference effect of bilirubin on enzymatic creatinine measurement, and the second to see if this interference could be mitigated via dilution. Serum samples (n = 50) were spiked with a concentrated bilirubin solution. Indices, bilirubin and creatinine were measured using the Roche Cobas 8000 c702 automated analyser according to manufacturer instructions.
Results
The spiking study found a negative linear relationship and as bilirubin concentrations increased, the measured creatinine concentration decreased (R2 = 0.7828, y = −0.0597x + 15.603). Samples with a bilirubin concentration over 246 µmol/L demonstrated an average 1.48% drop in creatinine concentration per 25 µmol/L increase in bilirubin.
Conclusions
A service improvement was applied where creatinine results can be released on samples with a bilirubin concentration up to 550 µmol/L, with an appropriate comment, upon request by the clinician.
Introduction
Hospital inpatient samples can have high concentrations of lipids, bilirubin (icterus) or haemolysis and this can limit a clinician’s access to important biochemistry tests. 1 Creatinine is an important marker of renal failure, and the rejection of creatinine results due to icterus interference can be onerous for hepatologists. Patients with severe liver damage can develop life-threatening hepatorenal syndrome, which is characterised by an acute onset of renal failure within 2 weeks. Regular creatinine measurements are required to diagnose, monitor and treat this condition. 2 In addition, creatinine results are a prerequisite for many procedures, including imaging studies.
Data supporting these indices cut-offs is not always well defined. The Roche CREP2 enzymatic creatinine reagent kit insert states that icterus has ‘no significant interference up to an index of 15 mg/dL for conjugated bilirubin (approximately 257 µmol/L) and 20 mg/dL for unconjugated bilirubin (342 µmol/L)’. 3 However, this does not indicate the significance or nature of the interference beyond this concentration, other than that the effect would be ±10% on creatinine concentrations >80 µmol/L. Hepatology inpatients will regularly have bilirubin levels above 500 µmol/L, resulting in hepatologists requesting the release of creatinine results on highly icteric sera. A small local audit for 2023–2024 revealed that hepatology ward patients had bilirubin levels up to 650 µmol/L and that we could not report creatinine on 1524 samples.
A bilirubin spiking study was carried out to define the effect of increasing bilirubin concentration on creatinine measurement. In addition, it was also reviewed if this interference could be mitigated via the auto-dilution function.
Materials and methods
Samples
Anonymised spent serum samples (n = 35) with a minimum volume of 2.5 mL were retrieved for the first spiking study. Another set of anonymised samples (n = 15) were retrieved for a second spiking study. All the samples were <24 h old, had a bilirubin <20 µmol/L, haemolysis index <15 mg/dL, lipemic index <15 mg/dL and a range of creatinine concentrations (42–1382 µmol/L). The creatinine concentration distribution of the samples was as follows: <120 µmol (n = 13), 120–354 µmol/L (n = 9), 354–550 µmol/L (n = 7), 550–1000 µmol/L (n = 14) and >1000 µmol/L (n = 7).
Bilirubin spiking
Bilirubin stock solution was made by dissolving 5.85 mg of bilirubin powder in 1 mL of dimethyl sulfoxide (DMSO) (bilirubin concentration of 10,004 µmol/L). This solution was mixed for 5 min and incubated at 37°C for 20 min. Nine aliquots with a total volume of 200 µL were created for each of the 50-serum samples (n = 450) for both studies. Two aliquots were spiked with DMSO (12 µL) and freshly prepared 0.9% saline (12 µL), and seven aliquots were spiked with the bilirubin stock solution (spike volume 4–12 µL) to produce the following concentrations 250, 300, 350, 400, 450, 500 and 550 µmol/L. Aliquots were then incubated at 37°C for 5 min and then roller mixed for 5 min before analysis.
Analyser
All aliquots were run for creatinine, bilirubin, and indices on the Roche Cobas c702 analyser using the Roche Creatinine Plus Enzymatic (CREP2), Bilirubin Total Gen.3 (BILT3) and Serum Index (SI) Gen. 2 reagents. For the second study, the c702 was programmed to carry out a 1 in 5 dilution in 0.9% saline when measuring creatinine on all spiked aliquots.
Data analysis
Regression analysis and Wilcoxon signed-rank test (P ≤ .05) were utilised using Excel 365 for Business, version 2409.
Results
A Wilcoxon signed-rank test found there was no significant difference in creatinine results (42–1382 µmol/L) between the 10 µL spiked DMSO blank (n = 50) and 10 µL spiked 0.9% saline blank (n = 50) (P ≤ .05), supporting that the DMSO was not contributing significant interference. Percentage differences in the creatinine results were calculated using the DMSO blank as the baseline.
A further Wilcoxon signed-rank test found there was no statistically significant difference in creatinine results for the spiked aliquots with bilirubin values 200–342 µmol/L when compared to the DMSO blank (P ≤.05), supporting the manufacturer’s claims for unconjugated bilirubin.
For the first study, the percentage difference in creatinine concentration was plotted against the total bilirubin (µmol/L) and linear regression was applied to all the data. X predicted Y, y = −0.0597x + 15.603, R2 = 0.8, F(1,278) = 1125.67, P < .001. β = −0.06, P < .001, α = 15.77, P < .001. Figure 1(a) shows a strong negative linear relationship. Percentage (%) difference in measured creatinine was plotted against the measured bilirubin concentration (µmol/L) for each spiked aliquot. Linear regression was then applied to each group of creatinine concentration. (a) Serum samples (n = 35) with creatinine concentrations ranging between 44 and 1237 µmol/L. (b) Results from samples analysed with the one in five auto-dilution function. Serum samples (n = 15) with creatinine concentrations ranging between 42 and 1382 µmol/L.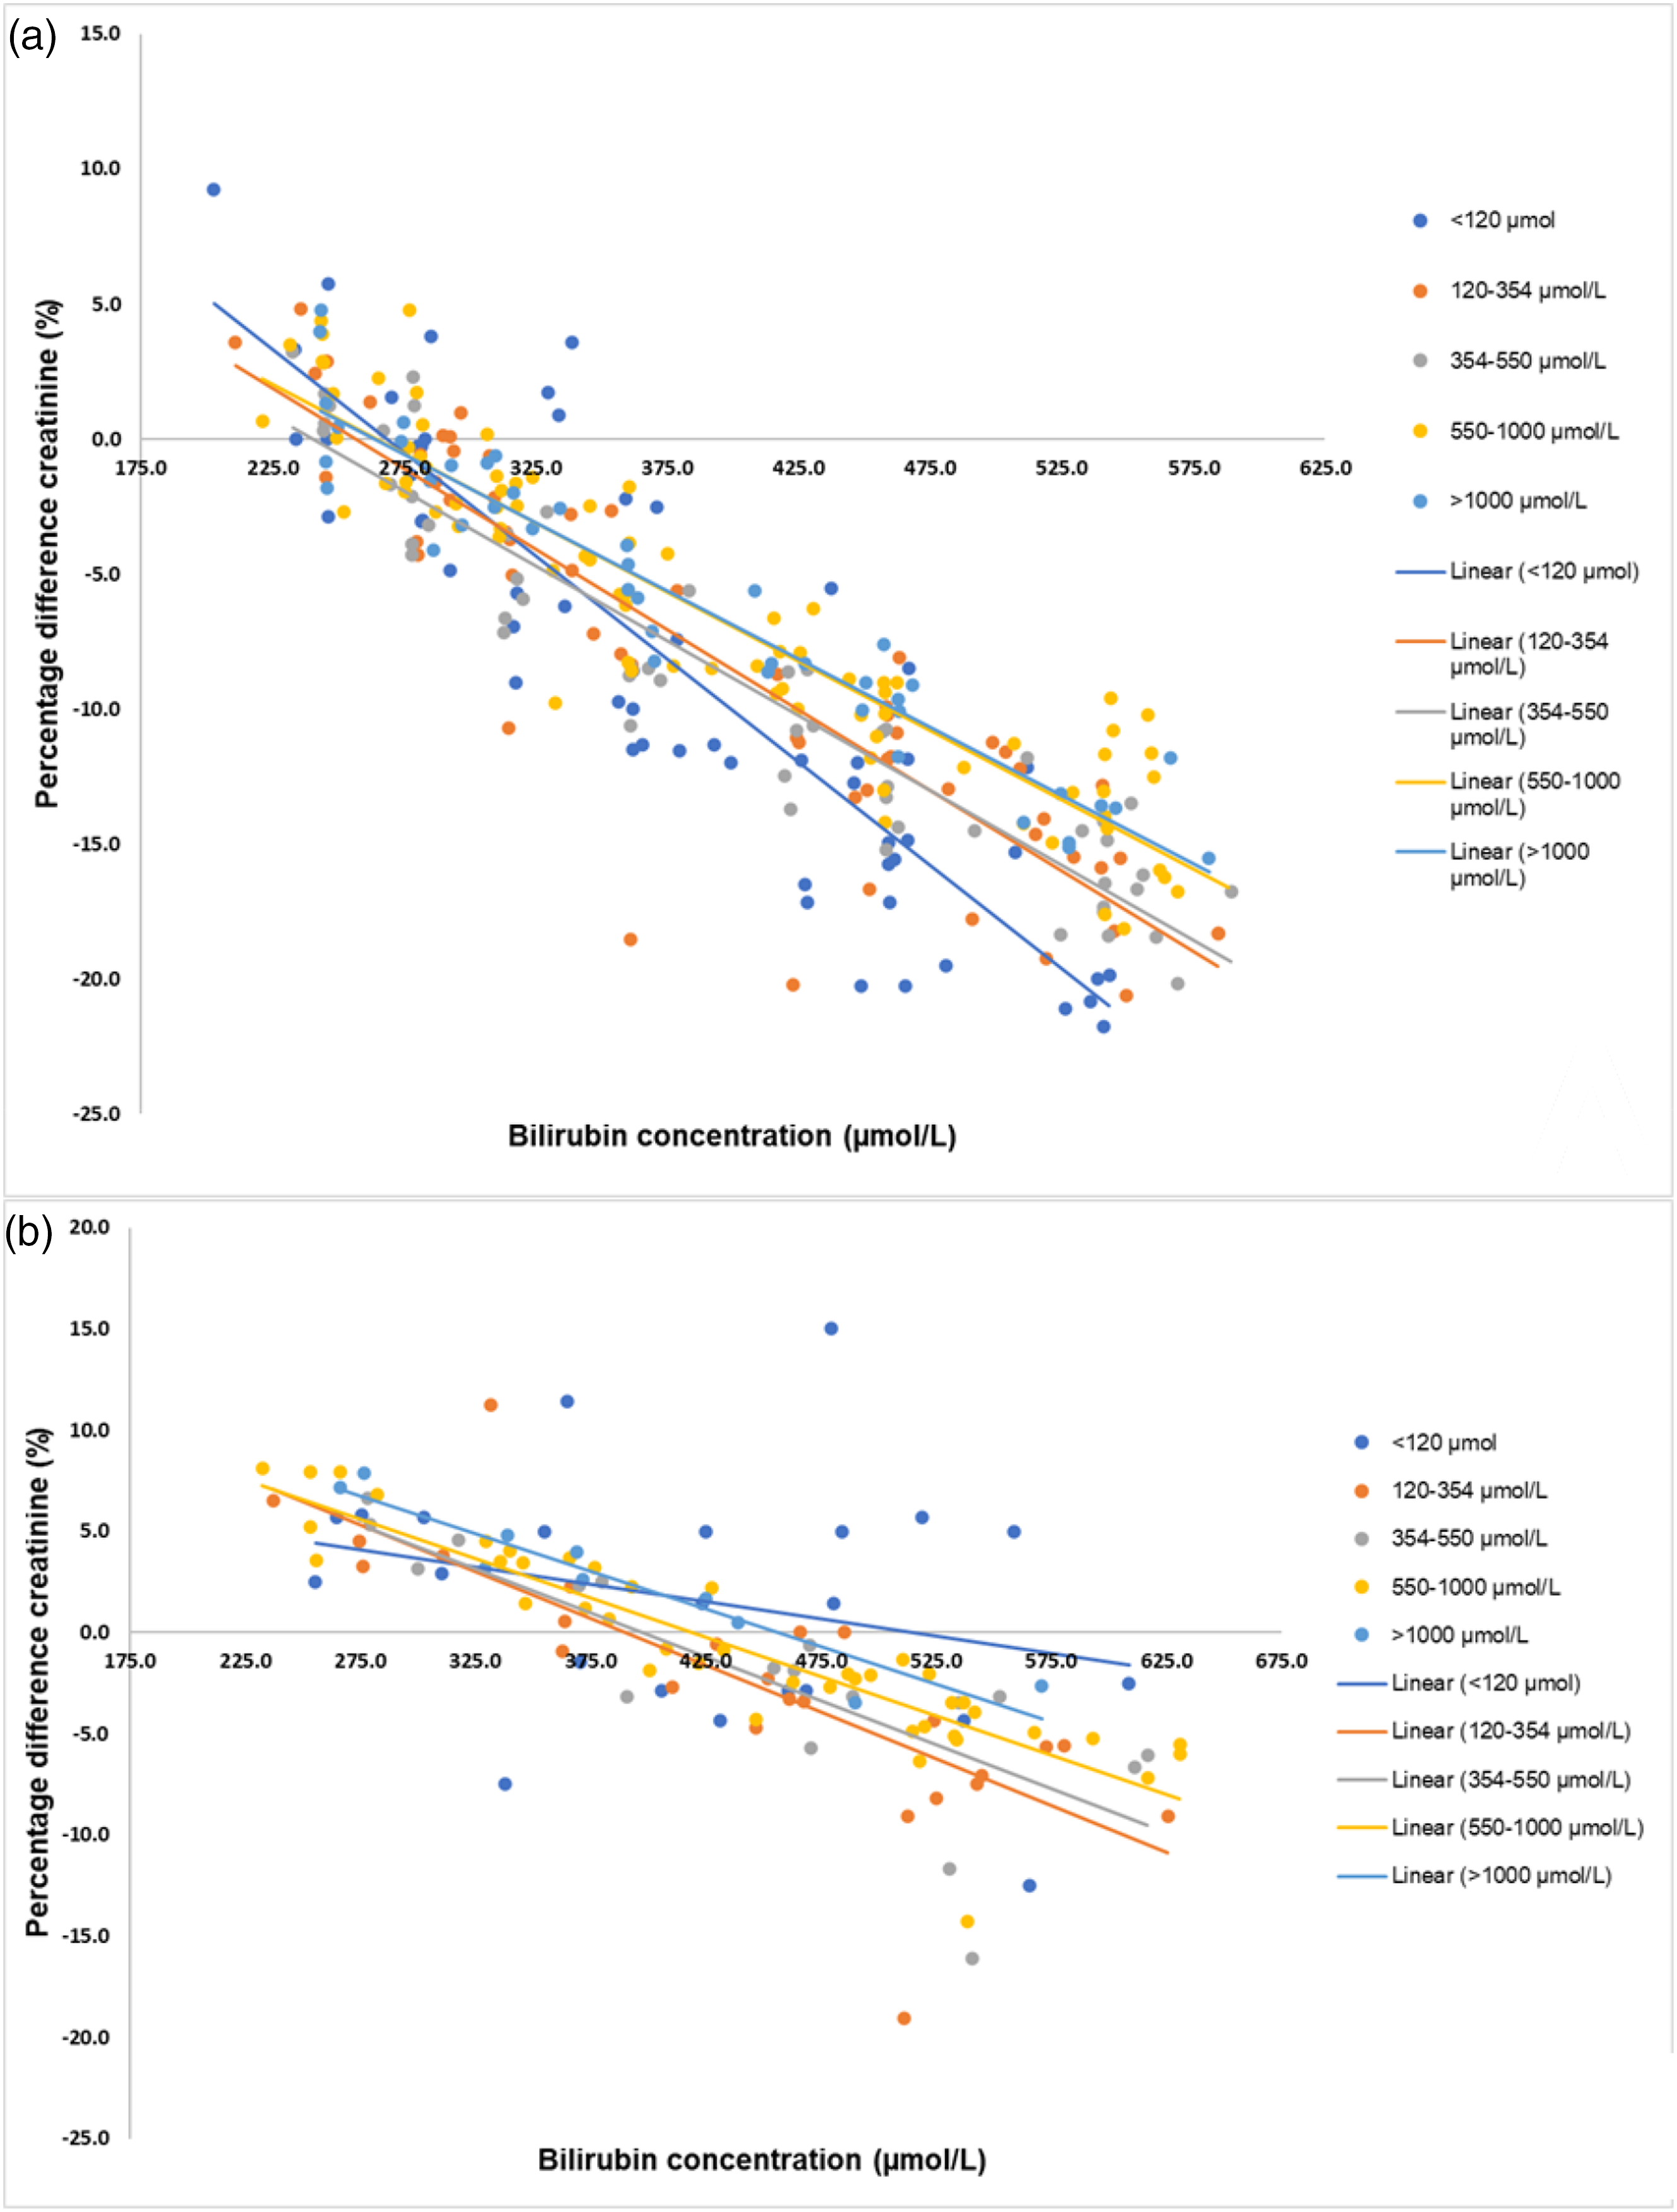
For the second study, linear regression was also applied to the percentage difference in creatinine against total bilirubin was applied to all of the data. X predicted Y, y = −0.0374x + 15.695, R2 = 0.5, F(1,128) = 153.59, P < .001. β = −0.039, P < .001, α = 16.29, P < .001. There was a mixed linear relationship with a greater number of outliers.
Figure 1 demonstrates the linear relationship between bilirubin (µmol/L) interference for different creatinine concentrations (µmol/L).
Discussion
The first spiking study found a strong negative linear relationship that as bilirubin concentrations within a range of 200–550 µmol/L increased, the measured creatinine concentration would decrease (R2 = 0.8, y = −0.0597x + 15.603). Translating to samples with a bilirubin concentration over 246 µmol/L demonstrated an average 1.48% drop in creatinine concentration per 25 µmol/L increase in bilirubin.
Negative interference from bilirubin when using a Jaffe method is well-established, 4 and this study supports the Roche enzymatic method that also experiences negative interference from bilirubin. Elevations in bilirubin (including breakdown products like biliverdin) have the potential to create interference via a range of mechanisms, including spectral interference (light absorption) and reacting with the reagent’s constituents. It is thought that for creatinine enzymatic methods the bilirubin interferes with the creatinine reagent’s hydrogen peroxide, reducing the formation of the coloured chromogen. Resulting in a smaller detected signal, which is interpreted as a lower concentration of creatinine. 5
It was hypothesised that the bilirubin interference could be diluted out. This was partially supported by the second study’s data; however, results show a mixed concentration-dependent bias with evidence of greater imprecision (Figure 1(b)). The outlying points were from different primary serum samples with varying creatinine concentrations. This imprecision could be from the auto-dilution function or that the interference does not dilute out linearly. This does appear to affect lower creatinine concentrations rather than larger creatinine concentrations (Figure 1(b)). To investigate further, linearity and precision studies could be carried out.
Limitations include difficulty in finding samples with high creatinine concentrations and a minimum sample volume of 2.5 mL. Additionally, the spiking solution was synthetic, which may not completely mimic the matrix of in vivo icteric blood. In addition, the spiking solution only mimicked the unconjugated bilirubin effects.
It was felt that the positive and negative bias produced on auto-diluted samples had a higher clinical risk than releasing results on non-diluted samples, which demonstrated a consistent negative bias with bilirubin concentrations >246 µmol/L. It was decided to release creatinine results on undiluted icteric samples up to a bilirubin concentration of 550 µmol/L, upon request of the clinician. The following caveat comment was applied: Measured creatinine is on average 10% lower with a total bilirubin between 350 and 450 µmol/L and 17% lower on bilirubin levels between 450 and 550 µmol/L. An additional caveat is attached to highlight that the negative interference will likely produce a misleadingly high eGFR reading. As well as the interpretation should be done with caution and in line with the clinical picture. Due to the algorithm complexity, acute kidney injury scores are unavailable on creatinine results released on icteric samples. This has allowed us to report an additional 1095 creatinine results, which we previously wouldn’t have.
Conclusion
A process was implemented for releasing creatinine results on samples with a bilirubin concentration of up to 550 µmol/L, with an appropriate comment detailing the effect of the interference.
Footnotes
Acknowledgements
We gratefully acknowledge the editorial support of Dr Laura Wainwright for reviewing the manuscript and granting permission to publish.
Declaration of conflicting interests
The author(s) declared no potential conflicts of interest with respect to the research, authorship, and/or publication of this article.
Funding
The author(s) received no financial support for the research, authorship, and/or publication of this article.
Ethical approval
N/A.
Guarantor
LED.
Contributorship
LED conceived the study. LED and KSS developed the study protocol, and KSS performed the experiments. LED and KSS undertook the statistical analysis. LED supervised the project. All authors discussed the results and contributed to the final manuscript.
