
Abstract
Background
Chronic kidney disease (CKD) prevalence and prognosis are currently based exclusively on glomerular functions, but the kidney tubule possesses numerous additional functions with pathophysiological and prognostic value. Tubular secretion is also critical for toxin and drug elimination but has not been well described in healthy individuals and corresponding reference ranges have not been established.
Material and methods
Among participants from the Norwegian population-based HUNT3 study we identified a healthy subset by excluding those reporting poor general health, or smoking, diabetes, cardiovascular disease, treated hypertension, severe, and CKD (eGFR <60 mL/min/1.73 m2). We measured 12 well-characterized markers of tubular secretion in blood and urine using liquid chromatography mass spectrometry (LC-MS). Tubular secretory function was reported for each marker as urine/plasma-ratio (UPR, with and without indexing to urine creatinine and osmolality), clearance, and fractional excretion.
Results
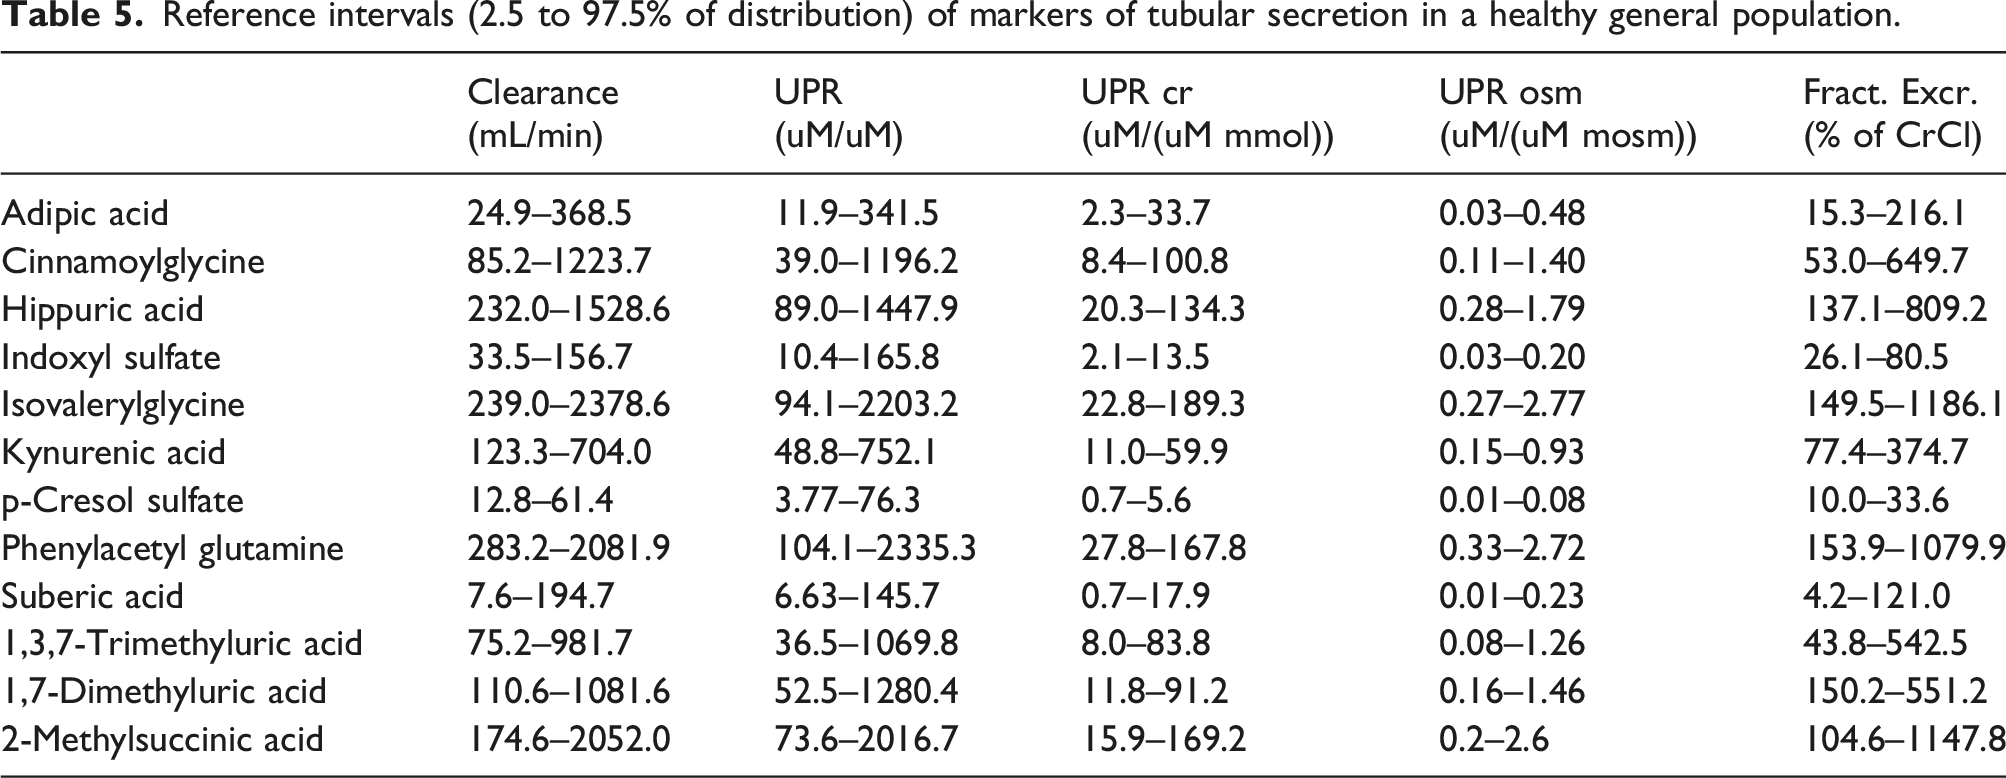
We included 636 healthy participants (295 men) with mean age 47 years (SD 14). Less than 3.2% of participants in age and sex subgroups fell outside the upper and lower limits of a common reference interval, so partitioning for age and sex was not necessary. Median urine/plasma ratio indexed for creatinine (UPRcreat) ranged from 3 to 87 uM/uM·mmol, and plasma clearance ranged from 35 to 976 mL/min. Phenylacetylglutamine, isovalerylglycine, 2-methylsuccinic acid, and hippuric acid demonstrated the highest UPRcreat values (87, 75, 72, and 61 uM/uM·mmol, respectively). We also measured 1,7-dimethyluric acid, kynurenic acid, adipic acid, suberic acid, cinnamoylglycine, 1,2,7-trimethyluric acid, indoxyl sulfate, and p-cresol sulfate. Reference intervals based on 2.5th and 97.5th percentiles were similar across age and sex.
Conclusion
This study quantifies reference ranges of endogenous tubular secretory solutes among a population of community dwelling healthy adults.
Introduction
Chronic kidney disease (CKD) affects 10% of adults worldwide and is associated with poor individual and public health. 1 CKD carries a high risk of cardiovascular complications and can progress to kidney failure needing dialysis or transplantation. 2 For decades, CKD prevalence and prognosis have been classified using serum creatinine (and its derivative estimated glomerular filtration rate (eGFR) equations) and urine albumin ratios, reflecting the function and injury of glomeruli in the kidney. 3 However, the ability of these tests to classify and prognosticate kidney disease is suboptimal,4,5 and there is an urgent need for better biomarkers to inform kidney prognosis.
The kidney tubules and surrounding interstitium also carry strong, independent prognostic information. It is well established from kidney biopsy studies that the degree of tubulointerstitial fibrosis on kidney biopsy more precisely predicted kidney function decline than do the glomerular findings. 6 Results are similar in diabetic kidney disease, IgA nephropathy, and lupus nephritis, and thus appears consistent across CKD etiologies.7–11 However, kidney biopsies are rarely done unless there is a pressing clinical indication as they are invasive and carry a risk of complications. Non-invasive plasma and urine biomarkers of kidney tubular function have recently been described that strongly associate with clinical endpoints including CKD progression and acute kidney injury (AKI) events in persons with prevalent CKD. 12 This has been proposed as a new and promising group of biomarkers in kidney medicine, carrying both functional, diagnostic, and prognostic information. This includes biomarkers of proximal tubular reabsorption, tubular damage, tubular inflammation, fibrosis, tubular protein production, and tubular secretion of drugs and toxic waste products.
For example, lower tubular secretion capacity was associated with risk of adverse events and faster eGFR decline in patients with preexisting CKD participating in the SPRINT hypertension trial.13,14 Likewise, lower tubular secretion associated with greater risk of CKD progression and mortality in the CRIC cohort of CKD patients. 15 Lower tubular secretion capacity associated with major kidney events in patients in intensive care. 16 In a study with kidney biopsies, patients with higher degrees of chronic tubulointerstitial fibrosis, and acute tubule injury had significantly lower tubular clearance of endogenous secretory solutes, 17 demonstrating that these markers are directly related to tubular pathology.
However, studies on tubular secretion have only been done in large CKD populations, and normal ranges in healthy individuals in the general population have not been available. Reference intervals have not been well described and are needed before these novel biomarkers can be compared across studies or move into clinical practice. Here we describe levels in urine and plasma of common tubular secretion markers with corresponding estimates for tubular secretion in healthy participants from a cross-sectional population study, discuss a few different ways of expressing the tubular secretion, and we provide suggested reference levels.
Materials and methods
The HUNT study
The Trøndelag health study (HUNT) is a large cross-sectional population-based health study in North Trøndelag county in Central Norway. Since the first wave of the study in 1986 (HUNT1), the entire adult population has been invited every 10th year to contribute with epidemiological data, clinical measurements, and biospecimens (blood and urine). This population-based study is regarded as representative of the Norwegian population, albeit that the area has no major cities and has slightly lower levels of education and minority populations than the average for Norway. 18 Furthermore, relevant Norwegian socioeconomic, healthcare, and kidney specific relationships are similar to other Western industrialized countries. 19
Inclusion and exclusion criteria, biosampling, and clinical measurements
We analyzed biomaterials from participants of HUNT3, which were collected between 2006-08 from 50,586 participants.
18
Blood samples were drawn in all participants, while urine collections were obtained from those who were willing or able to deliver a sample on-site on demand. In total, 11,878 participants delivered a non-fasting, mid-stream urine sample, which was frozen within 2 hours. From these, we selected a 10% random sample for kidney tubular studies, and a healthy subsample without major comorbidities was subsequently selected for the current study (Figure 1). We included healthy participants according to the Clinical and Laboratory Standards Institute guideline C28-A3 principles and long-standing general recommendations for developing reference ranges,20,21 that is, good or excellent general health, no known diseases, and no signs or risk factors for the specific condition under study. Specifically, we therefore included subjects with signed written consent for participation in HUNT3, aged over 18 years, and reporting good or excellent general health. Exclusion criteria were a history of diabetes, cardiovascular disease, treated hypertension, current smoking, body mass index (BMI) > 35, estimated glomerular filtration rate (eGFR) < 60 mL/min/1.73 m2, or urinary albumin-to-creatinine ratio (ACR) > 3 mg/mmol (30 mg/g). Flow-chart describing selection of healthy participants.
Diabetes mellitus (DM) was defined as having a DM diagnosis made by a physician, using diabetes medication, or having a non-fasting serum glucose >11 mmol/L at the HUNT examination. Cardiovascular disease (CVD) was defined as having a history of myocardial infarction, hemorrhagic and or ischaemic stroke, transient ischaemic attack, or central or peripheral arterial disease. Body mass index (BMI) was defined as weight in kilograms divided by the square of the height in meters (kg/m2).
Routine laboratory measurements
Routine blood sample tests for CKD patients were analyzed at a central ISO-9001 certified and ISO/IEC-17025 accredited laboratory (Levanger Hospital, Norway) using fresh blood and urine samples (Architect ci8200 autoanalyzer from Abbot Diagnostic, Longford, Ireland). The quality control program included daily and weekly internal calibration as well as an external quality control program (Labquality, Finland). Creatinine was measured by the Jaffé method and calibrated to isotope-dilution mass-spectroscopy (IDMS) level using an enzymatic method (Roche). Urine albumin was determined by an immune-turbidimetric method using anti-human serum albumin from Abbott Laboratories (Abbott Park, IL, USA). Urine osmolality was measured using a nephelometric method with a freezing-point depression technique (Fiske osmometer, Fiske Corp., USA).
Tubular secretion markers measurements
We utilized urine and blood samples which had been stored at −80 C since the HUNT3 examination. We measured a panel of 14 different tubular secretion markers previously used in publications from our and other laboratories.14–16 The markers were selected based on specificity for secretion by organic anion transporters (OAT) in proximal tubular cells, where earlier studies have shown an increase in circulating concentrations after OAT-transporter knockout in experimental models.22–27 Our markers were also selected for having high reported protein binding percentage and/or kidney clearances that substantially exceed GFR. Selected measures included 2-methylsuccinic acid, adipic acid, isovalerylglycine, suberic acid, p-cresol sulfate, kynurenic acid, 1.7-dimethyluric acid, cinnamoylglycine, 1.3.7-trimethyluric acid, indoxyl sulfate, phenylacetylglutamine, hippuric acid, m-hydroxyhippuric acid, and N-tigloylglycine. Additional information about each secretory solute is available in the Human Metabolome Database (https://www.hmdb.ca).
The markers were analyzed on a liquid chromatography–mass spectrometry (LC-MS) platform established and validated in our institution. In brief, all samples, standards, and quality control (QC) samples were treated equally by elution through a Waters Ostro (p/n 186005518) sample preparation plate in a 96-well format. All urine samples were diluted tenfold before sample processing, while plasma was processed undiluted. A 10 µL 25 µM isotope-labeled internal standard (IS) mixture was added to all wells, followed by 40 µL of sample, standard, or QC. Then, 150 µL of 1% (v/v) formic acid in acetonitrile was added, and the plate was placed on a shaker for 2 min to facilitate precipitation. The plates were then transferred to a positive pressure manifold, and 30 lbf/in2 pressure was applied for 15 min. The collection plate was dried in a speedvac centrifuge for 2 h at 45°C under a vacuum of 5 torr. Just prior to analysis, 50 µL of LC-MS water was added to all wells, and the plate was placed on a benchtop shaker at 500 r/min for 1 hour at room temperature. In the final step before analysis, the plate was centrifuged for 2 min at 800 r/min to ensure that all liquid was at the bottom of the well.
We used external standards for calibration curves of each marker and quality controls. Analyses were performed using an ACQUITY UPLC system coupled to a Xevo TQ-XS triple quadrupole mass spectrometer (Waters, Milford, MA) equipped with an electrospray ionization (ESI) source operating in negative mode. UHPLC–MS/MS data were acquired and processed using MassLynx software (v4.2) and the TargetLynx application manager. The chromatographic column was a Waters ACQUITY UPLC® HSS T3 1.8 µm (100 Å. 150 mm × 2.1 mm L × I.D. 1.8 µm), and the column manager was set to 45°C.
Analytes were quantified using one selected precursor ion-product ion transition, see Supplement. Internal standards were used for 8 out of 14 analytes. For analytes without an isotope-labeled internal standard, a closely eluting internal standard was used for correction. A 10–20 ms dwell time was calculated for each transition, as recommended by the auto dwell function in MassLynx, to ensure 15 data points across the peaks. Samples were analyzed in batches, with each batch consisting of 82 samples processed into Waters square well 2 mL 96-well collection plates. Each batch also contained seven standards with all analytes in the concentration range of 10 nM to 50 000 nM. Additionally, two more standards containing phenylacetylglutamine and hippuric acid were included at concentrations of 250 µM and 750 µM. Each batch also contained four 3125 nM standard mix wells serving as quality controls (QC) evenly spread across the sample plate. Each plate also contained a blank injection at the start to ensure a clean system and establish the noise level. A detailed description of other aspects of the analytical setup and method is given in the Supplement.
Estimation of tubular secretion
Tubular secretion is traditionally expressed as clearance (mL/min), but other measures like fractional excretion relative to creatinine, and the urine-to-plasma ratio with or without indexing to account for dilution have also been used. Renal clearance, that is, the amount of blood fully cleared of a substance X per minute (ml/min), is calculated as Ux * volume/Px, where Ux is the urinary concentration of substance X and Px the blood concentration of substance X, as shown by an earlier publication from our group. 28 Urine volume is rarely available in clinical practice and inherently hampered with substantial measurement error. We therefore estimated urine volume as the creatinine excretion rate (calculated from age, sex, weight, and plasma phosphate level 29 divided by urine creatinine concentration). The urine/plasma ratio (UPR) has also been used in several publications13,14 due to its simplicity and lack of assumptions. We report UPR indexed to urine creatinine and to osmolality as well as without any indexing. Fractional excretion (FE) has also been used as it is easy to interpret as a percentage of the patient’s tubular secretion of creatinine. While clinically interpretable, this method is often not used in research studies because its calculation incorporates serum creatinine (a GFR surrogate). FE was calculated as 100 * Ux/Px * Pcreat/Ucreat.
Sample size
Although several studies have shown that newer techniques with resampling can reduce the number of subjects needed to establish reference intervals, 30 most guidelines still advocate that more than 120 subjects is needed in each group to sufficiently reduce the uncertainty of the reference interval determination. 20 We planned to include at least 250 men and 250 women to obtain accurate results and have the ability to partition the reference intervals, if needed.
Statistics
Continuous variables were summarized with means (standard deviations, SD) or as medians (IQR) for non-normally distributed variables. Spearman’s correlation matrix was used to represent the relationships among urine/plasma ratios of individual secretion markers and the overall composite secretion score with Bonferroni adjusted P-values to account for multiple comparisons. Outliers were defined as more extreme than the first quartile minus 1.5 times the interquartile interval (IQR) or the third quartile plus 1.5 times IQR and excluded as suggested by Tukey and the IFCC.20,31 Reference intervals were determined by the 2.5th and 97.5th percentiles with no assumptions about the underlying distribution (Stata command centile), and we also report the 25th, 50th, and 75th percentiles to fully describe the distributions. We did not use statistical testing of subgroup differences to decide on partitioning of reference intervals as clinically unimportant differences will often test significantly if the sample size is large enough. Furthermore, subgroups can have identical means leading to nonsignificant differences but with substantially differing distributions at the extremes necessitating reference interval partitioning. We therefore evaluated the need for reference interval partitioning as suggested by Clinical and Laboratory Standards Institute (CLSI), International Federation of Clinical Chemistry (IFCC), and others20,32: if the proportion of individuals in a subclass (male/female, above/below age 55 years) outside one of the reference limits for the combined groups exceeds 4% (instead of the desired 2.5%), partitioning is recommended. 20 Otherwise, a common reference range was reported. We also calculated a composite score based on all biomarkers to represent overall tubular secretion in the correlation analysis: all individual urine/plasma of the markers were natural log transformed, standardized to a common 0–100 scale using the Min-Max method, and then averaged. 17 All data were analyzed using the STATA 18 statistical software (StataCorp. 2023, Stata Statistical Software: Release 18. College Station. TX: StataCorp LLC).
Ethics
The project was approved by the Regional Ethics Committee Central Norway. All participants signed an informed broad consent form with information about the project, possible disadvantages, and benefits in accordance with the General Data Protection Regulation (GDPR).
Results
Characteristics of the healthy study cohort and the HUNT3 cohort.
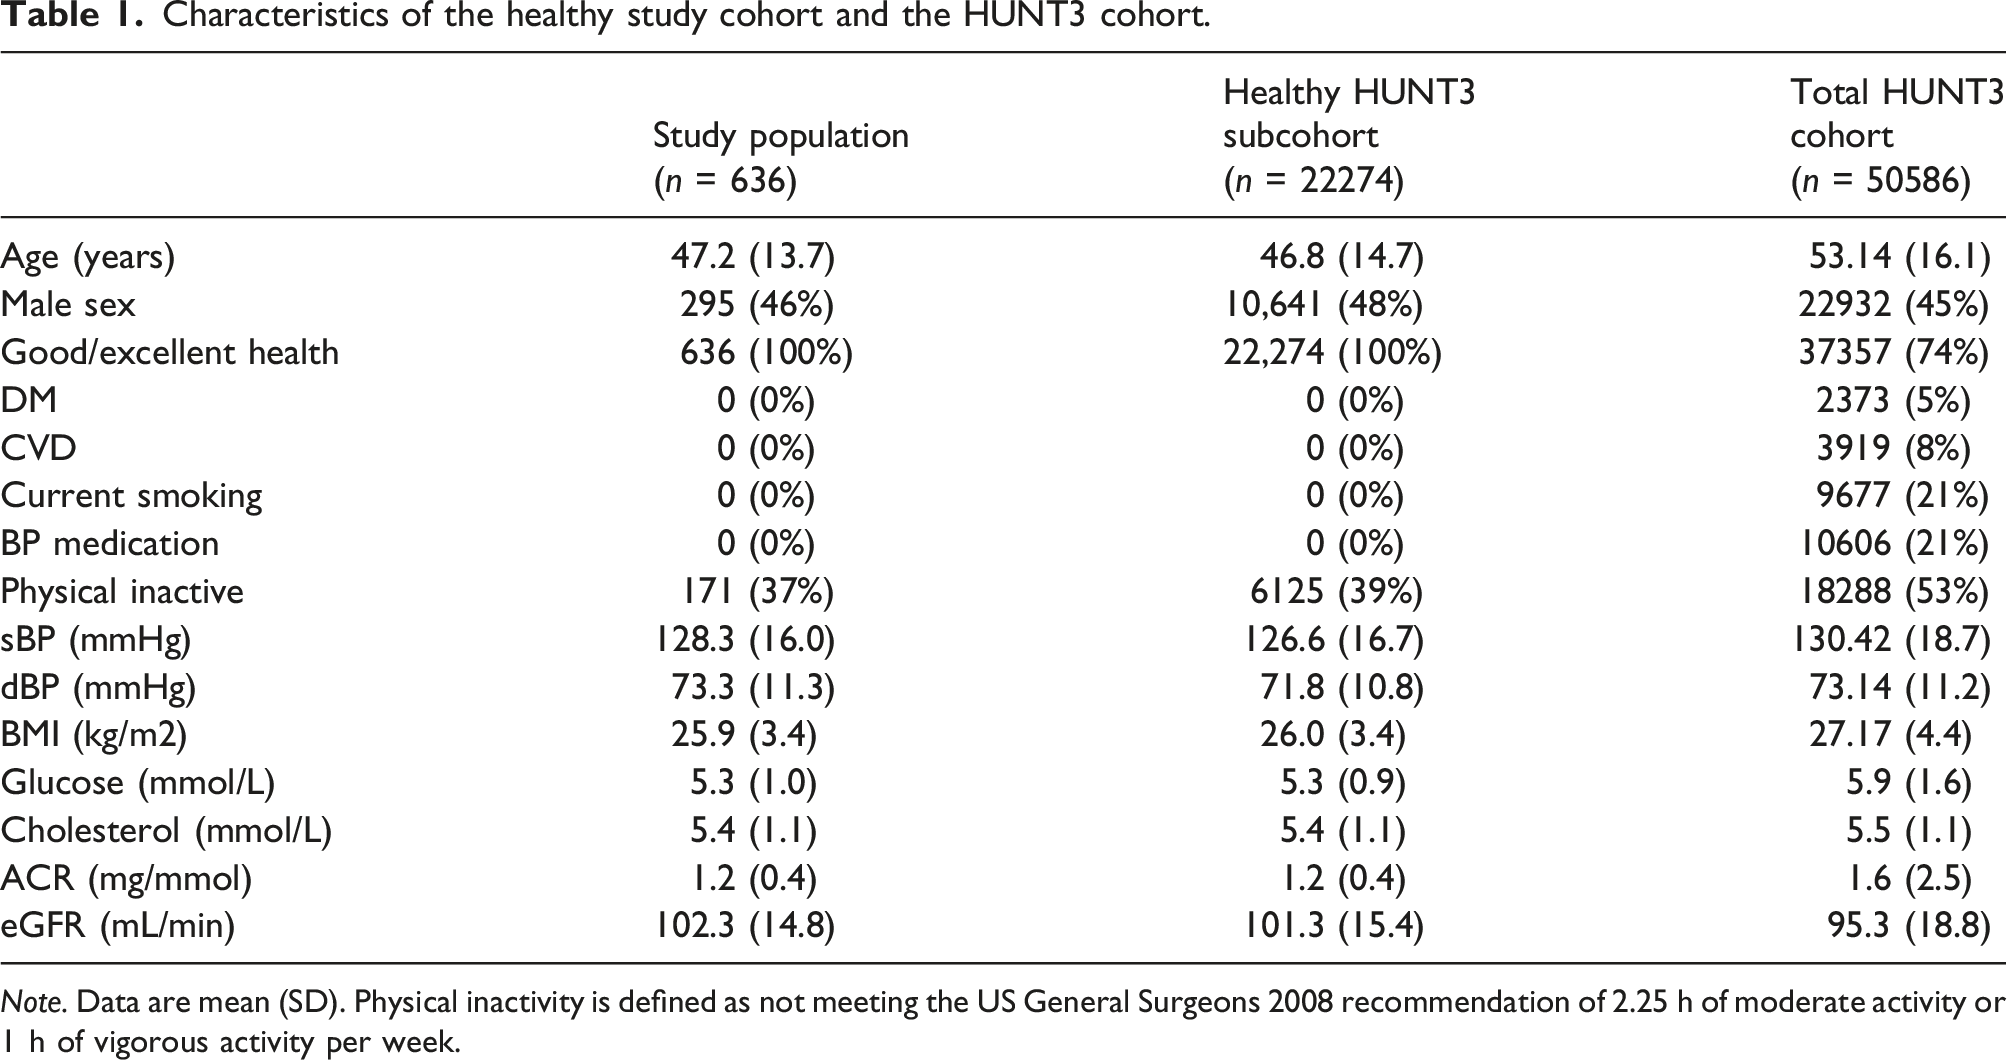
Note. Data are mean (SD). Physical inactivity is defined as not meeting the US General Surgeons 2008 recommendation of 2.25 h of moderate activity or 1 h of vigorous activity per week.
We analyzed 14 different biomarkers in urine and plasma known to be reliable markers of tubular secretion based on previous clinical and experimental studies. The analyses of m-hydroxyhippuric acid were technically challenging and did not give reliable results, and the majority of plasma measurements of N-tigloylglycine fell below the level of detection. These two markers were therefore excluded from further analyses.
General description of individual secretion markers, their tubular secretion mechanism, analytical variation, and measured urine and plasma levels median (interquartile range Q1–Q3) in the healthy general population.
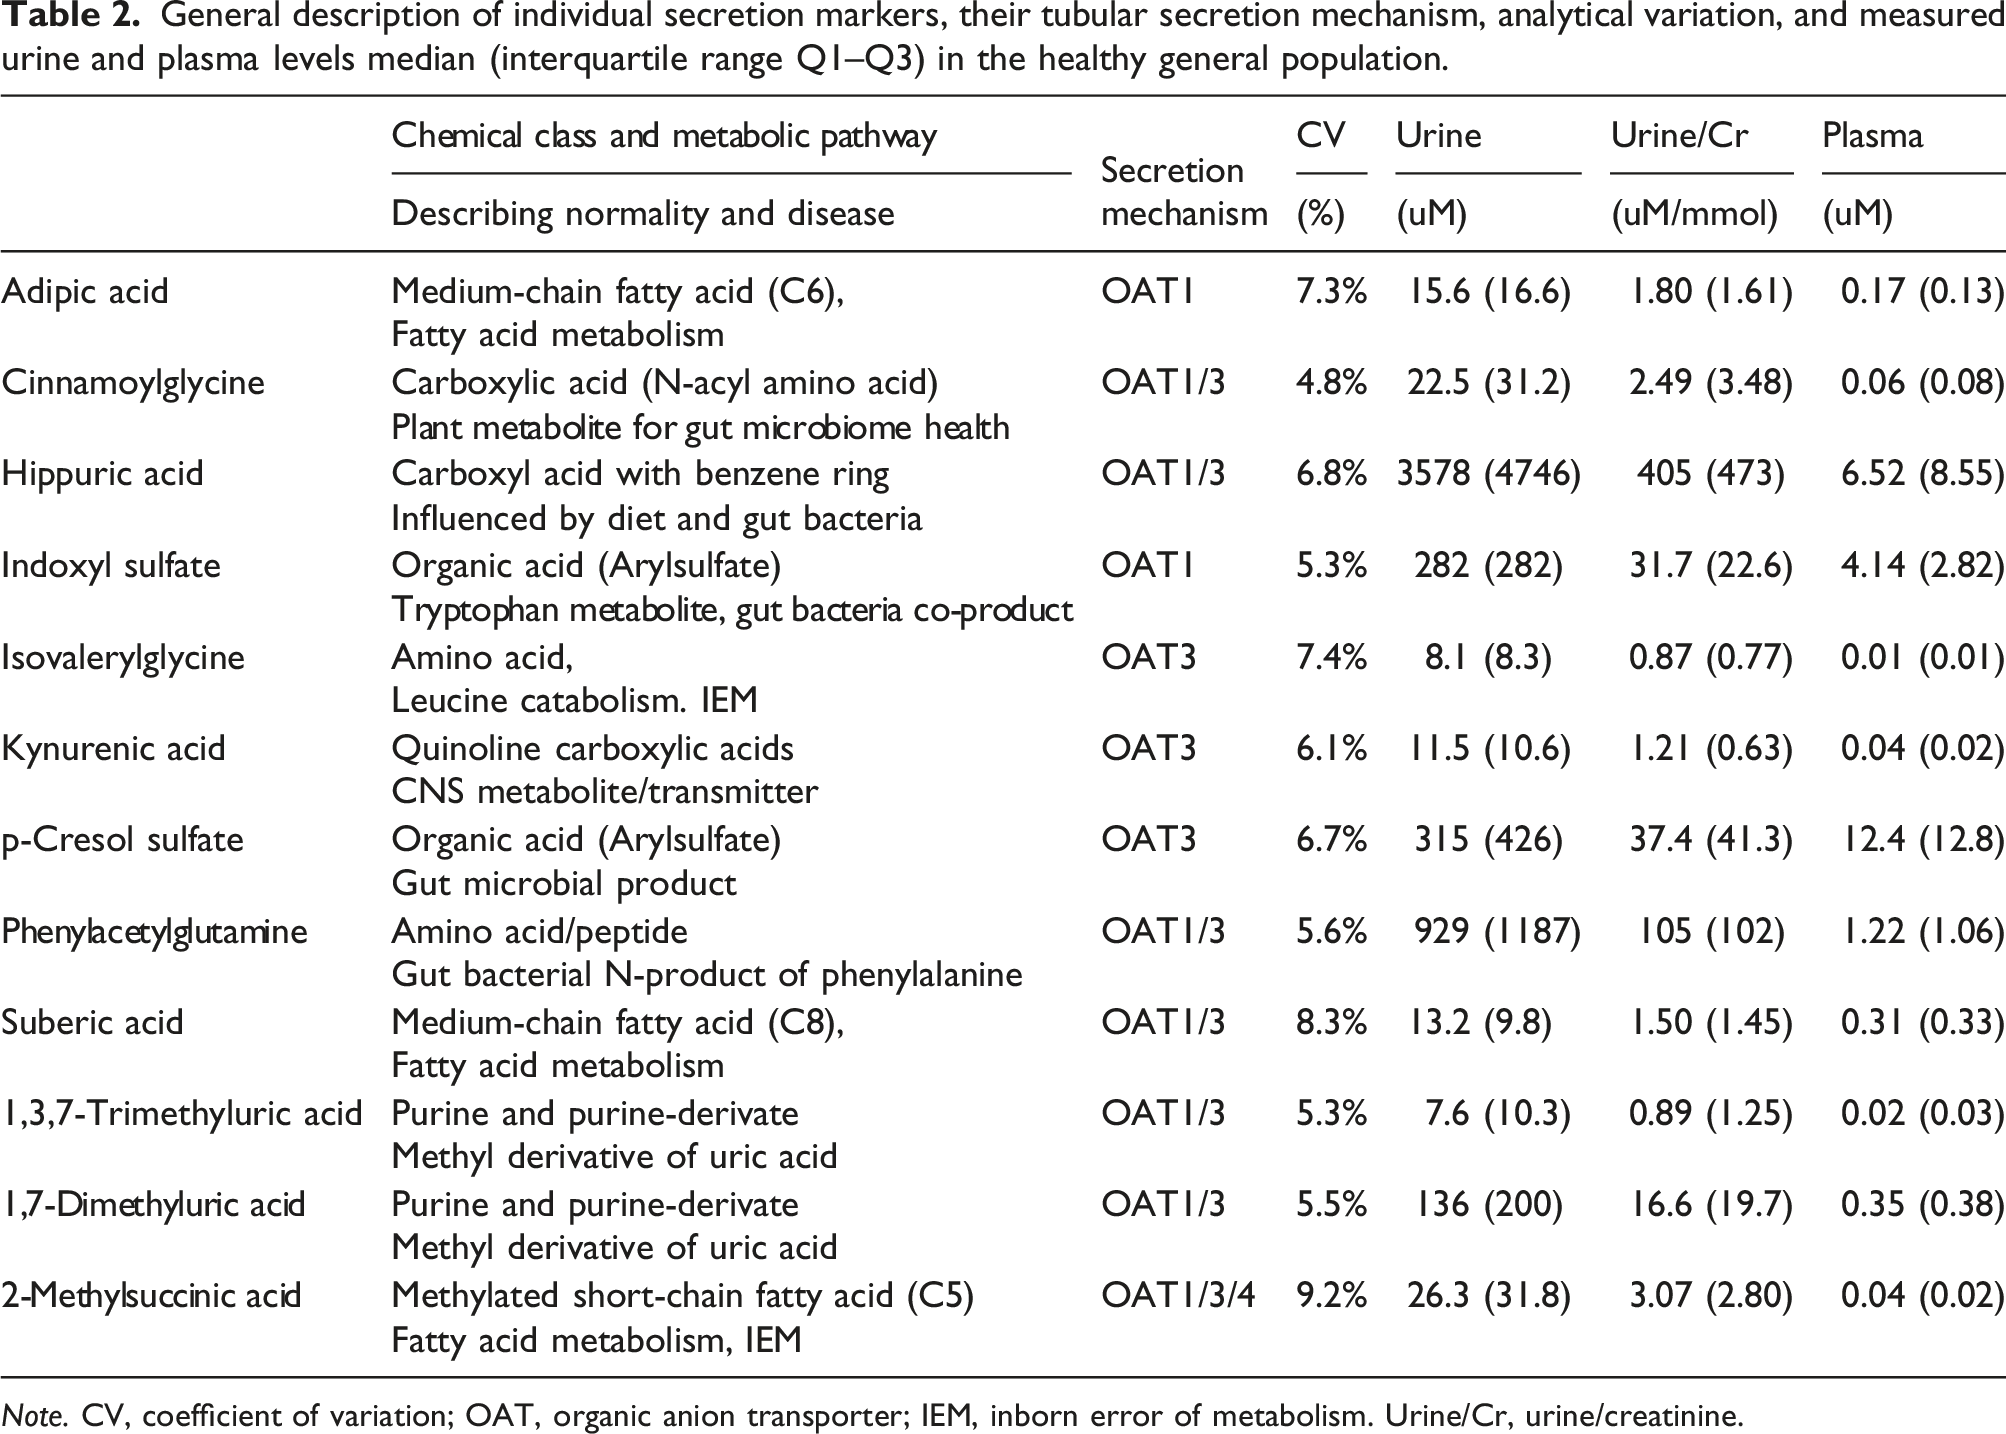
Note. CV, coefficient of variation; OAT, organic anion transporter; IEM, inborn error of metabolism. Urine/Cr, urine/creatinine.
In general, urine concentrations were much higher than plasma concentrations, consistent with efficient secretion of the metabolites. For example, 2-methylsuccinic acid is a methylated short-chain fatty acid normally produced during fatty acid degradation. The metabolite is excreted via OAT1, OAT3, and OAT4 in the proximal tubule, we could measure it with a good CV of 9 %, and it demonstrated 600-fold higher levels in urine compared to plasma indicating active tubular secretion (26 umol/L vs 0.04 umol/L). Similar data are given for the remaining biomarkers, and comparison of urine concentrations to published studies is provided (Supplemental Table 1).
The urine/plasma ratios can be utilized to develop a composite secretion score, as described elsewhere.13,14
Correlation matrix representing the relationships among UPRcreatinine of individual secretion markers and an overall composite secretion score.
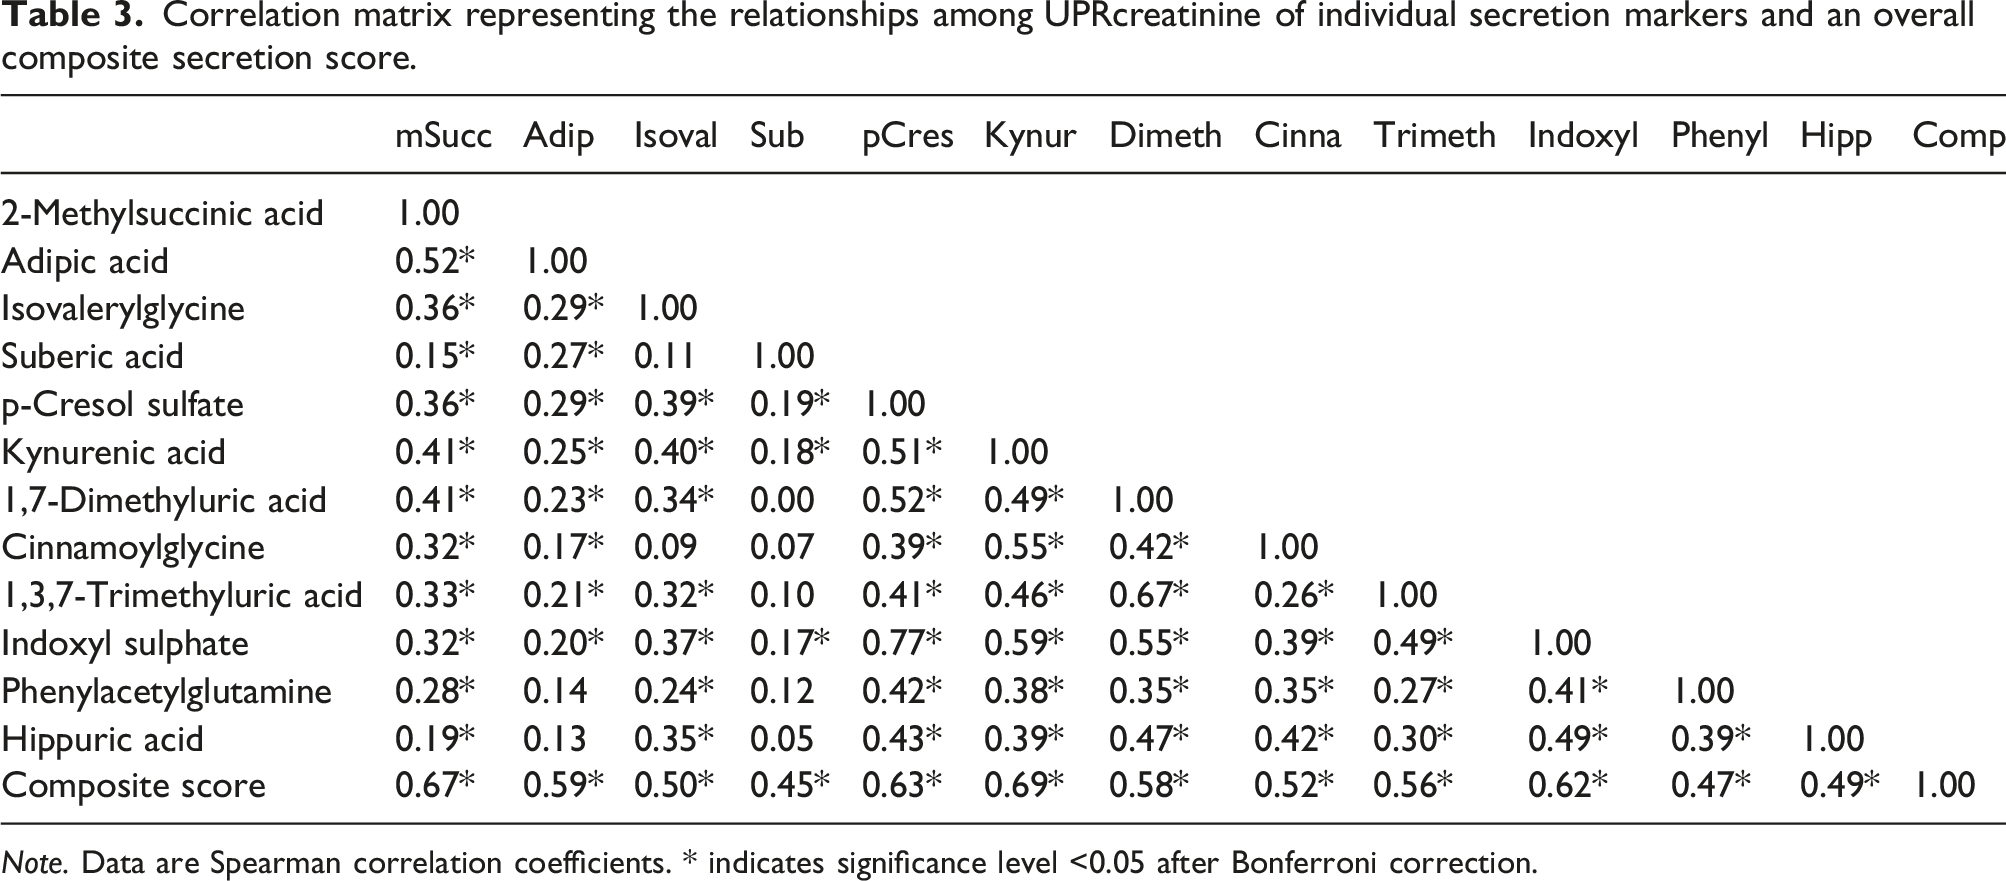
Note. Data are Spearman correlation coefficients. * indicates significance level <0.05 after Bonferroni correction.
Distribution of various markers of tubular secretion in a healthy general population. Data are median (interquartile range) due to non-normal distributions.
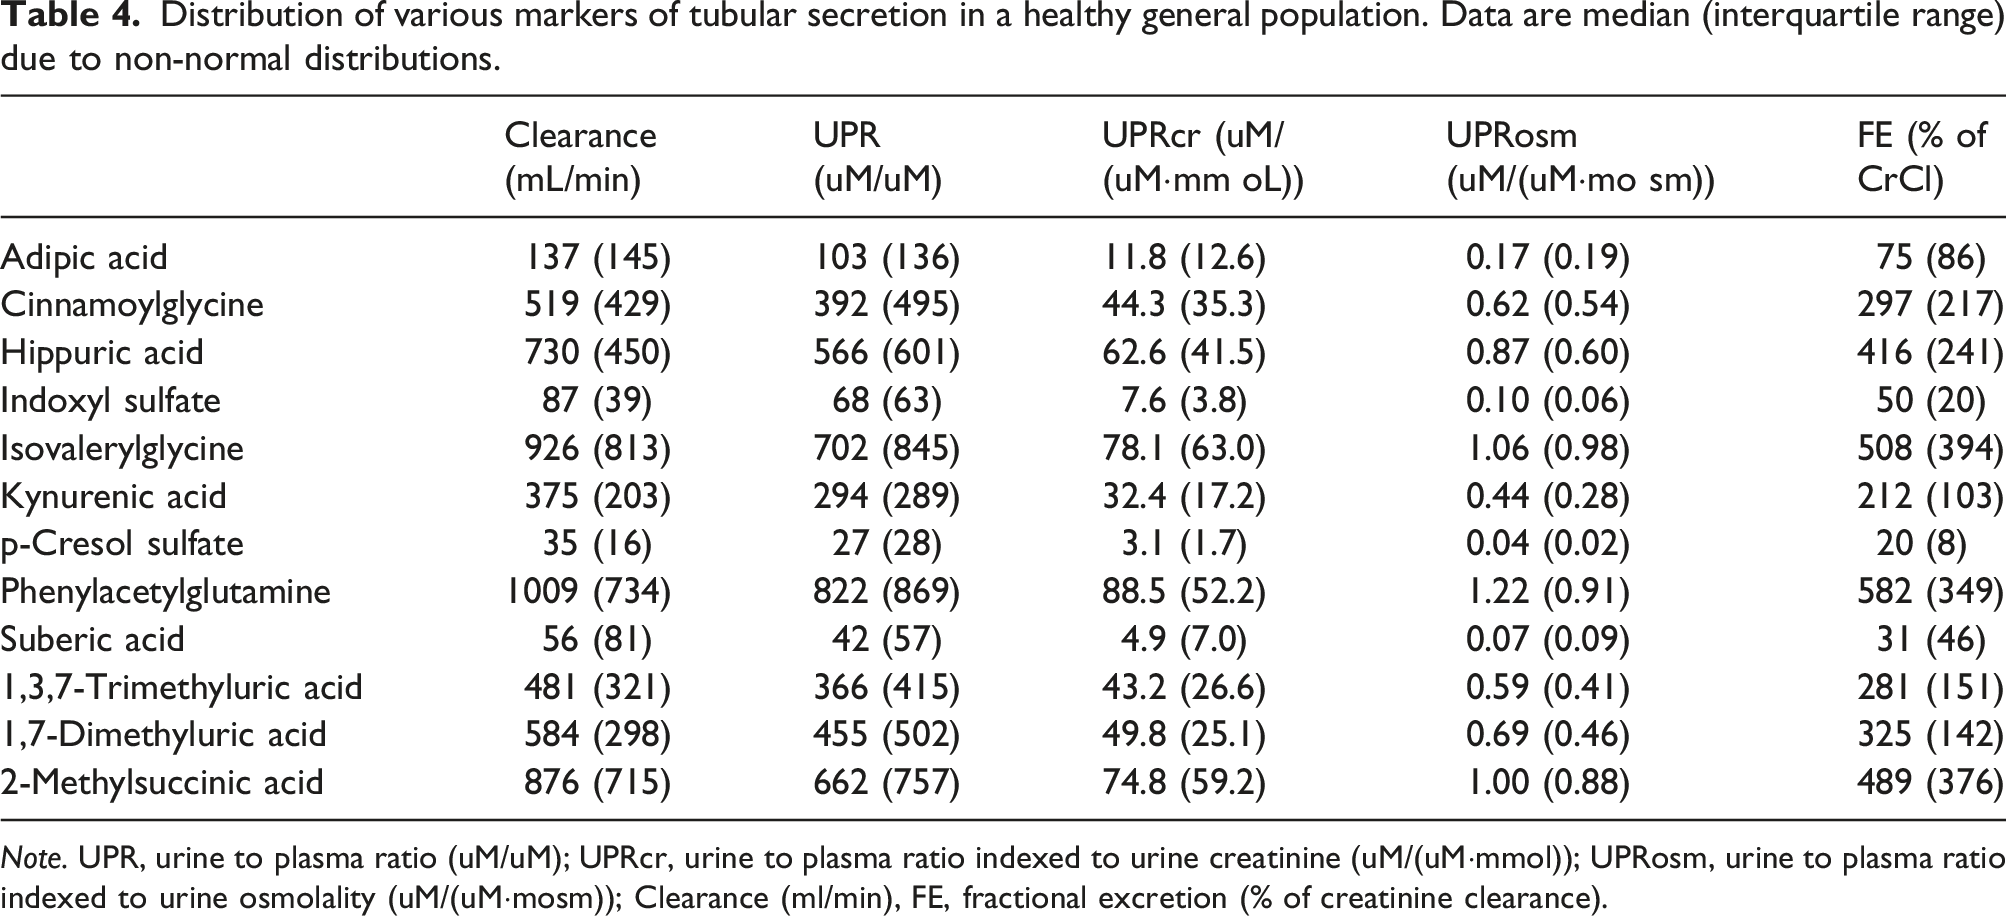
Note. UPR, urine to plasma ratio (uM/uM); UPRcr, urine to plasma ratio indexed to urine creatinine (uM/(uM·mmol)); UPRosm, urine to plasma ratio indexed to urine osmolality (uM/(uM·mosm)); Clearance (ml/min), FE, fractional excretion (% of creatinine clearance).
The need for partitioning of the reference interval was evaluated in all markers by assessing the proportion of subjects among those aged 18–50 and 50–86 years, and men versus women, falling outside of the upper or lower limits of a combined reference interval. None of the markers had proportions exceed 4% within subgroups of age or gender. Data for urine/plasma ratios indexed to creatinine and for estimated clearance of secretion markers are given in Supplemental Tables 3 and 4, respectively. Similar to raw UPRs, no subgroup (UPR indexed to osmolality, UPR not indexed, or Fractional Excretion) had >4% outside the reference ranges when secretion was assessed by these alternatives.
Reference intervals (2.5 to 97.5% of distribution) of markers of tubular secretion in a healthy general population.
Discussion
In this large population-based study of tubular secretion biomarkers among healthy Norwegian adults, we measured the levels of 12 markers of tubular secretion to provide normal reference intervals. Correlation between the 12 secretion markers differed substantially, and we therefore report relevant percentiles and suggested reference intervals for all measured markers. Partitioning of reference intervals by age and sex were not needed. With no universally accepted reporting method, we report the tubular markers expressed as clearance, fractional excretion, and urine/plasma ratios both unadjusted and indexed to urine creatinine and osmolality.
Urine measurement of secretion markers can be challenging, but our data were reasonably close to levels reported in healthy adults in the Human Metabolome Database (HMDB). 33 For 6 out of 12 markers (2-methylsuccinic acid, adipic acid, isovalerylglycine, suberic acid, kynurenic acid, and 1,3,7-trimethyluric acid), the agreement between urinary levels reported in HMDB and our analyses was excellent, with a discrepancy of less than 1 umol/mmol (Supplemental Table 3). Three markers (indoxyl sulfate, phenylacetylglutamine, and hippuric acid) had a fair agreement, while the HMDB either did not present any normal values in urine, or reported data from only one publication for the three remaining markers (cinnamoylglycine, p-cresol sulfate, and 1,7-dimethyluric acid). Currently, there is no analytical method or calibration universally agreed upon, and differences in absolute concentrations must be expected. For example, HMDB reported hippuric acid data from 11 different studies using at least four different methods (NMR, GC-MS, LC-MS, and HPLC) and their mean urine concentration ranged from 43 to 847 umol/mmol (473 in our study). However, we did not focus on absolute blood or urine concentrations, but rather on their relative levels within the individual, to provide an index of kidney tubule secretion in healthy subjects. In general, we find consistent and reasonably similar mean secretion levels compared to what has been published previously.16,34–37 The control groups used in these studies often do not qualify as healthy subjects for a reference interval study, and they do not report reference intervals. However, they support the analytical validity of our findings.
Given short-term fluctuations in urine tonicity due to hydration status and medications, any urine measurement needs to take urine tonicity into account. Indexing to (i.e., dividing by) urine osmolality or urine creatinine is one strategy to account for such dilution, and urine-albumin/creatinine is an example of this principle commonly used in clinical practice. Creatinine is an endogenous product freely filtered into the urine with a stable production, and its urine concentration will therefore reflect urine dilution. Given modest changes in urine creatinine by muscle mass (above and beyond urine tonicity), some experts hold indexing to urine osmolality as the best method to account for dilution, 38 but it is an expensive manual procedure so it is often not available. Other methods like fractional excretion also account for dilution by including urine creatinine, and clearance of a metabolite is based on measured or estimated urine volume per day. We provide fractional excretion data; however, this method is not commonly used in research studies because its calculation incorporates serum creatinine (a marker of glomerular function) and therefore confounds interpretation of tubule secretion. Often UPRs are used, and eGFR is adjusted as a separate covariate to separate the two parameters and allow interpretation of each independently. 24-h urine collections are rarely available in research settings, and patients often forget to collect all urine leading to substantial measurement error. 39 However, urine volume can be estimated rather accurately from age, sex, weight, plasma phosphate, and urine creatinine (bias <1% and >80% within +/− 30%). 29 Therefore, using the paired urine and plasma concentrations, tubular secretion can be expressed in several ways, each with its benefits and challenges, so we present data and reference intervals for all.
Kidney tubular secretion markers will have diagnostic, prognostic, and treatment related implications in the near future. Among them is its potential utility to improve drug dosing. Because only glomerular measures are available in contemporary clinical practice, creatinine-based GFR estimates are used to adjust doses of many common medications that are eliminated by secretion rather than glomerular filtration, even though the two kidney parameters are not tightly correlated. In the future, dosing of secreted medications with narrow therapeutic windows such as chemotherapeutics and oral anticoagulants may improve safety and efficacy of their use concurrently. Likewise, information on tubular health is increasingly recognized as important for evaluation of true kidney damage versus only hemodynamic induced eGFR changes, and tubular secretion is an important part of this evaluation. For example, current guidelines advocate more intensive blood pressure treatment to reduce CVD and mortality risk.40,41 Such treatments, based on ACE inhibitors, ATII blockers, SGLT2 inhibitors, and others, can lead to increased serum creatinine values in some patients, and clinicians then sometimes stop treatment in fear of damaging the kidneys. However, we have shown that this is most often a hemodynamic effect on GFR with no structural damaging effect on the nephron.42,43 Tubular health markers in such patients may illustrate this difference, and may assist clinicians in defining among which patients it may be safe to continue drug therapy despite increases in creatinine, or when there may be structural kidney damage where medications should be held. 44 However, the reference intervals presented in the current study seem to be very wide, so it remains to see how many diseased patients have values outside this range. The clinical validity of these reference intervals is not yet studied, and measures like diagnostic accuracy and benefits for treatment decisions should be studied.
We used LC-MS to measure tubular secretion since the method is known for high selectivity, sensitivity, and specificity, even at low levels of target analytes in complex matrices. Although the development and validation of a new LC-MS bioassay can be a complex and demanding process, our method was rather straightforward and easy to establish. We achieved CVs ranging 4–9%, which is well within the 15–20% limit set in recent recommendations from the U.S. Food and Drug Administration. 45 However, even as LC-MS has become more commonly used in clinical practice at hospital laboratories, for example, for screening for medication toxicity and therapeutic drug monitoring, it requires expensive instruments and expertise.
The major strengths of our study are the use of a large sample of healthy individuals for the analyses, inclusion of several biomarkers in our panel, a high quality LC-MS method with an adequate quality control system and low CV, and rigorous methods for data analyses and construction of reference intervals.
This study has important limitations. There are no internationally recognized standard materials available for calibrating LC-MS methods for tubular secretion markers. Differences in absolute concentrations can therefore occur between laboratories. While this is a particular limitation for absolute blood and urine concentrations, this limitation is likely mitigated when measured in parallel using the same method and developing urine/plasma ratios as an index of kidney handling of the metabolites. There can also be differences between healthy populations from different regions. We were able to include many participants with extensive medical history, clinical, and laboratory information so that we could select a healthy study group with very low risk for the clinical problem studied (CKD). However, all our participants are adults, Caucasian, and from a single region. Future studies are required to determine reference ranges in children, persons of other race/ethnicities, and from different regions where diet and other factors may differ.
In conclusion, we describe urine and plasma levels of endogenous tubular secretory markers among healthy adults in Norway. We report clearance, fractional excretion, and urine to plasma ratios of both unadjusted values and values indexed for urine osmolality and urine creatinine concentrations. Based on measurements in this predominantly Caucasian healthy population, we suggest tubular secretion marker reference intervals for healthy individuals.
Supplemental material
Supplemental material - Reference intervals for kidney tubular secretion markers in the general population: The HUNT3 study
Supplemental material for Reference intervals for kidney tubular secretion markers in the general population: The HUNT3 study by Marius A Øvrehus, Kåre A Kristiansen, Knut AR Langlo, Pranav S Garimella, Joachim H Ix, Michael G Shlipak, Per Bruheim, and Stein I Hallan in Annals of Clinical Biochemistry.
Footnotes
Acknowledgements
We would like to thank all laboratory personnel at the collaborating hospitals and at BioBank1 and HUNT Lab., and their funders, NTNU and the Mid-Norway Regional Health Authority. Their professional work has been of crucial importance for the establishment of NorKiBB. We also thank all nurses and secretaries who have helped with inclusion of patients and blood and urine sampling as well as the heads of all departments involved for providing support and allocating resources to this work.
Funding
The authors disclosed receipt of the following financial support for the research, authorship, and/or publication of this article: The project was part of the project “Kidney Tubular Damage and Dysfunction Identify a Novel Axis of Chronic Kidney Disease.” This is a joint US–Norwegian project funded by the U.S. National Institute of Health (grant number 2R01DK098234) and the Norwegian Research Council (grant number 295814).
Declaration of conflicting interests
The authors declared no potential conflicts of interest with respect to the research, authorship, and/or publication of this article.
Ethical approval
The project was approved by the Regional Committee for Medical Research Ethics Central Norway. All patients gave written, informed consent.
Contributorship
MAØ, SH conceived of the idea for the paper; MAØ, KARL, SH, contributed to the design; all authors to the implementation of the study; MAØ, SH to the analysis of the results. All authors contributed to the writing of the manuscript.
Guarantor
The Norwegian University of Science and Technology.
Supplemental material
Supplemental material for this article is available online.
References
Supplementary Material
Please find the following supplemental material available below.
For Open Access articles published under a Creative Commons License, all supplemental material carries the same license as the article it is associated with.
For non-Open Access articles published, all supplemental material carries a non-exclusive license, and permission requests for re-use of supplemental material or any part of supplemental material shall be sent directly to the copyright owner as specified in the copyright notice associated with the article.